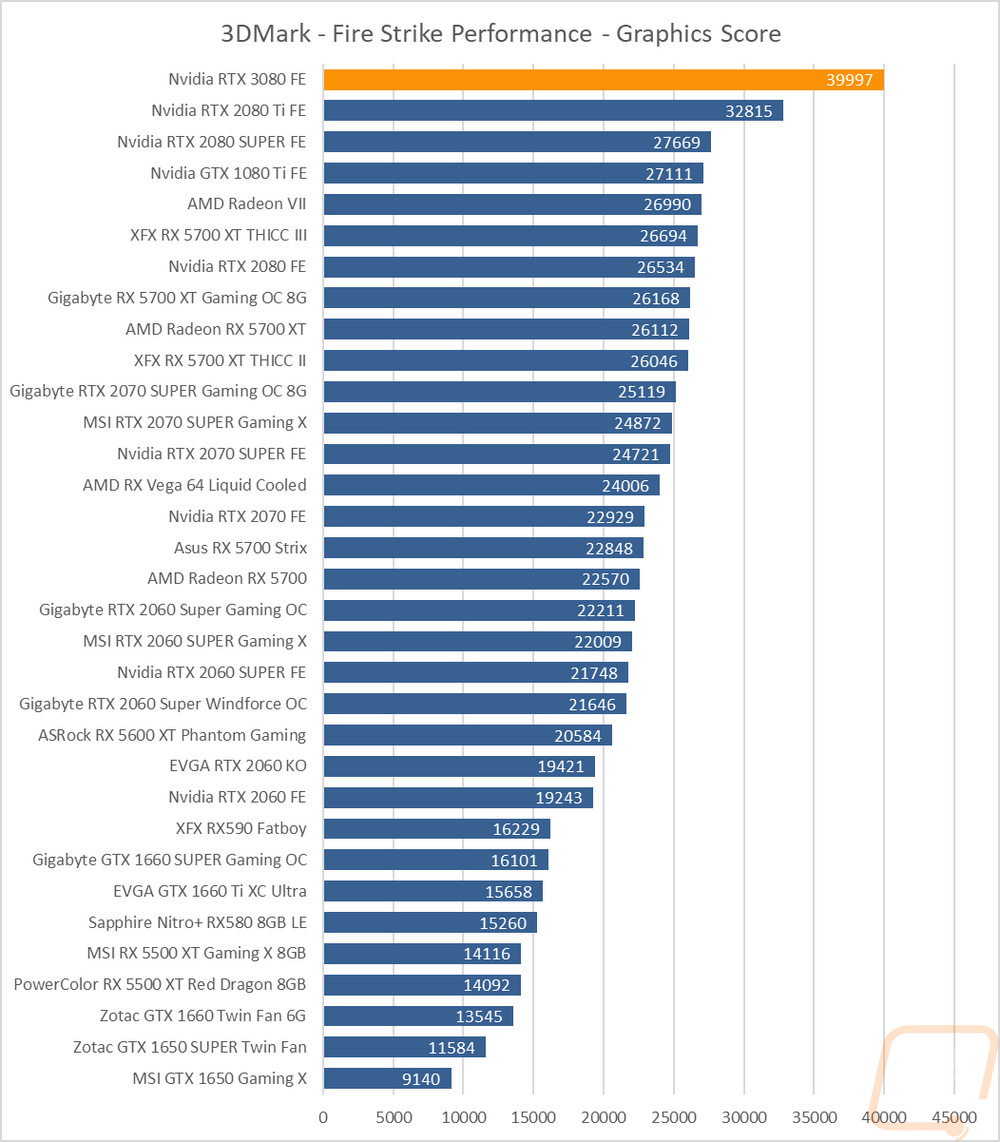
Synthetic Benchmarks
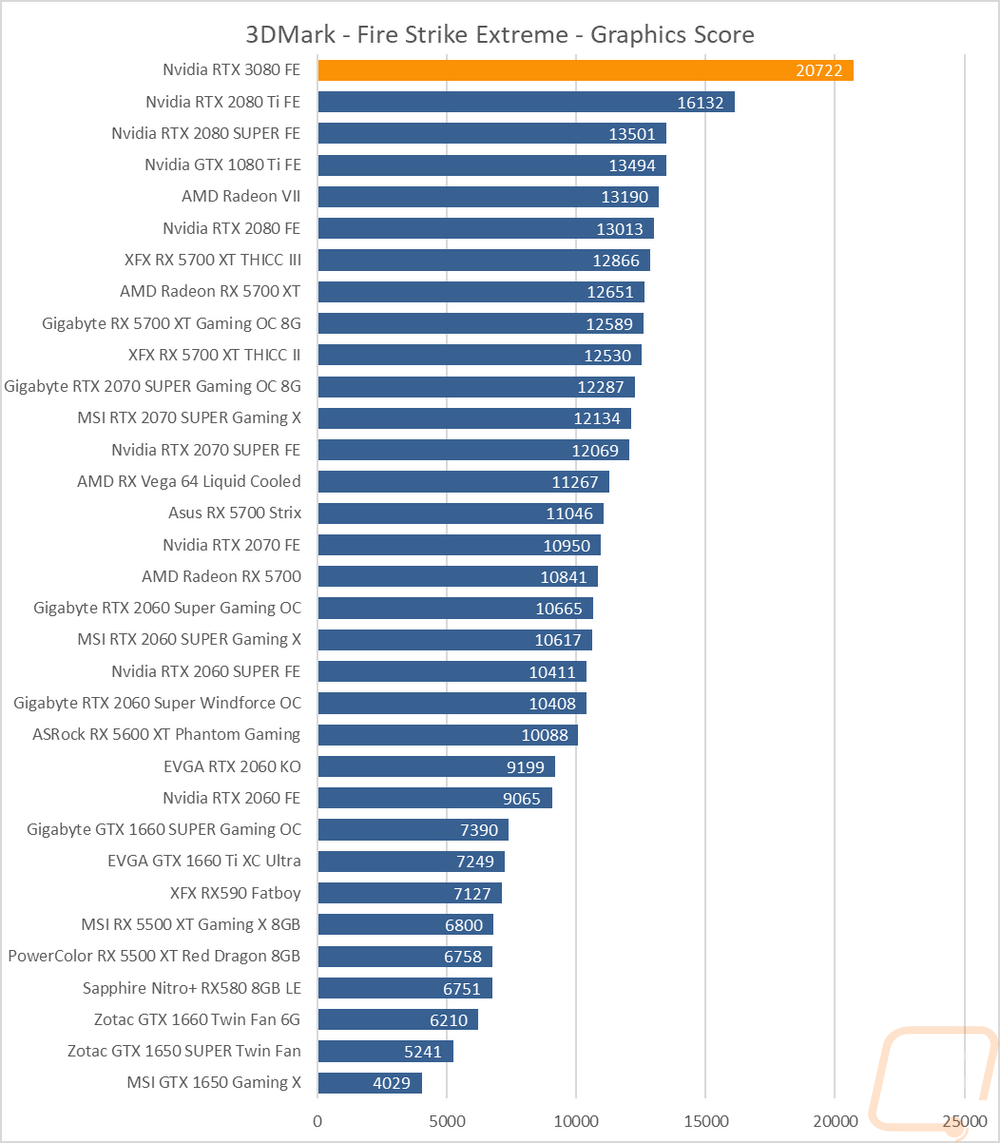
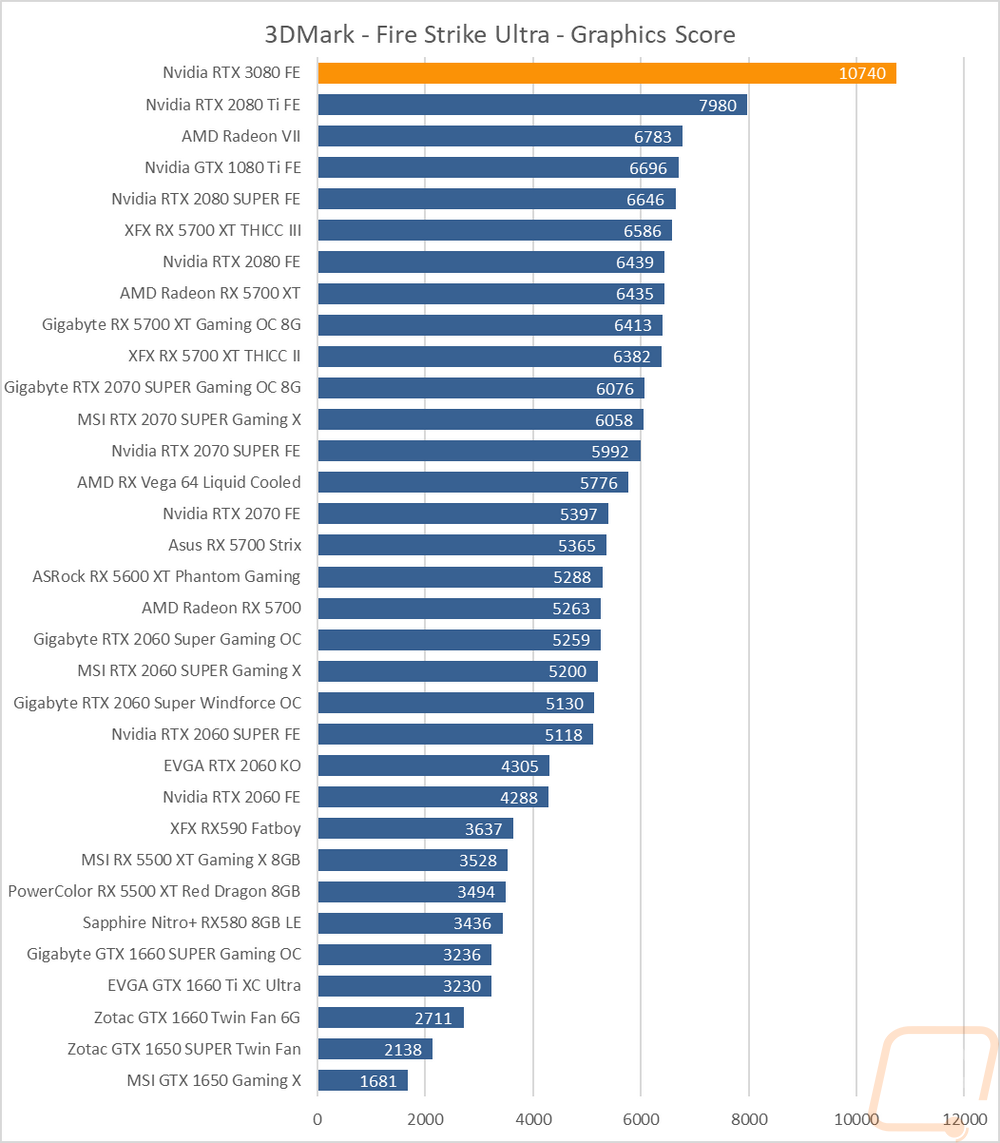
As always I like to start my testing with a few synthetic benchmarks. 3DMark especially is one of my favorites because it is very optimized in both Nvidia and AMD drivers. It's nice to not have to worry about it being favored too much either way and the repeatability of the results makes it a nice chance to compare from card to card. It also gives us our first looks at the performance of the RTX 3080 and Ampere as a whole. It isn’t a surprise that the RTX 3080 is at the top of the charts in all three of the Fire Strike tests, but the gap between it and the other cards is a surprise. For my testing, along with including our past testing I went through and retested the GTX 1080 Ti as well so I could have its results alongside the 2080 SUPER, RTX 2080 Ti, and the RTX 3080 which are the cards I feel are the most important to compare. The 1080 Ti is important because I feel a lot of its owners who wanted the biggest and best back then are now looking to see what is available now that pricing is a little better and the performance gap is larger. The 1080 Ti is of course right with the 2080 SUPER but with it getting 6696 vs 10740 in the Fire Strike Ultra test you can see just how big the gap is now.
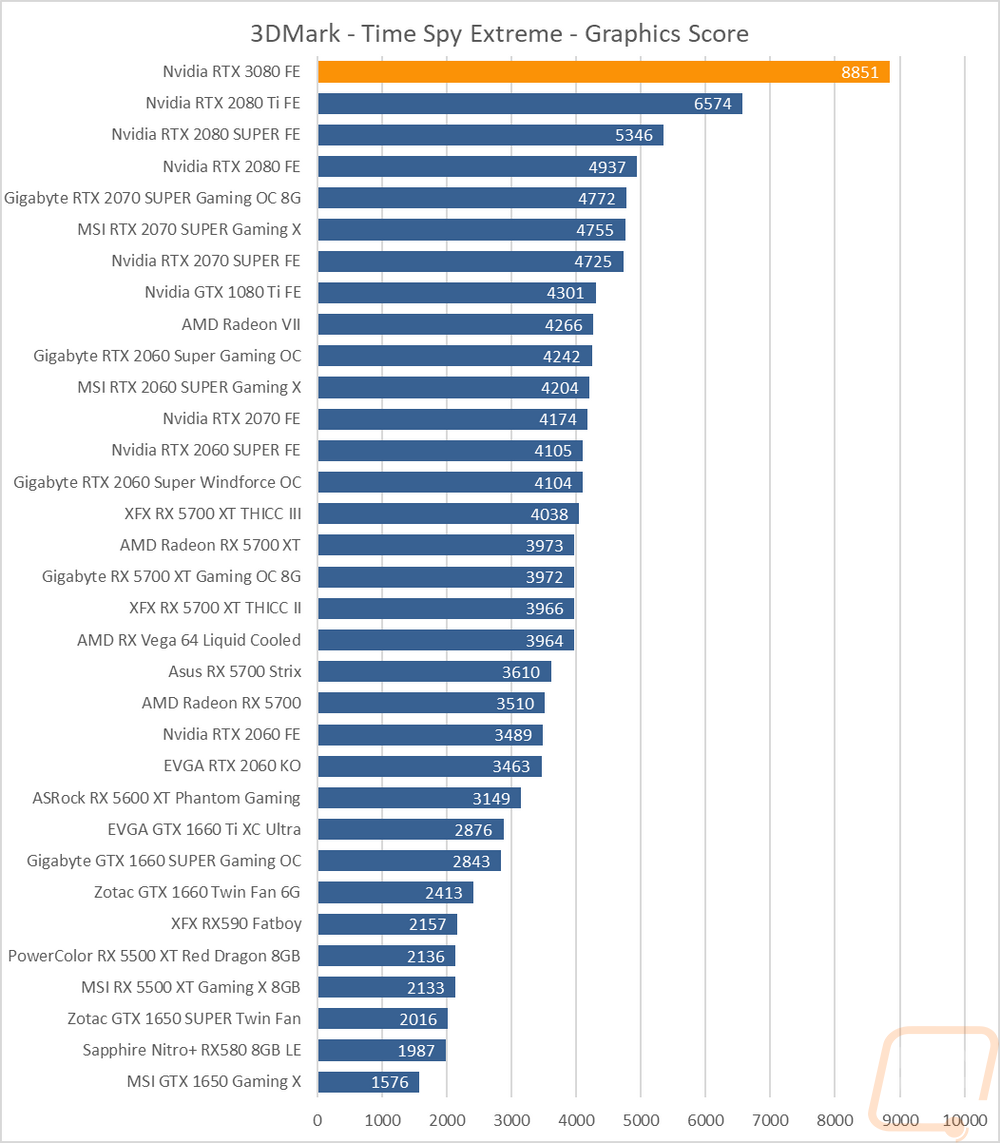
Now Time Spy is another 3DMark test, but this time it tests DX12 which the RTX cards have been known to be a lot better with. The GTX 1080 Ti drops way behind here with even the RTX 2070 out ahead. But the RTX 3080 is once again just in its own world compared to even the 2080 Ti.

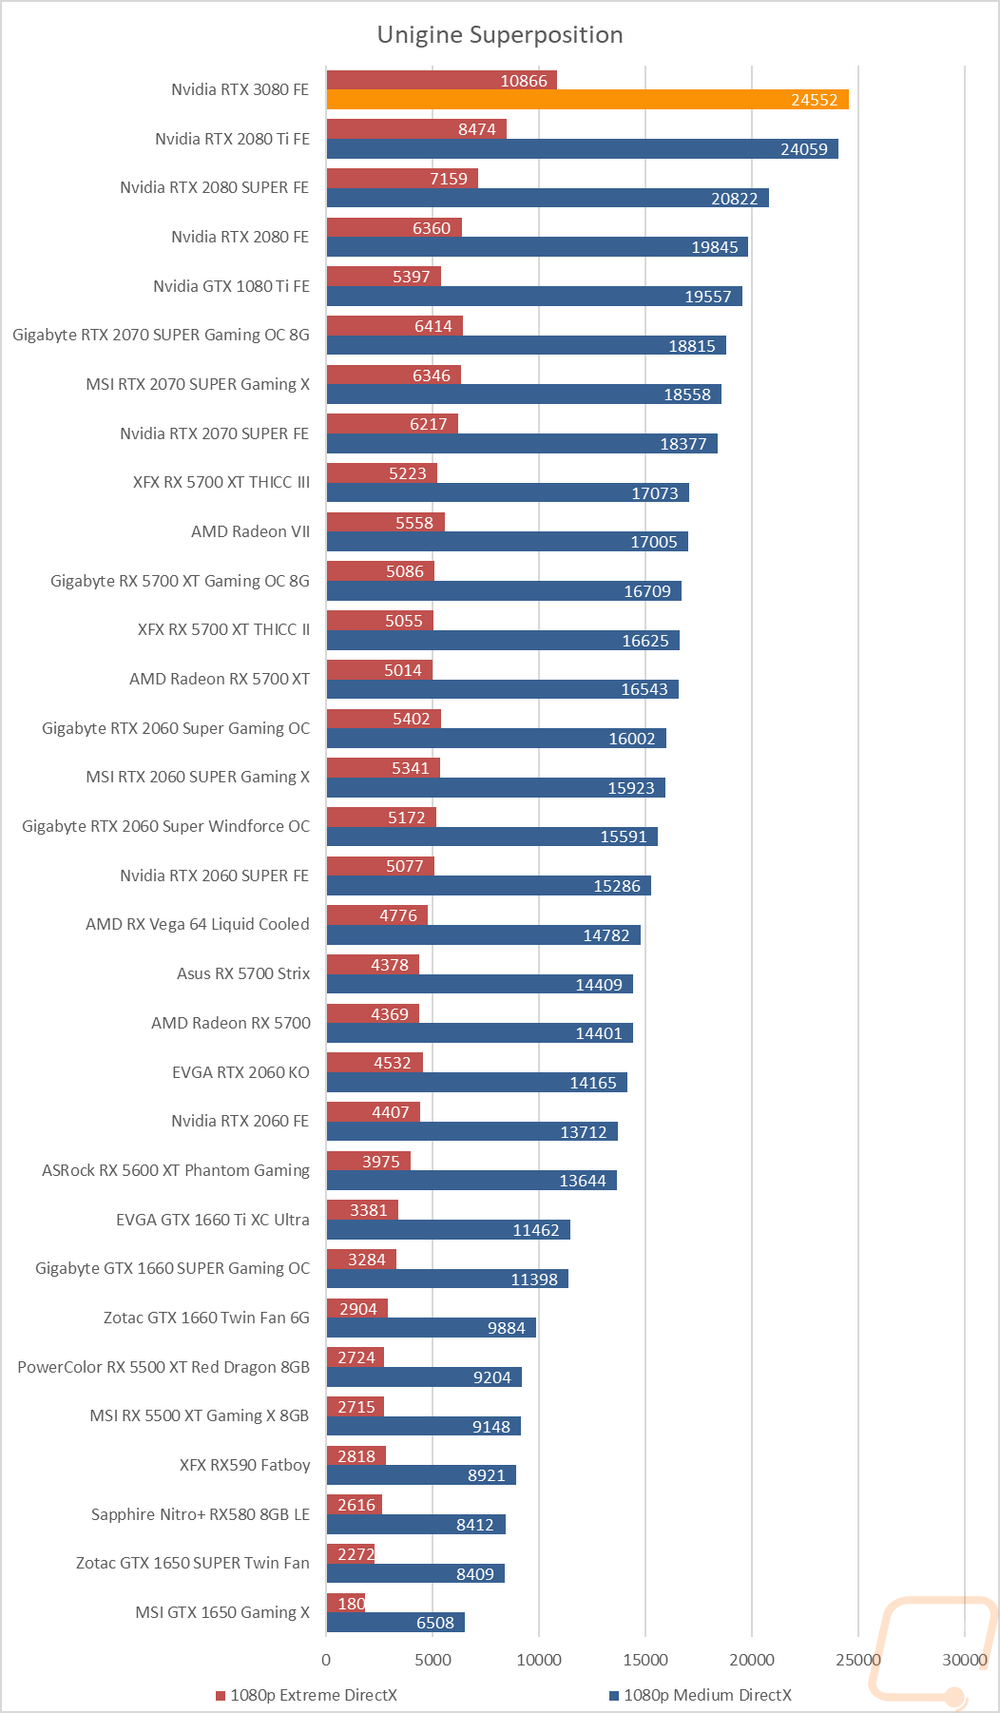
My last synthetic tests were using the Unigine based superposition benchmark. Specifically, the 1080 medium and extreme tests which the medium test isn’t designed for these higher-end cards. You can see that we start to see no gap between the highest-end cards but with the extreme results again the 3080 is just in its own world ahead of the 2080 Ti and almost exactly double the score of the GTX 1080 Ti.