Cooling, Noise, and Power
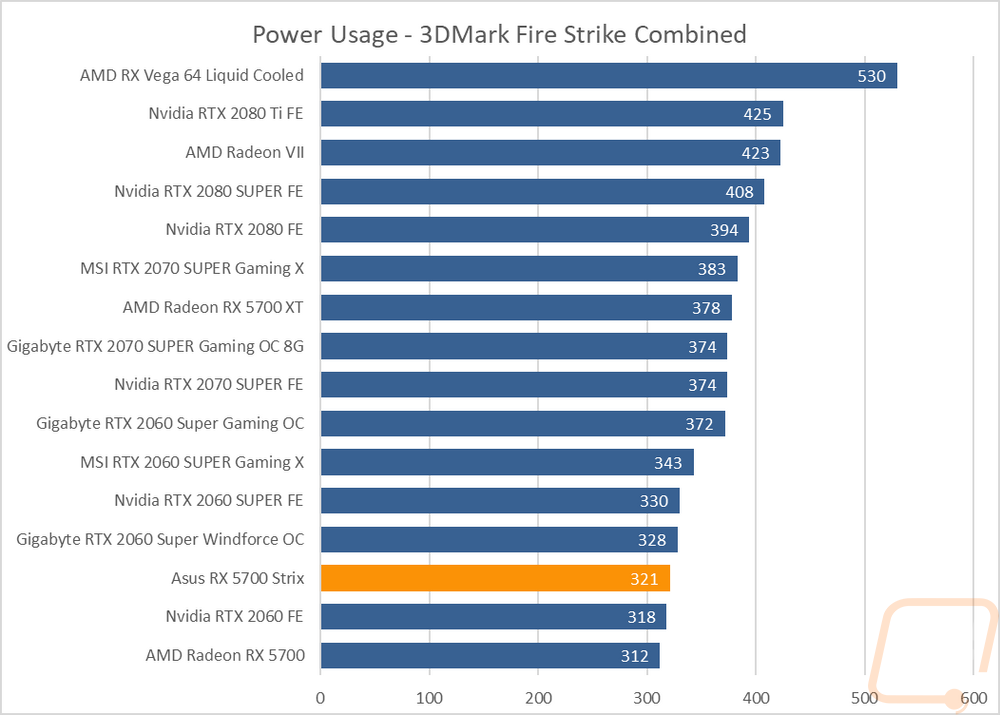
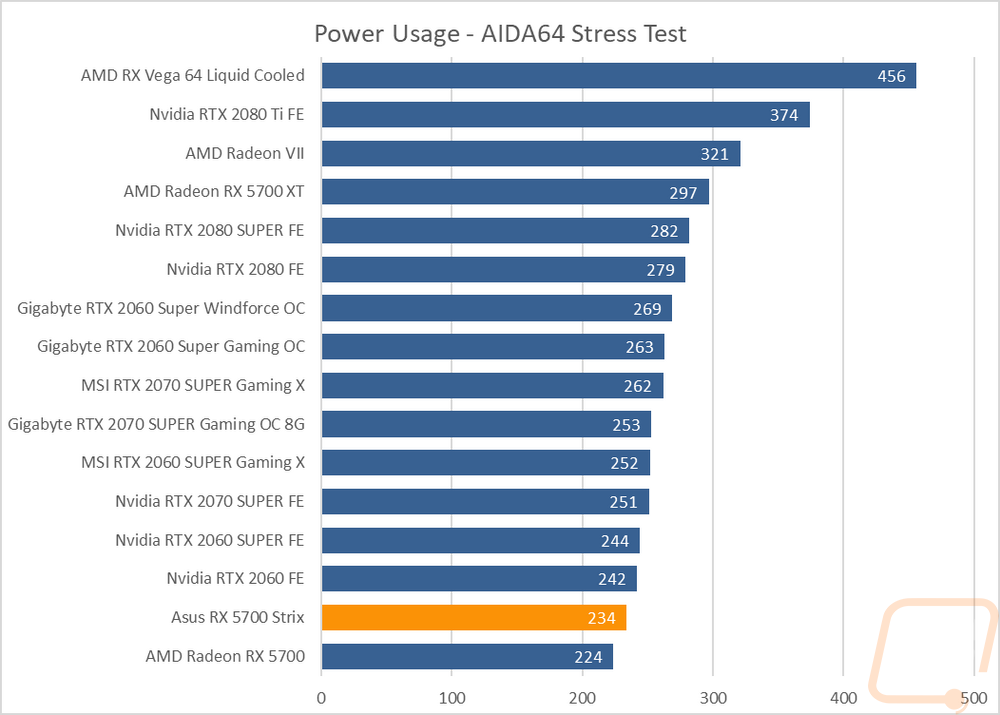
My last round of testing is also one of the most important when you have already decided which GPU you want and you are comparing between different models available. Obviously overclocks make a difference as well, but cooler design and how the card is overclocked plays a big role in temperatures, noise levels for the fans, and power usage. So here I’m going to take a look at those aspects. First, though I wanted to check out the power usage. For this, I ran two tests. On both, I monitored the power usage of our test system using a Kill-A-Watt. To put things under load I first use 3DMark to replicate a gaming load on both the CPU and GPU. For the 3DMark test the Asus RX 5700 Strix does pull a little more power than the reference card, 9 watts to be specific. This pushed it up over the RTX 2060 FE for power usage and closer to the RTX 2060 SUPER but overall this is still down at the bottom part of the chart. The AIDA64 test was similarly near the bottom. This time it pulled 10 watts more than the reference RX 5700 but this still kept it below the RTX 2060 by 8 watts making the RX 5700 Strix, while pulling more than the reference card, still power efficient.
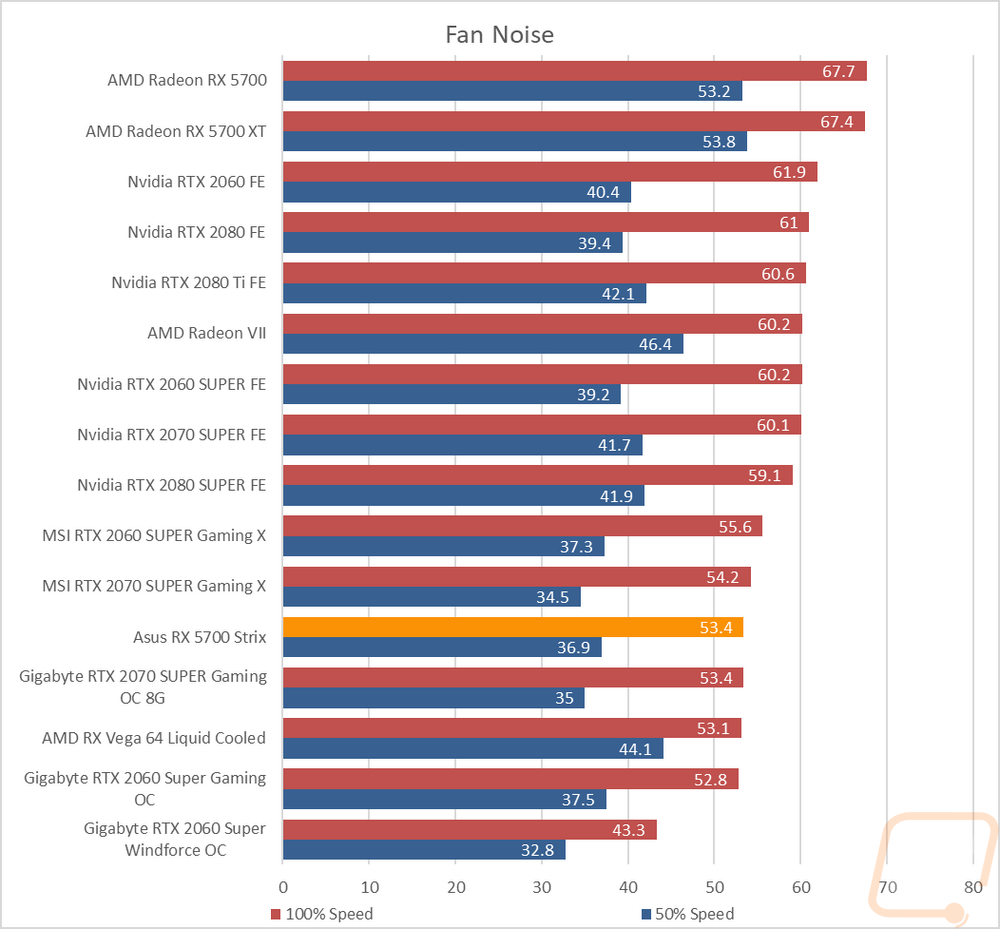
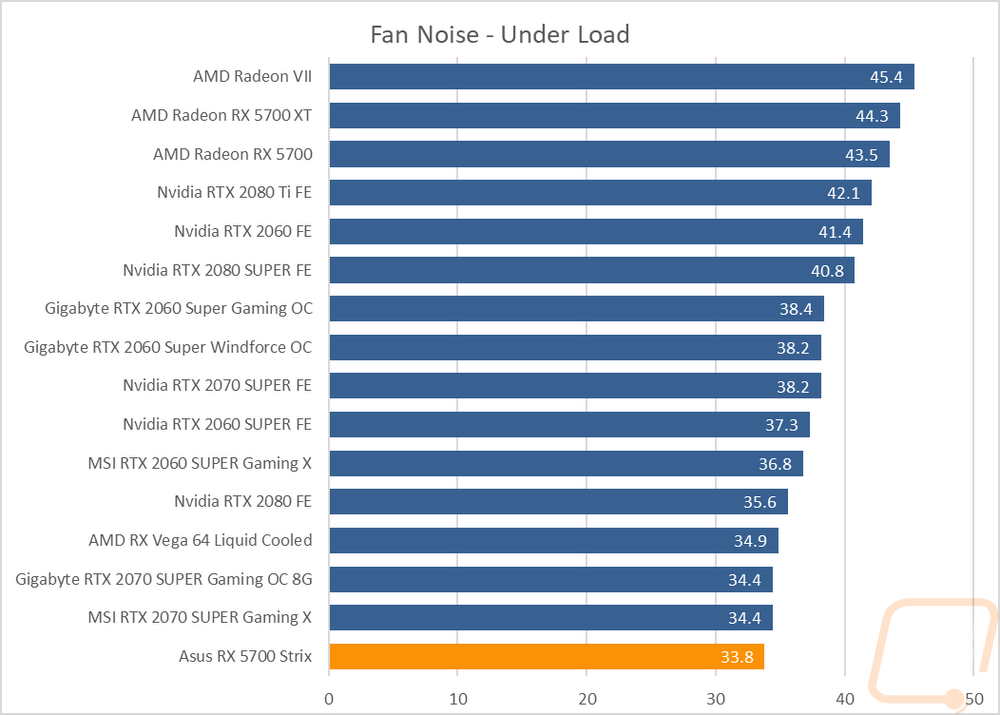
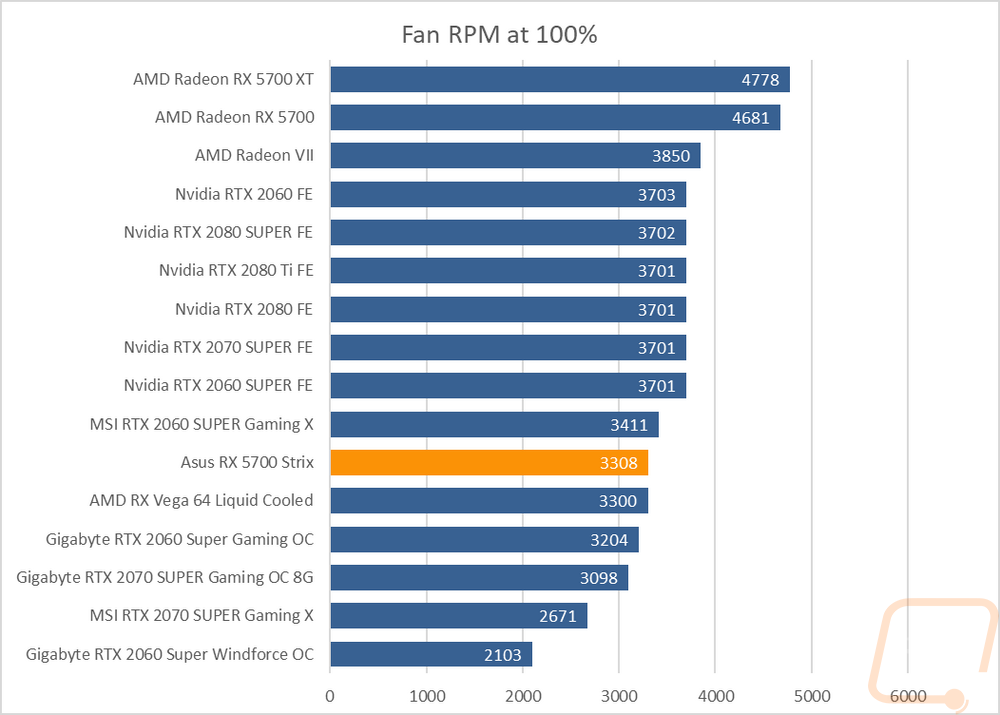
Next, I wanted to check out how the dual fan design did for noise. I set up our decibel meter 18 inches away from the test bench and took a look at a few different things. For baselines I ran tests at 50% and 100% fan speed where we can see the noise range of the cooler in general. The Strix cooler did well maxing out at 53.4 decibels which is a huge improvement over the reference card that sits at the top of the noise charts. 50% was even better at 36.9 decibels, compared again with the reference card which was 53.2! Now there are a few cards that were still quieter, but in this case the huge swing from the reference to the Strix cooler in noise levels is amazing. This is partially seen in the fan RPM chart where you can see Asus only needed to spin the three fans at 3308 RPM. The most important test is the under load test and for this one I test the fan noise while I’m doing thermal testing. This has the card under the AIDA64 Stress Test for over a half-hour where the temperatures level off, this is the loudest I expect the card to get in use without more of an overclock and the RX 5700 came in at the bottom of the charts as the quietest card tested. Talk about a redemption story, the reference card is 10 decibels louder and all the way at the top of the chart.
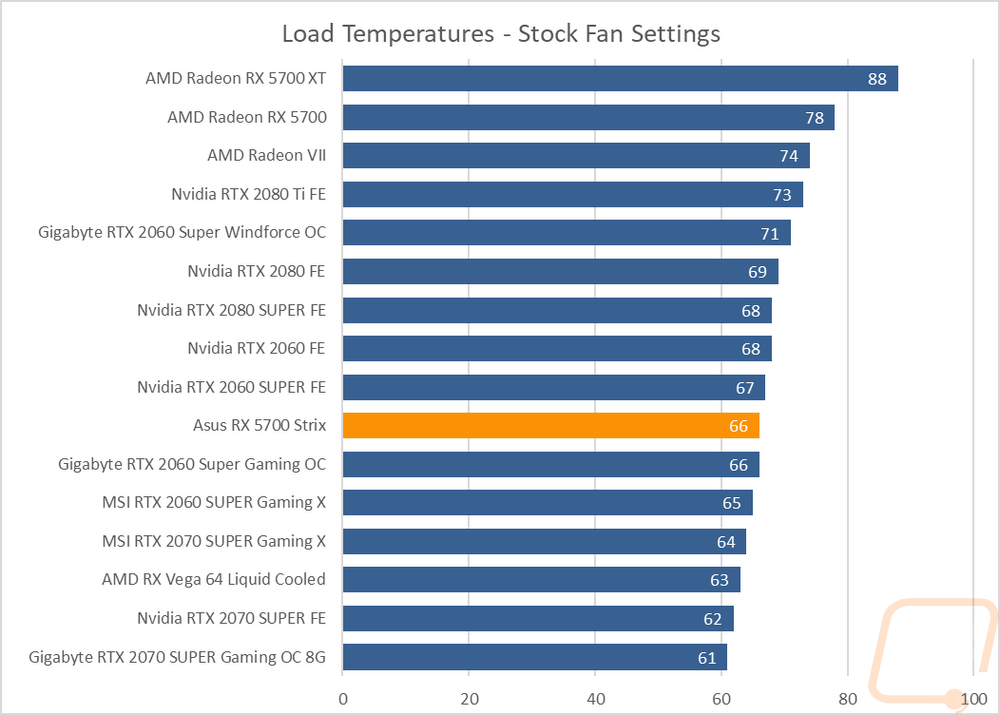
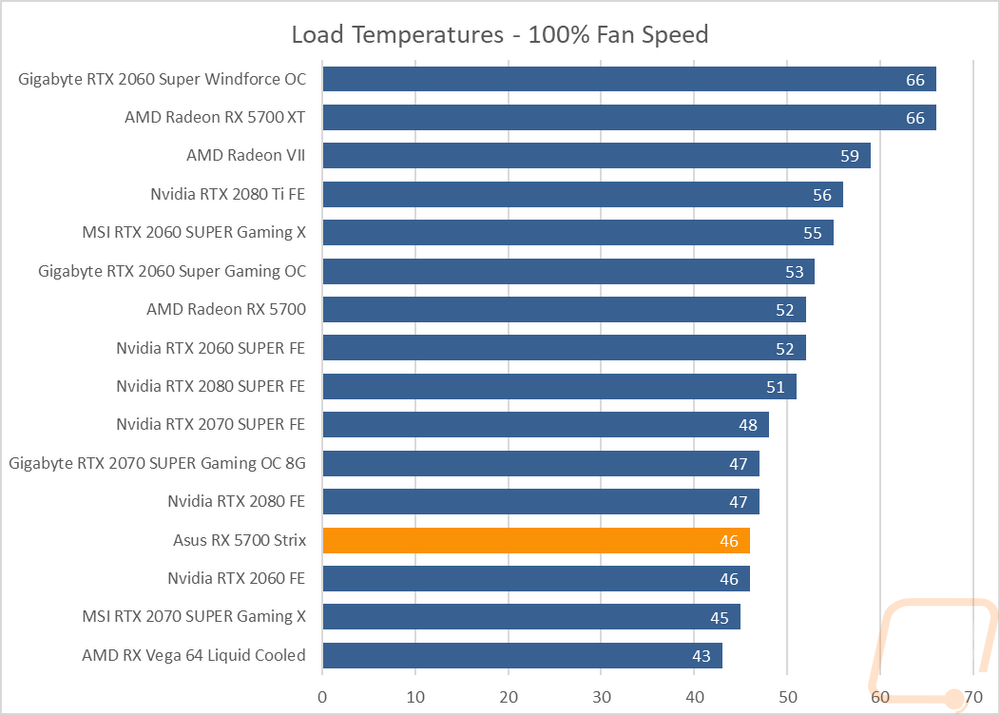
My last batch of testing was thermal testing. For this I use AIDA64’s Stress Test to put the card under a heavy load. I run this for a full half-hour or longer waiting for the temperatures to level off completely. I then document the peak temperatures. I do this twice, once with the stock fan profile and then again with the three fans turned up to 100%. The idea is to see out of box performance and then to check to see how much headroom is left in the cooler. Not that I would want to run any card at 100% fan speed all of the time, the noise would drive me crazy. But a more aggressive fan profile could be used. Anyhow the RX 5700 Strix came in at 66 degrees with the stock fan profile. This is 12 degrees lower than the reference card, which is huge. This is right with or just above all of the aftermarket RTX 2060 SUPERs. At 100% fan speed on the other hand the RX 5700 Strix dropped down closer to the bottom of the chart with 46 degrees which gives the cooler a delta of 20 degree’s which shows there is still a lot of room left in the cooler if you would want to run any lower on temps or for overclocking.
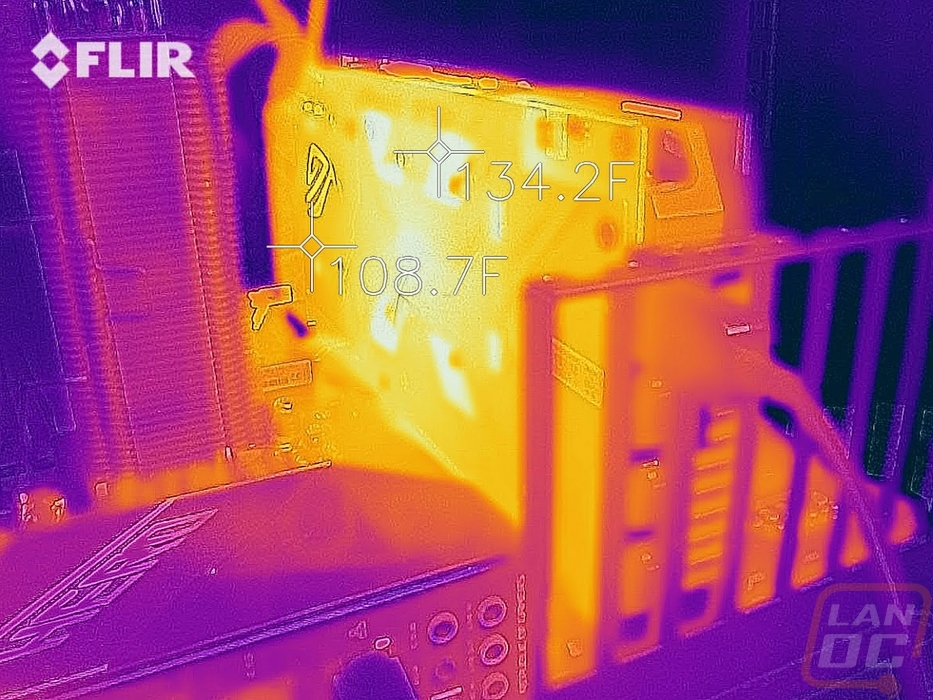
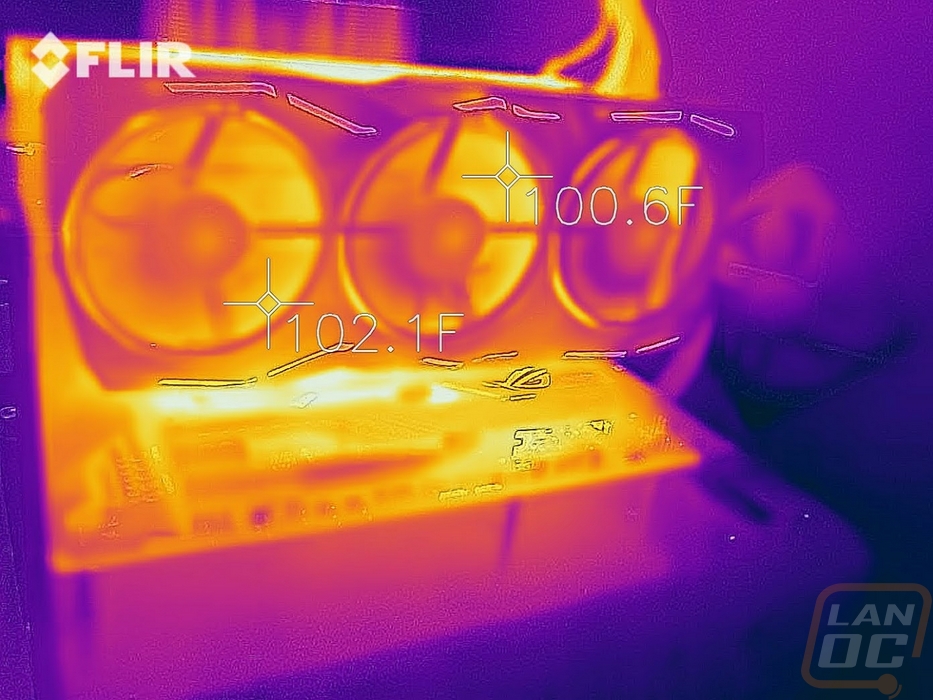
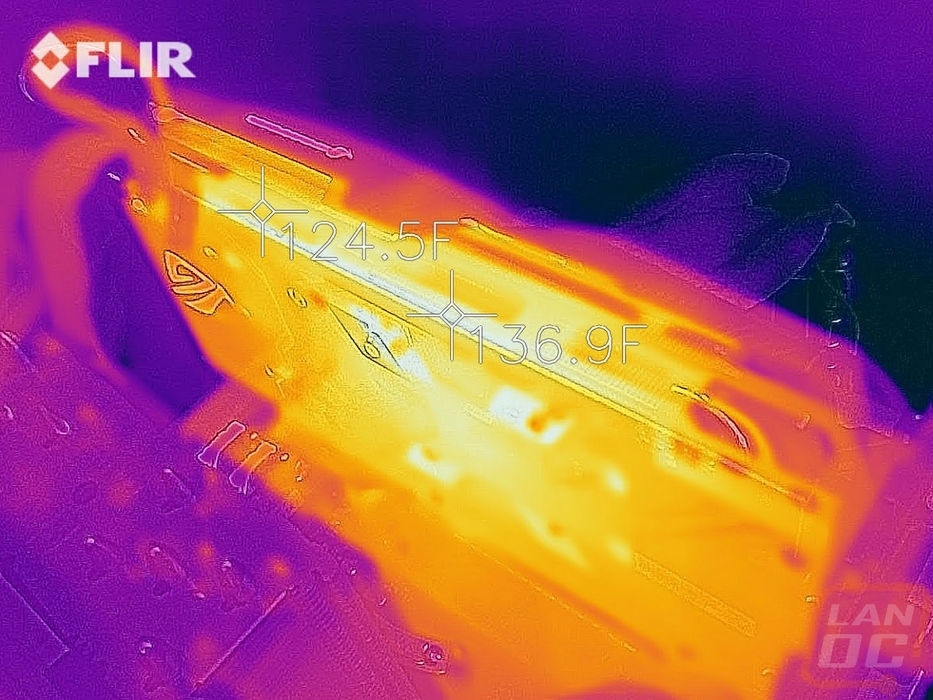
While doing thermal testing with the stock fan profile I also pulled out the Flir to get photos of the Strix as well. I’m just looking for any weird hotspots. Now on the back the four exposed areas of the PCB do show a big difference between the PCB and the backplate. Then up on top, you can see how the heatsink is doing a good job spreading the heat across the cooler. Behind the fans things are mostly consistent with the far right fan running the coolest. That view also shows how the airflow up out of the top and bottom of the card does push air up under the card and create a hot spot so keep that in mind when picking where you put your M.2 drives.