Overall Synthetic Benchmarks
It’s always a debate as to how accurate are synthetic benchmarks are compared to the performance you will see when using your GPU/CPU. The reason we continue to use them isn’t because of how they compare to real world results, it’s how consistent they can be. I could run through a map in any game 100 times and never get the same result twice, sometimes seeing large differences between results. If you look down at the ground to much or up at the sky you can change the results considerably. Synthetic benchmarks never deviate or miss a beat in their testing. They may not be a perfect representation of what you will see in real life but you be able to see a difference in performance, even in cases where the differences are very small. For our Synthetic benchmarking we use Futurmarks 3DMark and PCMark catalog using both last year’s version and the most recent.
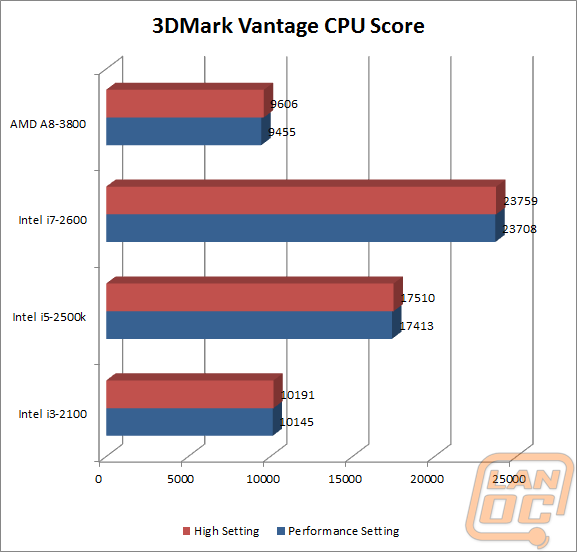
Our scores in 3DMark Vantage show a small gap between the i3-2100 and the A8-3800 with the i3 slightly ahead. This is mirrored in both our testing in High and performance settings.
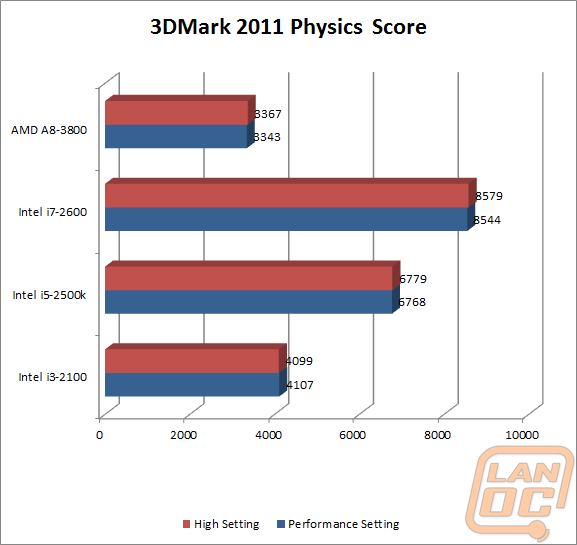
In 3DMark 2011 we saw similar results with the gap between the A8 and i3 being a little more pronounced.
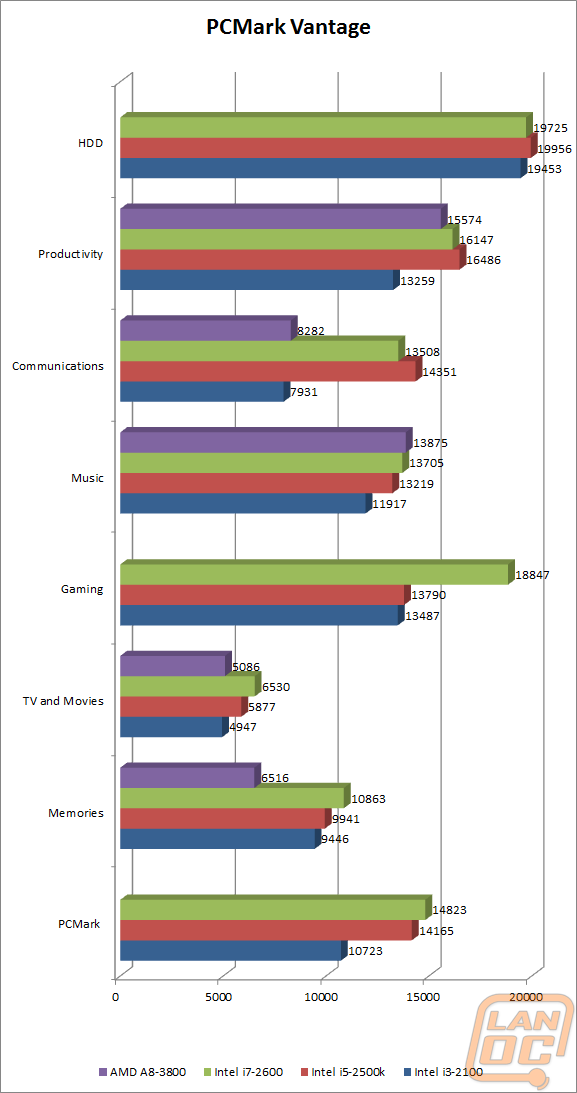
Our PCMark Vantage results have a few gaps in them due to the lack of SLI support and also because of a difference in SSD’s used on the two test benches. In the other results we saw the A8 pull ahead of all the Sandy Bridge offers in music performance and came close in the productivity testing. Other results show similar performance to the i3-2100 other than an abysmal showing in the memory benchmark.
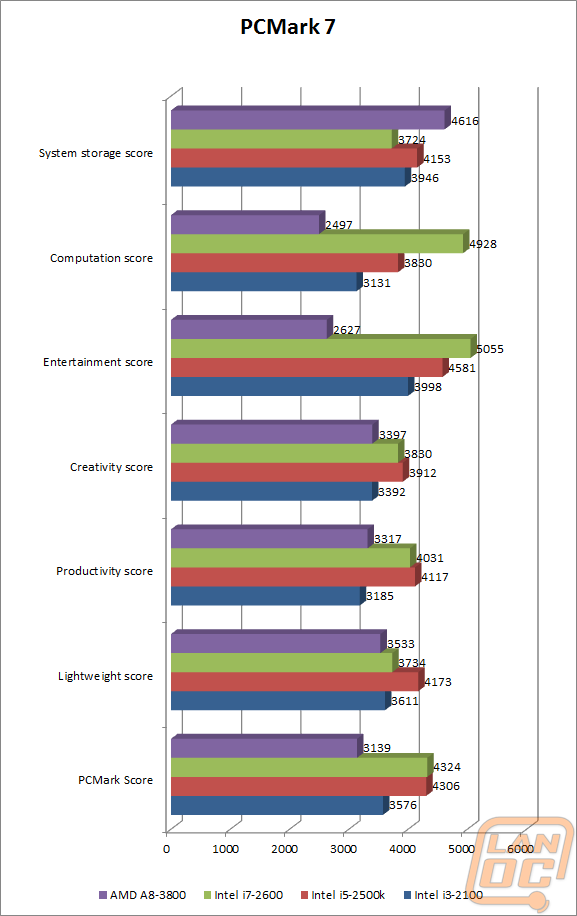
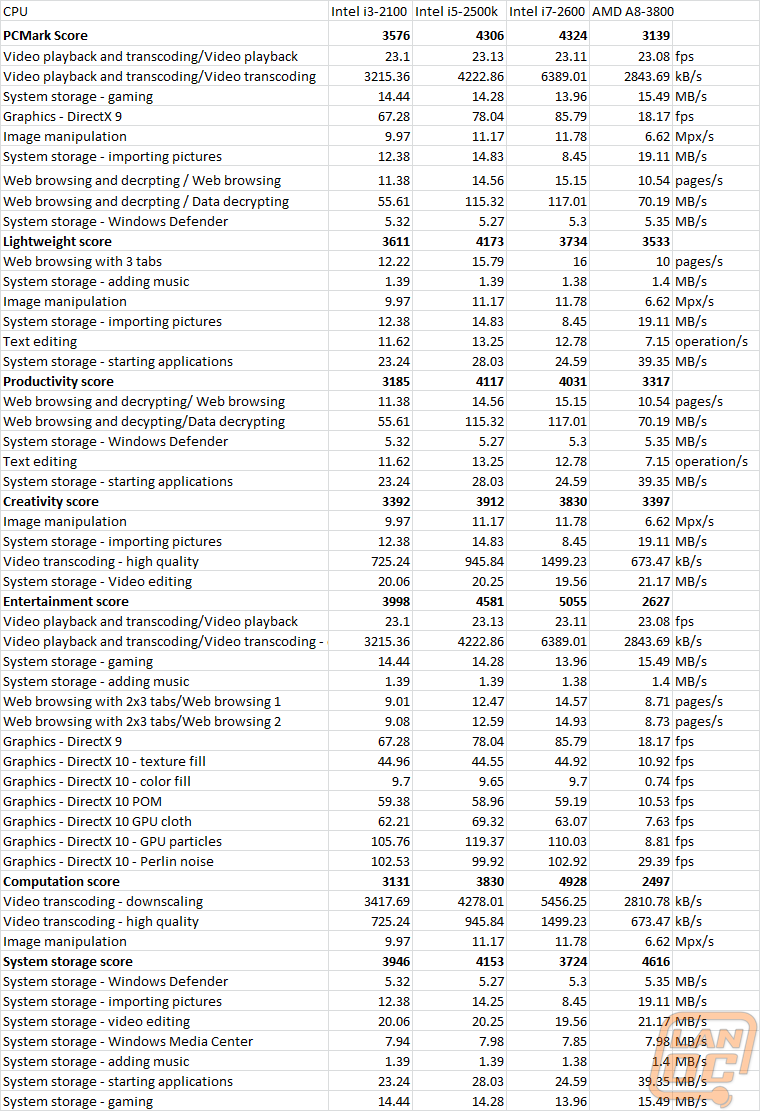
The same problem we had with PCMark Vantage was also an issue with PCMark 7. Storage and Entertainment scores do not match up with what to expect because of differing equipment. All of the other tests put the A8-3800 on par with the i3-2100.