Cooling Noise and Power
For my last few tests, rather than focusing on in game performance, I like to check out other aspects of video card performance. These are also the most important ways to differentiate the performance between cards that have the same GPU. To start things off I took a look at power usage.
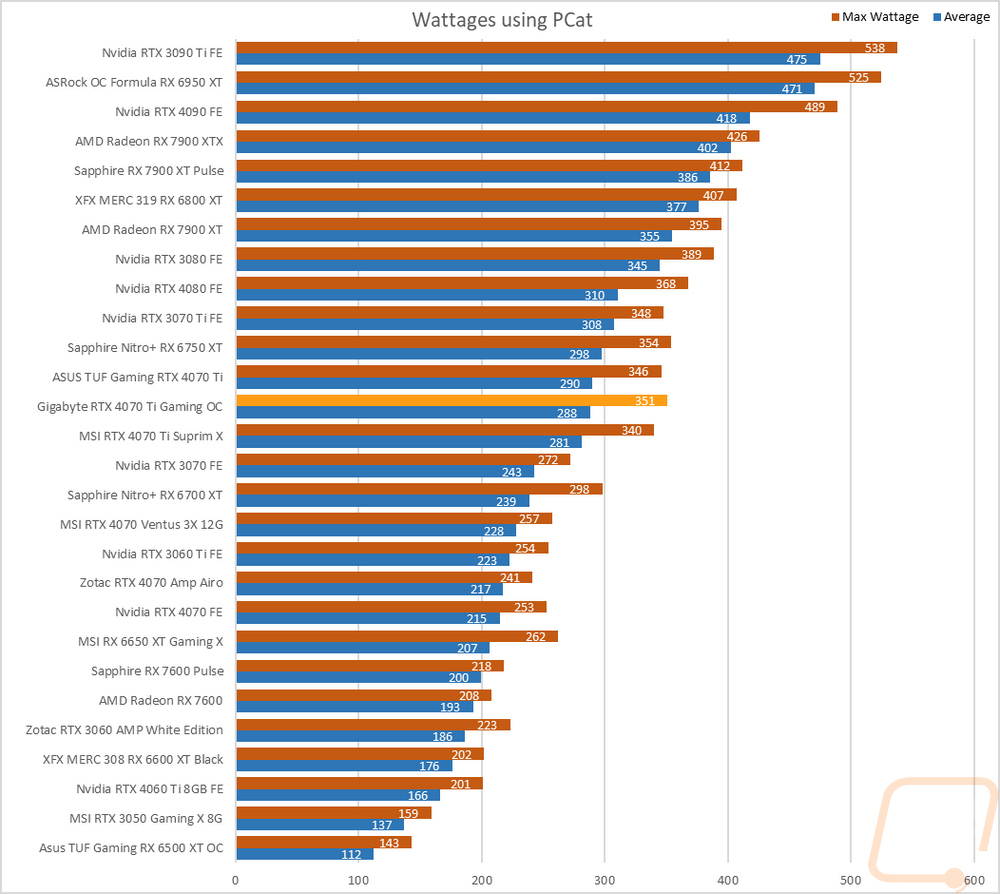
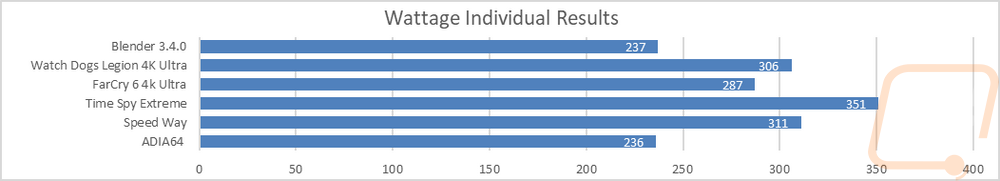
For this, our new test setup utilizes the Nvidia-designed PCat v2 along with cables to handle both traditional 6 or 8-pin connections as well as the new 12VHPWR. The PCat also utilizes a PCIe adapter to measure any power going to the card through the PCIe slot so we can measure the video card wattage exclusively, not the entire system as we have done in the past. I test with a mix of applications to get both in game, synthetic benchmarks, and other workloads like Blender and AIDA64. Then everything is averaged together for our result. I also have the individual results for this specific card and I document the peak wattage result as well which is almost always Time Spy Extreme. The Gigabyte RTX 4070 Ti Gaming OC averaged 288 watts which is what this graph is sorted by putting it 2 watts below the stock clocked TUF card and 7 watts above the Suprim X but its peak wattage was higher at 351 watts than either card.
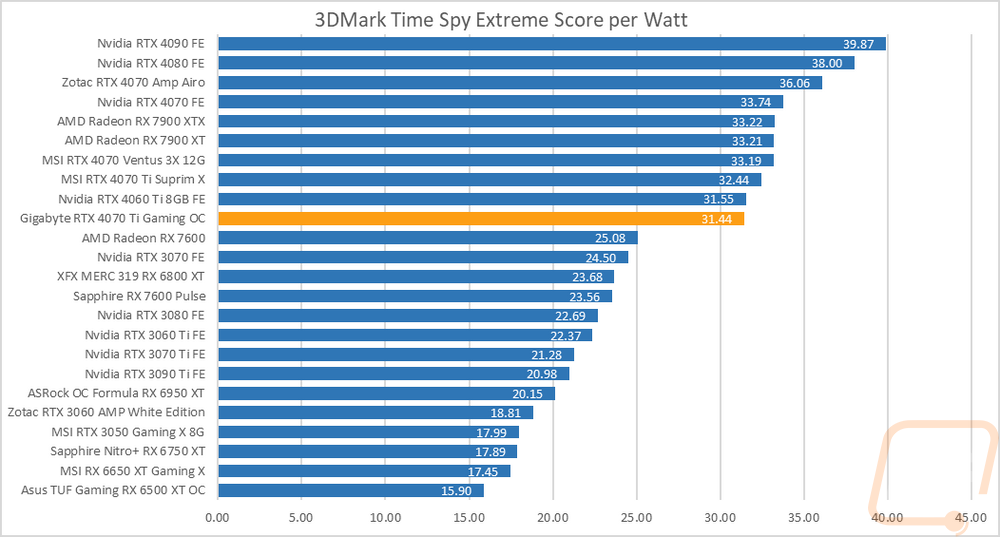
With having exact peak wattage numbers when running Time Spy Extreme I was also able to put together a graph showing the total score for each watt that a card draws which gives us an interesting look at overall power efficiency in the popular and demanding benchmark. The Gigabyte RTX 4070 Ti Gaming OC lands at 31.44 points per watt, this is because of the higher power usage during the Time Spy Extreme test, putting it down just below the new RTX 4060 Ti FE with Suprim X being a lot more efficient, but the Gigabyte RTX 4070 Ti Gaming OC is still WAY ahead of any of the last generation cards.
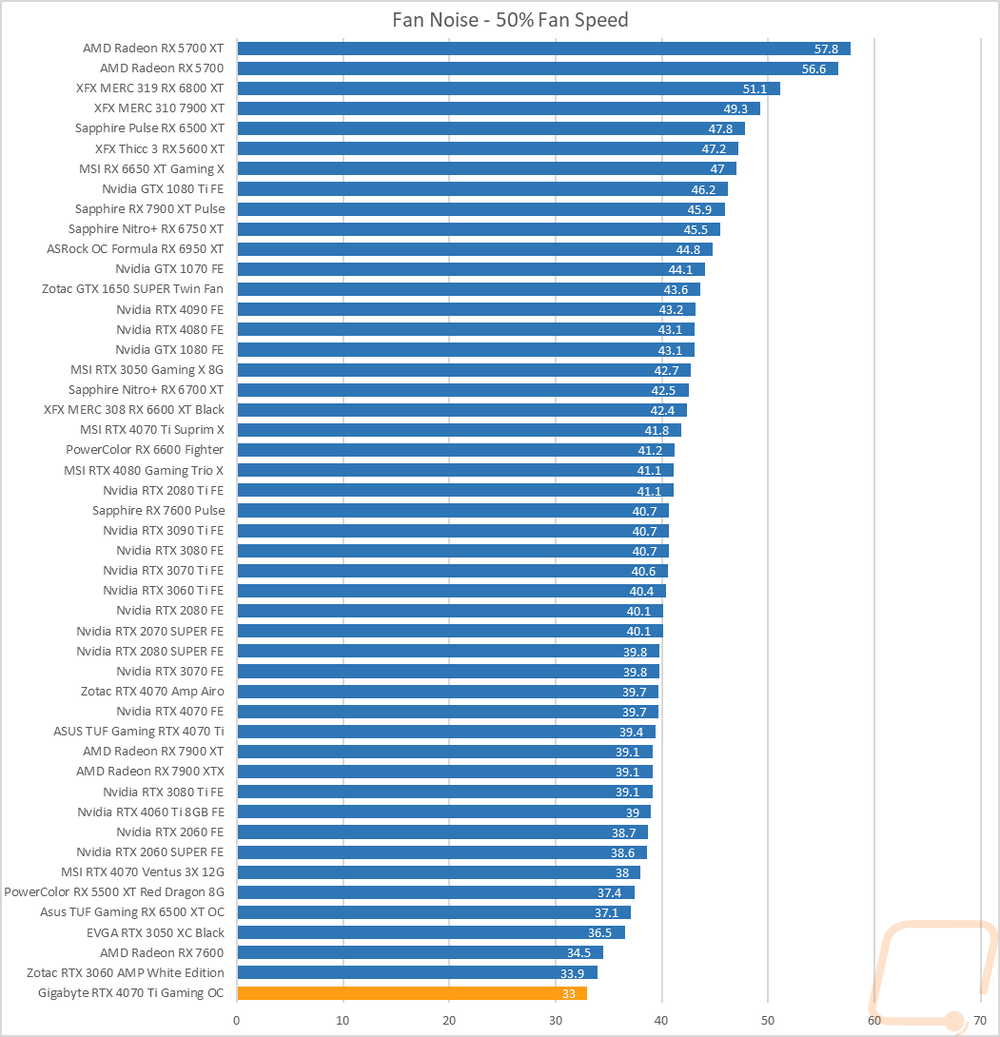
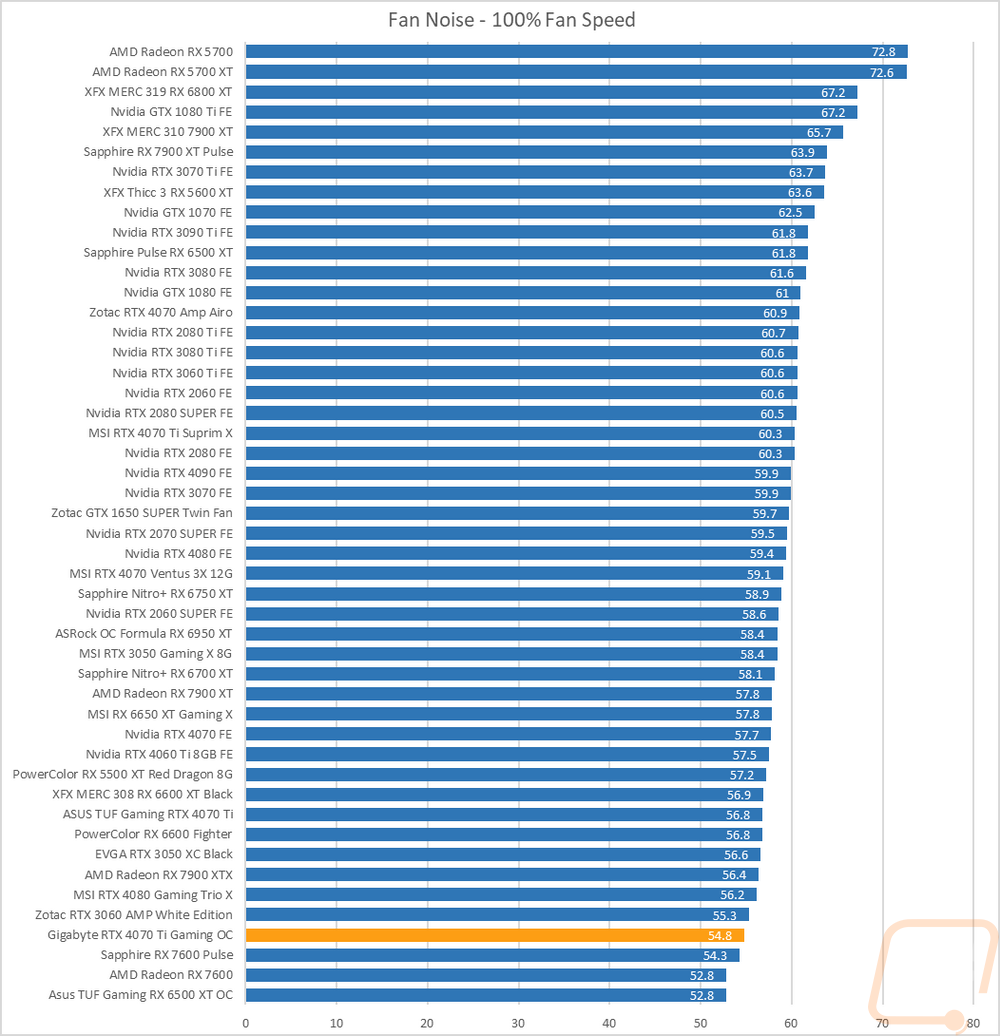
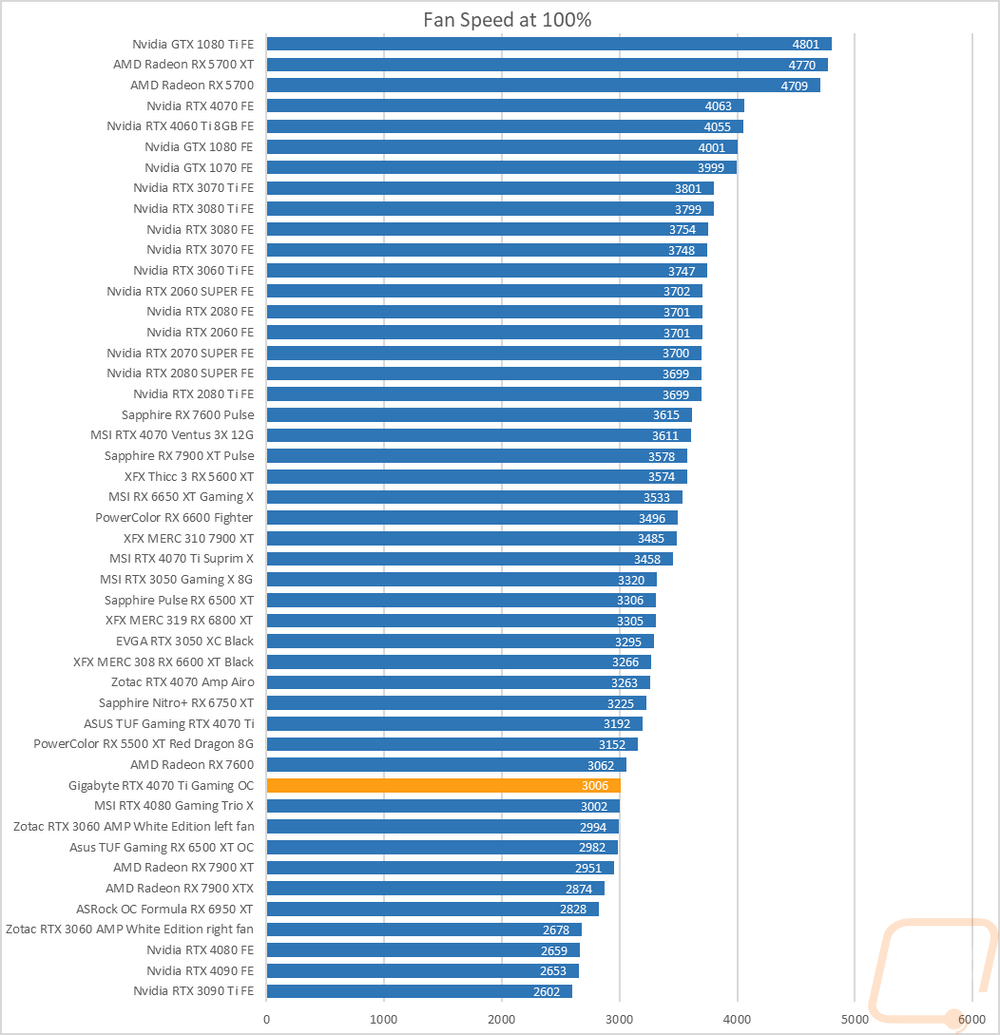
My next round of tests were looking at noise levels. These are especially important to me because I can’t stand to listen to my PC whirling. Especially when I’m not in game and other applications are using the GPU. For my testing, though I first tested with the fan cranked up to 100% to get an idea of how loud it can get, then again at 50% to get an idea of its range. The Gigabyte RTX 4070 Ti Gaming OC was all the way at the bottom of the chart for the 50% fan speed test which is impressive and just a few up from the bottom when we have the fans cranked up to 100%. Gigabyte didn’t give the card’s triple fan setup a crazy high max fan speed which helps, but even still the card is lower in the noise charts than it is in the RPM chart which shows that they are doing a good job keeping things quiet.
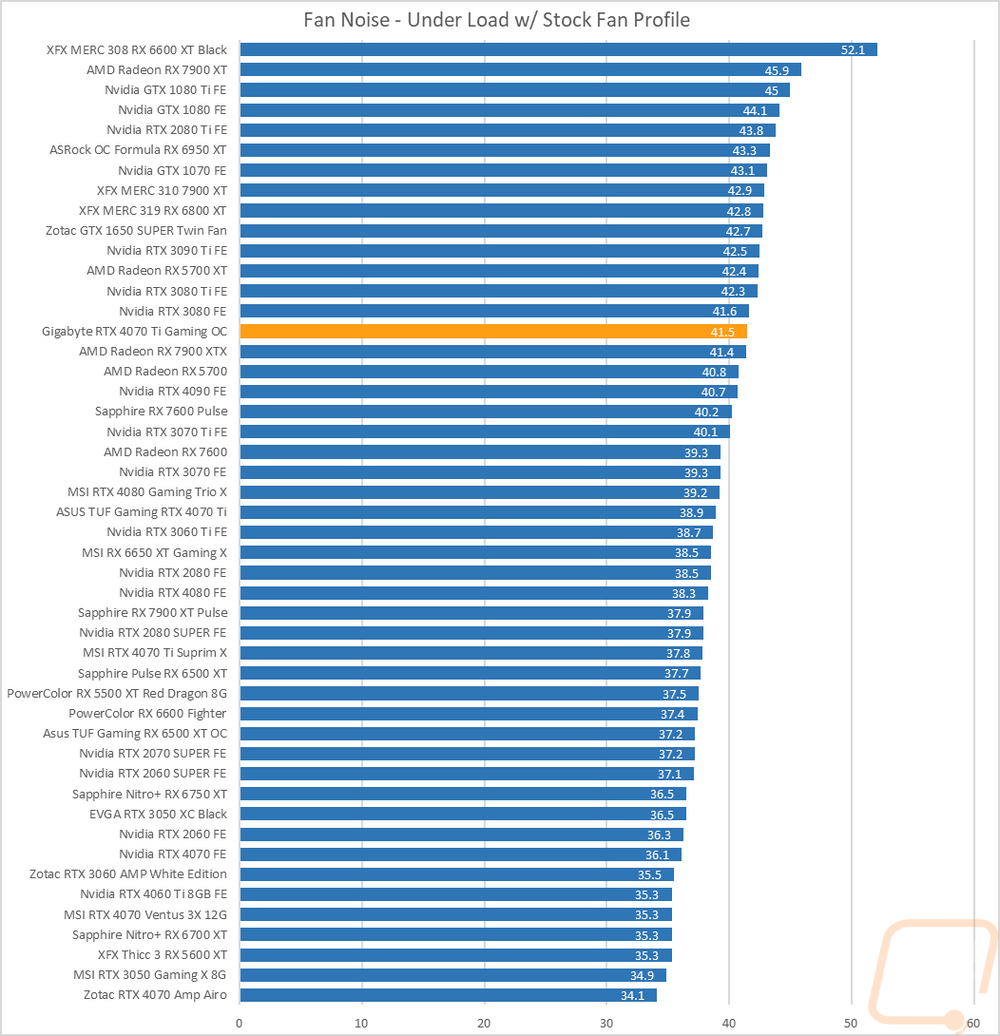
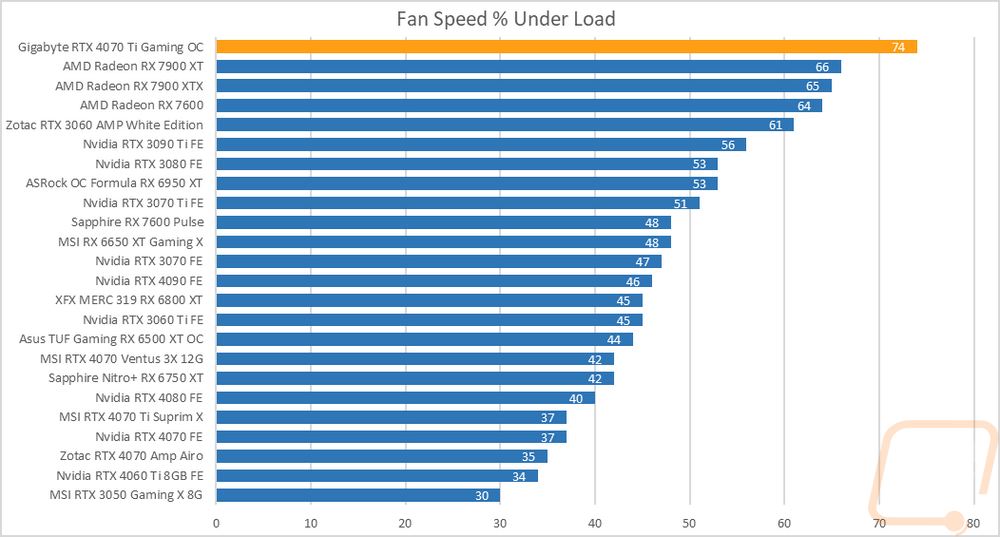
I also take a look at noise performance while under load. For that when running AIDA64’s stress test I wait until the temperature of the card has leveled off and then measure how loud things are when the card is at its worst-case scenario with the stock fan profile. Here the RTX 4070 Ti Gaming OC is a little higher than average with its load noise level at 41.5db, this was 2.6 db higher than the Asus TUF card and 3.7 higher than the Suprim X, an interesting change from the previous noise tests which showed how quiet the card could be. This is because when under load the Gaming OC was at a crazy 74% fan speed, the highest on our chart.
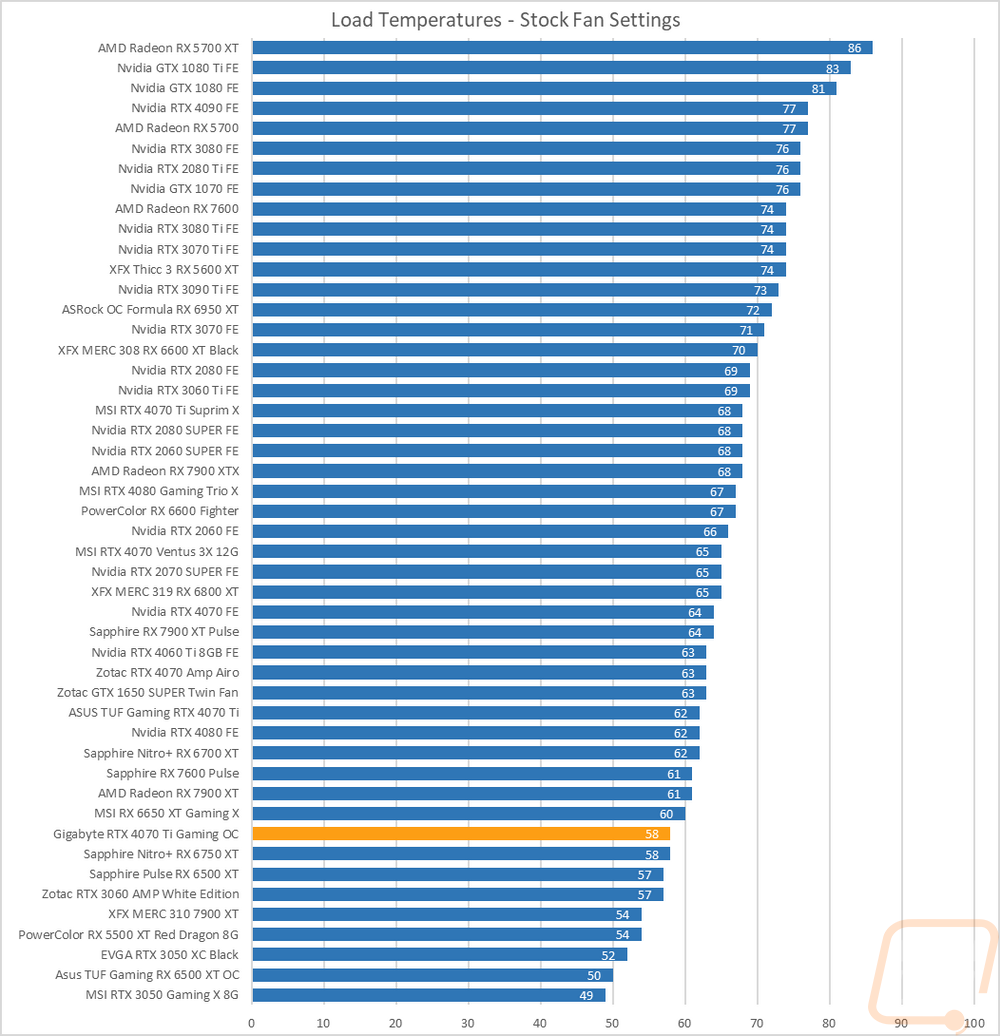
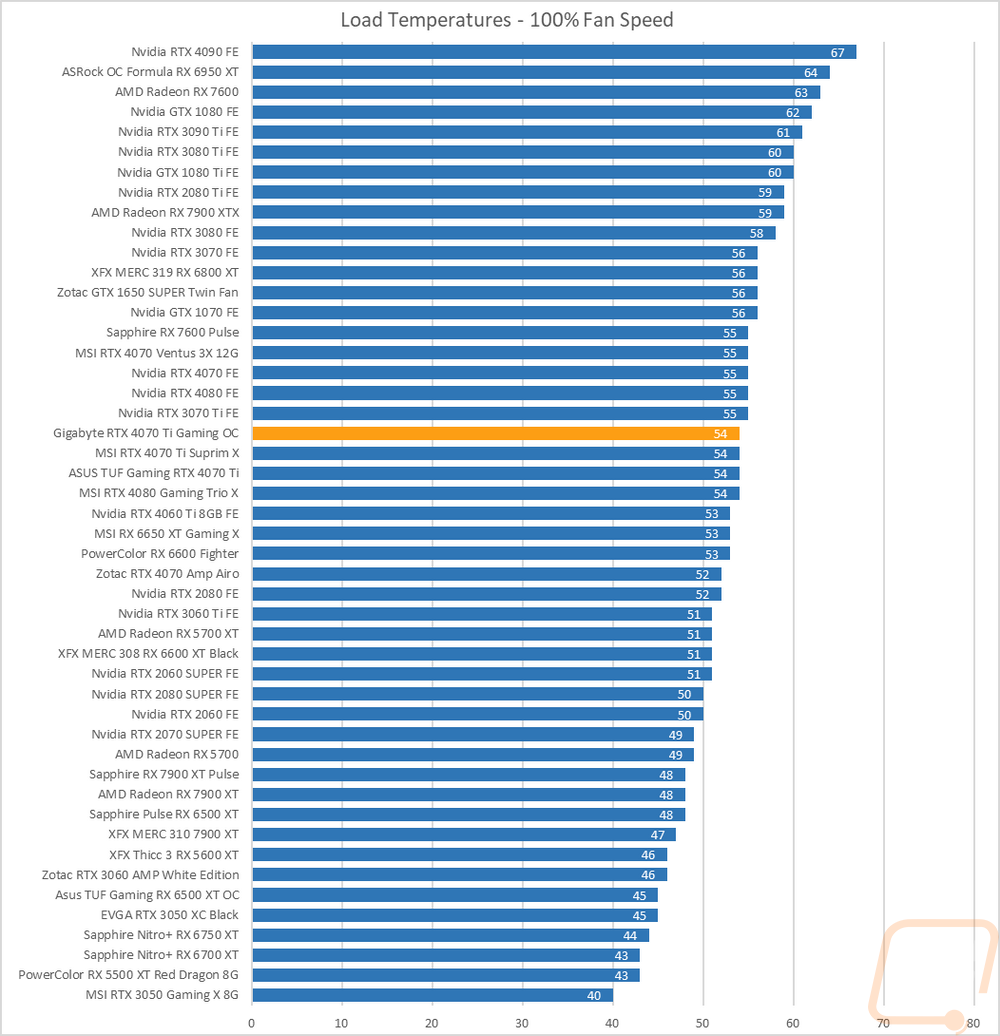
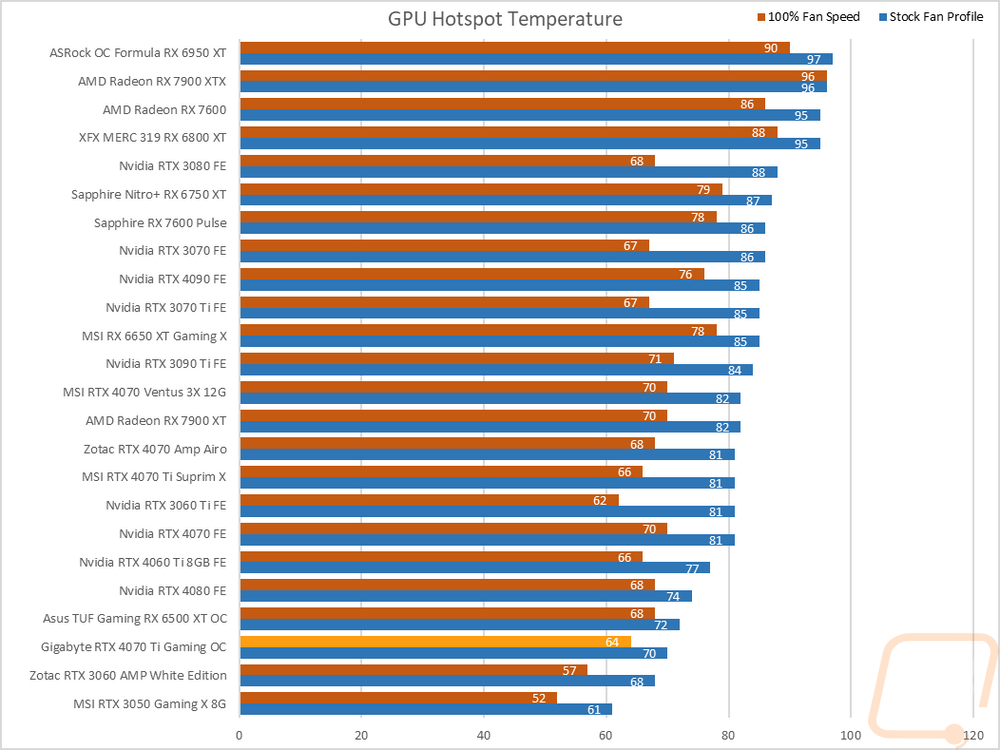
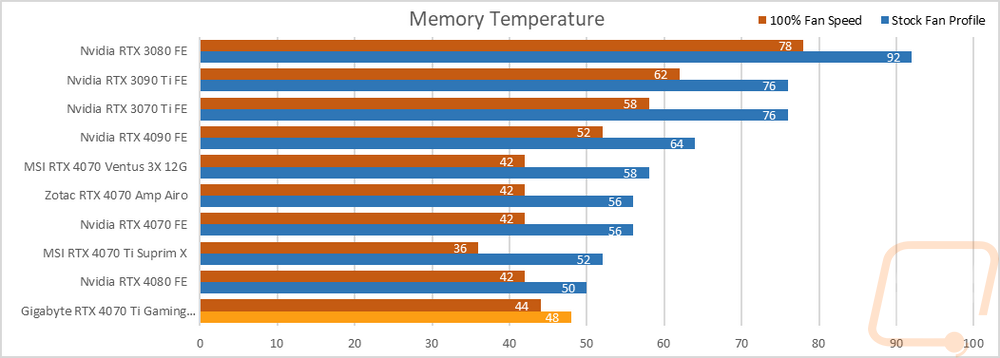
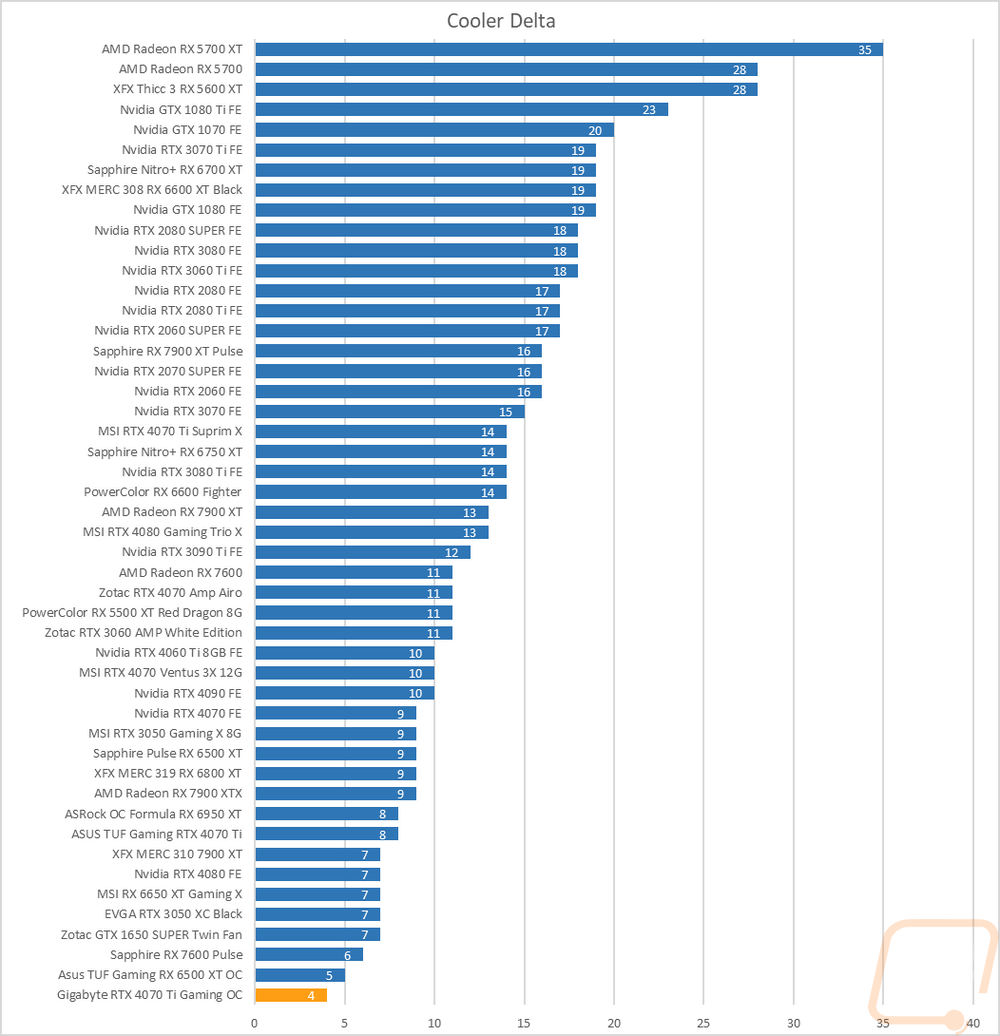
To finish up my testing I of course had to check out the cooling performance. To do this I ran two different tests. I used AIDA64’s Stress Test run for a half-hour each to warm things up. Then I documented what temperature the GPU leveled out at with the stock fan profile and then again with the fans cranked up to 100%. With the stock profile, the RTX 4070 Ti Gaming OC ran extremely cool down at 58c in fact which was 10c cooler than the Suprim X. This explains the crazy fan speeds and how noisy it was under load. The GPU hotspot was at 70c and the memory was at 48c both near or at the bottom of the charts. This profile is a lot more aggressive than it needs to be. Then with the fans cranked up, the Gigabyte RTX 4070 Ti Gaming OC came in at 54c which is right in the middle of the pack and right with the Suprim X. The GPU hotspot dropped down to 64c, and for memory it went down to 44c. Because of the crazy stock fan profile, the delta between the stock fan profile and 100% fan speed was just 4c which is low and shows it is using most of the cooling all of the time. But we know this is because it is running at 74% fan speed when under load and keeping the card abnormally cool.
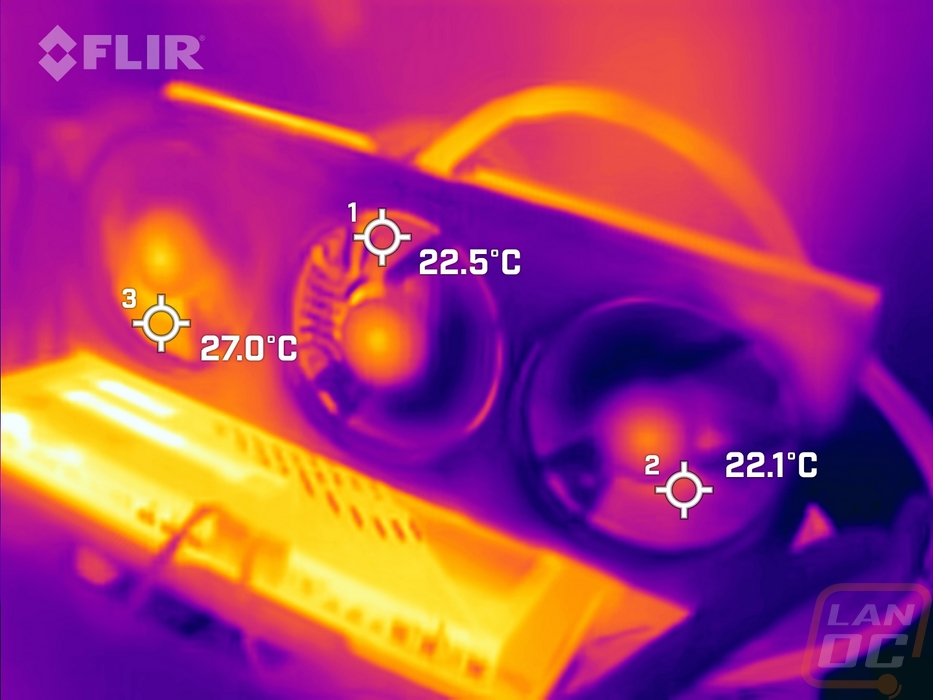
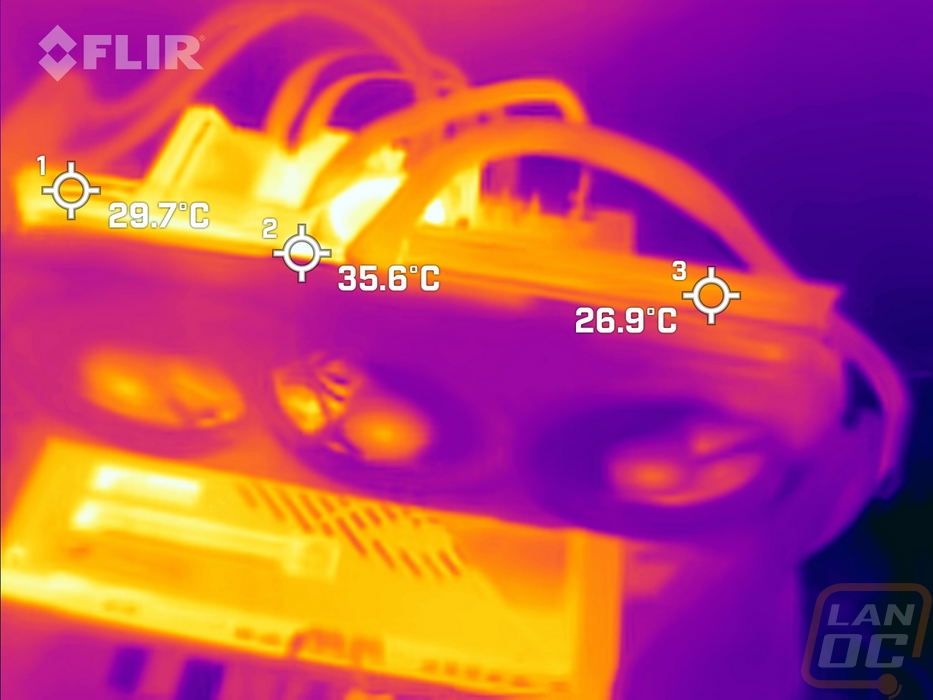
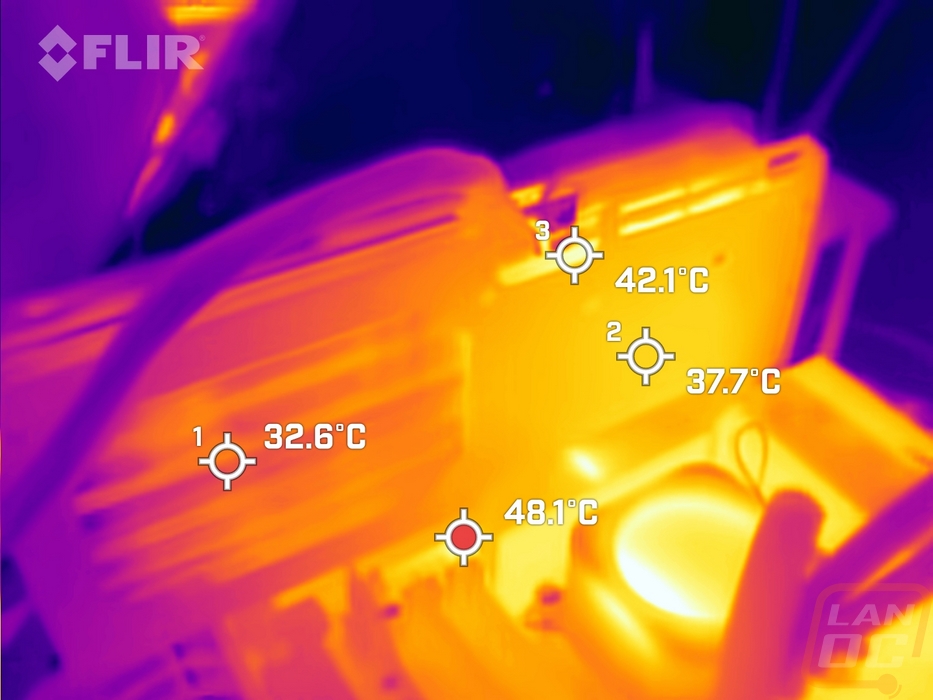
While running the stock fan profile testing I also took the time to get a few thermal images so we could see what is going on. On the fan side of the Gigabyte RTX 4070 Ti Gaming OC, you can see that it is noticeably cooler on the end of the card with the blow-through area and the thicker heatsink, but even on the other end things aren’t too hot. It is hotter up on the top edge where the fans are blowing the warmed air up, especially on the left side. Then at the back, the same can be seen once again with a 10c difference from one side of the card to the other. The heatpipes are pulling the heat over to the better cooling side but it looks like it’s not enough to even the cooling out completely.