RTX and DLSS
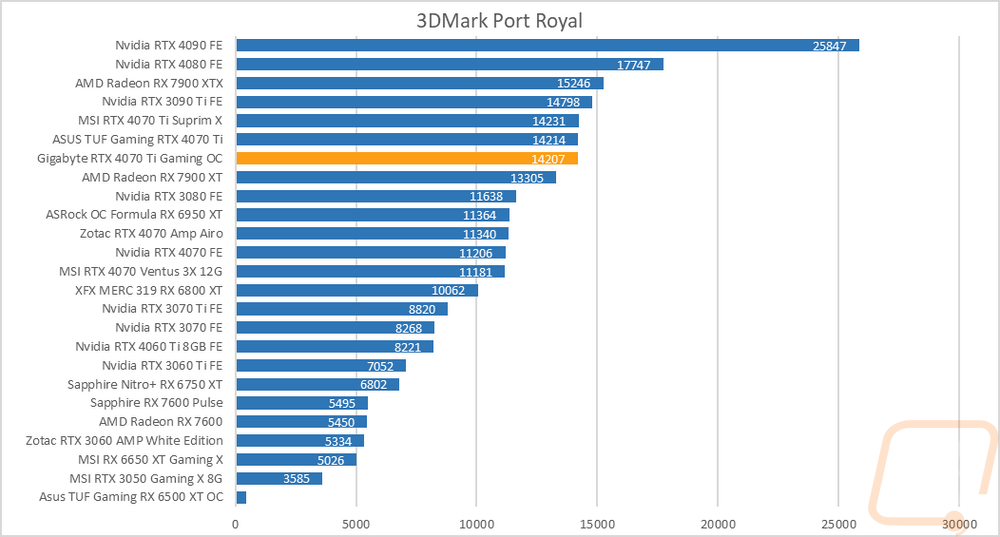
Being an RTX card I also like checking out the performance of some of Nvidia’s features. Namely the ray tracing performance and the performance improvements you can see by using DLSS combined with the tensor cores. My first test goes back to our synthetic benchmarks with 3DMark where I check out their Port Royal benchmark. This is the one test that does also have AMD Ray Tracing support which is great to get a look at how different cards including older non-RTX cards perform. The RTX 4070 Ti Gaming OC scored a 14207 which puts it 7 points behind the TUF and 24 points behind the Suprim X. All three cards still sit ahead of the RX 7900 XT and below the 7900 XTX and 3090 Ti here.
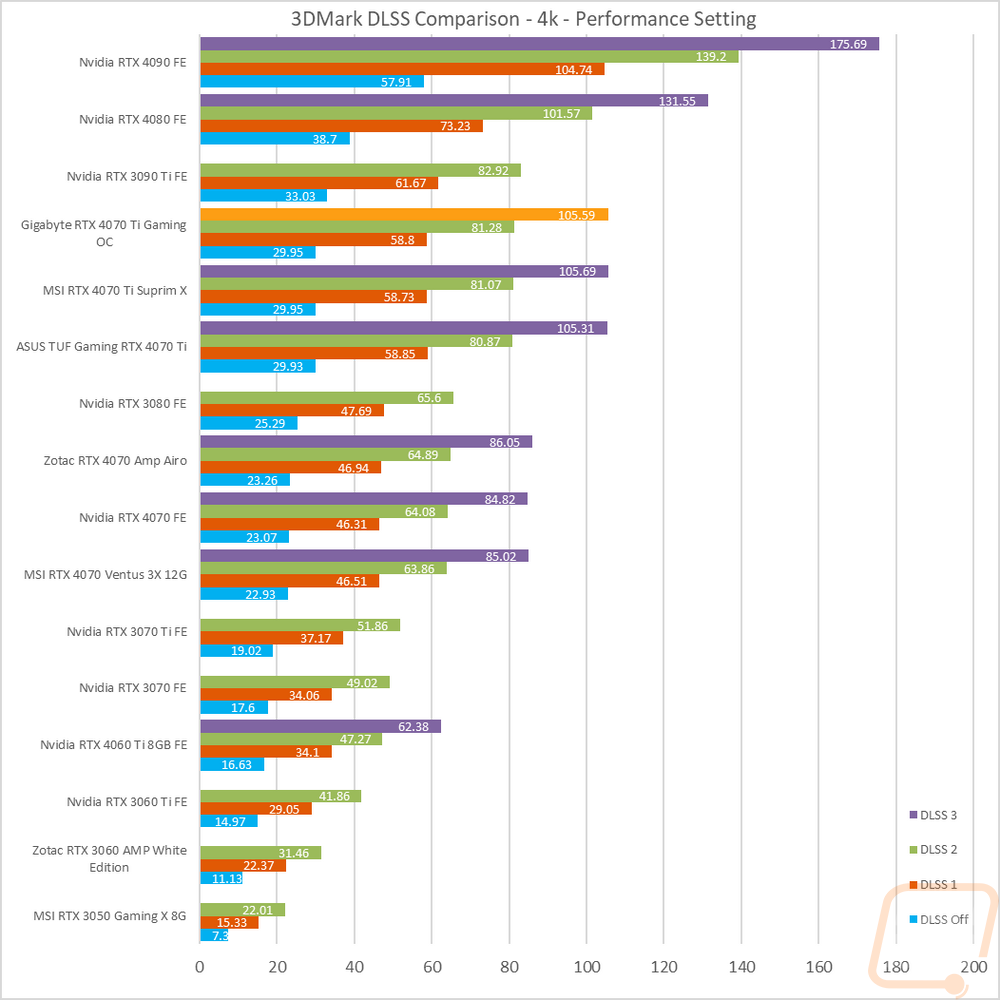
3DMark also has added in a few feature tests, one being a look at DLSS performance. For this one, I have the resolution set to 4K and I test with all three versions of DLSS as well as with it off completely. All DLSS are set to their performance setting as well to keep the results comparable. This gives us a great look at the performance improvements that DLSS has given with DLSS 3 also including frame generation. The RTX 4070 Ti Gaming OC is ahead of the other 4070 Ti’s here in most of the tests but the Suprim X does edge out just slightly on the DLSS 3 on test with .1 of an FPS more. More than anything though this test shows how much of a difference DLSS can make no matter the version going from almost 30 FPS to nearly double the performance with DLSS 1 and up to 105 with DLSS 3 with frame generation.
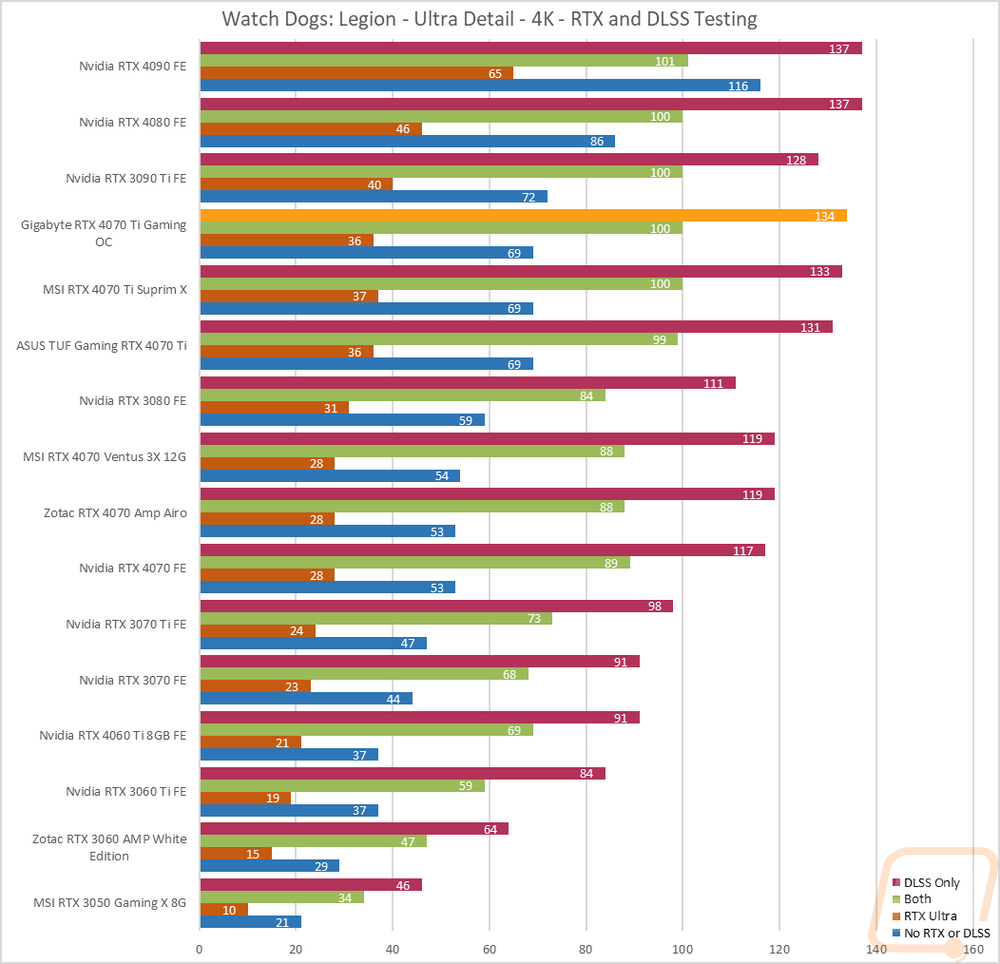
I then jumped into game tests, this time with Watch Dogs: Legion. For this one, I wanted to get an idea of the performance you will see when taking advantage of Nvidia’s RTX and DLSS features. I tested at 4k with the ultra detail setting and with ultra being the setting for DLSS and RTX when they are on as well. I then test with no RTX or DLSS on and then with RTX DLSS on and off and on together. Here the RTX 4070 Ti Gaming OC gained 1 FPS on the Suprim X and 3 FPS on the TUF in the DLSS-only test and matched the Suprim X in the combined test.
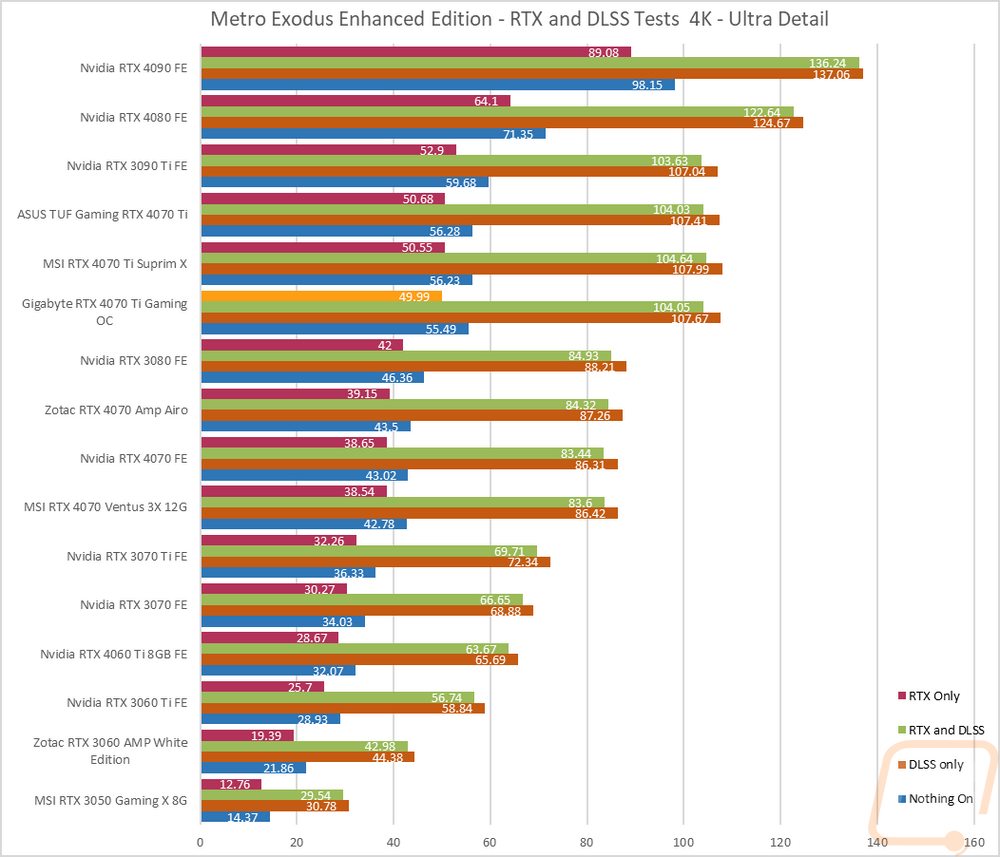
Next, I wanted to check out the performance in Metro Exodus which we have used for testing for a long time now. This test is similar as well with it set to 4K and Ultra detail, I use the included benchmark to test DLSS and RTX individually and then with them both on and both off to give us a look at overall frame rates depending on which direction you go. I should point out that this is using the Enhanced Edition where our normal benchmark uses the standard version for testing with AMD but that version DLSS no longer works. That said the RTX 4070 Ti Gaming OC is behind the other 4070 Ti’s just slightly in the RTX only result but beats the TUFF in the DLSS on results.