In-Game Benchmarks
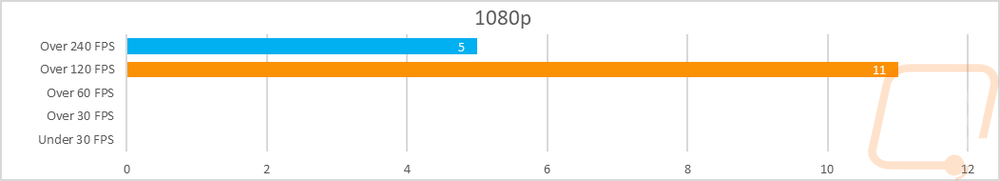
Now we finally get into the in game performance and that is the main reason people pick up a new video card. To test things out I ran through our new benchmark suite that tests 10 games at three different resolutions (1080p, 1440p, and 4k). Most of the games tested have been run at the highest detail setting and a mid-range detail setting to get a look at how turning things up hurts performance and to give an idea of if turning detail down from max will be beneficial for frame rates. In total, each video card is tested 54 times and that makes for a huge mess of results when you put them all together. To help with that I like to start with these overall playability graphs that take all of the results and give an easier-to-read result. I have one for each of the three resolutions and each is broken up into four FPS ranges. Under 30 FPS is considered unplayable, over 30 is playable but not ideal, over 60 is the sweet spot, and then over 120 FPS is for high refresh rate monitors.
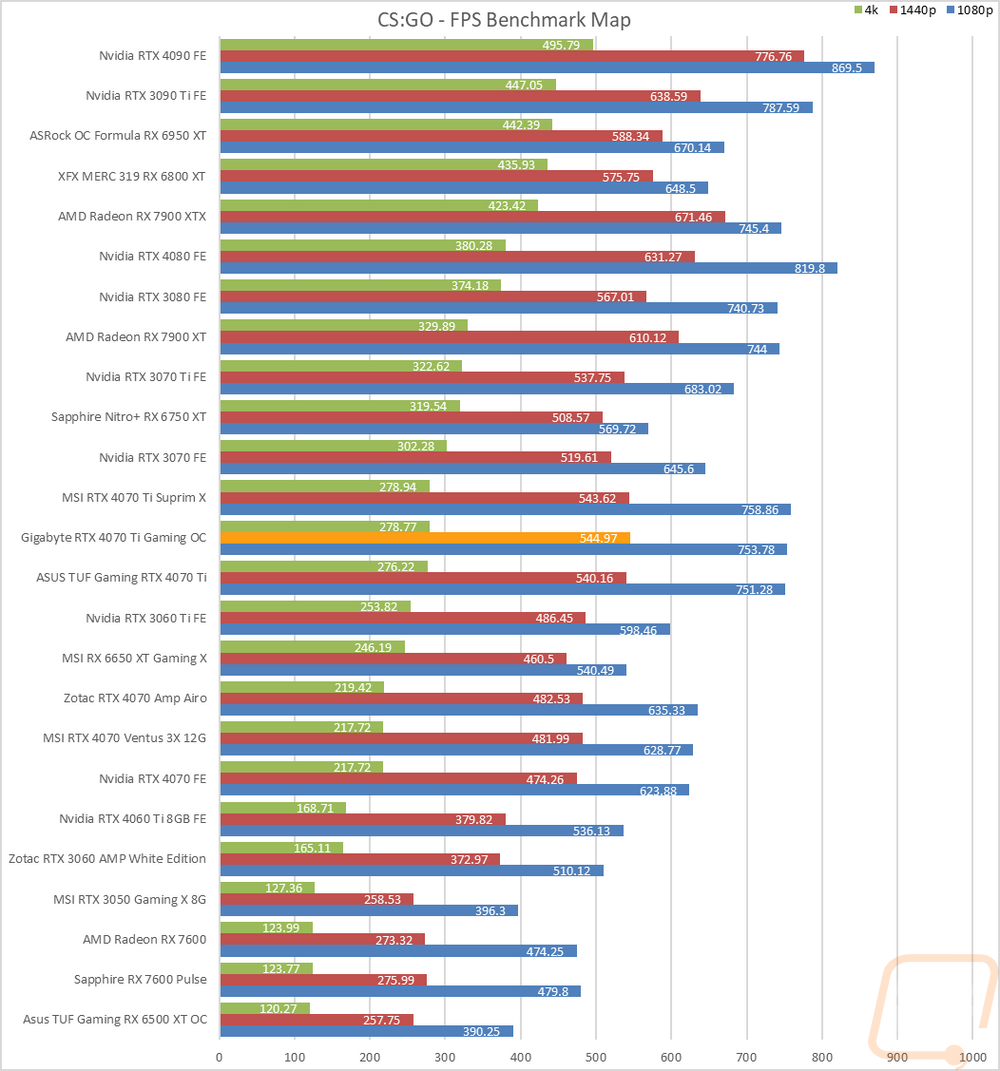
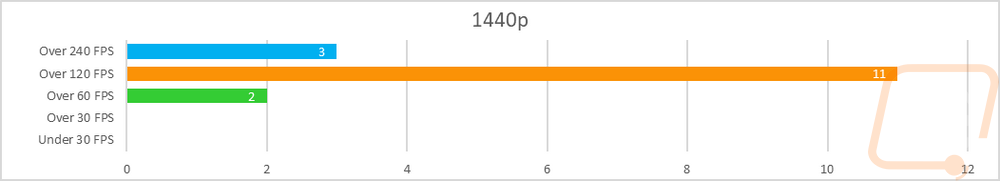
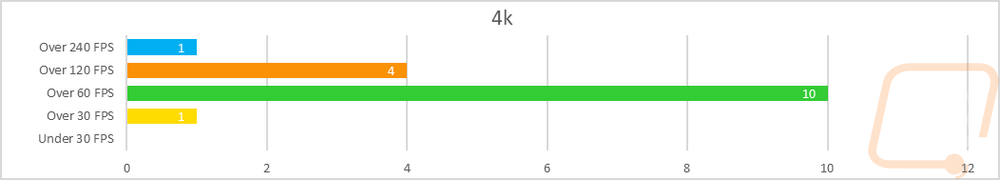
So how did the RTX 4070 Ti Gaming OC do? Well at 1080p is completely stomped all of our tests with nothing coming in below 120 FPS. At 1080p 11 results were between 120 and 239 and then 5 were up over 240 FPS. The RTX 4070 Ti Gaming OC is targeted at 1440p gaming and it shows with only two results coming in below 120 FPS and those two were still up over 60 FPS. There were 11 over 120 FPS and then 3 over 240 FPS. Lastly, while not specifically designed for it the RTX 4070 Ti Gaming OC handled 4K well as well. There was one result which was in the playable but not smooth range but most of the results (10 in total) were in the 60-119 FPS range. Four more were over 120 FPS and then one (CS:GO, it's always CS:GO) was over 240 FPS as well.
To get another comparison I did average out all three of the RTX 4070 Ti results to see how the cards landed. The Suprim X with its significantly bigger overclock is up at the top, which isn’t a surprise. I was surprised that the Gaming OC didn’t outperform the stock-clocked TUF card, however. As I mentioned earlier the Gaming OC is on a new driver and there will be some variance and I suspect that is what we are seeing here. At 1080p for example the Gaming OC is faster than the TUF card in almost all of the tests but there were two results that there was a gap between the two which made all of the difference. One thing is for sure though, the base overclock shouldn’t be your main concern, there isn’t much performance to be found there.
|
|
1080p |
1440p |
4K |
|
MSI RTX 4070 Ti Suprim X |
212.90 |
174.5 |
103.74 |
|
ASUS TUF Gaming RTX 4070 Ti |
210.69 |
174.07 |
103.61 |
|
Gigabyte RTX 4070 Ti Gaming OC |
210.32 |
173.55 |
103.36 |
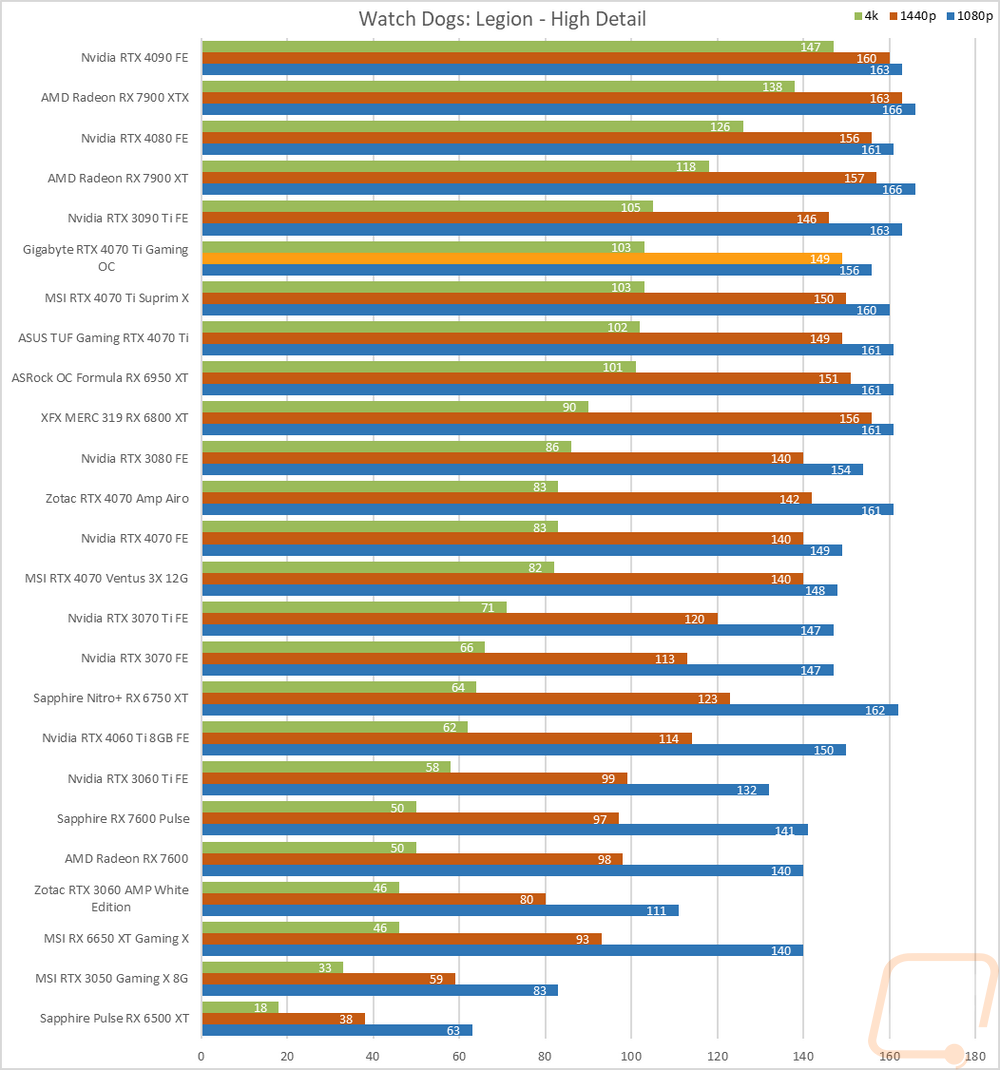
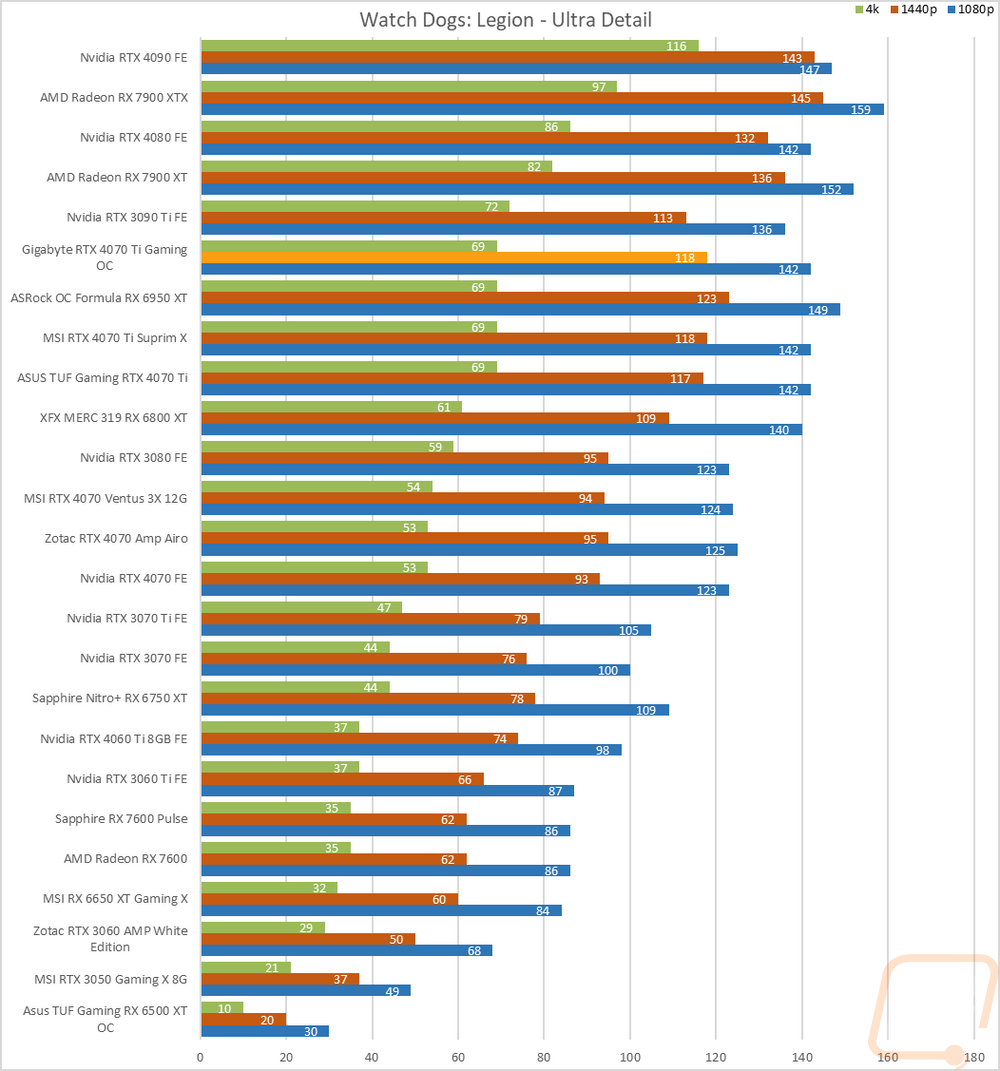
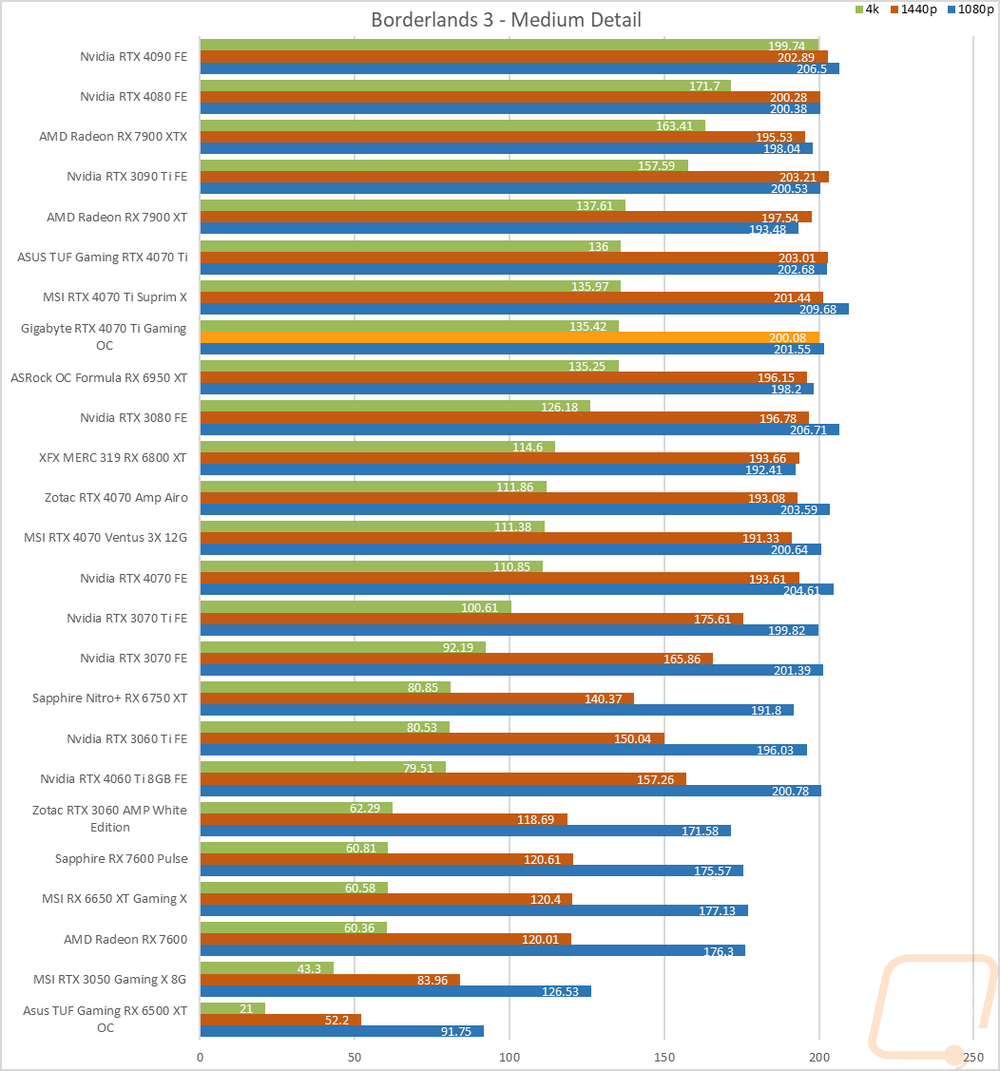
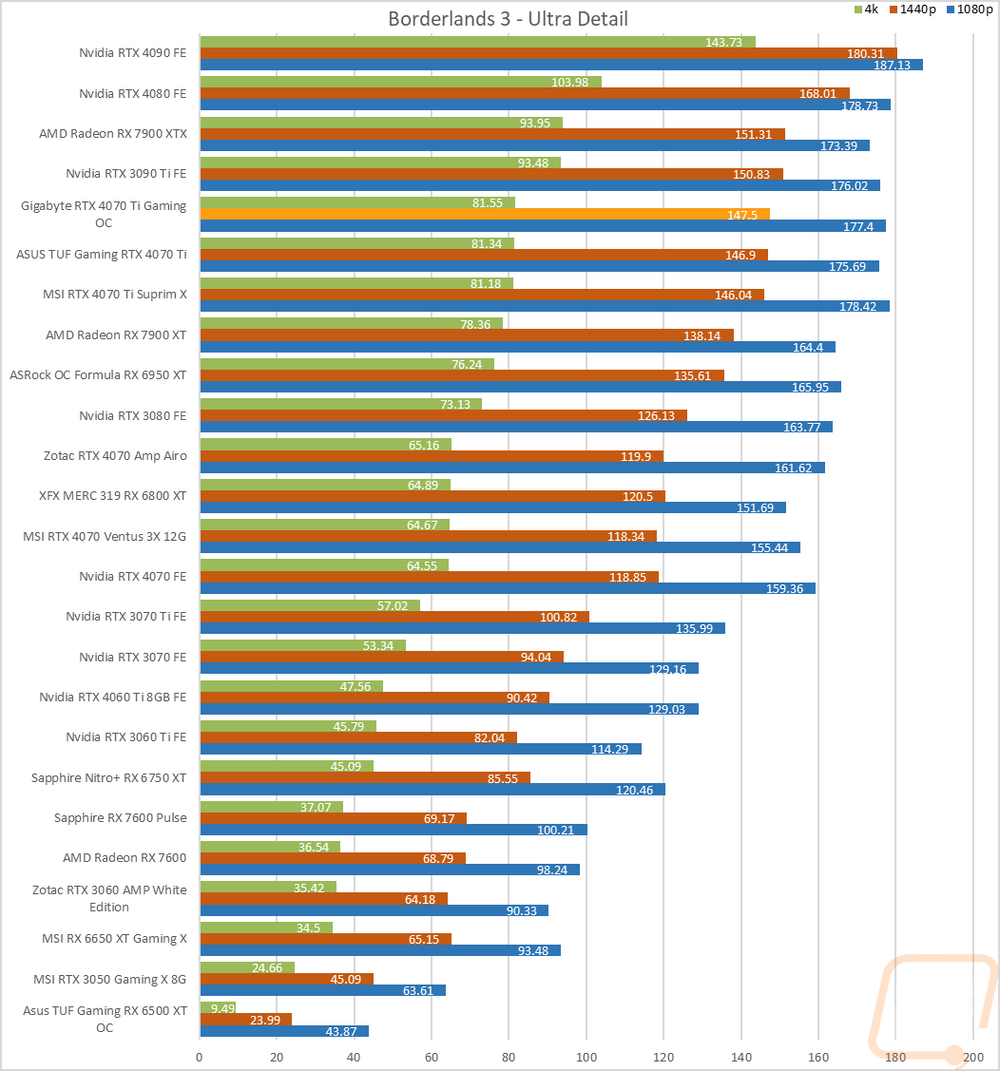
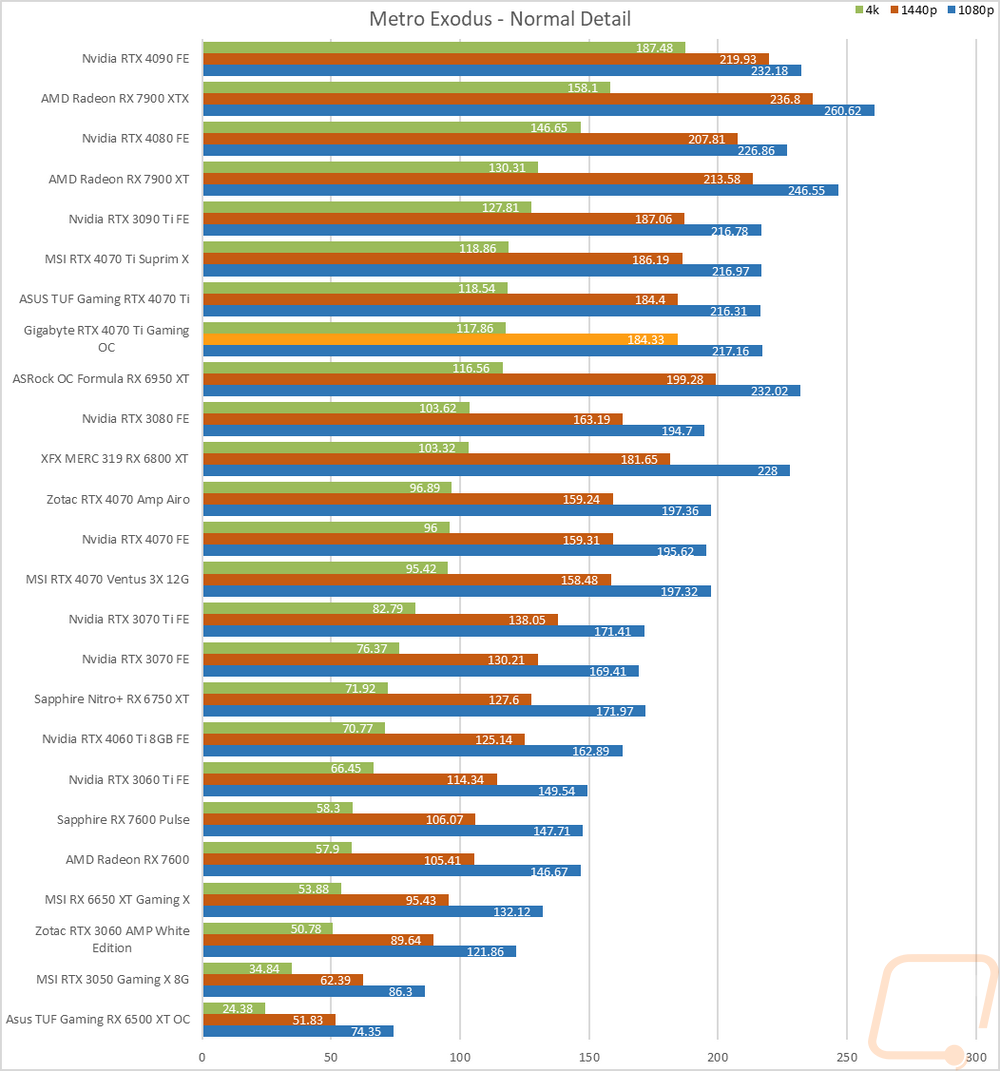
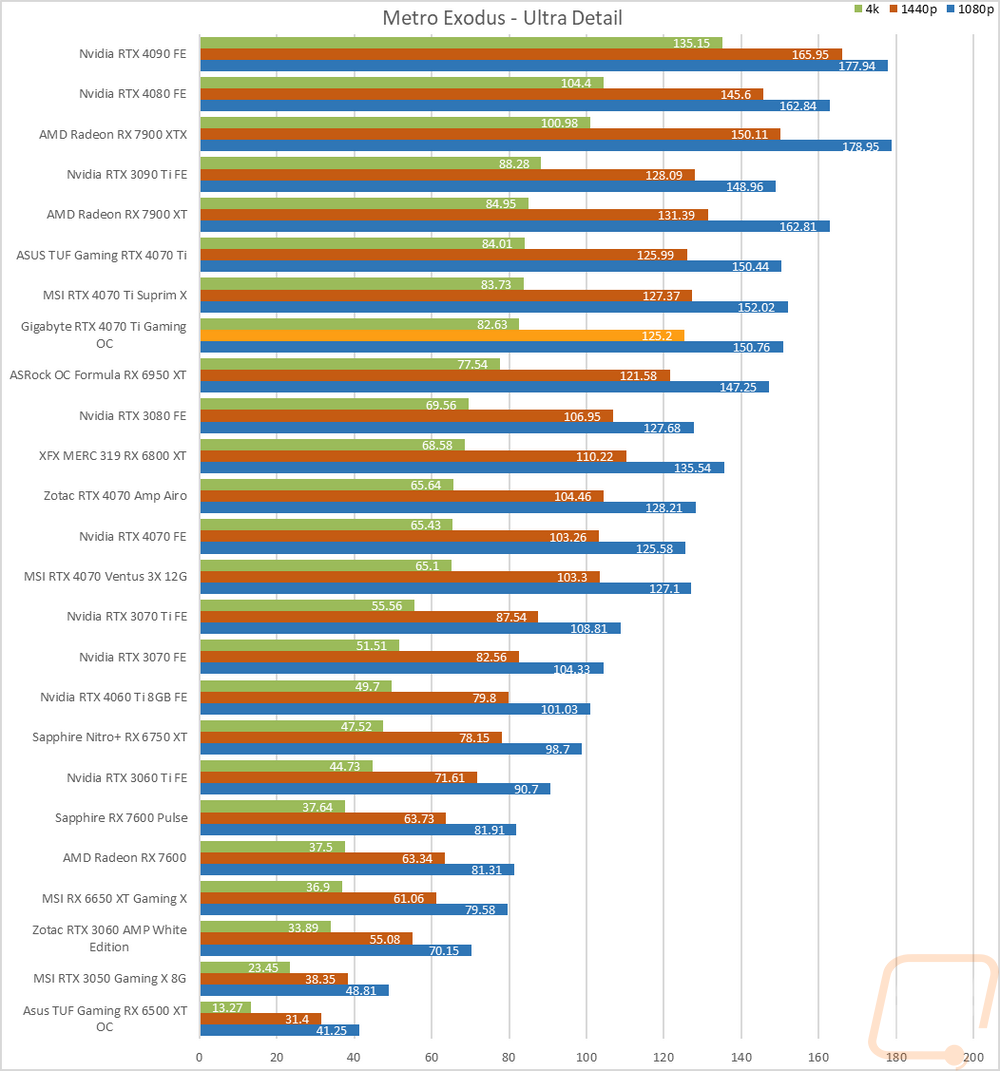
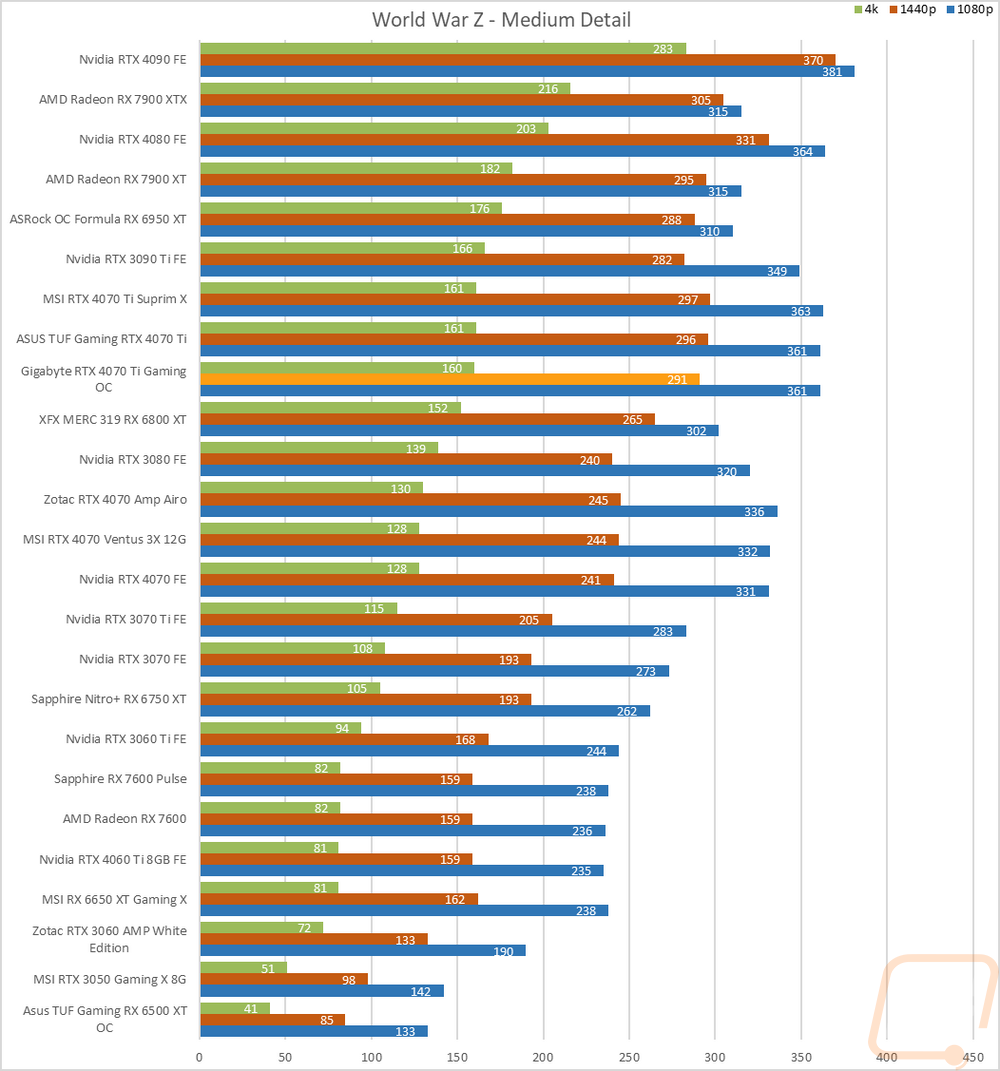
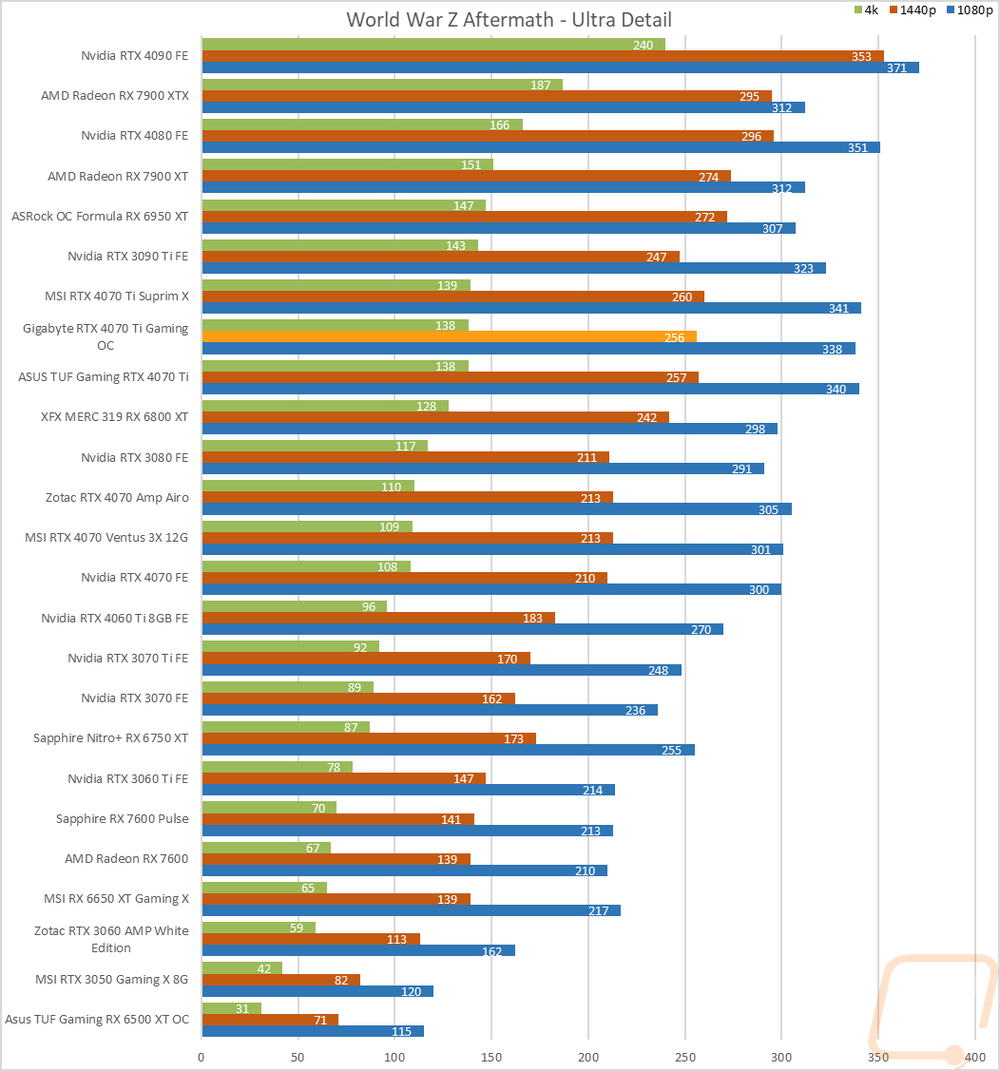
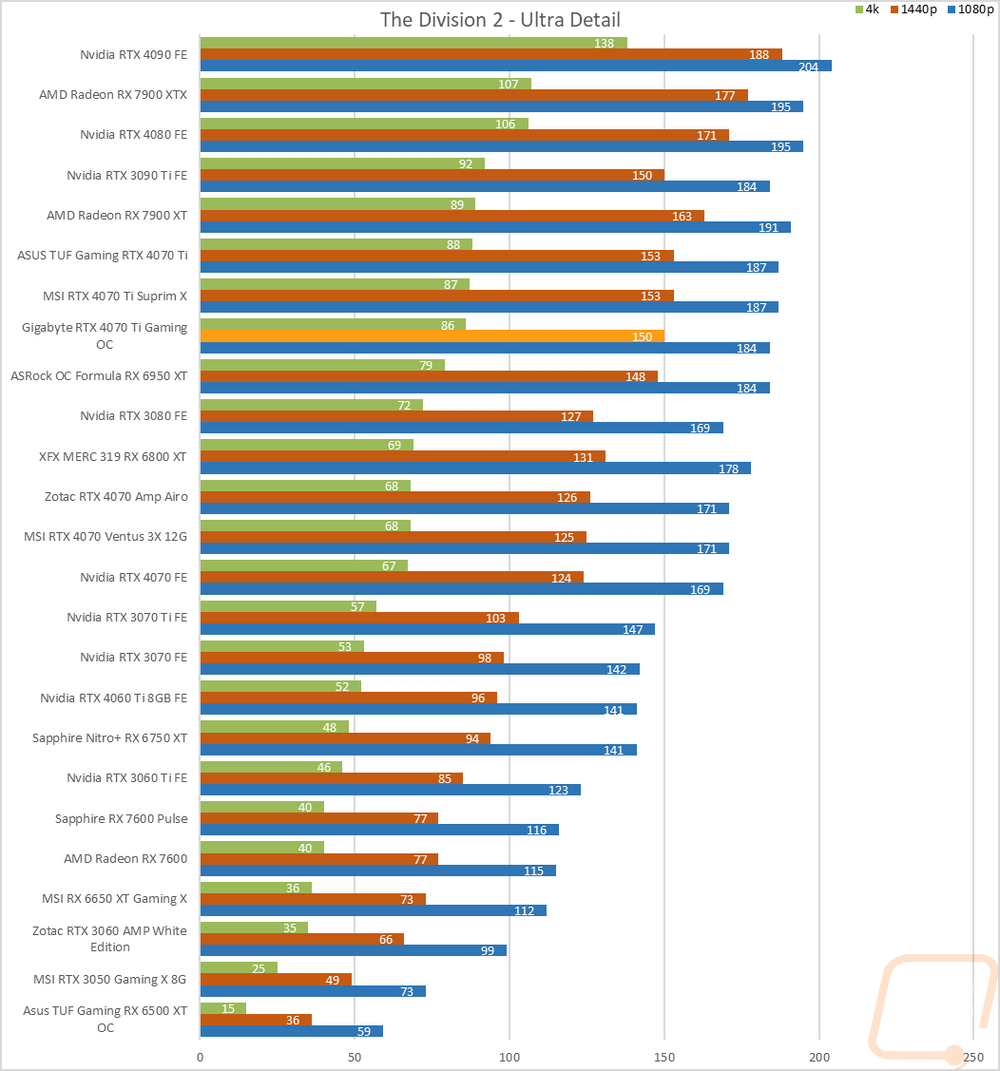
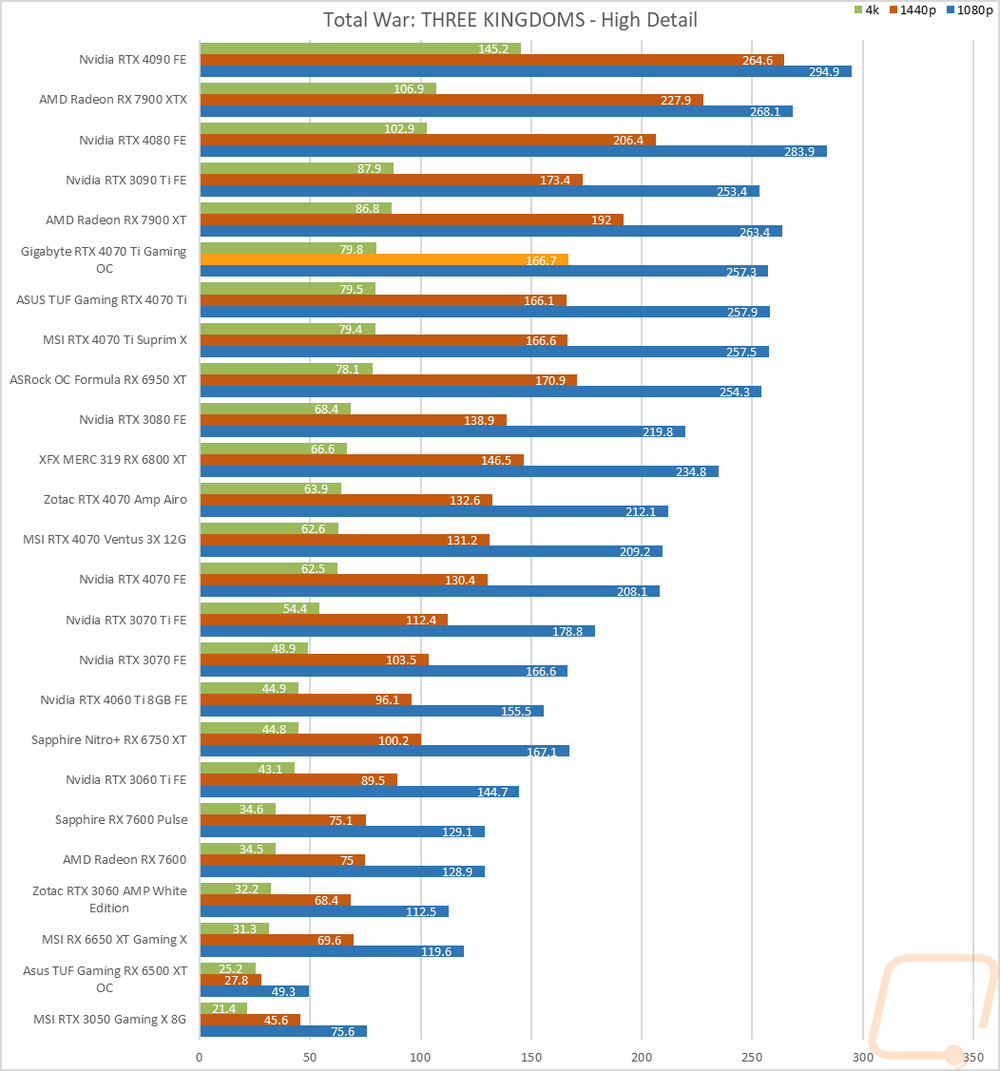
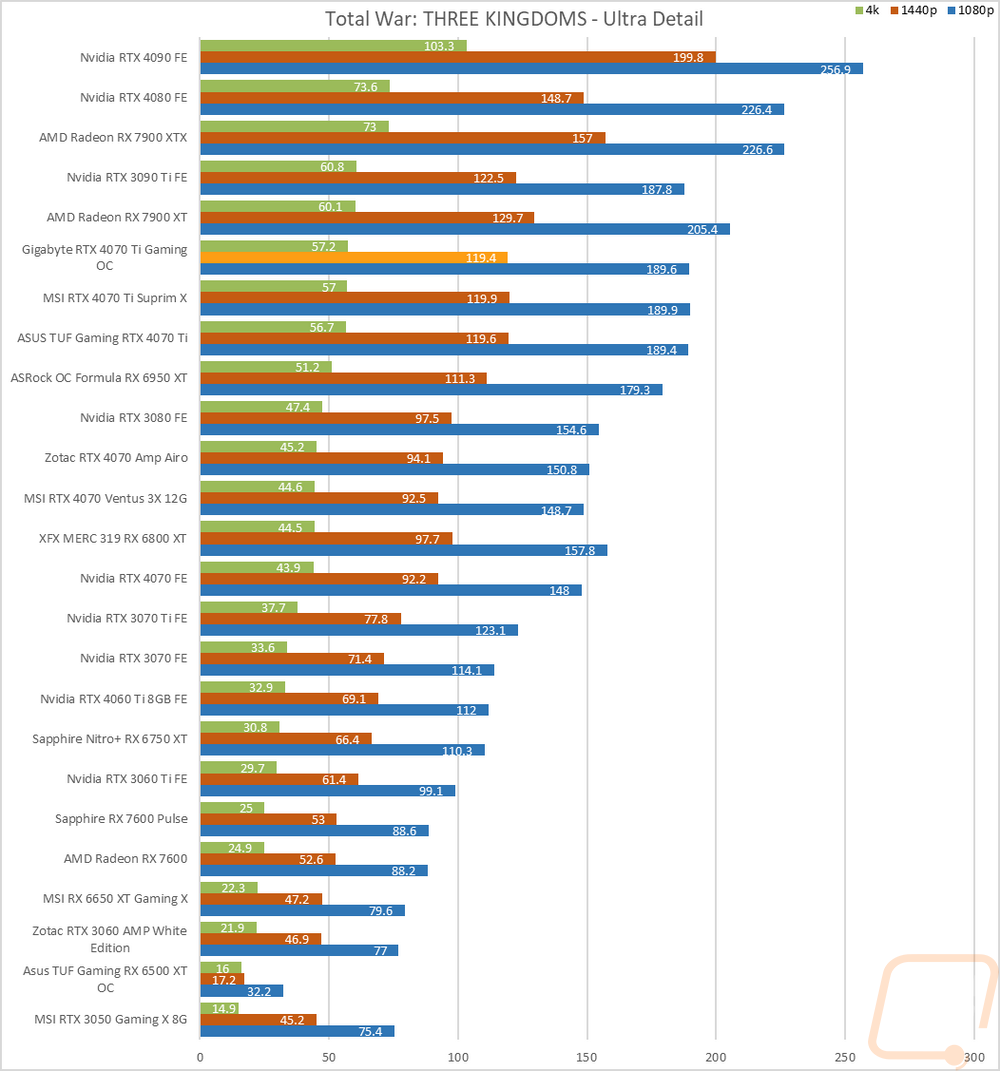
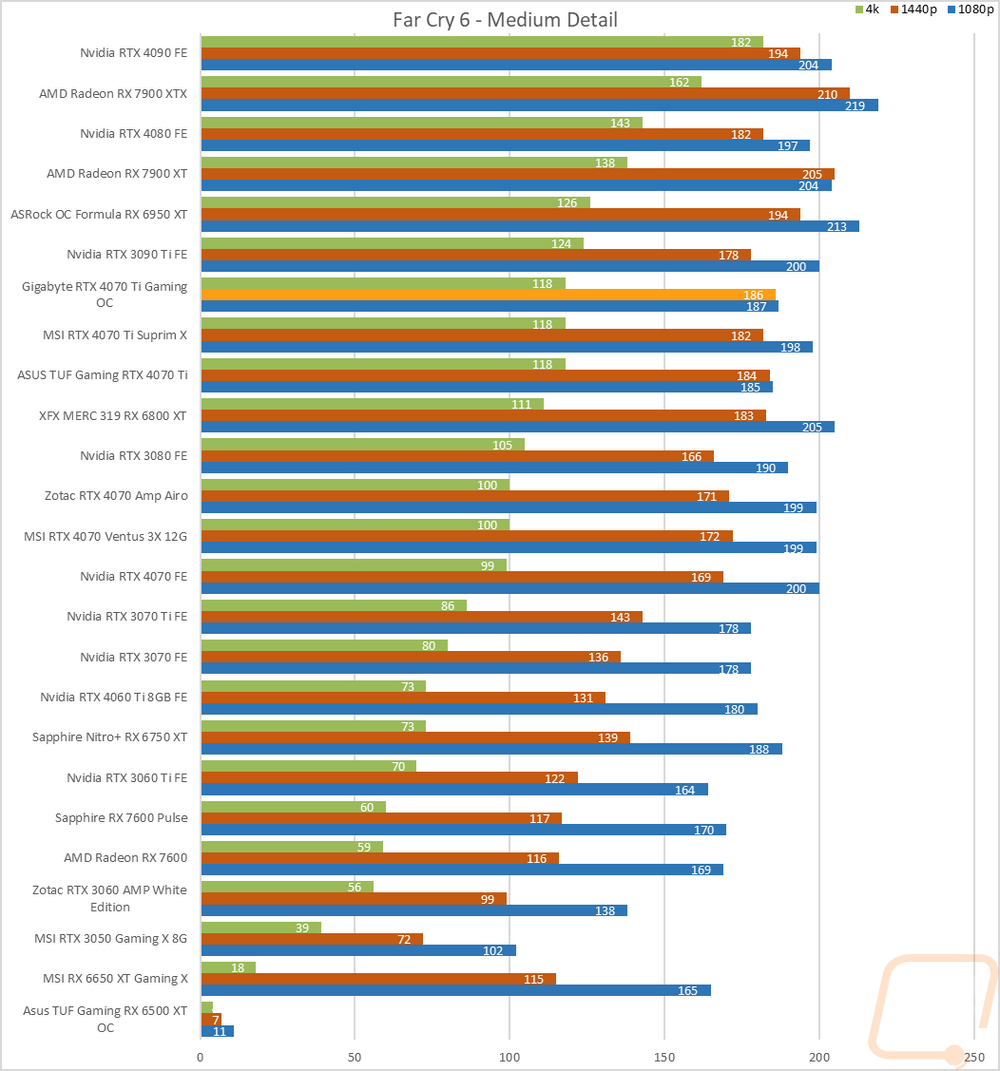
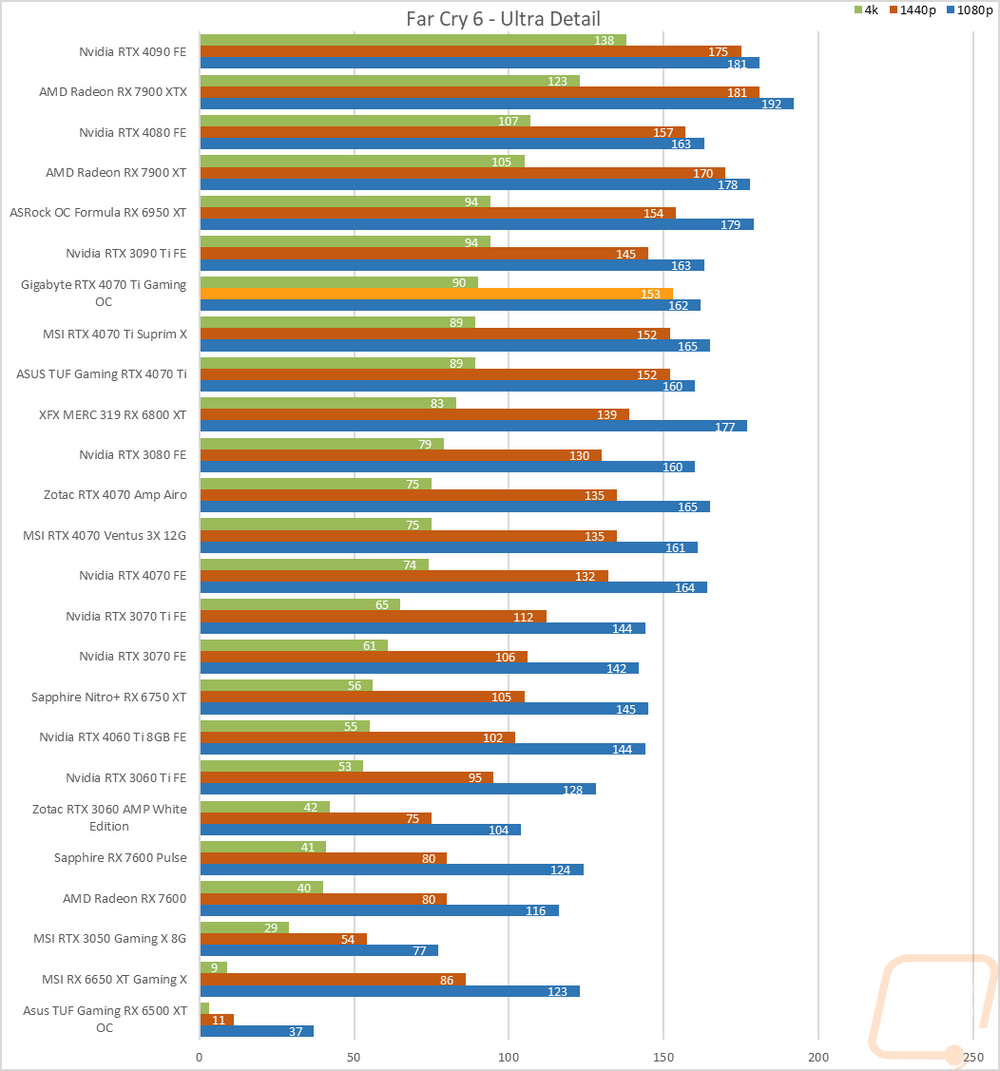
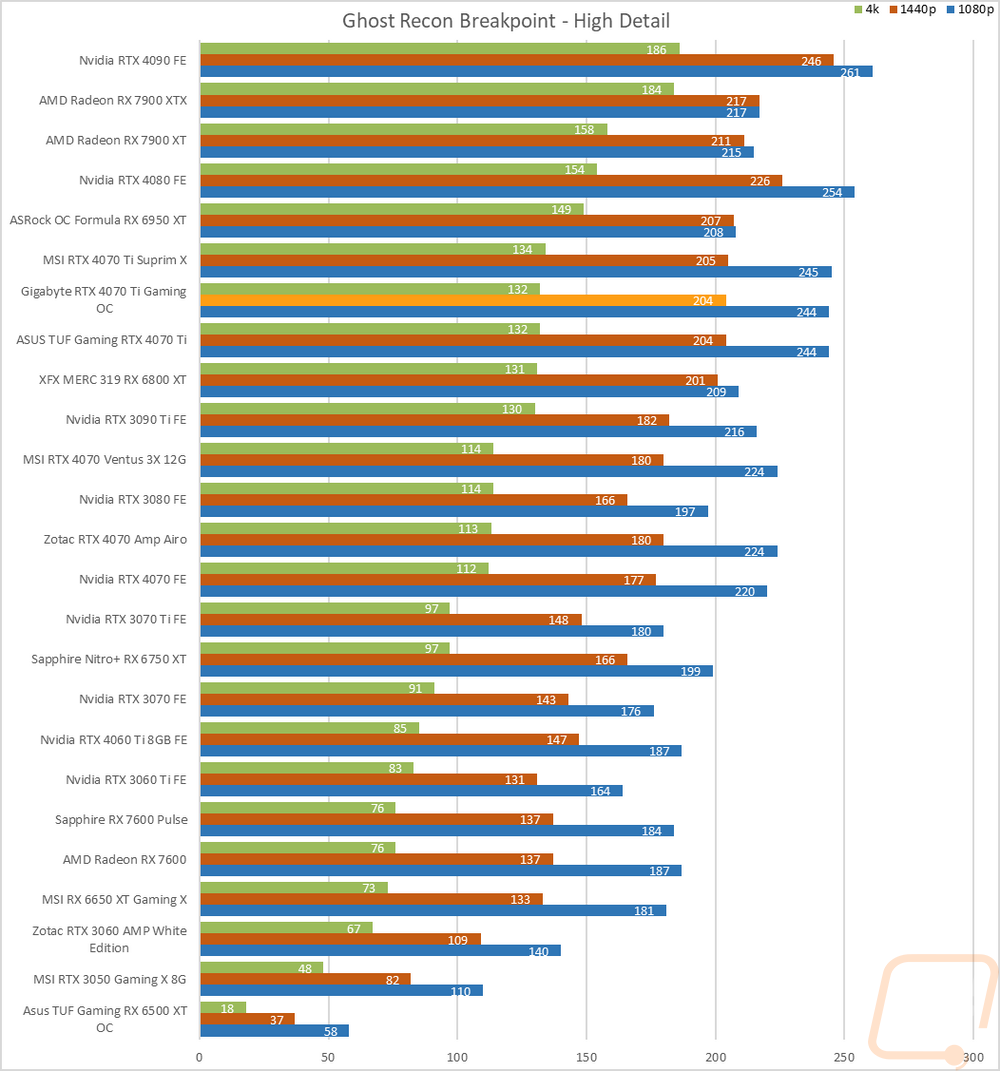
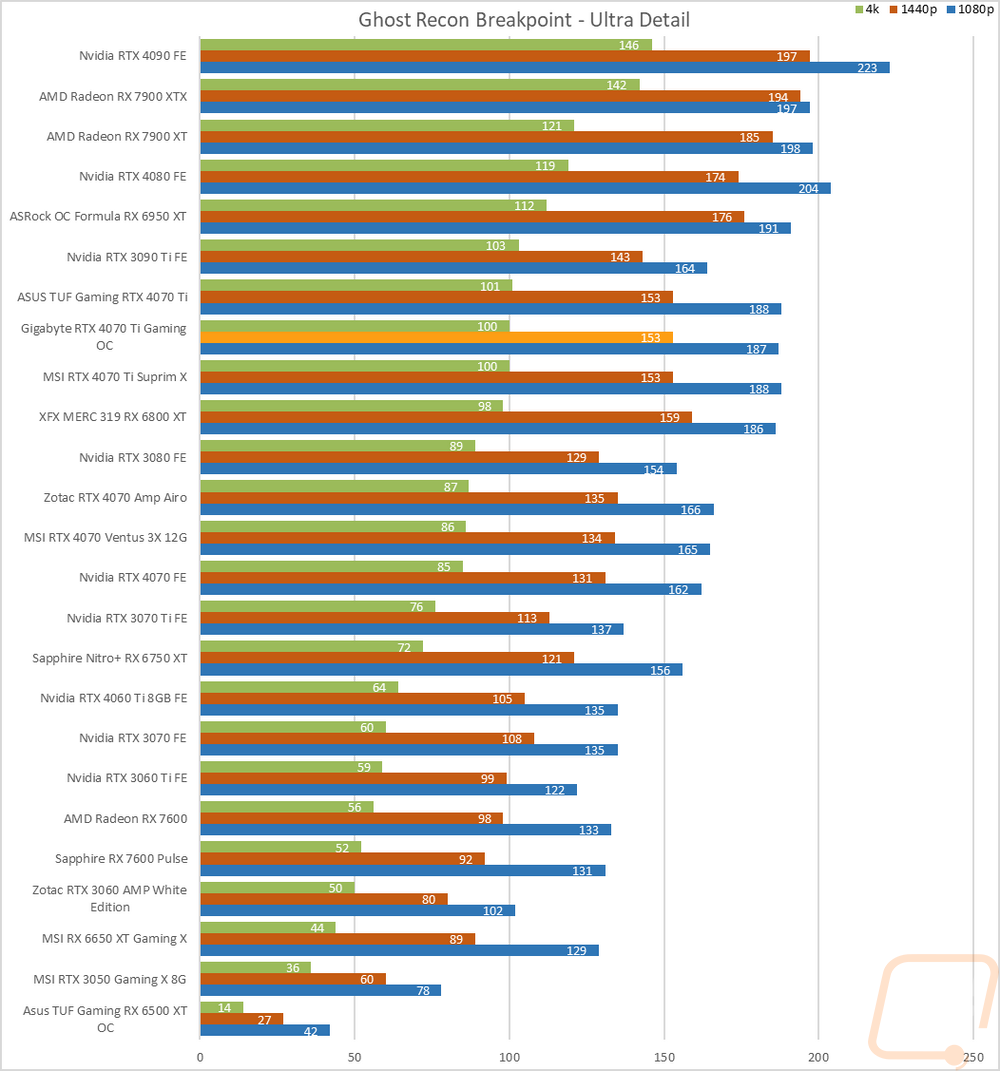
Of course, I have all of the actual in game results as well for anyone who wants to sort through the wall of graphs below. These graphs do a good job of showing that the RTX 4070 Ti Gaming OC and the other 4070 Ti’s are sitting just behind the RTX 3090 Ti in a majority of the tests and at 1440p and 4K they are sitting behind the 7900 XT and the 6950 XT.