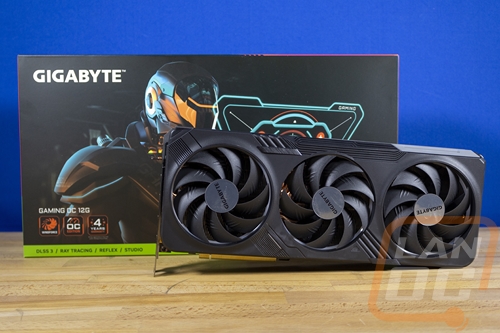
With the RX 7600 and RTX 4060 Ti launches behind us now. I did have a fourth card come in around the same time. Gigabyte sent over their RTX 4070ti Gaming OC. The RTX 4070ti Gaming OC isn’t their highest-end RTX 4070 Ti, they do have the two Aurus cards as well. But it is their highest-end Gigabyte branded card which, unlike their Eagle or Windforce models, it does incorporate some RGB lighting that goes beyond just backlit branding and it is also overclocked so I’m excited to see how it compares to the other RTX 4070 Ti’s that we have taken a look at. So let’s dive in check out the card then put it to the test!
Product Name: Gigabyte RTX 4070ti Gaming OC
Review Sample Provided by: Gigabyte
Written by: Wes Compton
Amazon Affiliate Link: HERE
|
Specifications |
|
|
Graphics Processing |
GeForce RTX™ 4070 Ti |
|
Core Clock |
2640 MHz (Reference Card: 2610 MHz) |
|
CUDA Cores |
7680 |
|
Memory Clock |
21 Gbps |
|
Memory Size |
12 GB |
|
Memory Type |
GDDR6X |
|
Memory Bus |
192 bit |
|
Card Bus |
PCI-E 4.0 |
|
Digital max resolution |
7680x4320 |
|
Multi-view |
4 |
|
Card size |
L=336 W=140 H=58 mm |
|
PCB Form |
ATX |
|
DirectX |
12 Ultimate |
|
OpenGL |
4.6 |
|
Recommended PSU |
750W |
|
Power Connectors |
16 pin *1 |
|
Output |
DisplayPort 1.4 *3 HDMI 2.1 *1 |
|
Accessories |
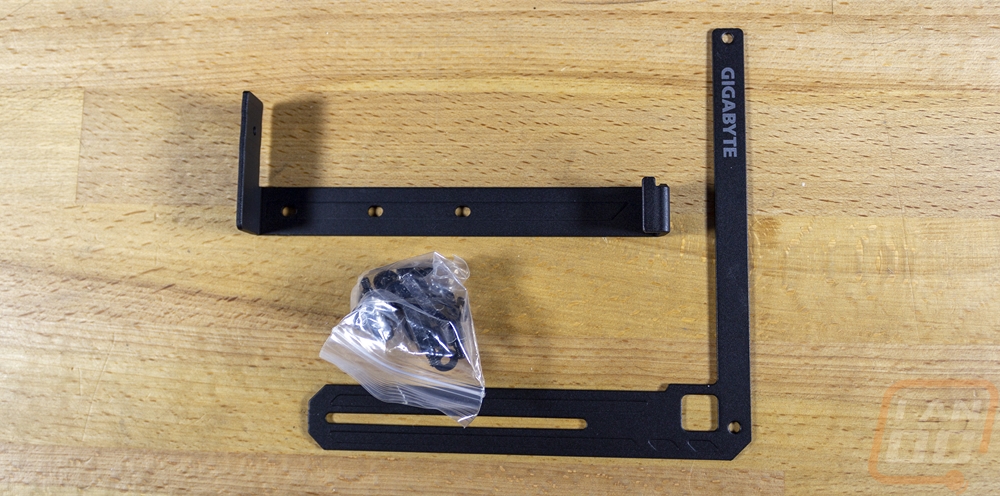
1. Quick guide 2. Warranty registration 3. Anti-sag bracket 4. Anti-sag bracket installation guide 5. One 16-pin to two 8-pin power adaptor |
|
Warranty |
4 Years Warranty (Online registration required) |
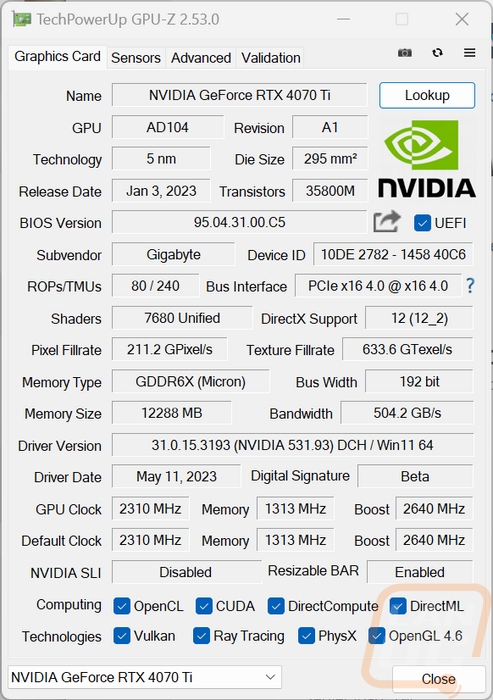
Before getting into testing I did also run GPUz to double-check that our clock speeds match up with the specifications. The Gigabyte RTX 4070 Ti Gaming OC matched up with its specifications which list it as having a boost clock of 2640 MHz. The stock clock speed of the RTX 4070 Ti which we saw on our Asus TUF is 2610 MHz so the Gaming OC does have an overclock, but it is a very small one. It’s a lot lower than the Suprim X which has a boost clock of 2775 MHz. Beyond that, this documents the BIOS revision of the card when tested as well as the driver which was 531.93.
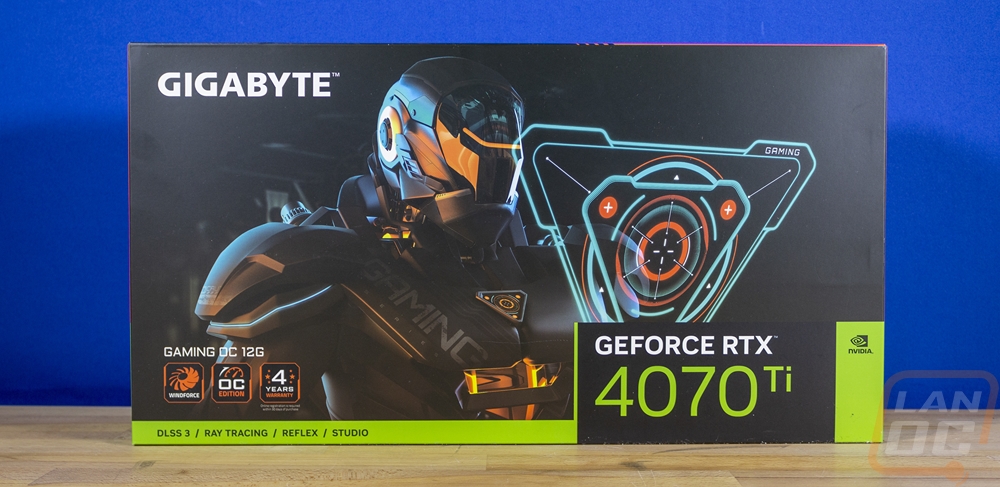
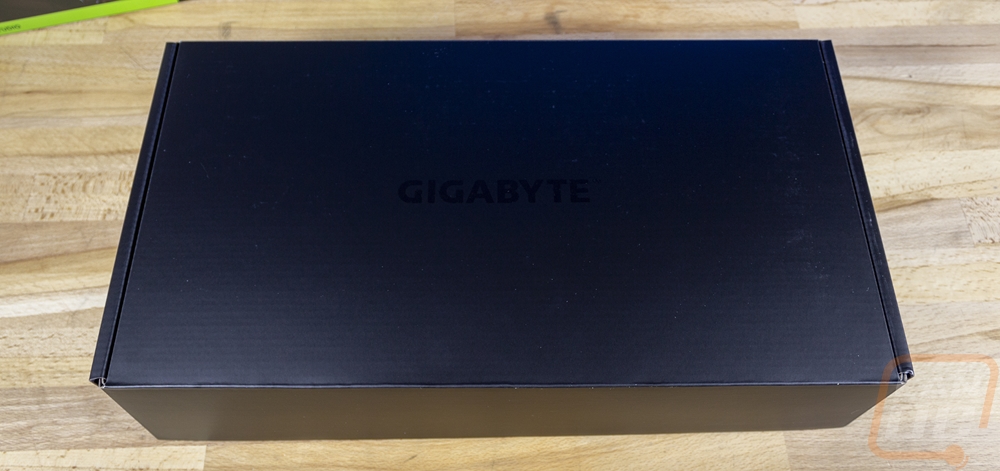
Packaging
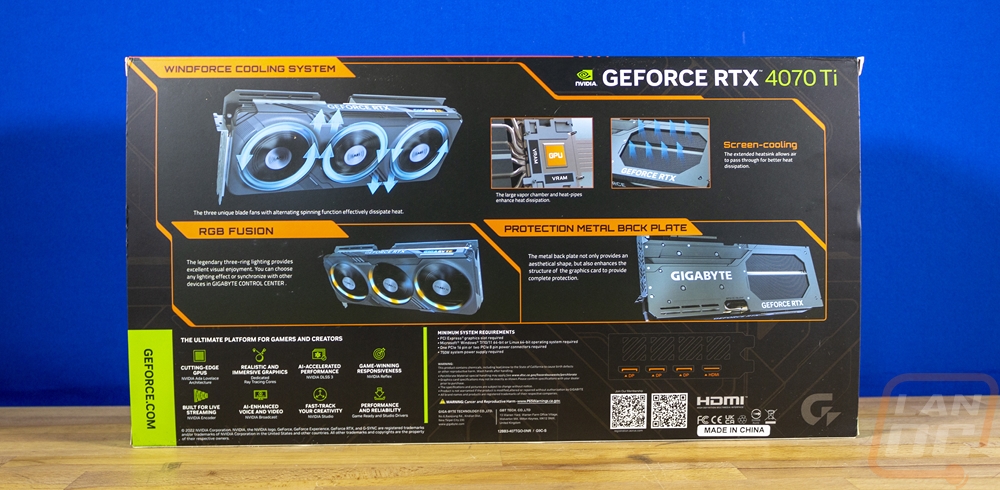
The box for the Gigabyte RTX 4070 Ti Gaming OC has a black background and along the bottom the standard Nvidia wrap around which gives it that green stripe so it matches all Nvidia cards on the shelf as well as the RTX 4070 Ti model name in the bottom right corner. They have the Gigabyte branding opposite that in the top left and the bottom left has the Gaming OC 12G model name but it's in a surprisingly small font. Under that Gigabyte had three badges that show the cards 4-year warranty, that it is overclocked, and that this card has their Windforce cooling. On the black background, I would prefer to see a big picture of the card across the front but they have a robot or a man in a suit with “gaming” across the chest. The back of the box does have pictures of the card at least so that is good. There are five pictures in total that show off the RGB lighting, the metal backplate, the way that Windforce fan directions work, and even a rendering showing how the large vapor chamber and heatpipes handle the heat from the VRAM and GPU.
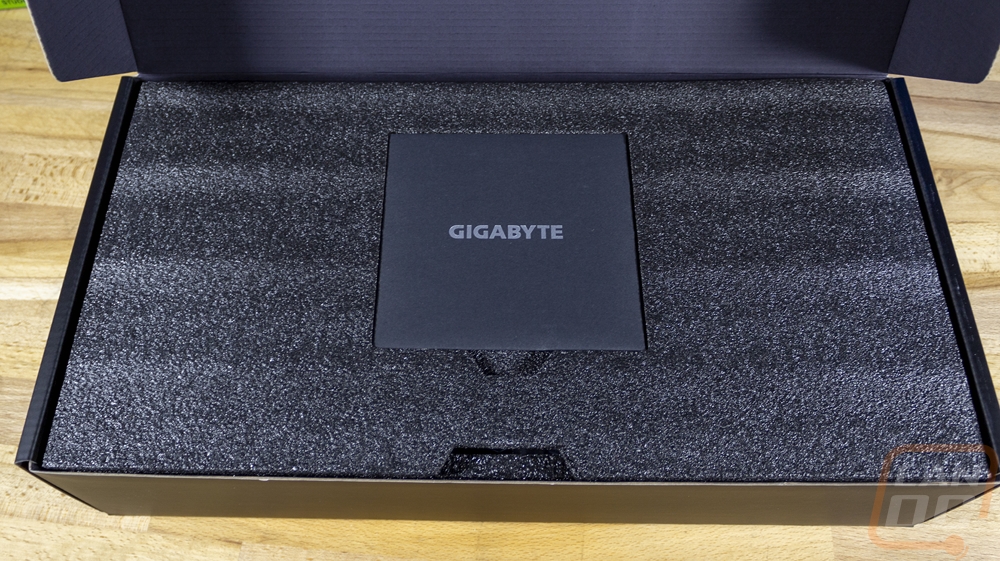
The outer box slides off and you have a black box inside with the Gigabyte brand printed on top in black. This box opens up and the first thing you see is a layer of foam with a black envelope on top with the Gigabyte brand name again. Once you move the foam you will find the Gigabyte RTX 4070 Ti Gaming OC wrapped up in a static protective bag and sitting in a thick foam tray that is cut out to fit the card and its accessories.
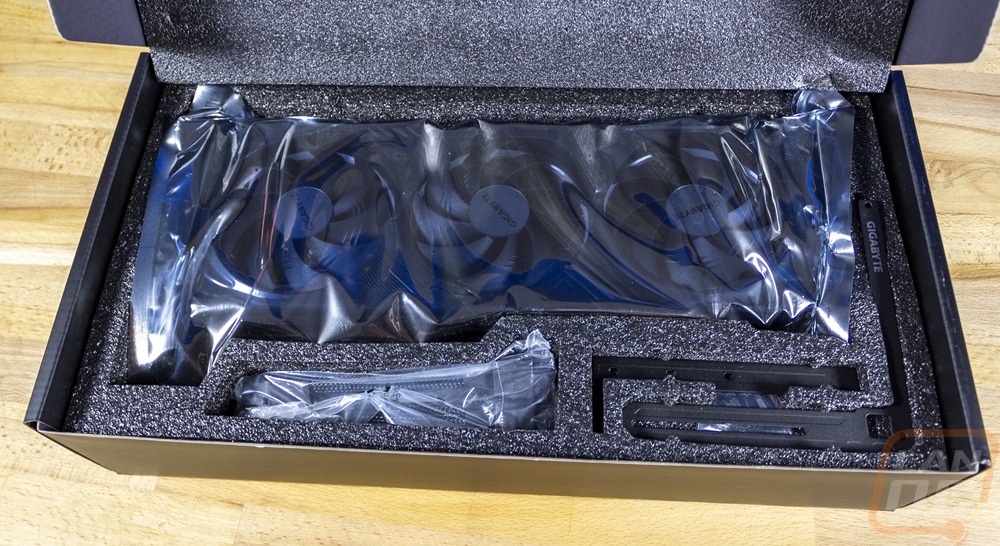
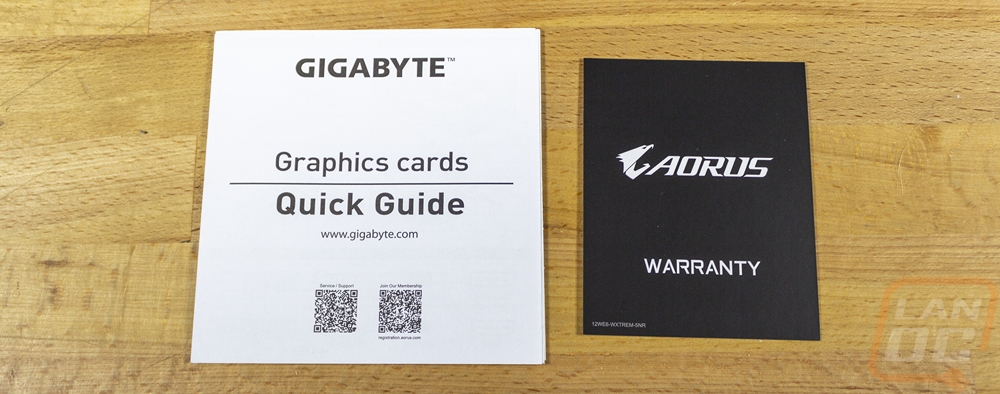
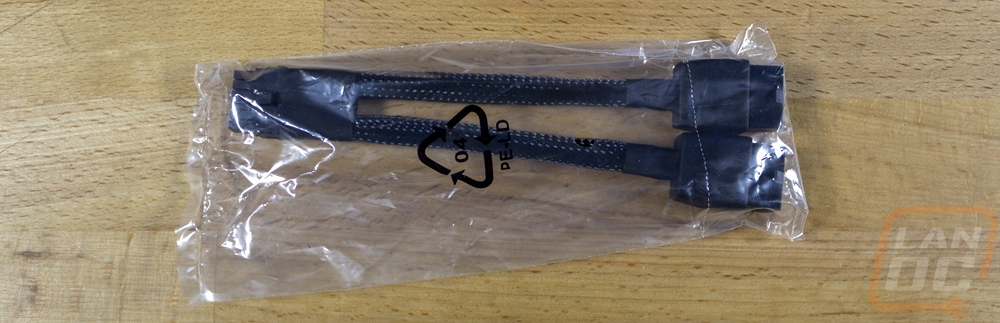
For documentation, you get a generic quick guide for installing the card as well as a warranty paper with information on the warranty. The Gigabyte RTX 4070 Ti Gaming OC comes with two accessories. One is an anti-sag bracket which has the Gigabyte brand name on it. This comes in two pieces along with a bag of screws and spacers to install it. It bolts to the PCI bracket and helps give longer cards like the Gigabyte RTX 4070 Ti Gaming OC a little extra support. This helps with sagging long-term and also keeps some pressure off of the PCIe slot as well. You also get the Nvidia power adapter that adapts the 12VHPWR connection on the Gigabyte RTX 4070 Ti Gaming OC to two 8-pin PCIe power plugs for anyone who doesn’t have a power supply that has the new 12VHPWR connection.
Card Layout and Photos
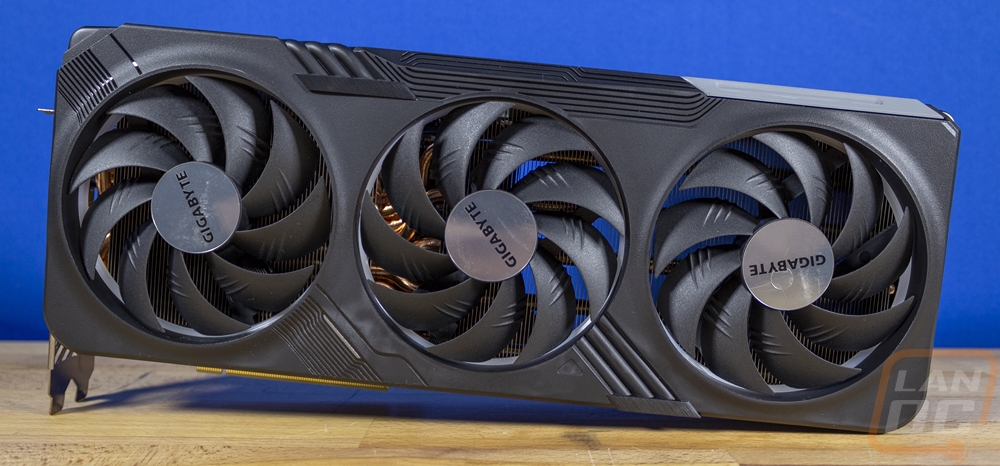
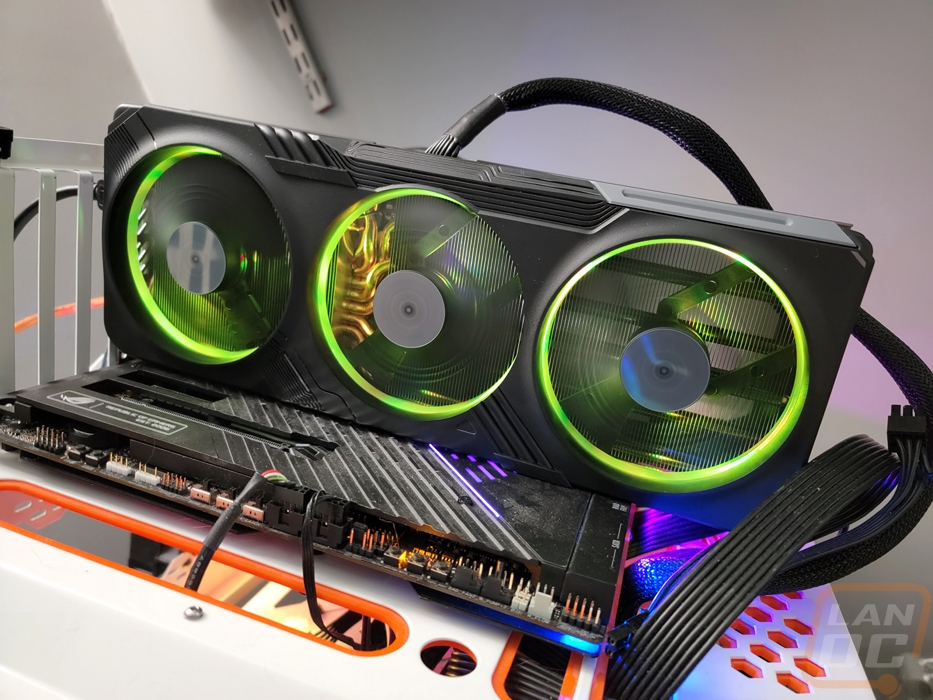
The Gigabyte RTX 4070ti Gaming OC has a triple fan Windforce cooler to keep things cool. The fan shroud around all of that is black plastic and has a textured finish across most of the shroud. For accents rather than using any colors, Gigabyte has integrated a few different shapes into the shroud. Around the far left fan, there are skinny groves at an angle and the top left corner has rounded groves as well. Those same rounded groves look like pipes and there are three running at the bottom and top near the center fan. Then across that they also have horizontal groves up at the top as well. I would personally prefer a simpler design, it feels a little like they have just thrown random shapes at the card but because it is all blacked out it isn’t too in your face.
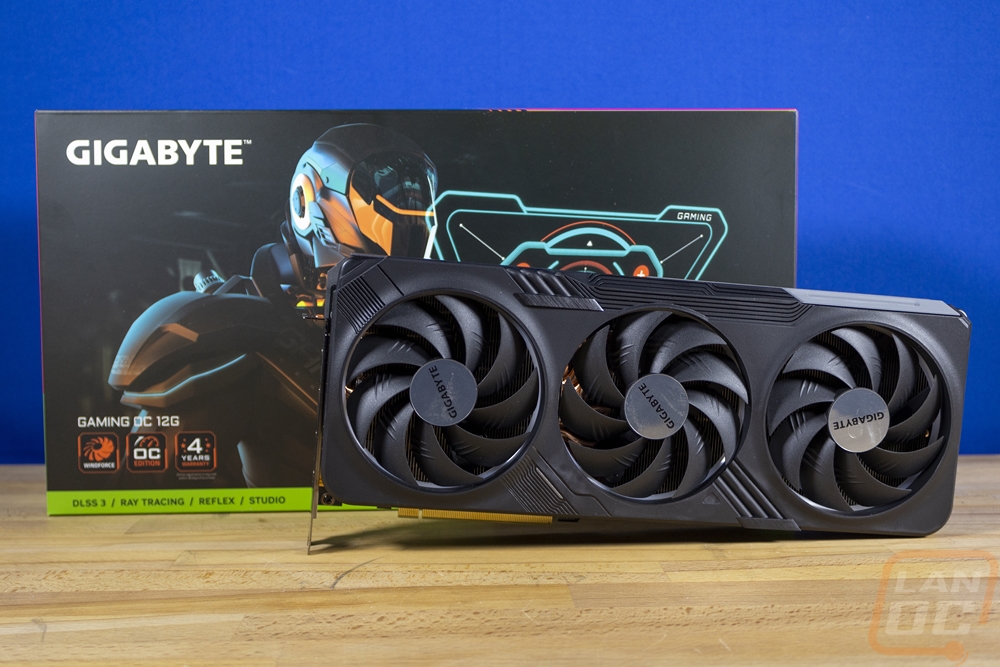
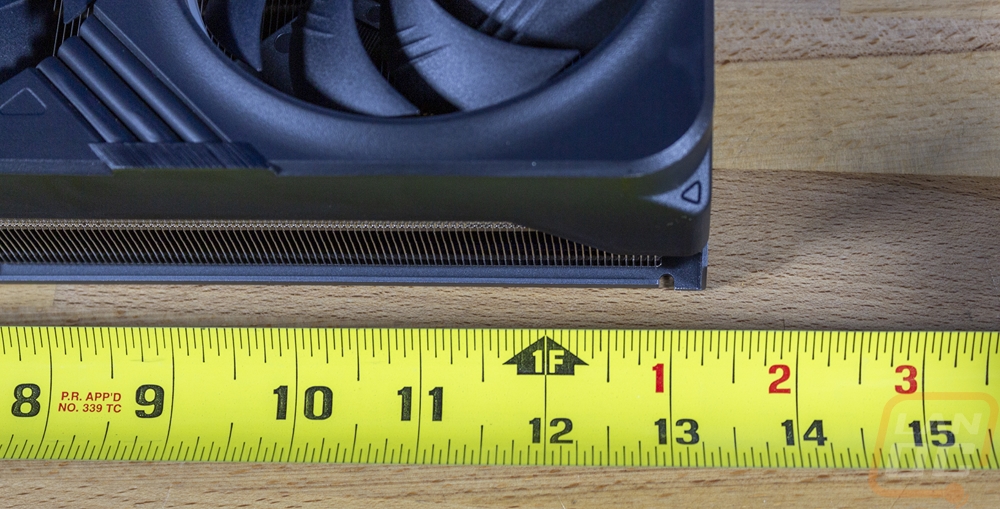
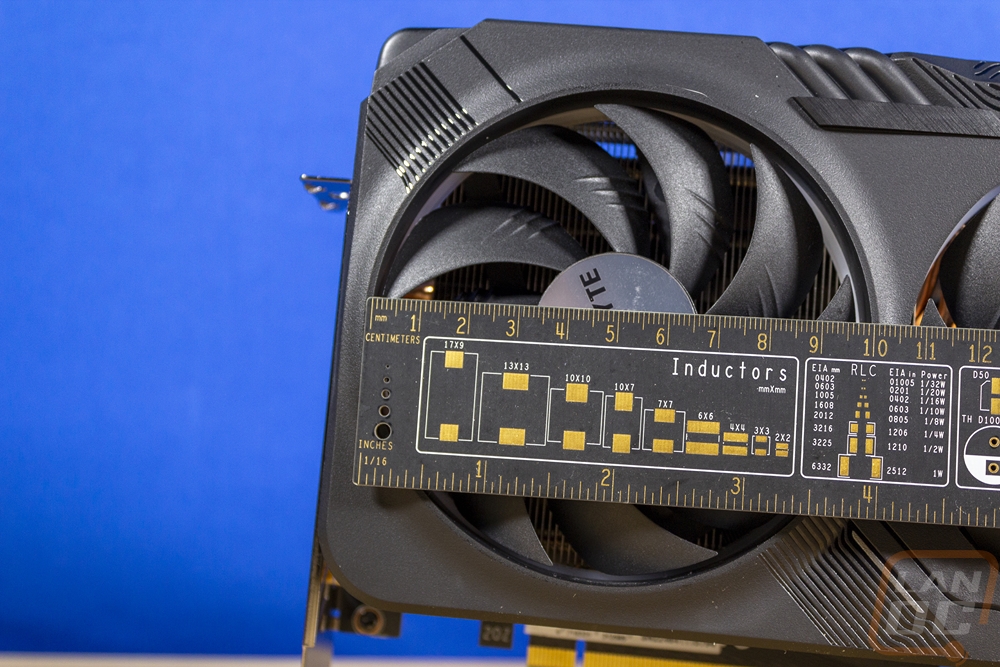
The Gigabyte RTX 4070ti Gaming OC isn’t a small card by any means. It is 336 mm long which is close to 13 ¼ inches and 140 mm tall which is 30 mm over the “standard” card height. Then for thickness it is 58 mm which while it has a two-slot bracket is a full 3 slots wide once you account for the fan shroud sticking out past the bracket. This is similar in size to the Suprim X 4070 Ti that I previously reviewed in length at least but that card is 5mm taller and 10mm thicker. At this size, you do want to make sure that everything is going to fit in your card, especially if you are using the included 12VHPWR adapter.
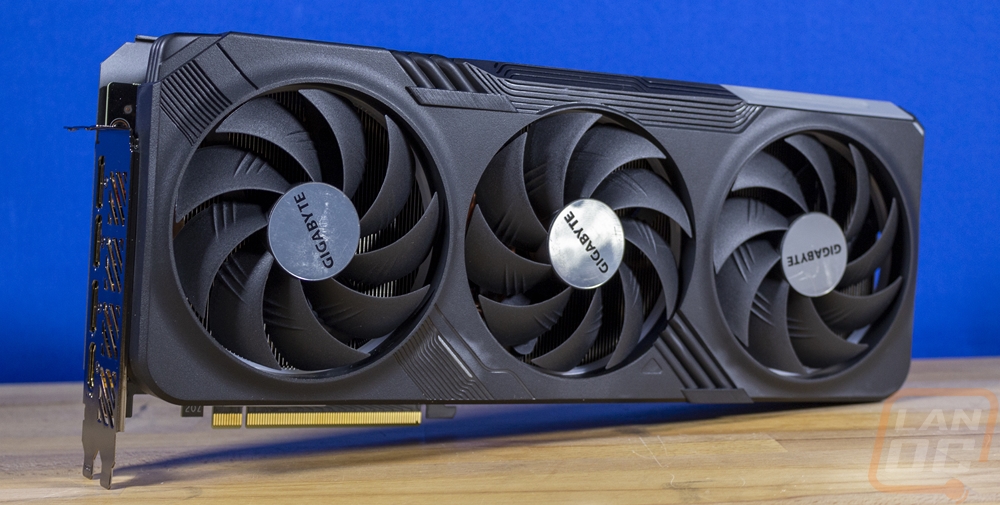
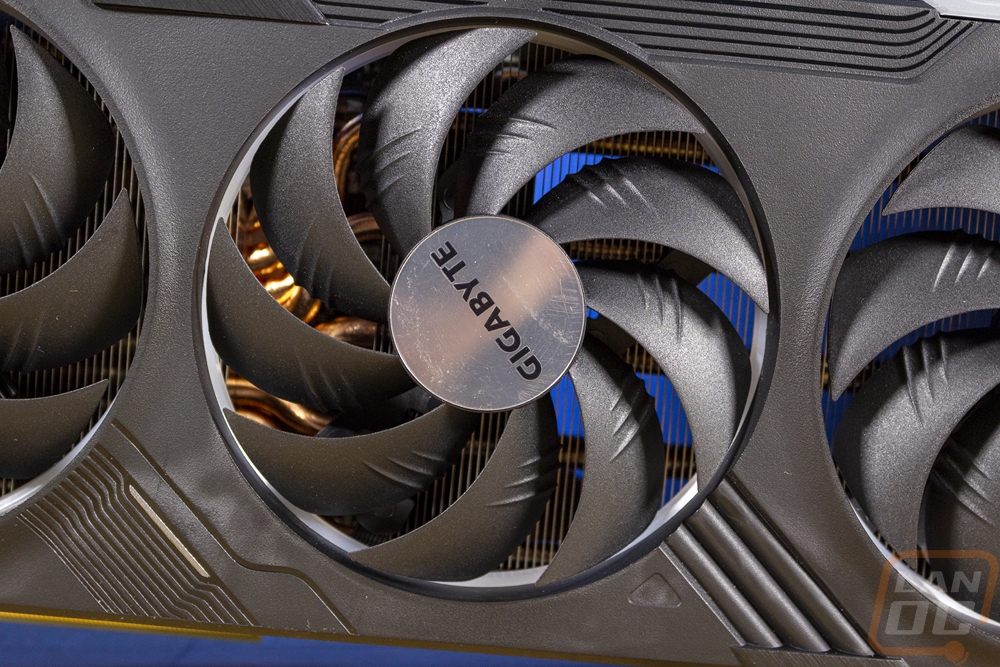
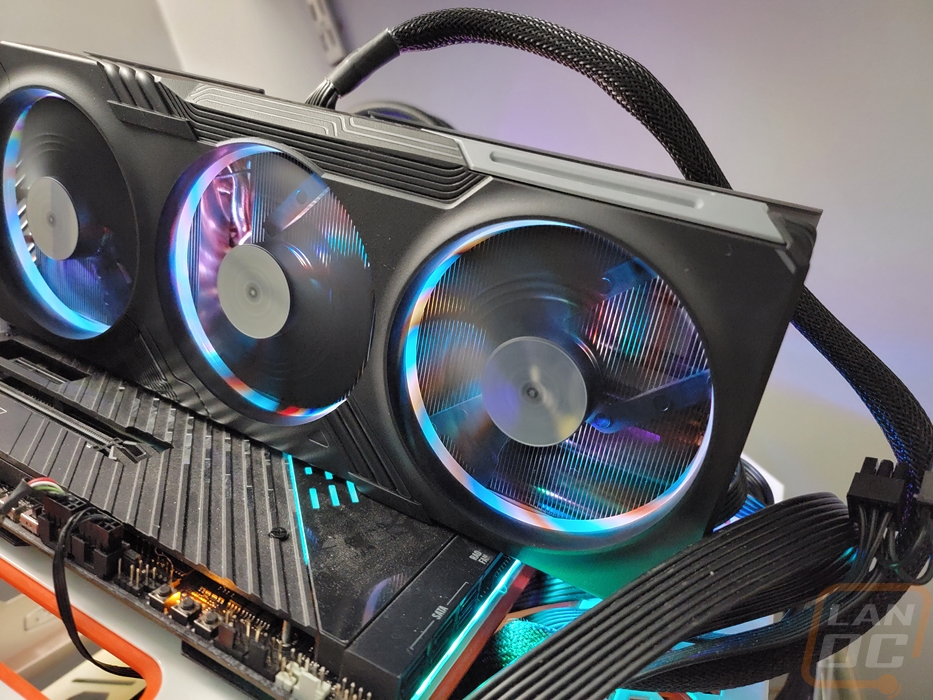
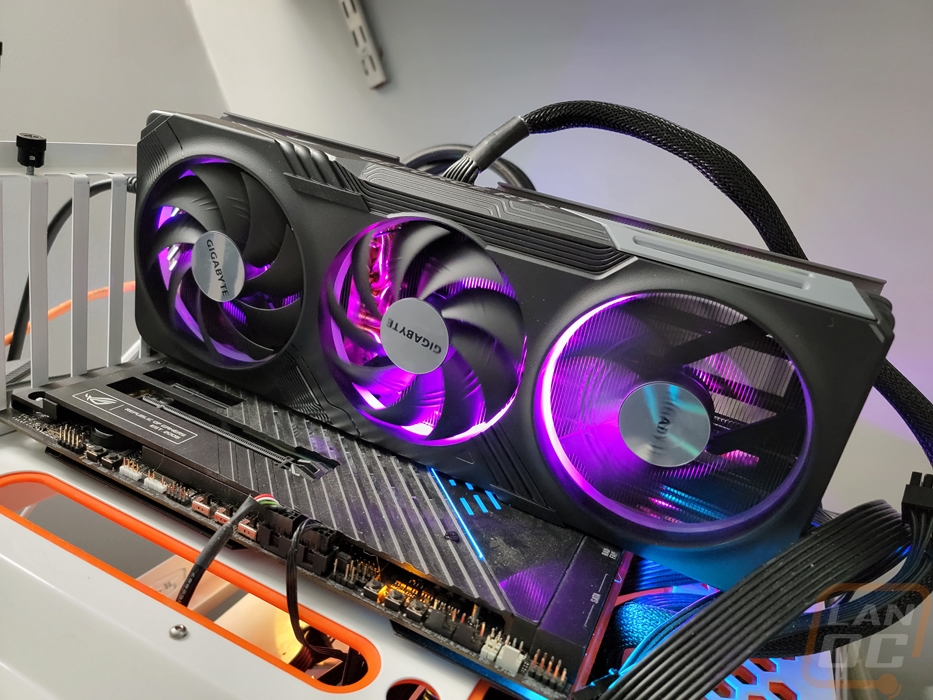
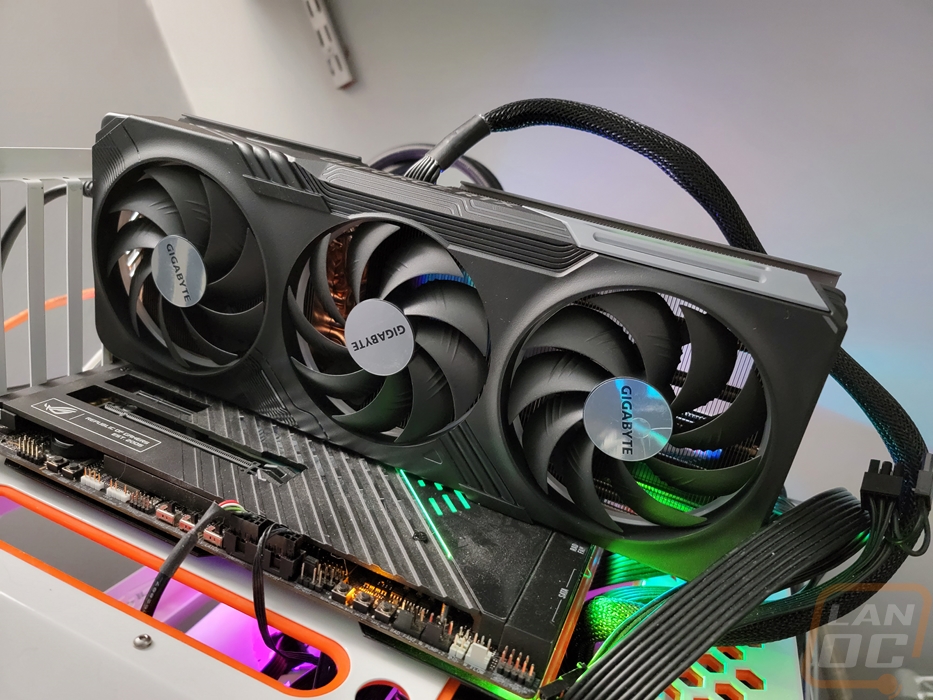
If you haven’t seen Gigabytes Windforce cooler before they do something unique that most other coolers don’t do. The triple fan design can cause a lot of turbulence around the middle fan and turbulence hurts cooling and creates noise. So you can see that the two outer fans have the same shape but the center fan is different. That is because it spins the opposite direction as the other two fans, this helps it sync up with the air coming off from the other two fans. The fan shroud also is raised for the two outer fans but that seems to be more of a styling choice than functional. The center of each fan has a large chromed sticker with the Gigabyte branding on it. Another thing to point out because I haven’t seen this on a card before, our specific card has a few mold defects visible on the plastic shroud which show up at the lighter spots in the plastic below that center fan, functionally they aren’t hurting anything but I am surprised that it wasn’t caught in manufacturing.
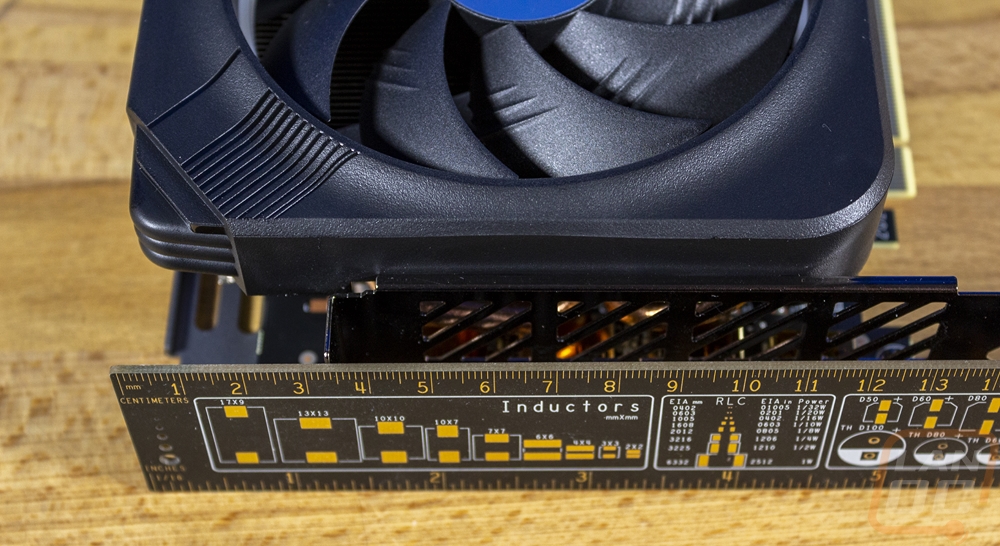
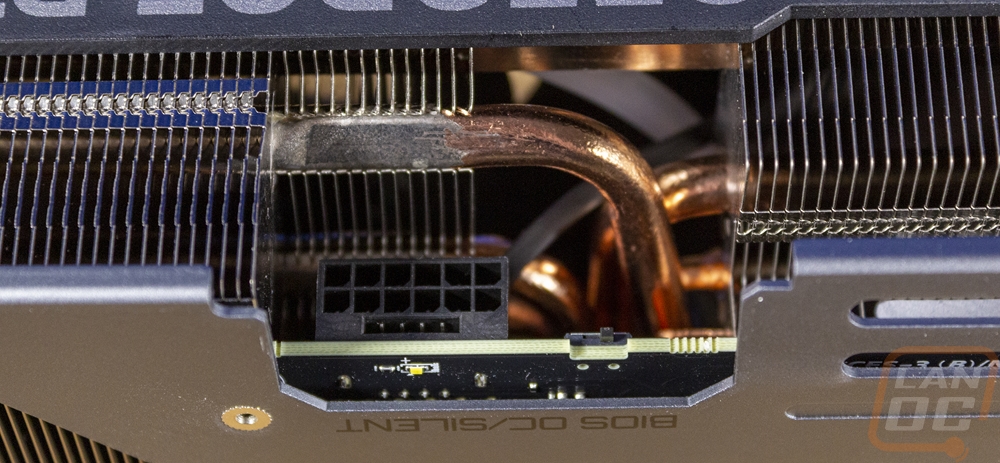
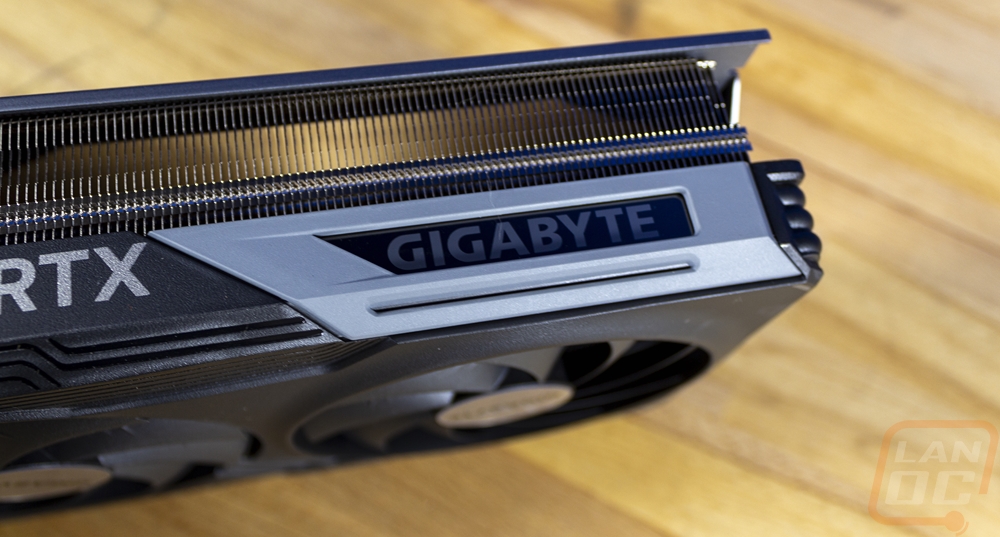
Up on the top edge of the card, we have a few things going on. Just past the middle, the Gaming OC has its power connection which like with the other RTX 4070 Ti’s is the new 12VHPWR connection which works with the included dual 8-pin adapter. Normally this connection would be flipped around upside down with the clip towards the PCB to leave extra room to access the clip but they didn’t do that here. The cooler however which sticks up well past the plug is still close to the connection like it would be if it was flipped. This makes it very tight to unplug this cable. Also in that area, Gigabyte has added a status LED to let you know if the connection isn’t plugged in and next to the plug is also a BIOS switch that switches between OC and Silent modes. The top of the card has the GeForce RTX branding across the top which is printed on the black shroud in silver and then at the end there is a small silver accent which has the Gigabyte logo in it that is backlit with the addressable RGB LEDs. Both ends also have rounded tubes molded into the shroud which is interesting.
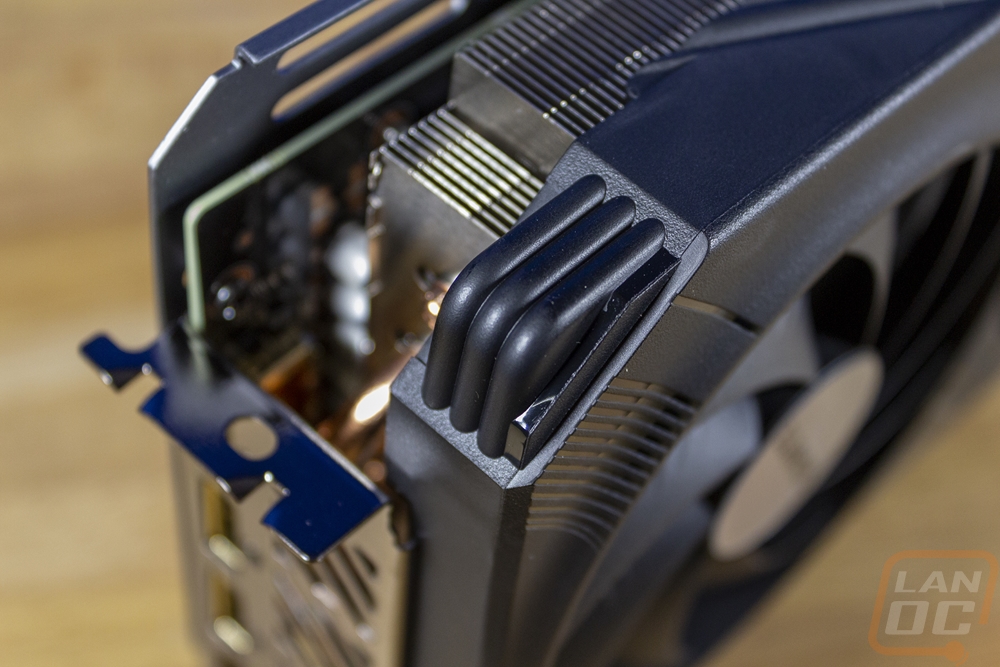
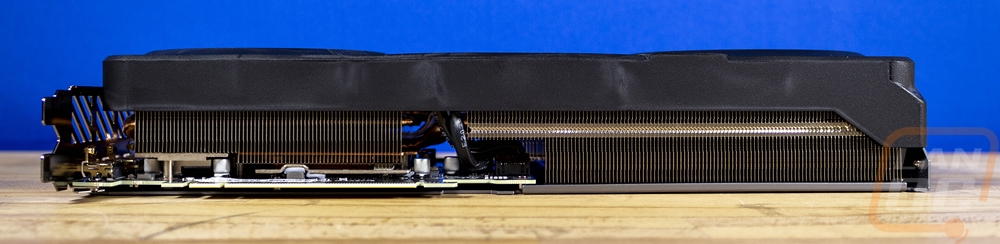
Looking around at the edges of the card we can get a better look at the cooler which Gigabyte has running the length of the card. The horizontal fin design pushes the air from the fans up out the top and down the bottom anywhere it can’t blow through and the top view especially gives us a great look at how thick the cooler is once you get past the PCB. There is a small gap in the heatsink where the heatpipes move around just past the GPU near the center. The end of the card has the metal backplate wrapped around for more strength and this has three screw holes which work with the included support bracket. The fan shroud wraps around here as well but we can see some of the copper heatpipes sticking out the end of the card. The weird plastic defects that we saw on the front of the fan shroud are also on the bottom of the shroud as well, but that is an area where no one will see them.
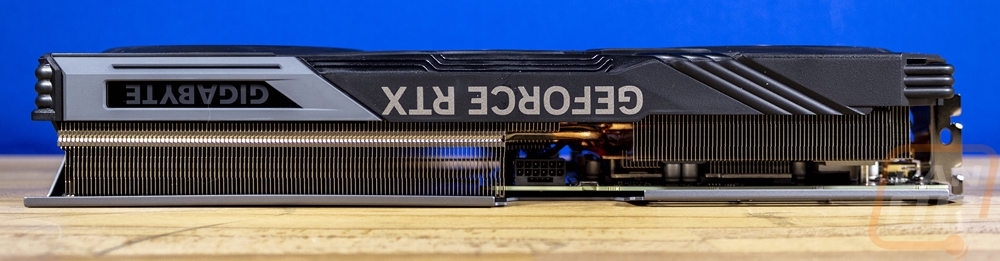
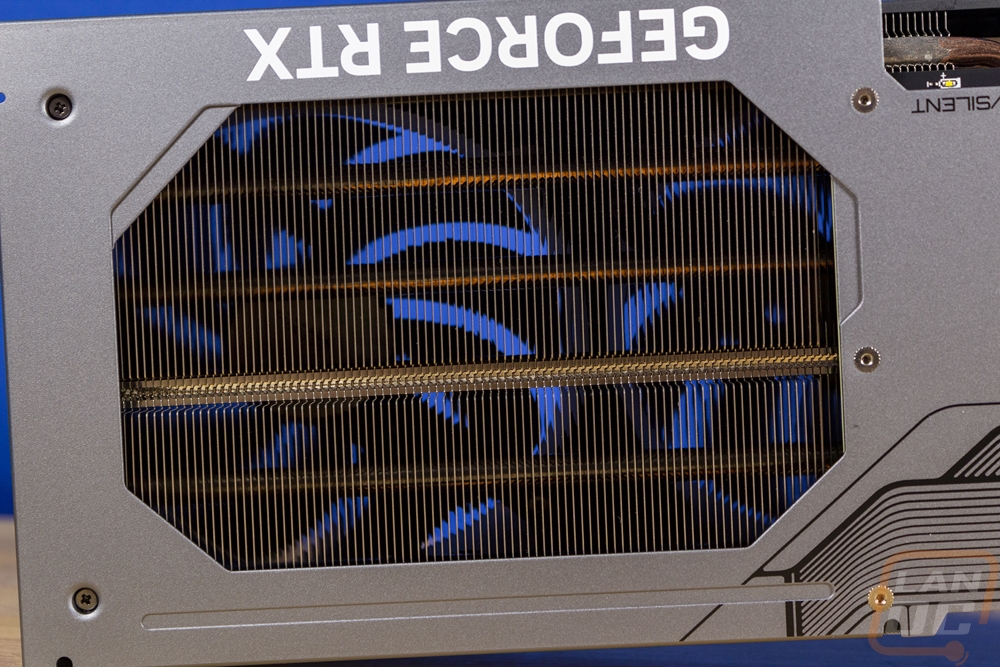
The back of the Gigabyte RTX 4070ti Gaming OC has a full-length metal backplate that has a dark grey finish. They have printed some black line accents that match some of the lines on the fan shroud and they also have the Gigabyte brand name and GeForce RTX in white, both of those are printed upside down so they are readable when installed in most cases. The backplate has a huge opening on the left side, this exposes the heatsink as it goes well past the end of the PCB and allows for a blow-through design. You can see the full far-end fan from the front and half of the center fan. You can also see the copper heatpipes as well that help pull heat down to this end. That opening is 130 mm long itself. The backplate has a notched area up top for the power connection and the BIOS switch which is also labeled letting you know which direction the switch needs to be for OC Mode and Silent mode which is nice. There are also slotted vents along the top to help have some blow-through for the heatsink that is up above the top of the PCB. The backplate does wrap around at the top and bottom which helps give it even more strength as well which helps with a big card like this.
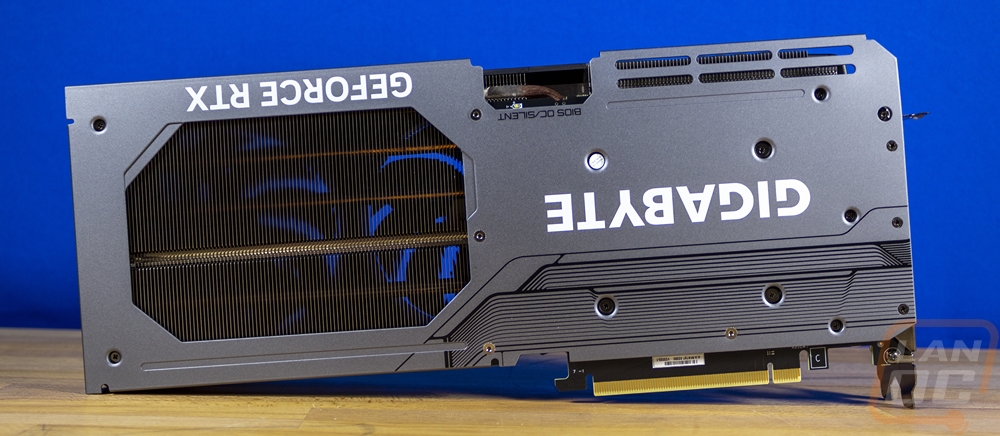
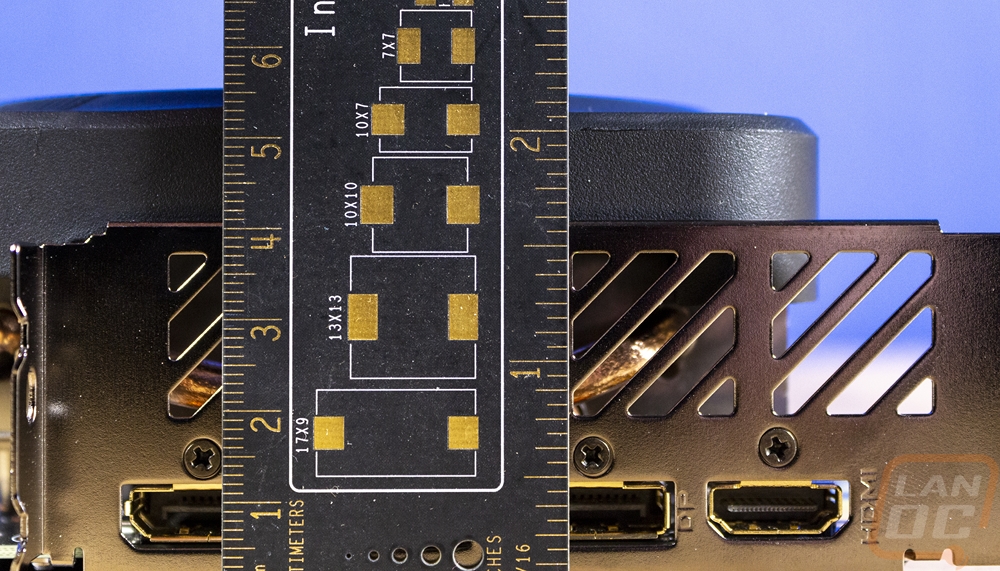
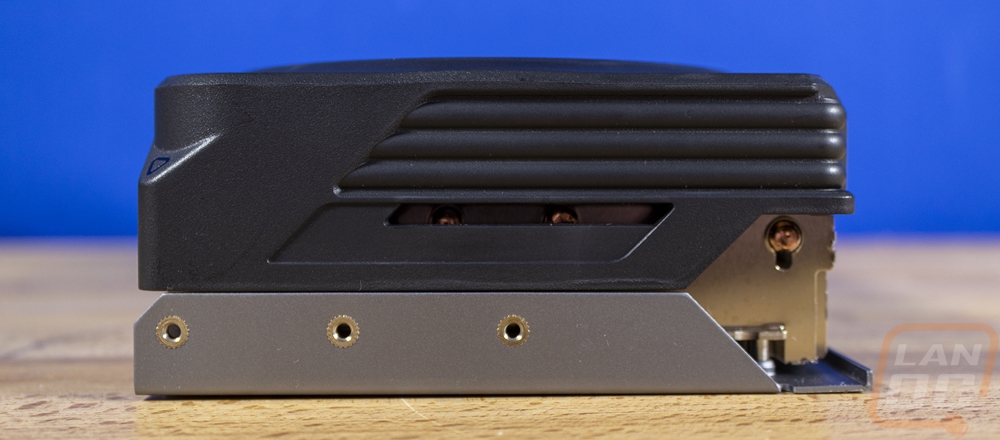
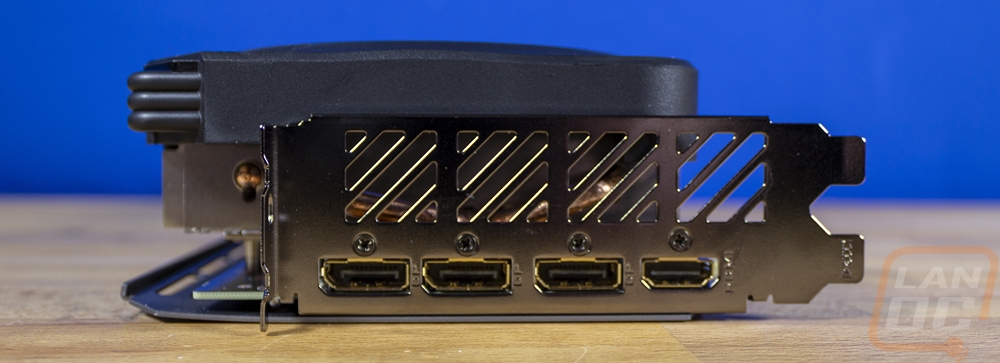
For display connections, the Gigabyte RTX 4070ti Gaming OC has the “standard” these days which is three DisplayPort connections and one HDMI and they have kept things sorted with the DisplayPorts all together and the HDMI down at the bottom. The Gigabyte RTX 4070ti Gaming OC isn’t designed to push air to or out the PCI bracket but Gigabyte has still included some ventilation here with four squares of slots. The bracket itself has a chromed finish, I do wish that they would consider blacking this out which would better match the card and give a little more of a premium look/feel.
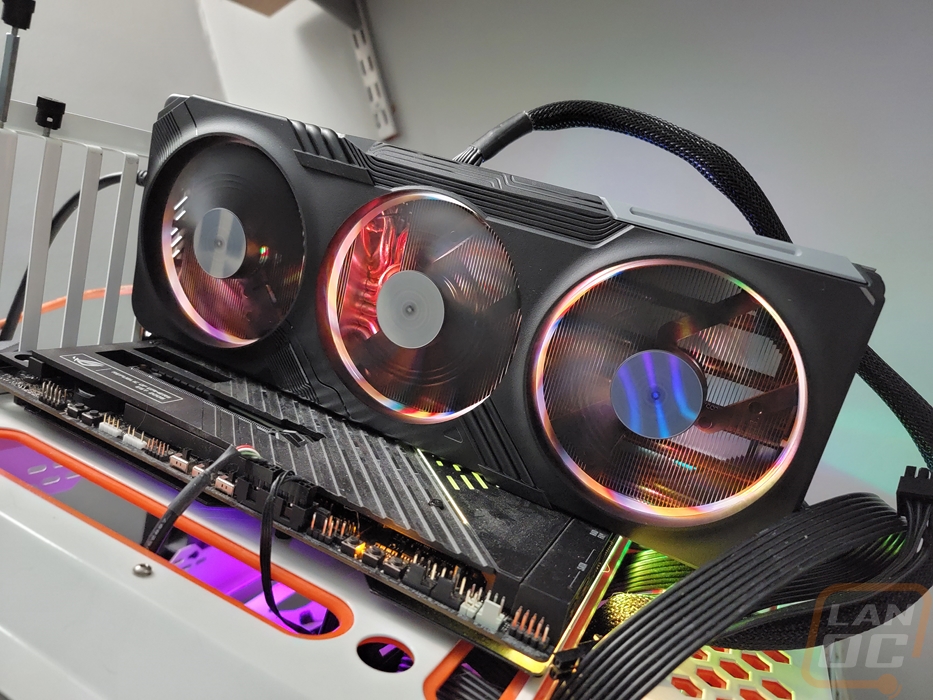
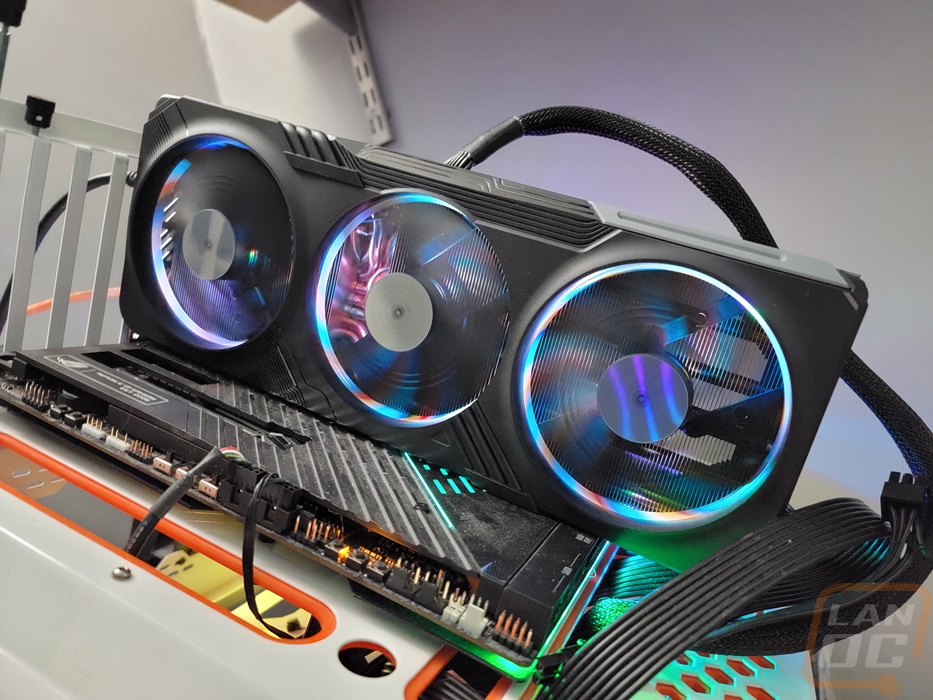
In addition to the Gigabyte logo which is backlit up on the top edge the three fans also have RGB lighting around them as well but for the Gaming OC the lighting that Gigabyte went with is interesting. They have addressable RGB lighting rings at the back of each opening and by default, this has a very unique effect that is based on fan speed. You can see it in the pictures below where the first picture was at 100% fan speed, there are a few in the 50% fan speed range, then as it slows down even more you can see how the lighting doesn’t form a complete ring. This looks great when mixing colors because of the effect which is almost like a strobe.
Test Rig and Procedures
CPU: Intel Core-i9 13900K – Live Pricing
PL1=PL2: 253, τ: 56 / 307A
Motherboard: Asus Z790 Extreme – Live Pricing
Cooling: Corsair H100i Elite LCD Display - Live Pricing
Noctua NT-H1 Thermal Paste - Live Pricing
Memory: Crucial 32GB Kit (2 x 16GB) DDR5-5600 UDIMM– Live Pricing
Storage: Sabrent Rocket Q4 2TB – Live Pricing
Power Supply: Thermaltake Toughpower GF3 1000W- Live Pricing
Case: Primochill Wetbench - Live Pricing
OS: Windows 11 Pro 64-bit - Live Pricing
|
Our Testing Procedures |
|
|
3DMark |
All 3DMark-based tests are done using the most recent version. We test using all three versions of Fire Strike, Both Time Spy and Time Spy Extreme, and Speed Way. Tests to look at ray tracing performance are done with Port Royal when supported and for Nvidia cards that support DLSS, the DLSS subtest is also done at 1440p with the performance setting and DLSS 2.0 as well as a look at DLSS 1, 2, and 3 at 4K. |
|
Unigine Superposition |
1080p Extreme and 4k Optimized benchmarks along with the VR Future test are done. The VR test is done at the Oculus resolution |
|
VRMark |
Only the Blue room test is run |
|
CS:GO |
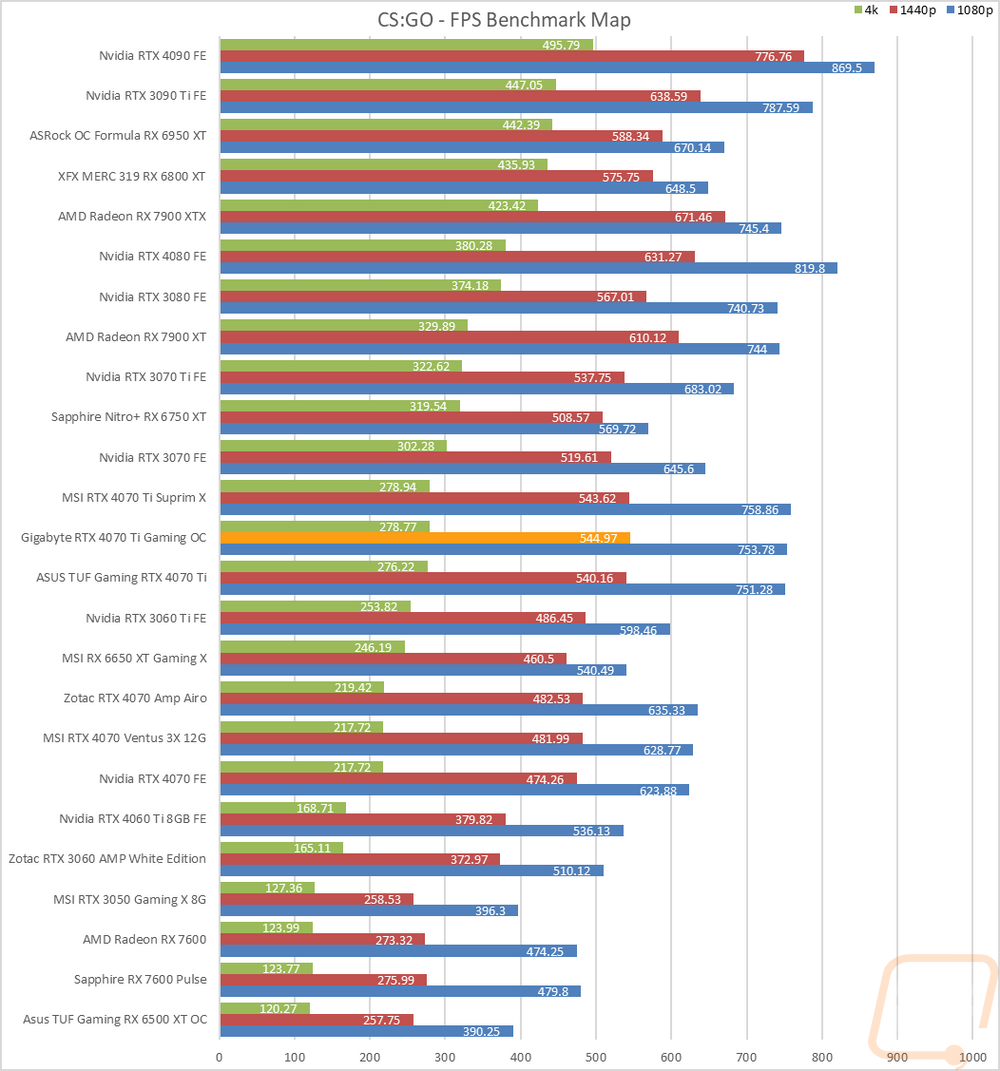
This test is done using the workshop map called CS:GO Benchmark. You can find more information at this link. https://www.gamingpcbuilder.com/how-to-install-csgo-fps-benchmark-map/ I test at 1080p, 1440p, and 4K resolutions. All auto settings are turned off and detail is set to their highest settings. shadow quality high, model texture detail high, shader detail very high, AA set to 16x, uber shaders enabled |
|
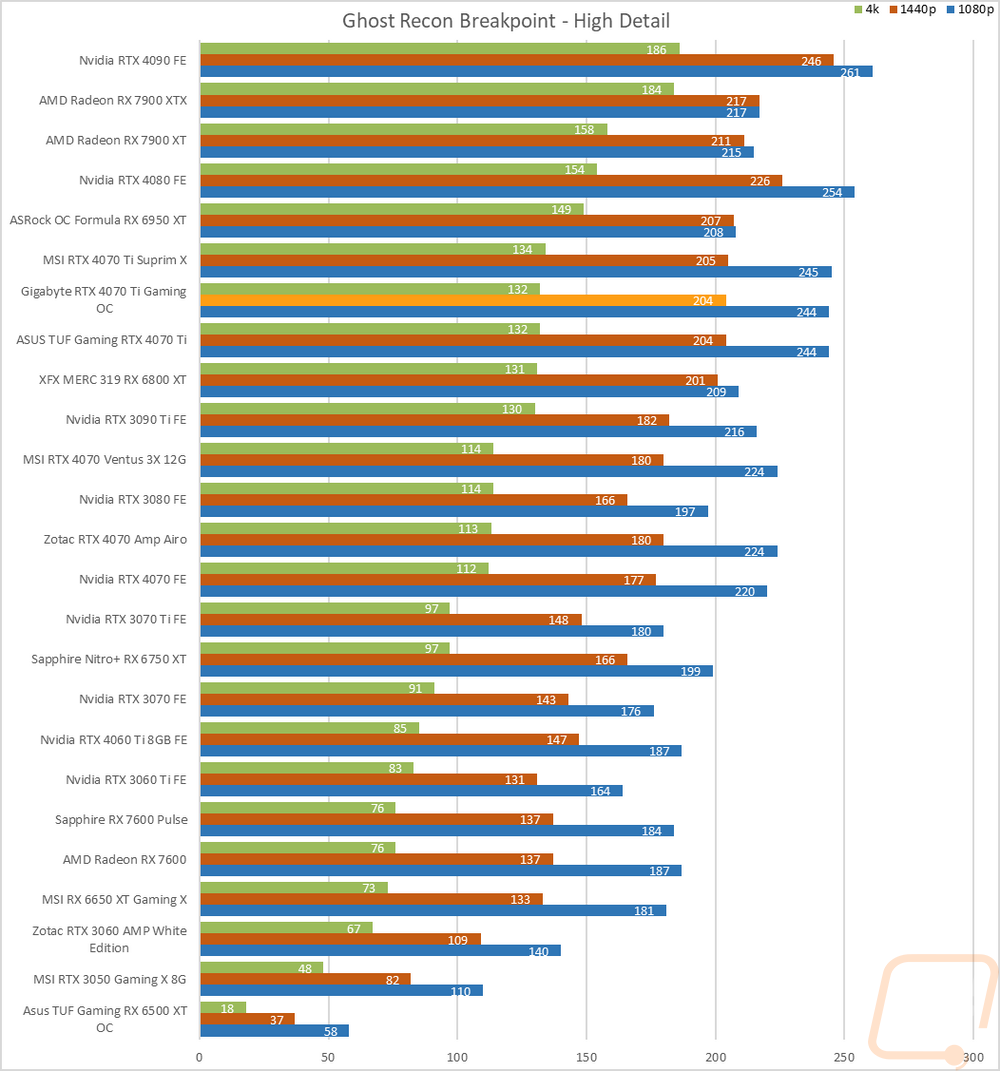
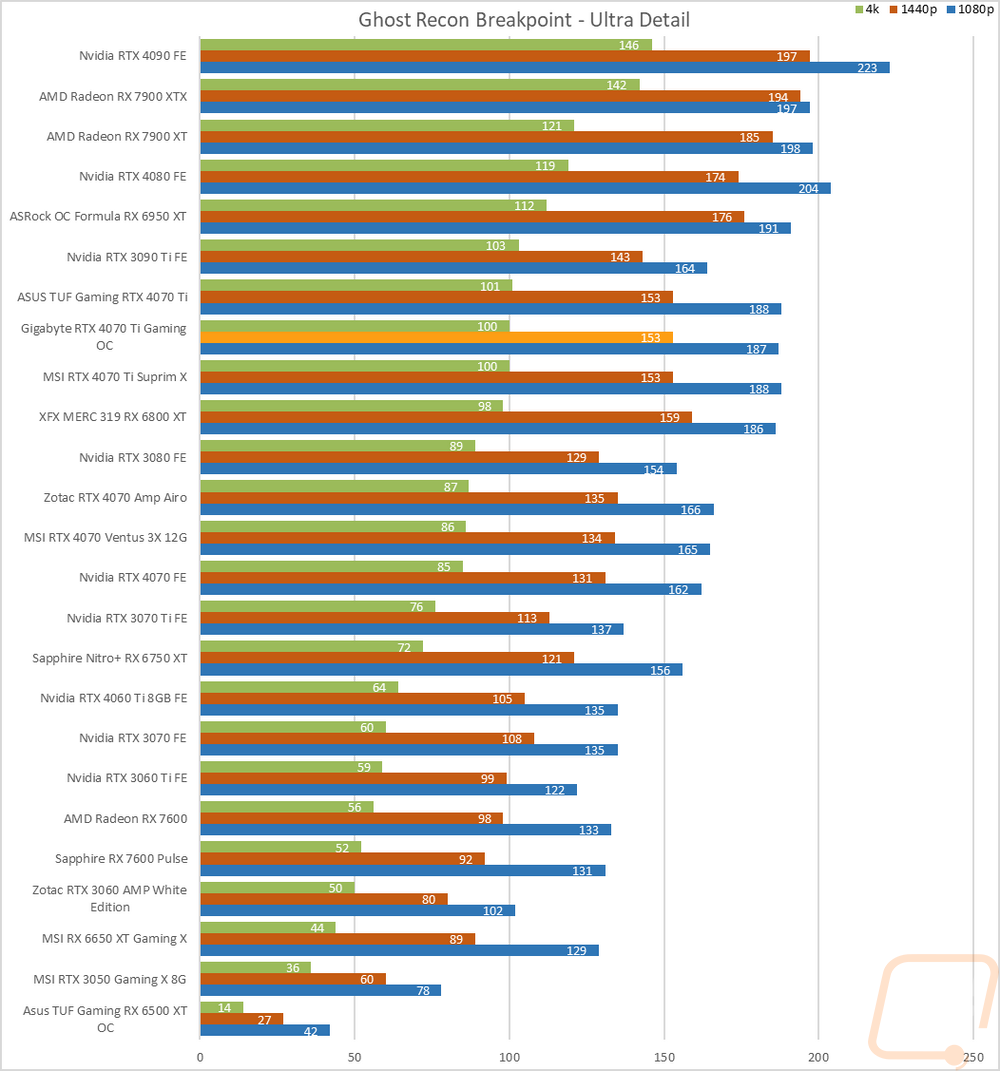
Ghost Recon Breakpoint |
Built-in benchmark tested at 1080p, 1440p, and 4k with the Ultra and Medium detail settings |
|
Watch Dogs: Legion |
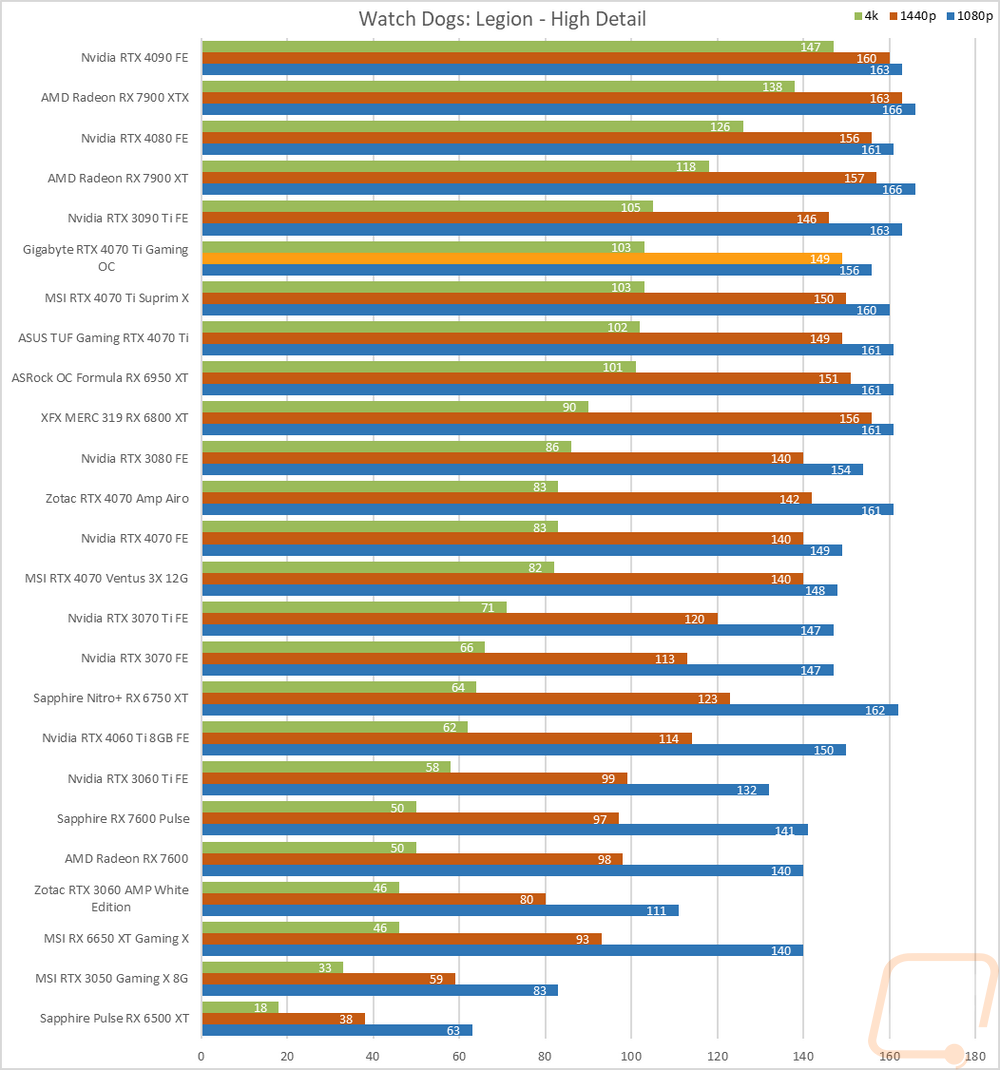
Built-in benchmark testing at ultra and high details. Tested at 1080p, 1440p, and 4k. I also do RTX and DLSS testing on Nvidia cards at 4K using the Ultra detail settings as a base as well. |
|
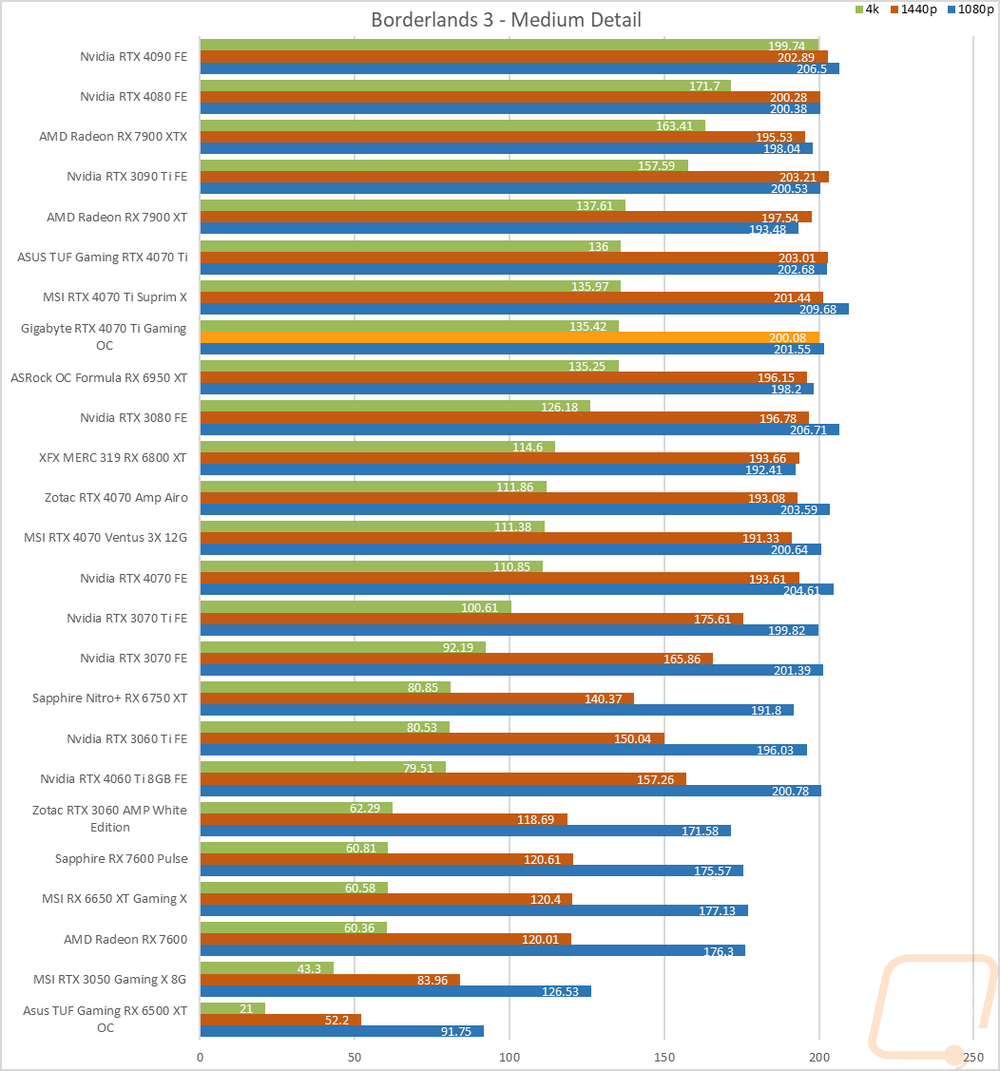
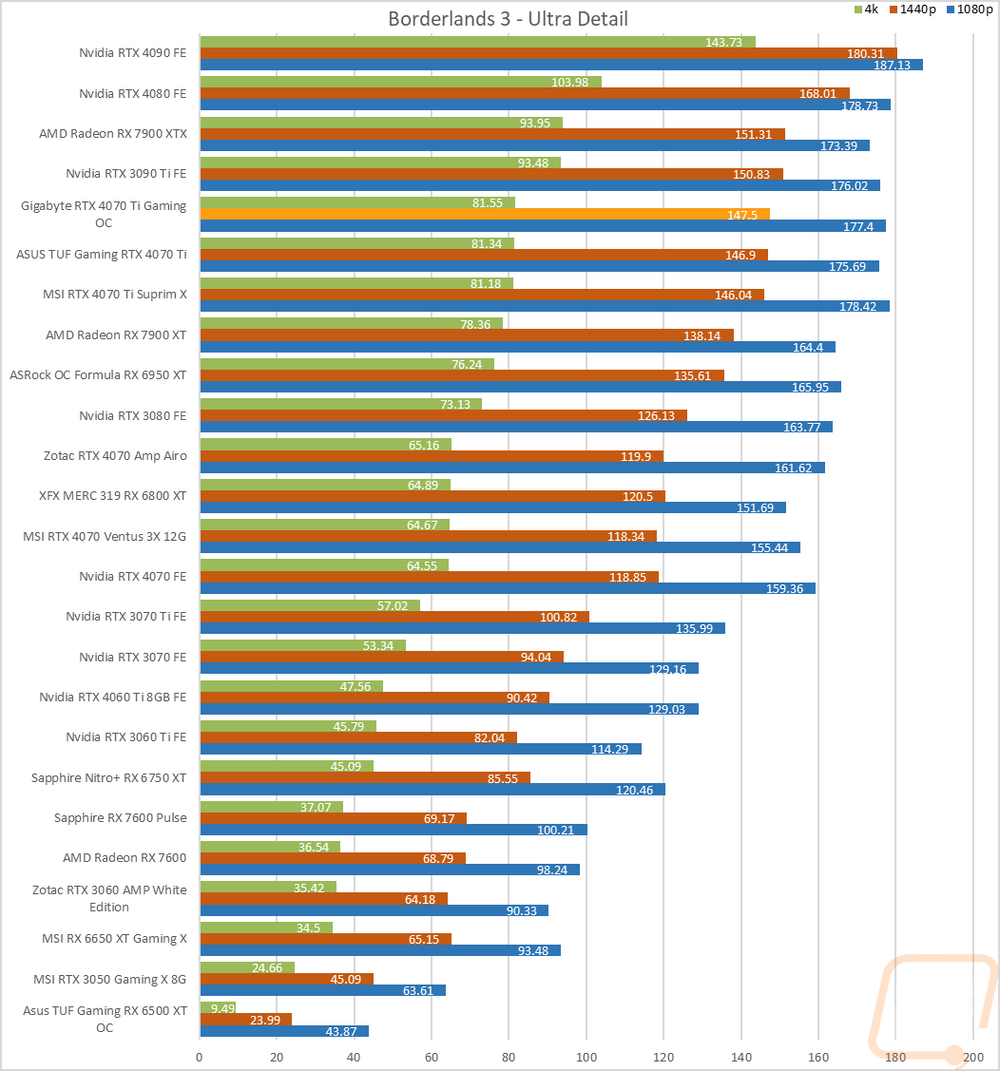
Borderlands 3 |
Built-in benchmark testing with the ultra detail setting and medium detail setting, done at full screen with default settings at 1080p, 1440p, and 4k on DX11 |
|
Metro Exodus |
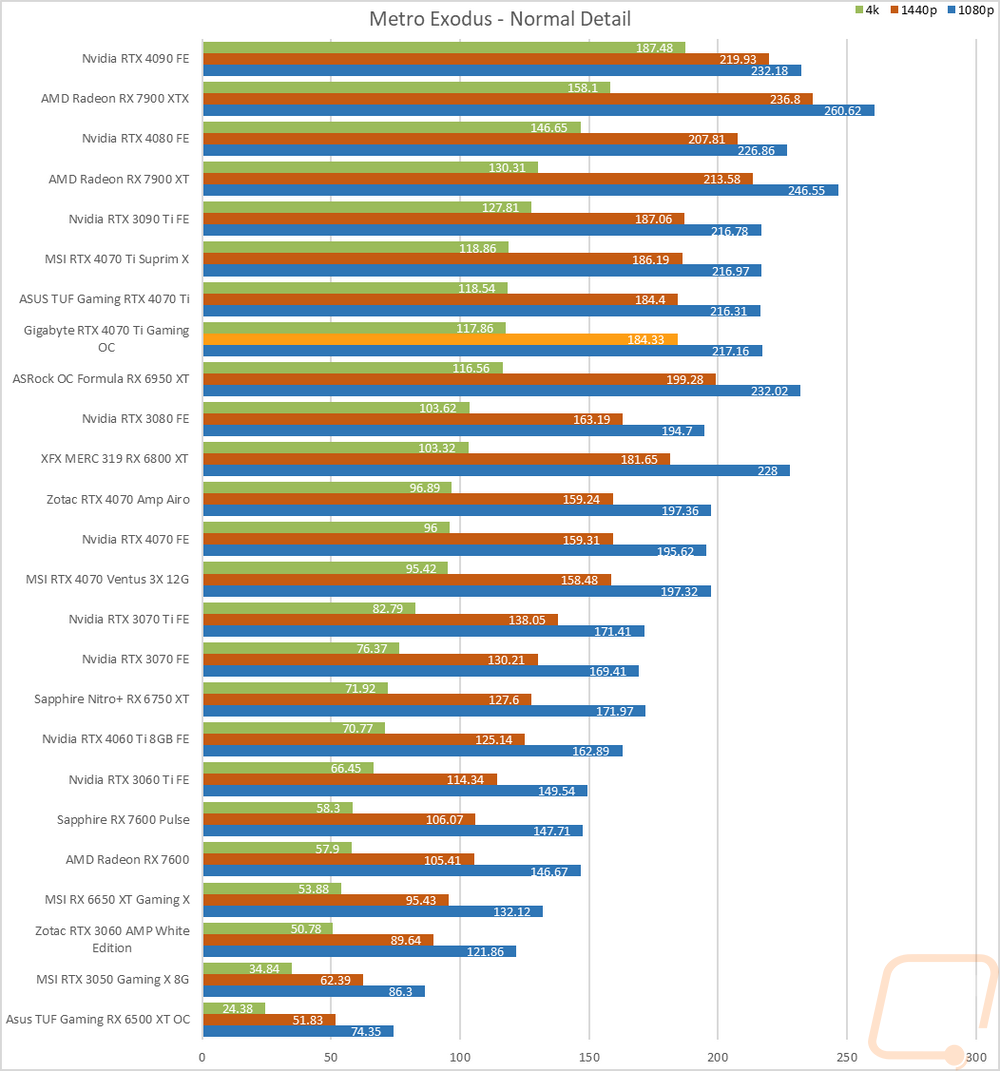
Using built-in benchmark, testing at ultra and normal details at 1080p, 1440p, and 4k. I also do RTX and DLSS testing at 4K with the ultra-detail base settings for Nvidia cards as well. |
|
World War Z Aftermath |
Built-in benchmark in DX11 testing both the Ultra detail and Medium detail levels at 1080p, 1440p, and 4K resolutions |
|
The Division 2 |
Built-in benchmark at Ultra detail with V-Sync turned off at 1080p, 1440p, and 4k resolutions. |
|
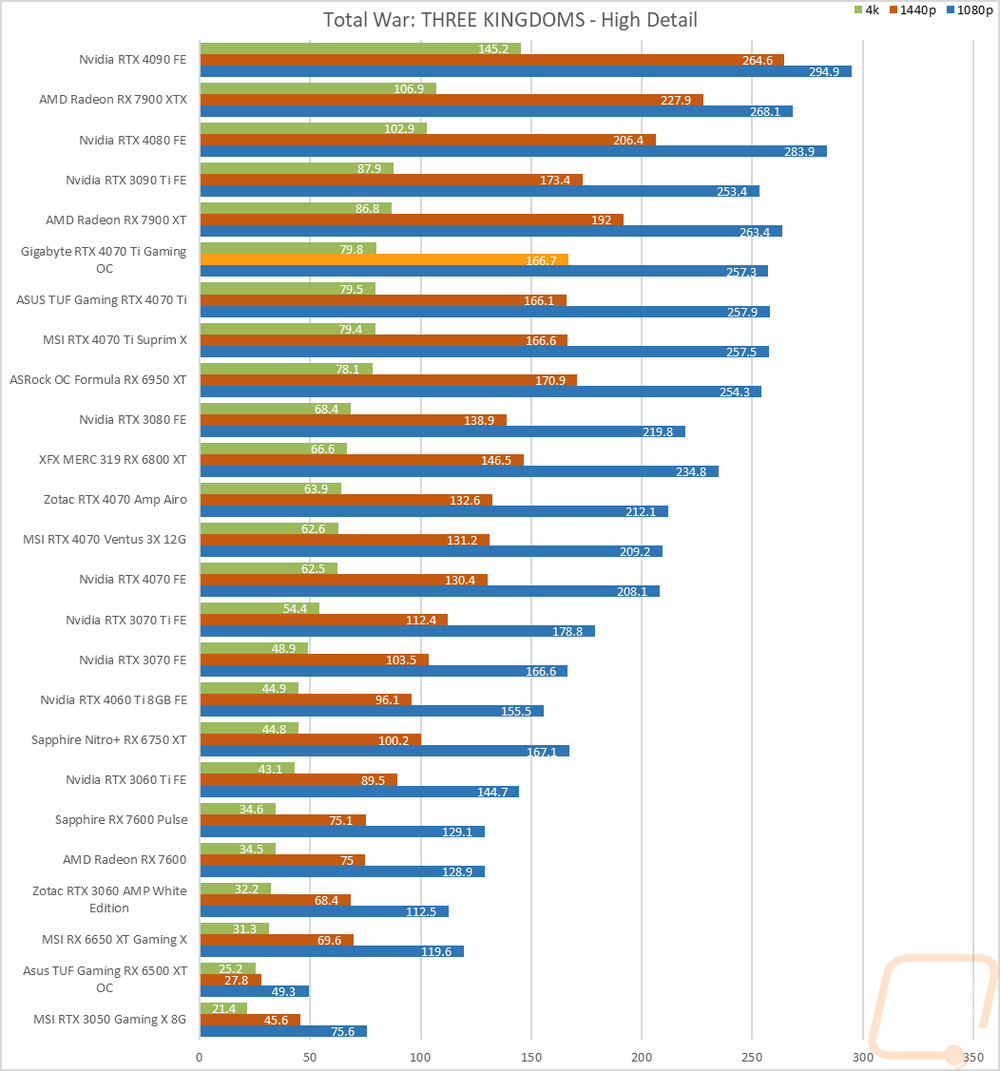
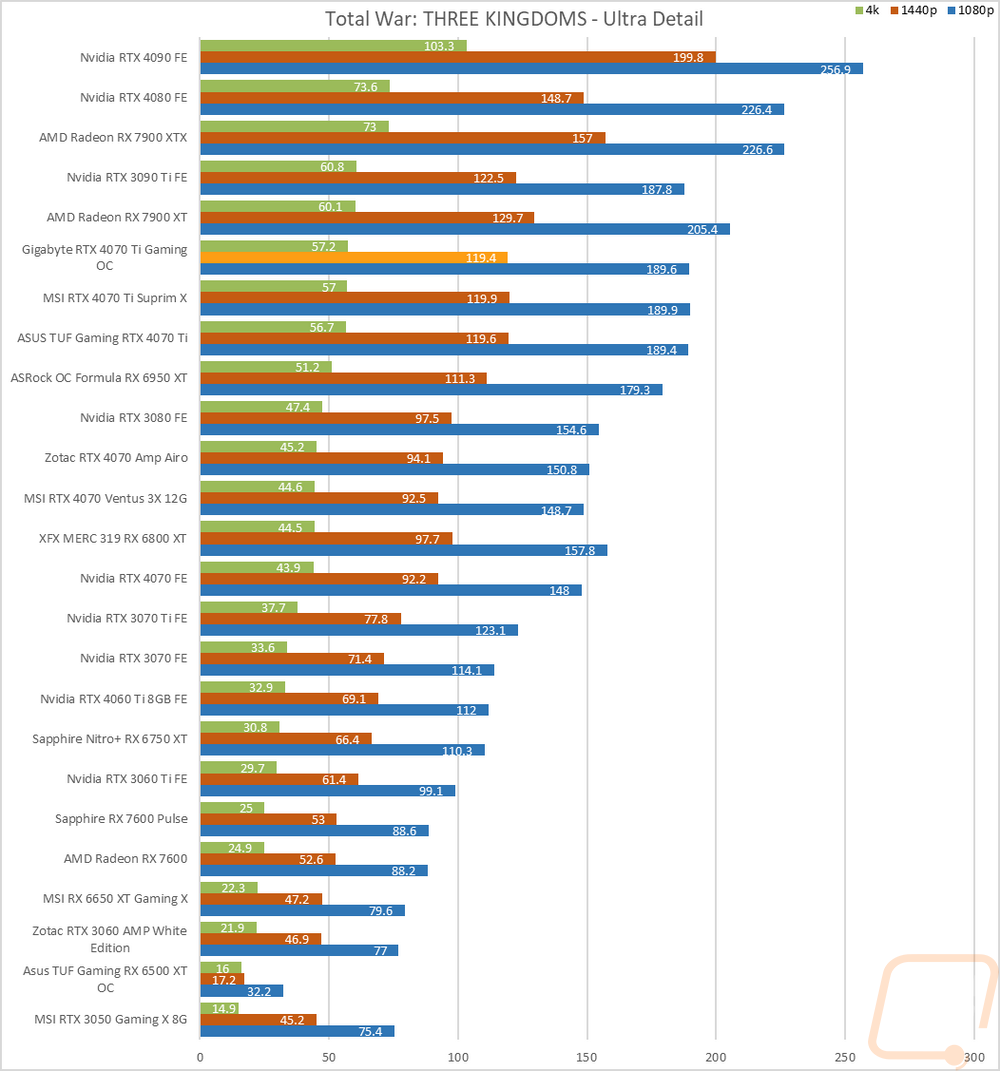
Total War: Three Kingdoms |
Built-in benchmark using the Battle Benchmark setting. Tested at 1080p, 1440p, and 4k at both high and ultra detail settings |
|
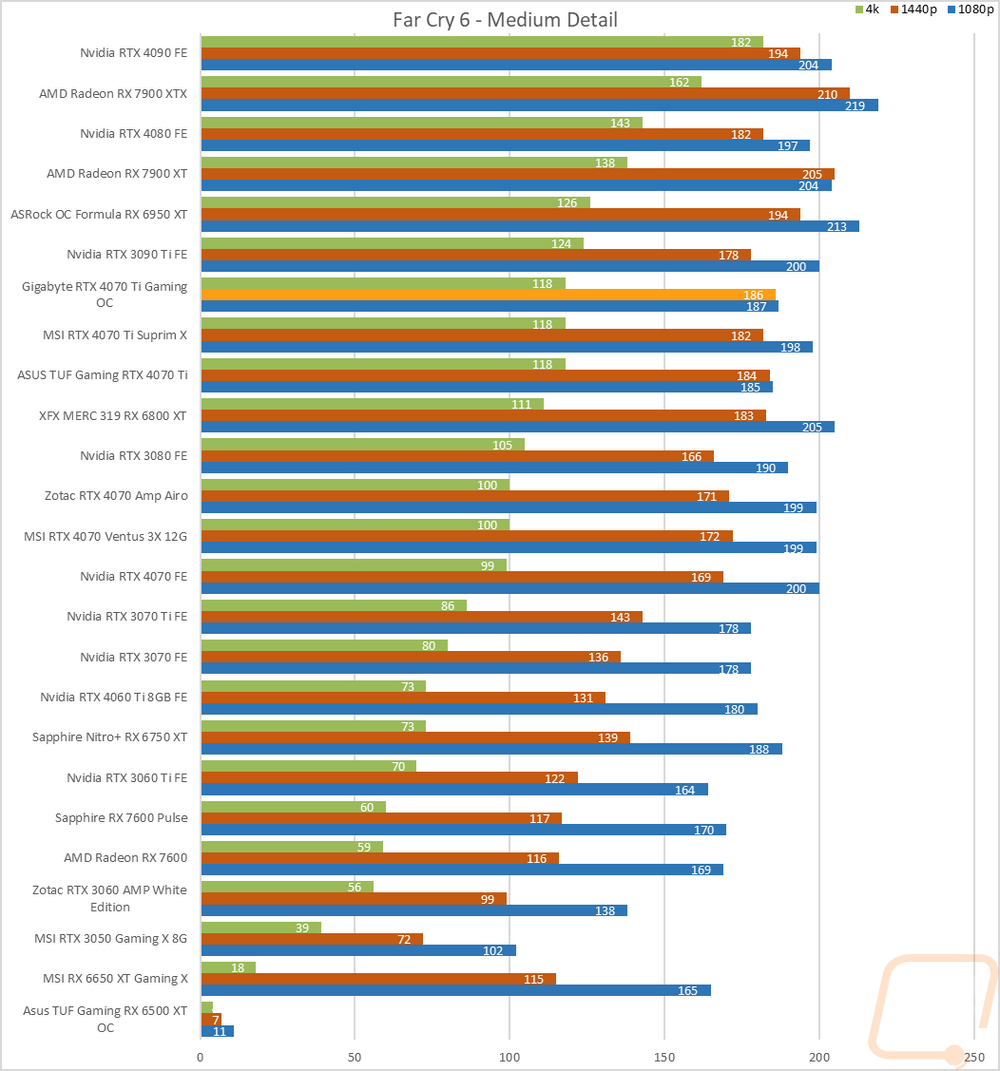
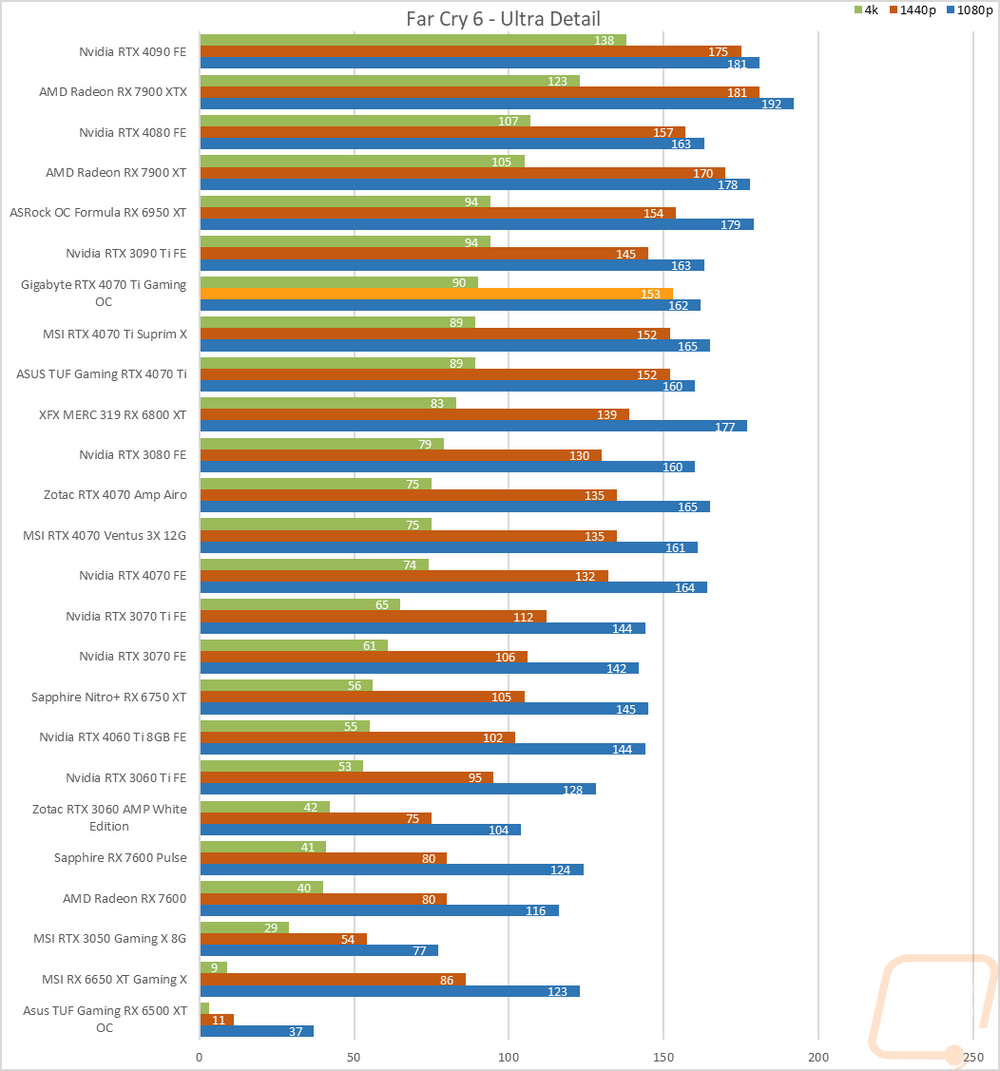
Far Cry 6 |
Built-in benchmark tested at 1080p, 1440p, and 4k with the Ultra and Medium detail settings |
|
V-Ray 5 |
V-Ray 5 benchmark us run with CUDA and RTX settings on cards that support it |
|
Boundary Benchmark |
Testing different DLSS detail levels on cards that support it. All testing is done at 4k with RTX on |
|
Bright Memory Infinite RTX Benchmark |
Benchmark all of the different RTX detail levels. Resolution at 4k and DLSS on balanced for each test |
|
Passmark Performance Test 10.2 |
Test using the GPU Compute Score inside of Passmark’s Performance Test 10.2 |
|
Blender |
Using the standard Blender Benchmark I run the test using the Blender 3.4 setting which tests using the Monster, Junkshop, and Classroom tests. |
|
OctaneBench 2020.1 |
OctaneBench is designed to test rendering in OctaneRender. RTX and non-RTX are both ran. This is a CUDA-only test so only Nvidia cards are tested |
|
Power Testing |
Using a PCat v2 to monitor power between the PCIe slot and the card as well as power through the power cables I test the peak power when running ADIA64, 3DMark Speed Way, 3DMark Time Spy Extreme, FarCry 6 at 4k and Ultra Detail, Watch Dogs Legion at 4K and Ultra detail, and Blender 3.4.0. The results are then averaged as well as the highest result. |
|
Noise Testing |
Our Noise testing is done using a decibel meter 18 inches away from the video card on the bottom/fan side of the card. We test at 50% and 100% fan speeds as well as a third test while under load using AIDA64's stress test. This is done using a Protmex PT02 Sound Meter that is rated IEC651 type 2 and ANSI S1.4 type 2. Tests are done set weighted to A and set to a slow response using the max function. The ambient noise level in the testing area is 33.3 decibels. |
|
Temperature Testing |
Using AIDA64, the GPU stress test is run for 30 minutes or until the result has leveled off. The test is run twice, once with the stock fan profile and a second time with 100% fan speed. During this, I also document the 100% fan speed RPM and document the delta between the fan profile and 100% fan speed as well as get thermal images. |
Synthetic Benchmarks
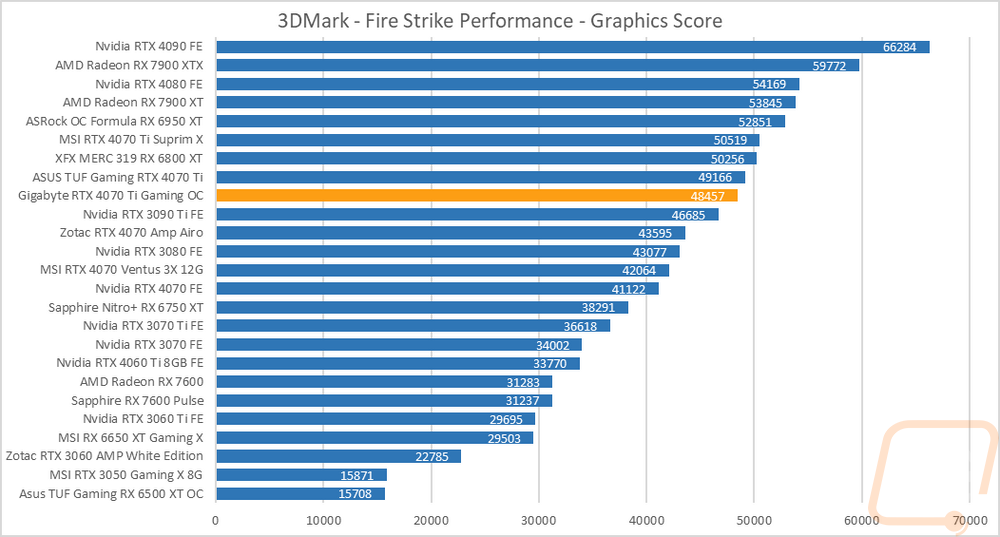
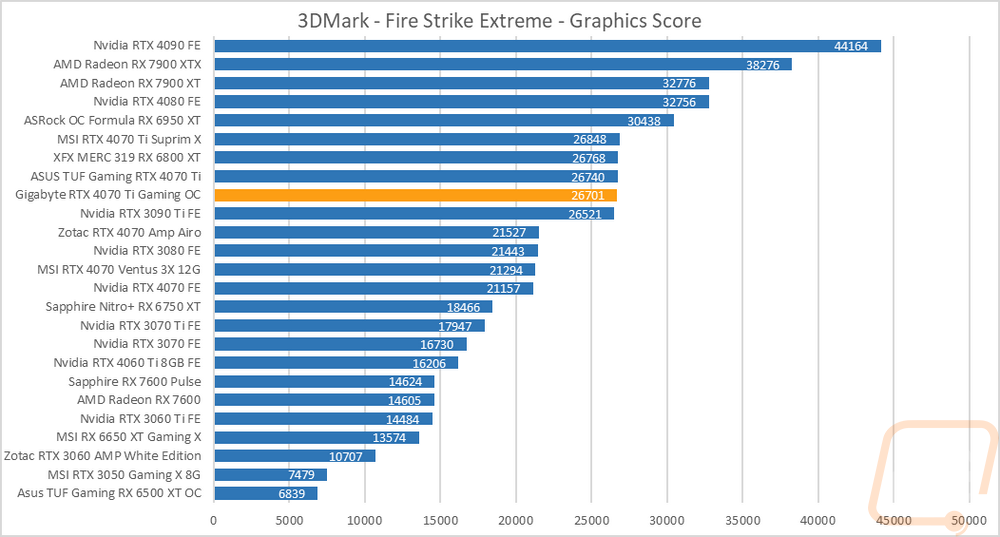
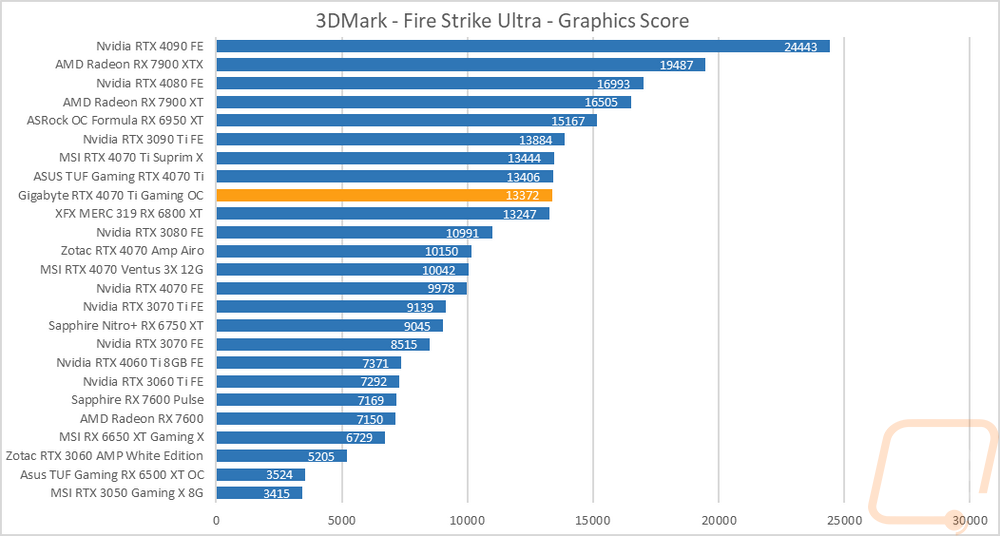
As always I like to start my testing with a few synthetic benchmarks. 3DMark especially is one of my favorites because it is very optimized in both Nvidia and AMD drivers. It's nice to not have to worry about it being favored too much either way and the repeatability of the results makes it a nice chance to compare from card to card, especially when comparing with the same GPU. In this case, we have taken a look at the stock-clocked Asus TUF 4070Ti and the MSI Suprim X which had a big overclock, the Gigabyte RTX 4070 Ti Gaming OC is overclocked but with a much smaller overclock so I’m curious to see how they all compare.
The first round of tests were done in the older Fire Strike benchmark which is a DX11 test. There are three detail levels, performance, extreme, and ultra. The RTX 4070 Ti Gaming OC ended up being at the bottom of the three 4070 Ti’s here, it is tested in a different driver however which may play a role. They do still ahead of the RTX 3090 Ti still except in the Ultra test.
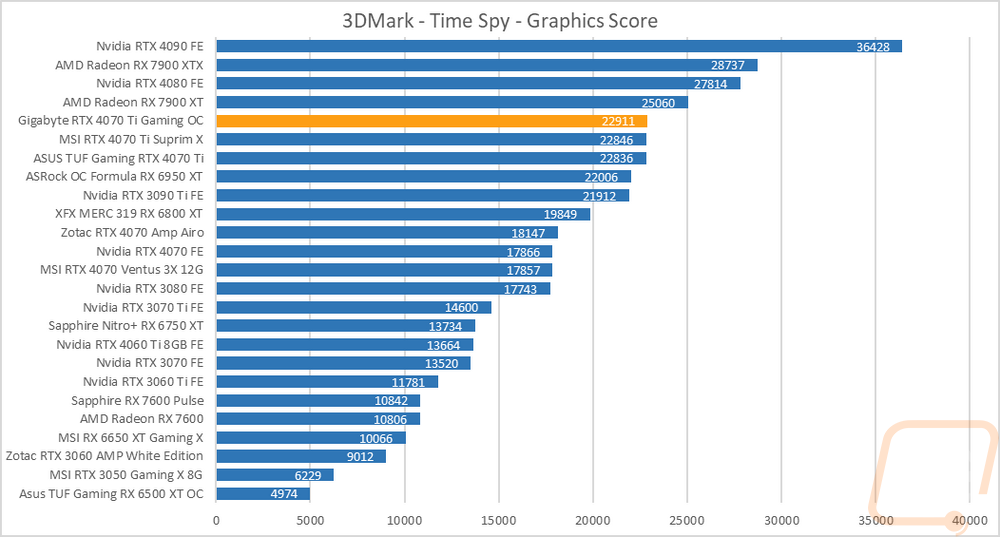
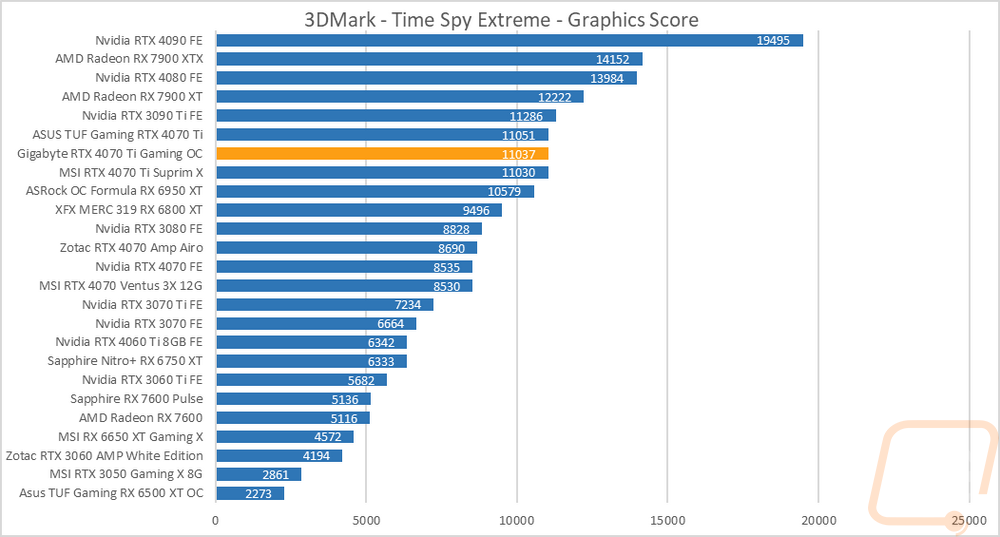
The next two were both based on the Time Spy benchmark. One is the standard test and then there is the extreme detail level. This time around the RTX 4070 Ti Gaming OC is out in front of the two other 4070 Ti’s for the base Time Spy test by a small margin and then in the middle of the pack for the Time Spy Extreme test.
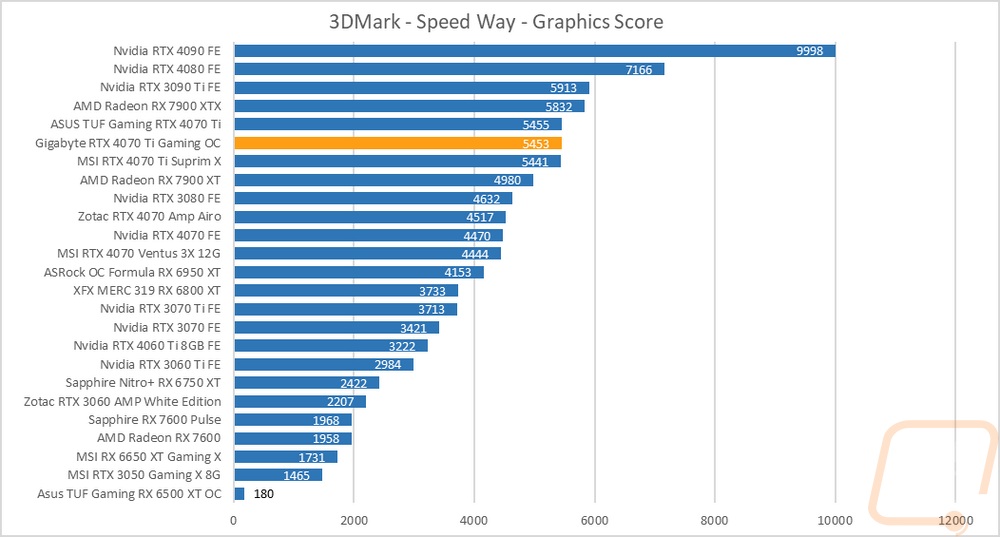
I did also test using the new 3DMark Speed Way which is their latest benchmark. Speed Way is DX12 as well but combines in more future focused tech like Ray Tracing which up until now 3DMark has only used in feature tests. The RTX 4070 Ti Gaming OC once again is in the idle of the pack of the RTX 4070 T’s sitting ahead of the Suprim X, the group as a whole is up in the chart with the 7900 XTX ahead and 7900 XT below them.
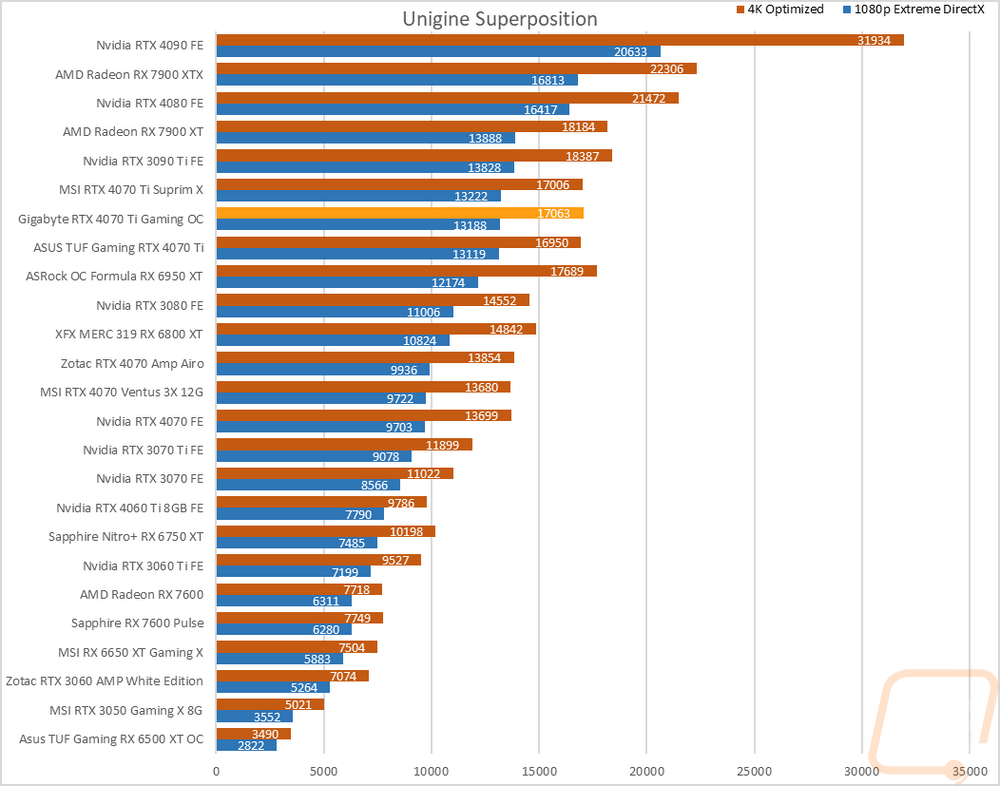
The last test was using the Unigine-based Superposition benchmark and I tested at 1080p with the extreme detail setting as well as the 4K optimized setting. In the extreme detail setting the RTX 4070 Ti Gaming OC is ahead of the TUF and behind the Suprim X here in both the 4K and 1080p Extreme tests. At 1080p they sit behind the 3090 Ti and ahead of the 6950 XT, the 69050 XT does better in the 4K test however jumping back ahead of them.
VR Benchmarks
As for Virtual Reality, I love it but it is more demanding than traditional gaming. This is partially because of the resolutions needed to render for two eyes and because they render more than what is immediately visible. But also because of post effects to get the proper “fisheye” effect for it to look proper in your eyes with the HMD. You also have to have much higher expectations for frame rates in VR, skipping frames or lower FPS can cause motion sickness in VR. Because of that, I ran a few tests.
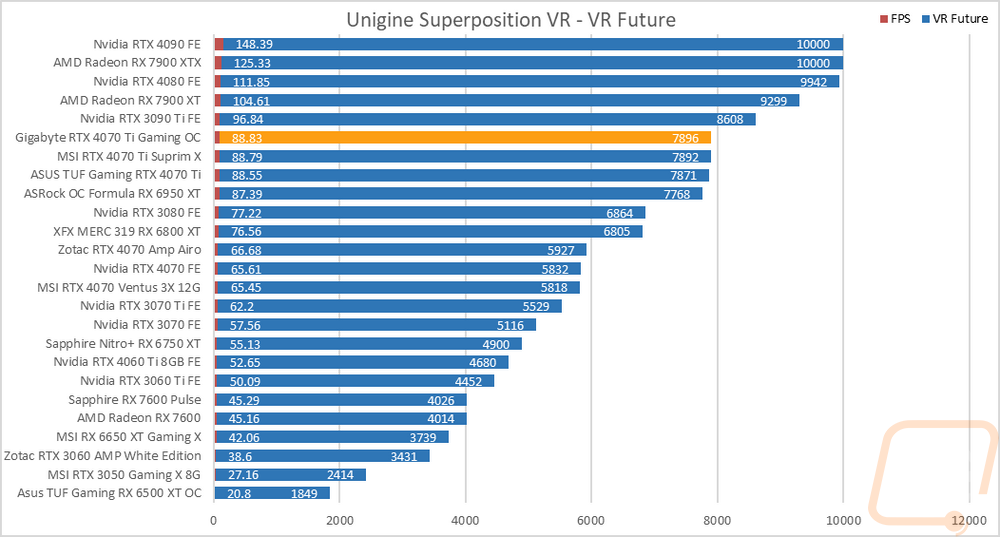
My first test was again in Superposition. This time I tested the VR Future test using the Oculus resolution. I have also included the average frame rate as well which is important for the cards at the top of the chart because for some reason Superposition is capped at 10,000 for its scores and that doesn’t show the performance gap in those cards at the top. The RTX 4070 Ti Gaming OC is ahead of both the stock-clocked TUF and the higher overclocked Suprim X in Superposition VR, it is only a fraction of an FPS when we look at that however.
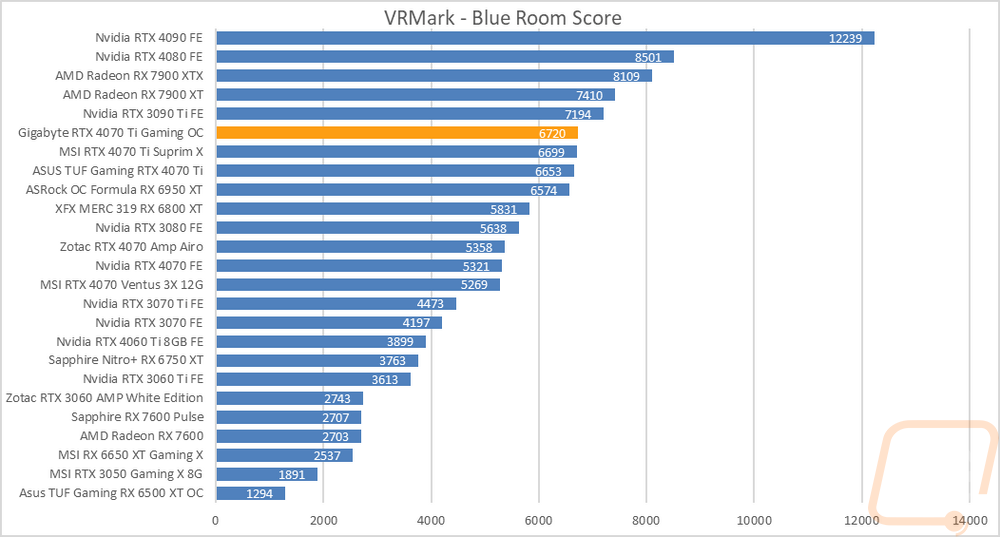
My second round of VR testing was in VRMark which has three tests that are similar to the VR tests in Superposition. I only focused on just the most demanding test called Blue Room which is looking more at future VR performance. The RTX 4070 Ti Gaming OC is once again at the top of the three RTX 4070 Tis with a score of 6720 to the Suprim X’s 6699.
In-Game Benchmarks
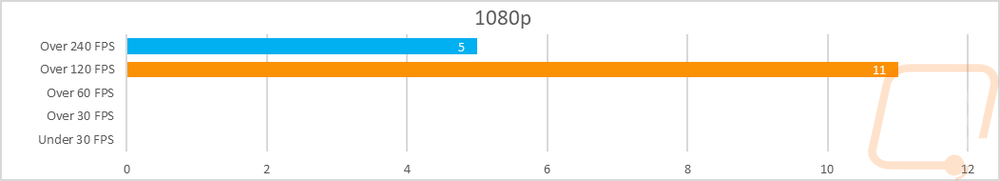
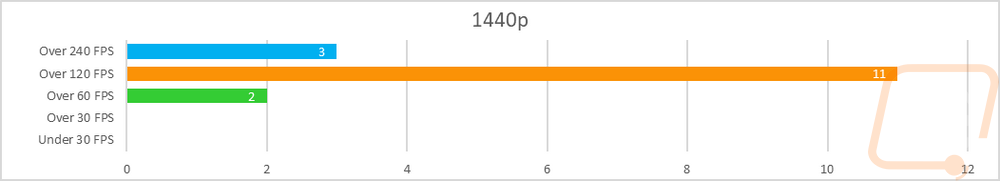
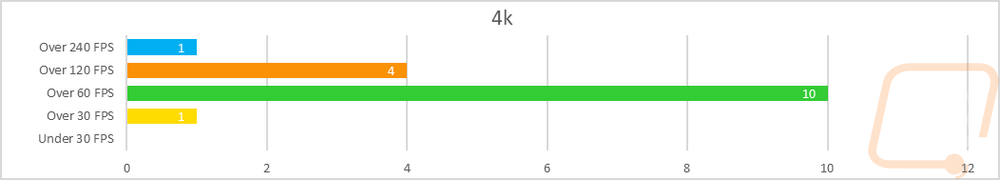
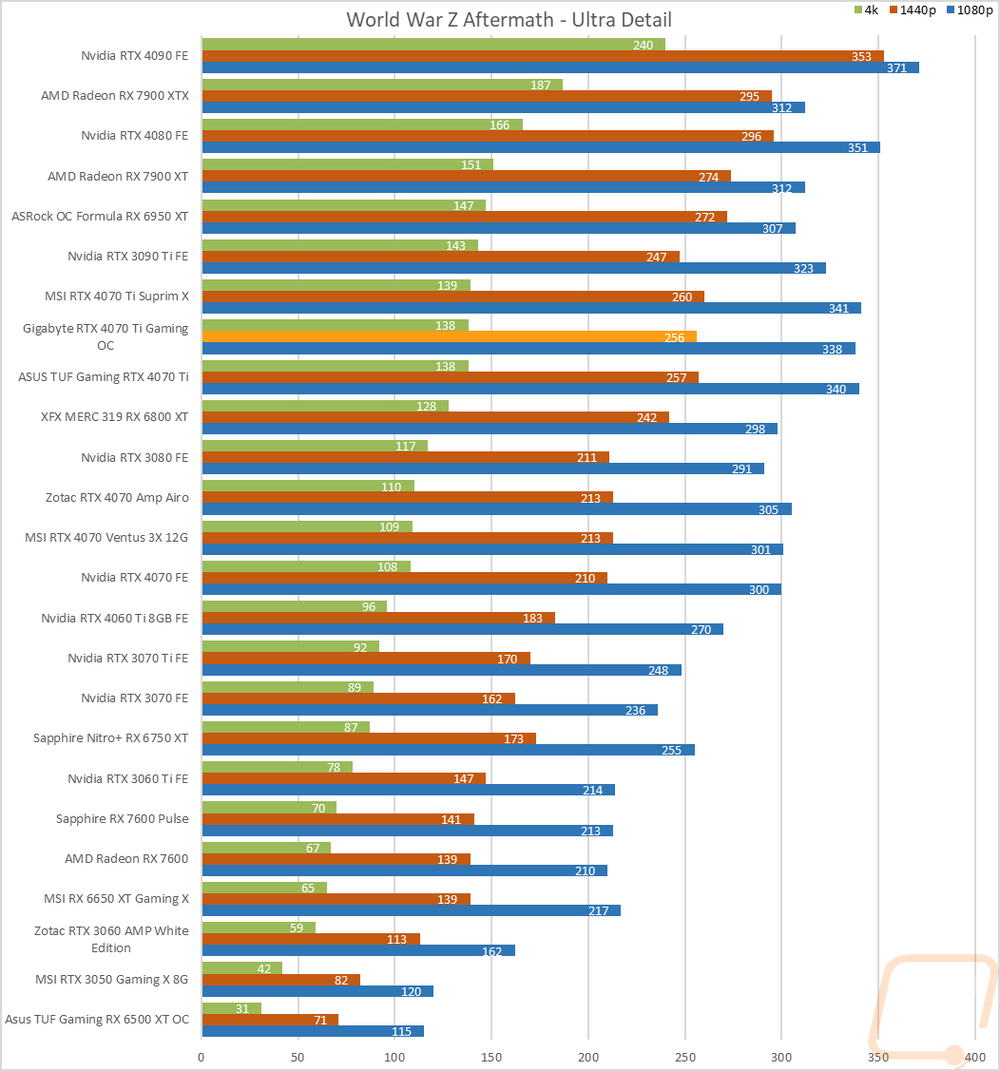
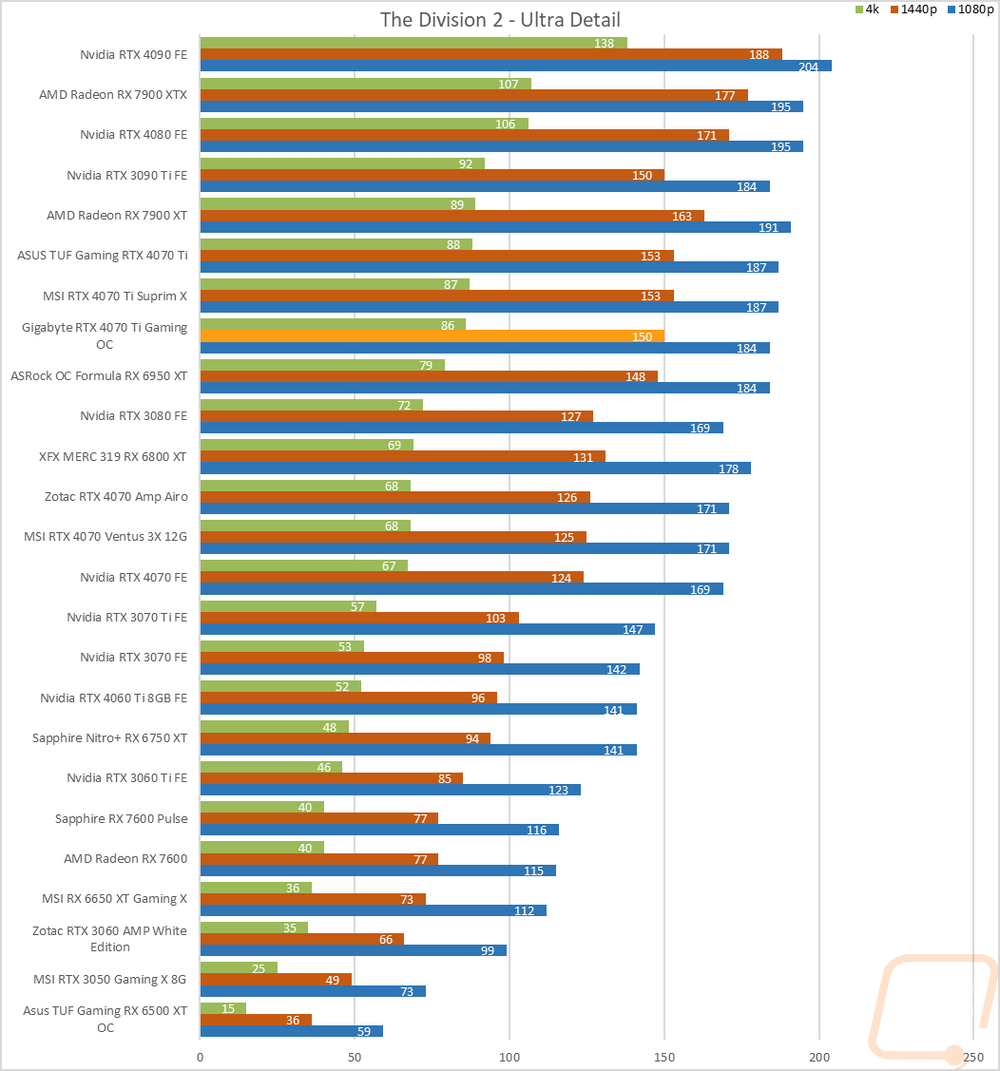
Now we finally get into the in game performance and that is the main reason people pick up a new video card. To test things out I ran through our new benchmark suite that tests 10 games at three different resolutions (1080p, 1440p, and 4k). Most of the games tested have been run at the highest detail setting and a mid-range detail setting to get a look at how turning things up hurts performance and to give an idea of if turning detail down from max will be beneficial for frame rates. In total, each video card is tested 54 times and that makes for a huge mess of results when you put them all together. To help with that I like to start with these overall playability graphs that take all of the results and give an easier-to-read result. I have one for each of the three resolutions and each is broken up into four FPS ranges. Under 30 FPS is considered unplayable, over 30 is playable but not ideal, over 60 is the sweet spot, and then over 120 FPS is for high refresh rate monitors.
So how did the RTX 4070 Ti Gaming OC do? Well at 1080p is completely stomped all of our tests with nothing coming in below 120 FPS. At 1080p 11 results were between 120 and 239 and then 5 were up over 240 FPS. The RTX 4070 Ti Gaming OC is targeted at 1440p gaming and it shows with only two results coming in below 120 FPS and those two were still up over 60 FPS. There were 11 over 120 FPS and then 3 over 240 FPS. Lastly, while not specifically designed for it the RTX 4070 Ti Gaming OC handled 4K well as well. There was one result which was in the playable but not smooth range but most of the results (10 in total) were in the 60-119 FPS range. Four more were over 120 FPS and then one (CS:GO, it's always CS:GO) was over 240 FPS as well.
To get another comparison I did average out all three of the RTX 4070 Ti results to see how the cards landed. The Suprim X with its significantly bigger overclock is up at the top, which isn’t a surprise. I was surprised that the Gaming OC didn’t outperform the stock-clocked TUF card, however. As I mentioned earlier the Gaming OC is on a new driver and there will be some variance and I suspect that is what we are seeing here. At 1080p for example the Gaming OC is faster than the TUF card in almost all of the tests but there were two results that there was a gap between the two which made all of the difference. One thing is for sure though, the base overclock shouldn’t be your main concern, there isn’t much performance to be found there.
|
|
1080p |
1440p |
4K |
|
MSI RTX 4070 Ti Suprim X |
212.90 |
174.5 |
103.74 |
|
ASUS TUF Gaming RTX 4070 Ti |
210.69 |
174.07 |
103.61 |
|
Gigabyte RTX 4070 Ti Gaming OC |
210.32 |
173.55 |
103.36 |
Of course, I have all of the actual in game results as well for anyone who wants to sort through the wall of graphs below. These graphs do a good job of showing that the RTX 4070 Ti Gaming OC and the other 4070 Ti’s are sitting just behind the RTX 3090 Ti in a majority of the tests and at 1440p and 4K they are sitting behind the 7900 XT and the 6950 XT.
Compute Benchmarks
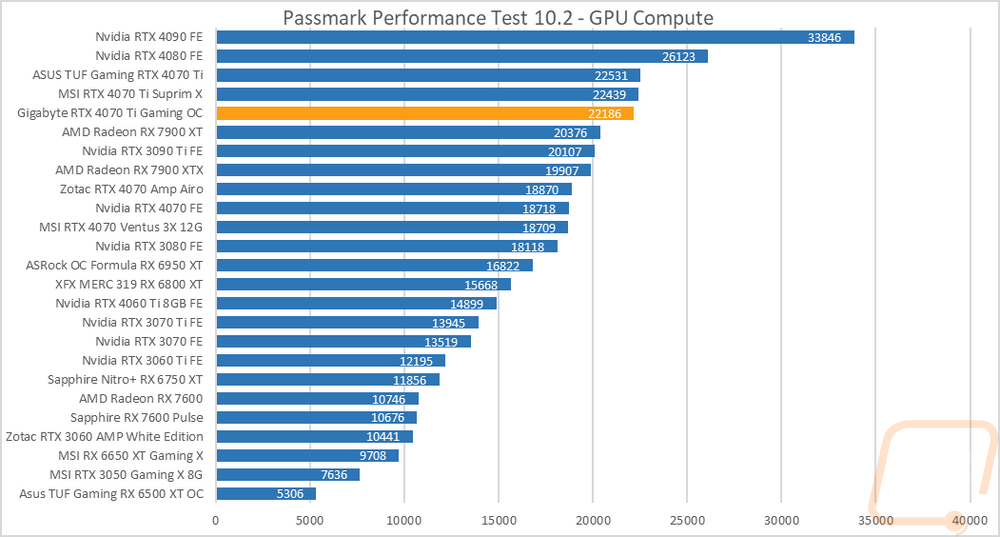
Now some people don’t need a video card for gaming, they need the processing power for rendering or 2D/3D production, or in some cases people who game also do work on the side. So it is also important to check out the compute performance on all of the video cards that come in. That includes doing a few different tests. My first test was a simple GPU Compute benchmark using Passmark’s Performance Test 10 and the RTX 4070 Ti Gaming OC is noticeably down compared to the other two here but still out in front of both RX 7900s with just the RTX 4080 and RTX 4090 ahead of them.
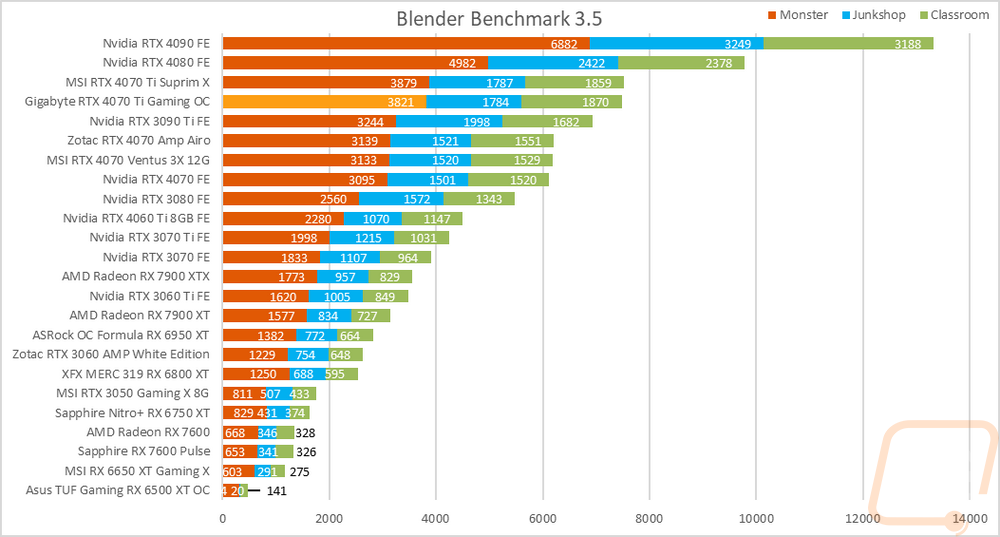
Blender is always my favorite compute benchmark because the open-source 3D rendering software is very popular and it isn’t a synthetic benchmark. With the latest version of Blender, they redid the benchmark so we now have a new test that runs three different renderings and gives each a score. I have all three stacked together so we can see the overall performance. The Suprim X with its higher overclock edged out the RTX 4070 Ti Gaming OC here but both cards have a big margin ahead of the 3090 Ti and are worlds ahead of anything from AMD with the 7900 XTX back behind the RTX 3070.
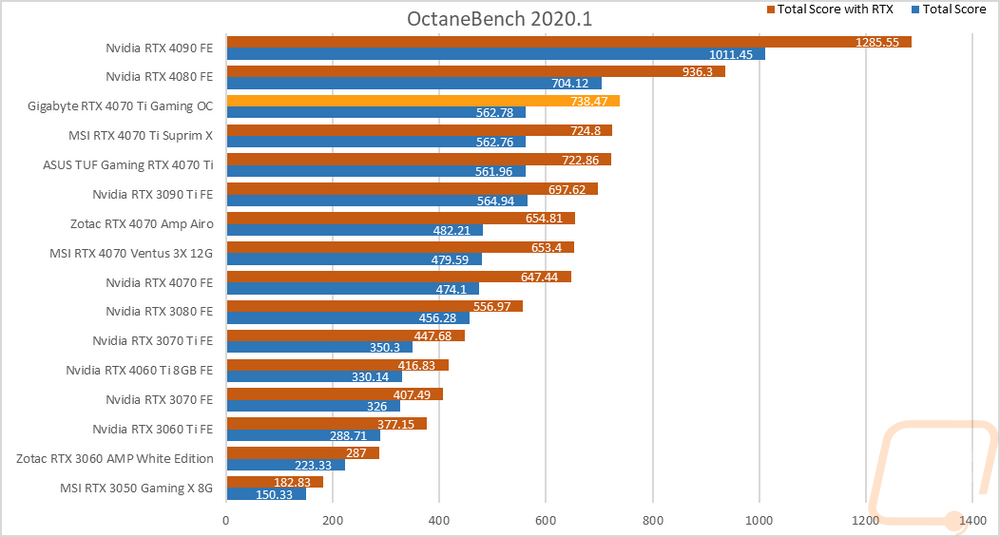
For CUDA-based cards, I also check out OctaneRender performance using their OctaneBench 2060.1 benchmark which allows me to check out both RTX and non-RTX rendering performance. Here the RTX 4070 Ti Gaming OC has a good margin in the RTX result ahead of both the Suprim X and TUF, without RTX it is also ahead by just a fraction of a point on both.
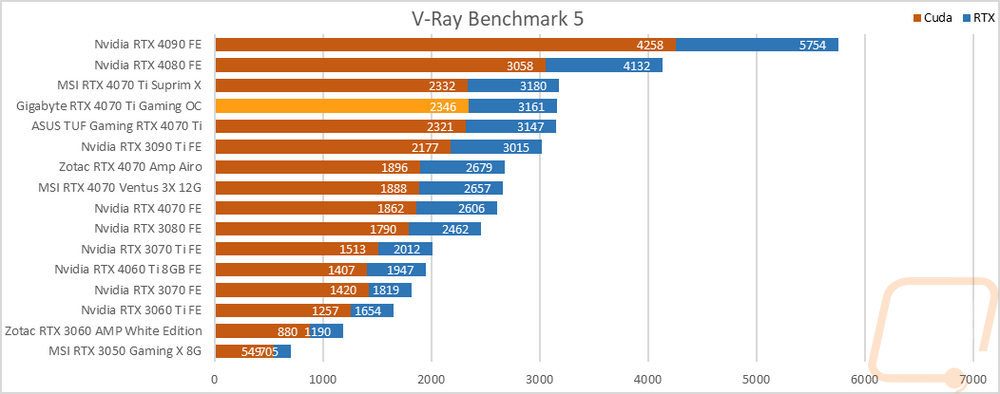
An additional CUDA-based test I also ran V-Ray Benchmark 5 to check out CUDA and RTX performance in the 3D rendering and simulation software. The RTX 4070 Ti Gaming OC is out in front of both 4070 Ti’s for the CUDA result but in the middle of the pack for the RTX result. This was still enough to be ahead of the RTX 3090 Ti in both tests by a good margin as well.
RTX and DLSS
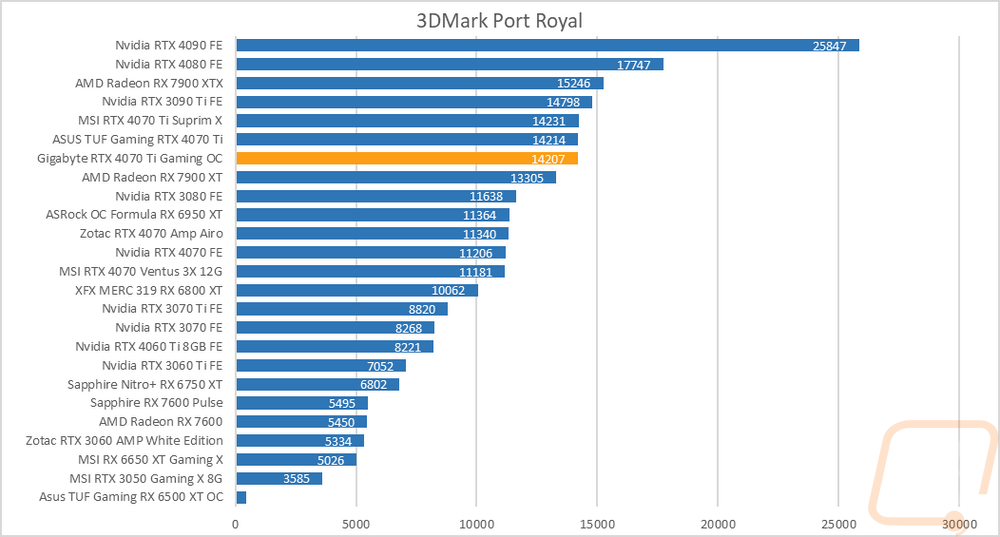
Being an RTX card I also like checking out the performance of some of Nvidia’s features. Namely the ray tracing performance and the performance improvements you can see by using DLSS combined with the tensor cores. My first test goes back to our synthetic benchmarks with 3DMark where I check out their Port Royal benchmark. This is the one test that does also have AMD Ray Tracing support which is great to get a look at how different cards including older non-RTX cards perform. The RTX 4070 Ti Gaming OC scored a 14207 which puts it 7 points behind the TUF and 24 points behind the Suprim X. All three cards still sit ahead of the RX 7900 XT and below the 7900 XTX and 3090 Ti here.
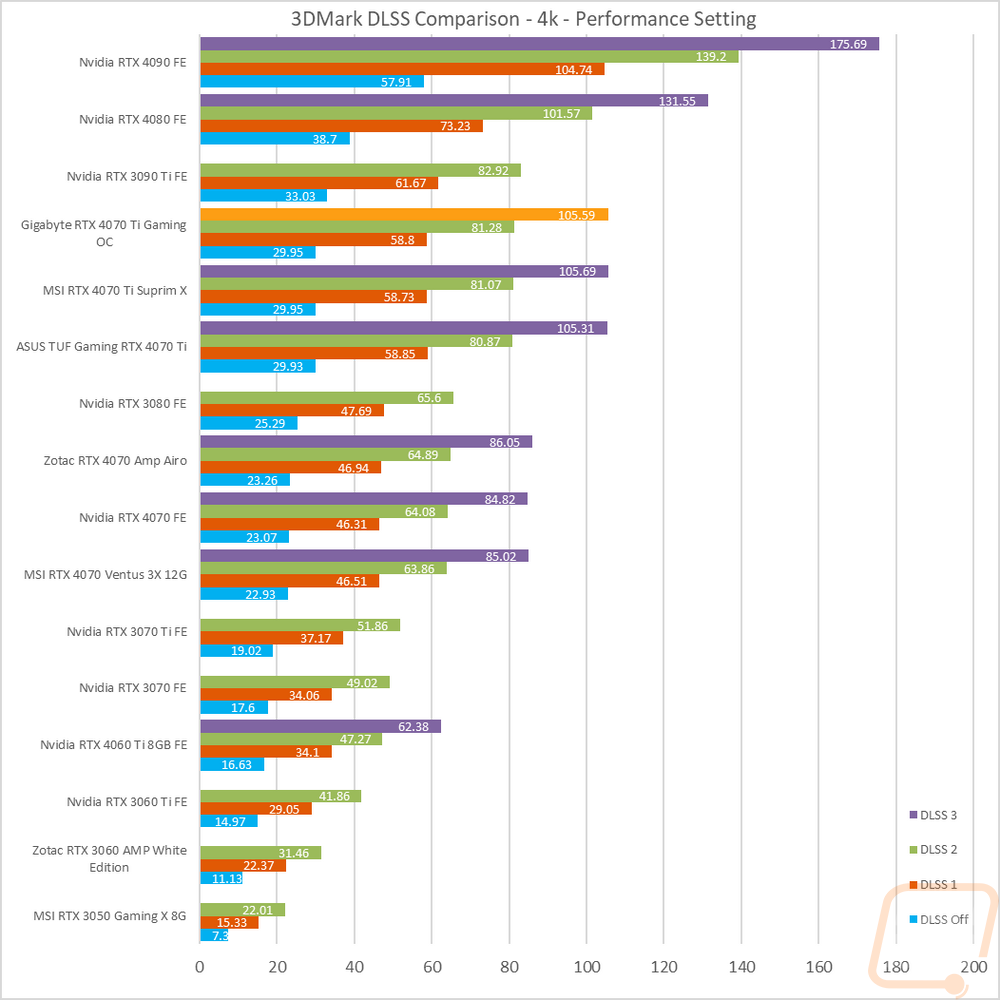
3DMark also has added in a few feature tests, one being a look at DLSS performance. For this one, I have the resolution set to 4K and I test with all three versions of DLSS as well as with it off completely. All DLSS are set to their performance setting as well to keep the results comparable. This gives us a great look at the performance improvements that DLSS has given with DLSS 3 also including frame generation. The RTX 4070 Ti Gaming OC is ahead of the other 4070 Ti’s here in most of the tests but the Suprim X does edge out just slightly on the DLSS 3 on test with .1 of an FPS more. More than anything though this test shows how much of a difference DLSS can make no matter the version going from almost 30 FPS to nearly double the performance with DLSS 1 and up to 105 with DLSS 3 with frame generation.
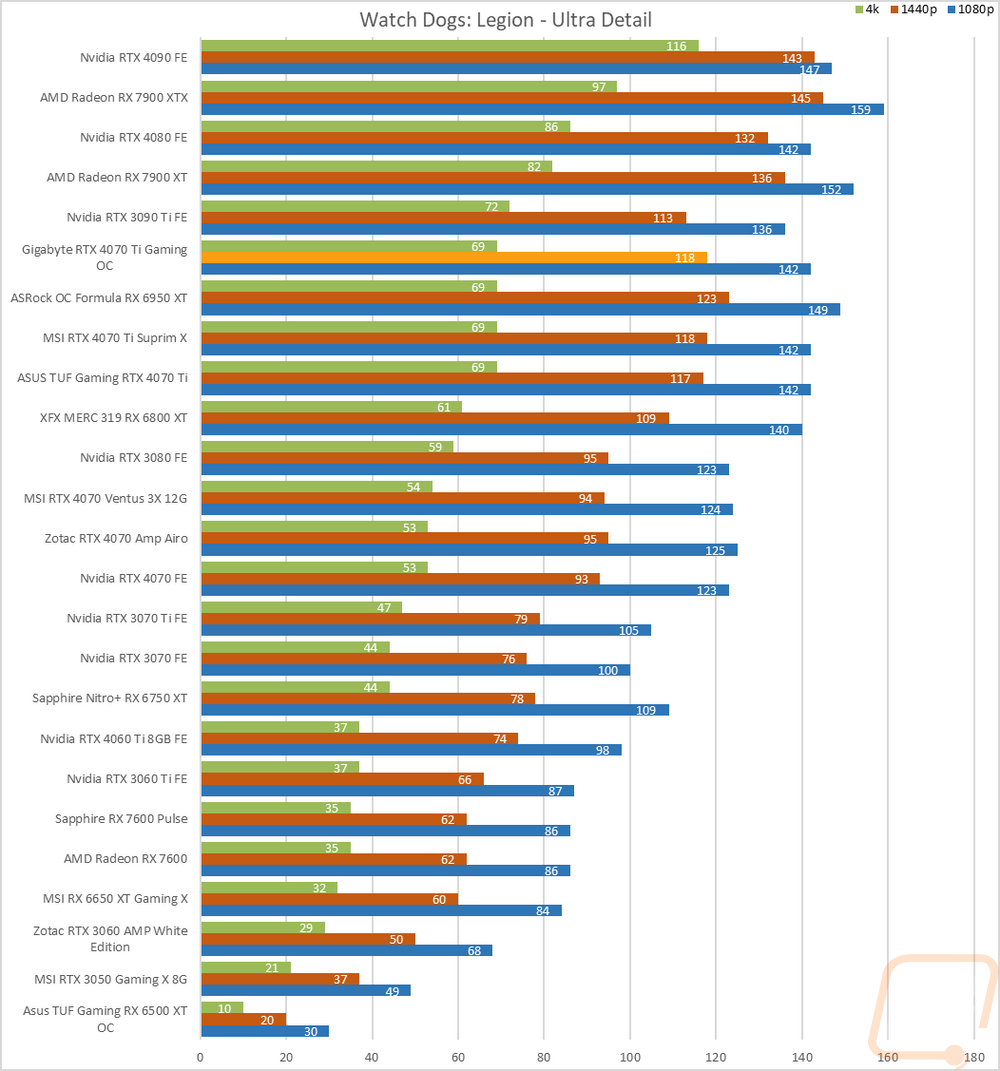
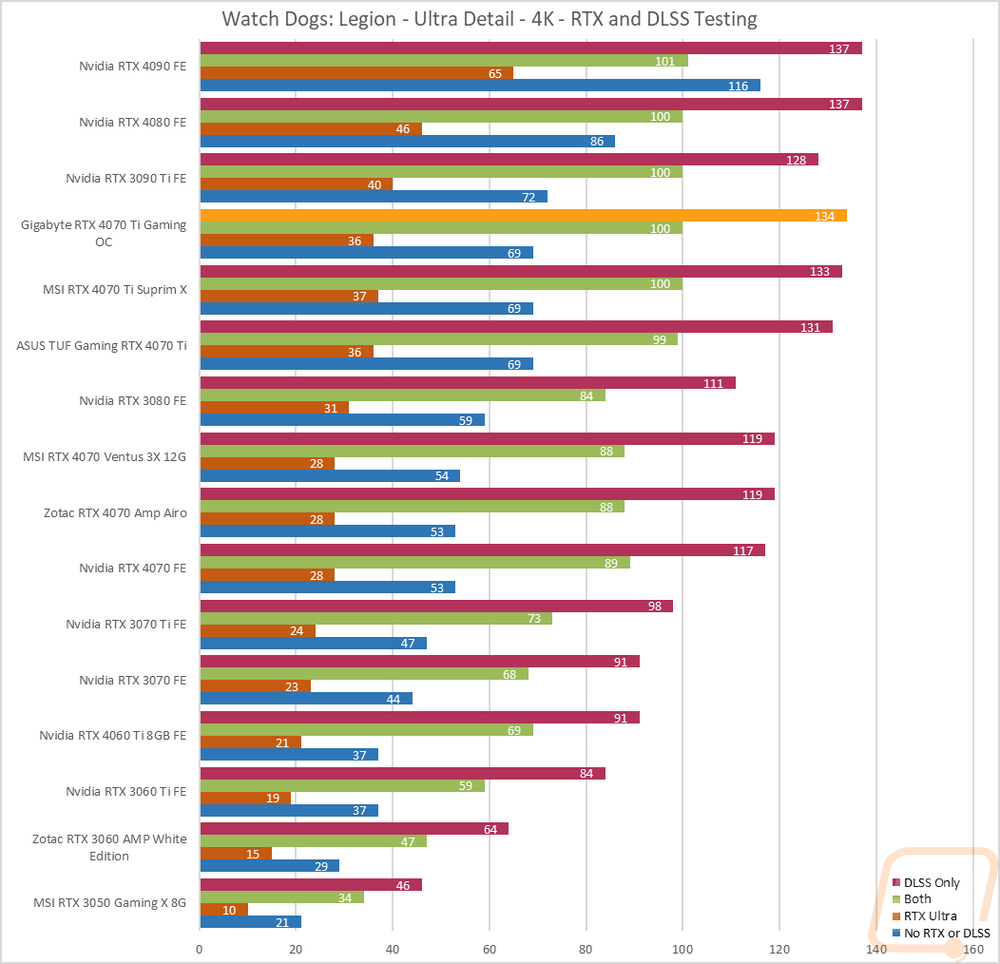
I then jumped into game tests, this time with Watch Dogs: Legion. For this one, I wanted to get an idea of the performance you will see when taking advantage of Nvidia’s RTX and DLSS features. I tested at 4k with the ultra detail setting and with ultra being the setting for DLSS and RTX when they are on as well. I then test with no RTX or DLSS on and then with RTX DLSS on and off and on together. Here the RTX 4070 Ti Gaming OC gained 1 FPS on the Suprim X and 3 FPS on the TUF in the DLSS-only test and matched the Suprim X in the combined test.
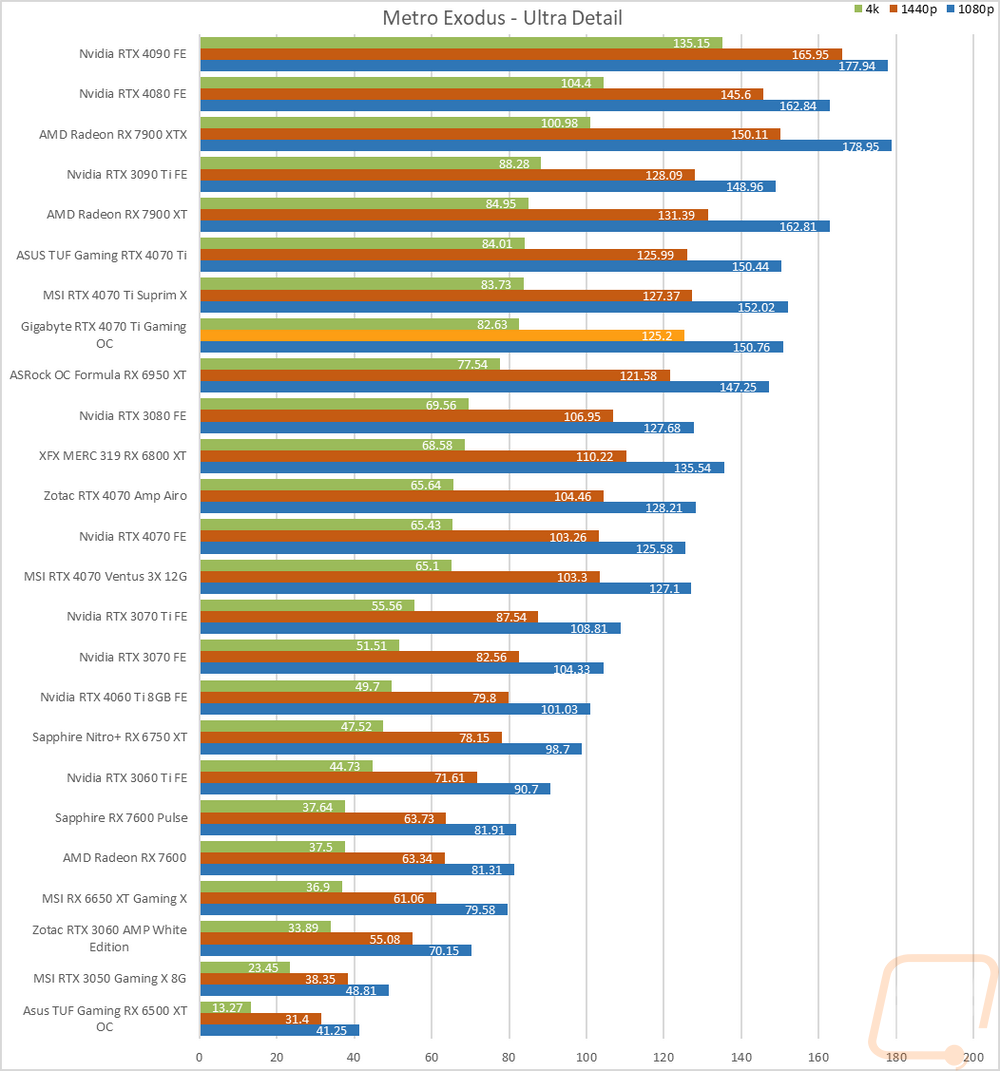
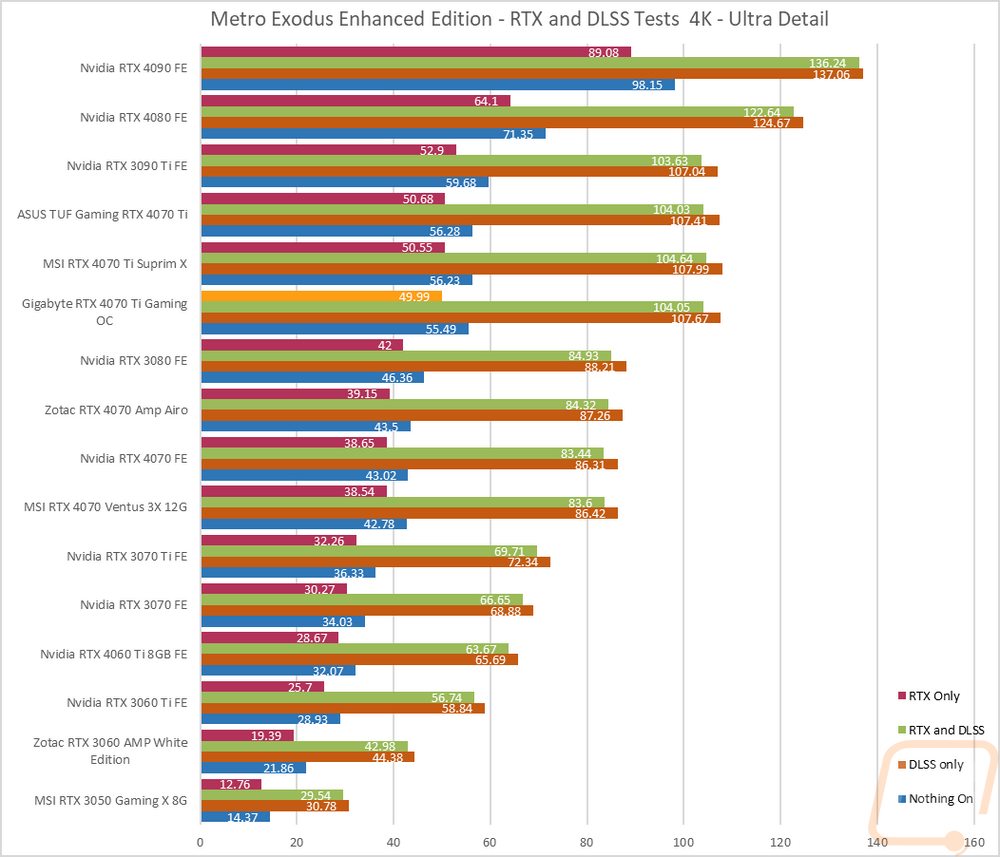
Next, I wanted to check out the performance in Metro Exodus which we have used for testing for a long time now. This test is similar as well with it set to 4K and Ultra detail, I use the included benchmark to test DLSS and RTX individually and then with them both on and both off to give us a look at overall frame rates depending on which direction you go. I should point out that this is using the Enhanced Edition where our normal benchmark uses the standard version for testing with AMD but that version DLSS no longer works. That said the RTX 4070 Ti Gaming OC is behind the other 4070 Ti’s just slightly in the RTX only result but beats the TUFF in the DLSS on results.
Cooling Noise and Power
For my last few tests, rather than focusing on in game performance, I like to check out other aspects of video card performance. These are also the most important ways to differentiate the performance between cards that have the same GPU. To start things off I took a look at power usage.
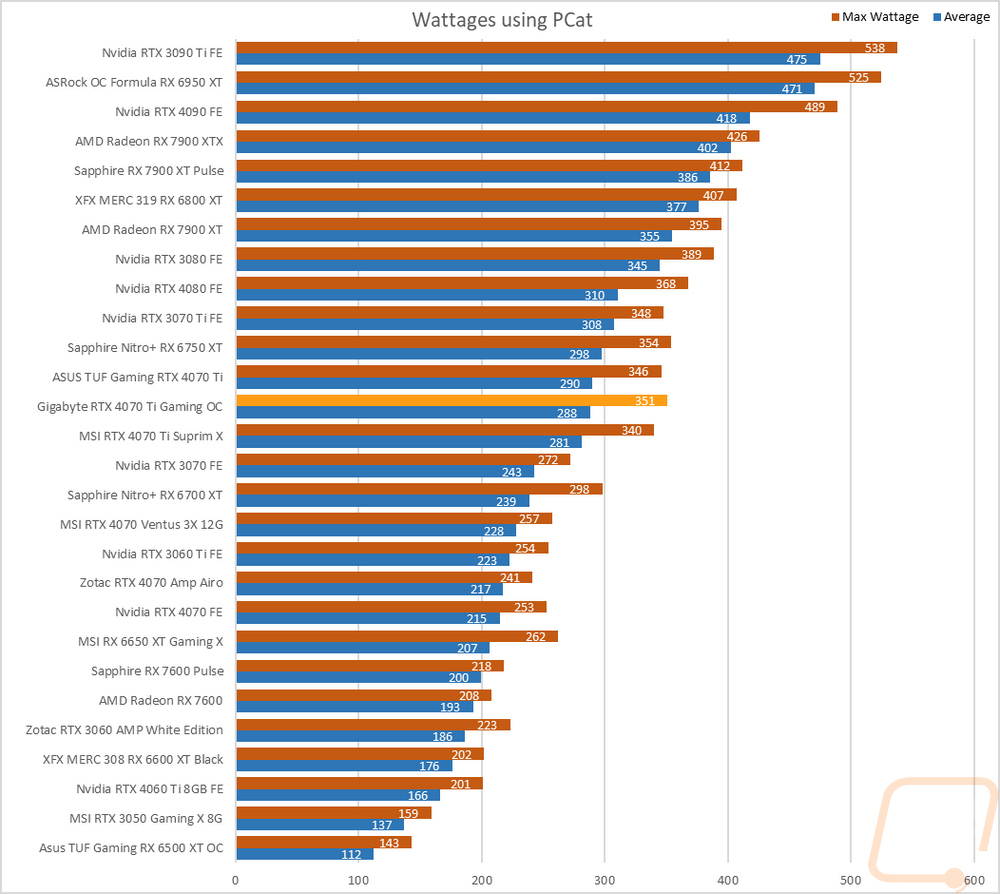
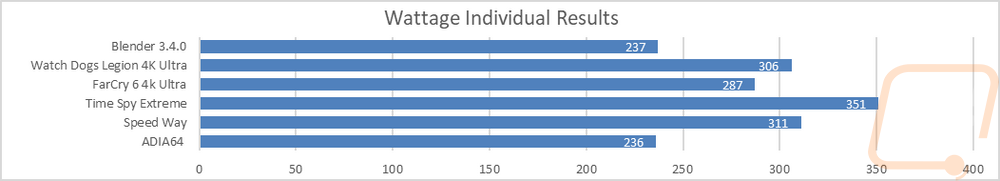
For this, our new test setup utilizes the Nvidia-designed PCat v2 along with cables to handle both traditional 6 or 8-pin connections as well as the new 12VHPWR. The PCat also utilizes a PCIe adapter to measure any power going to the card through the PCIe slot so we can measure the video card wattage exclusively, not the entire system as we have done in the past. I test with a mix of applications to get both in game, synthetic benchmarks, and other workloads like Blender and AIDA64. Then everything is averaged together for our result. I also have the individual results for this specific card and I document the peak wattage result as well which is almost always Time Spy Extreme. The Gigabyte RTX 4070 Ti Gaming OC averaged 288 watts which is what this graph is sorted by putting it 2 watts below the stock clocked TUF card and 7 watts above the Suprim X but its peak wattage was higher at 351 watts than either card.
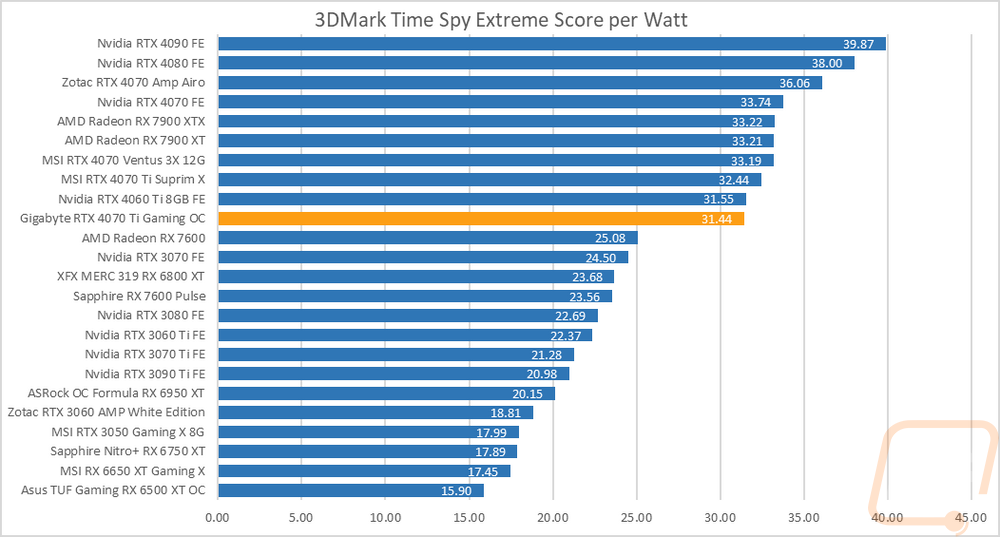
With having exact peak wattage numbers when running Time Spy Extreme I was also able to put together a graph showing the total score for each watt that a card draws which gives us an interesting look at overall power efficiency in the popular and demanding benchmark. The Gigabyte RTX 4070 Ti Gaming OC lands at 31.44 points per watt, this is because of the higher power usage during the Time Spy Extreme test, putting it down just below the new RTX 4060 Ti FE with Suprim X being a lot more efficient, but the Gigabyte RTX 4070 Ti Gaming OC is still WAY ahead of any of the last generation cards.
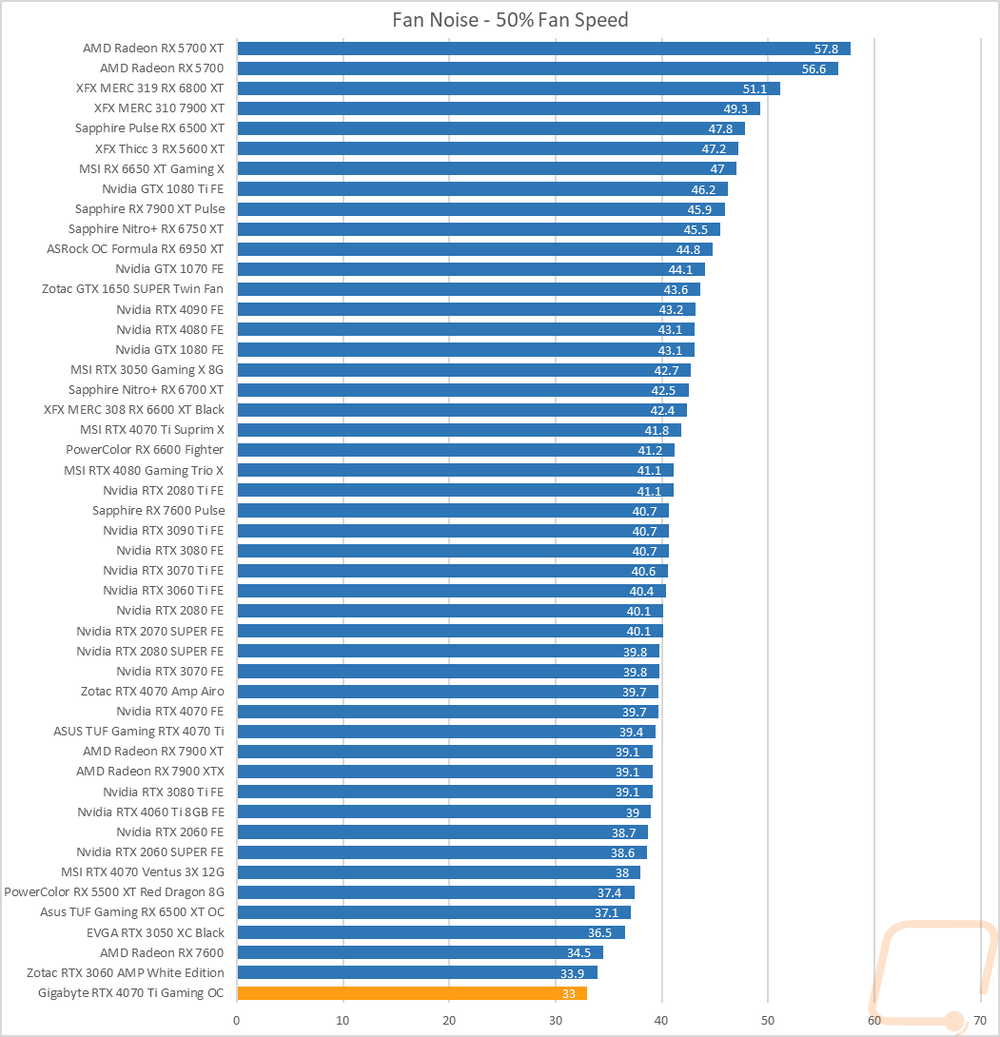
My next round of tests were looking at noise levels. These are especially important to me because I can’t stand to listen to my PC whirling. Especially when I’m not in game and other applications are using the GPU. For my testing, though I first tested with the fan cranked up to 100% to get an idea of how loud it can get, then again at 50% to get an idea of its range. The Gigabyte RTX 4070 Ti Gaming OC was all the way at the bottom of the chart for the 50% fan speed test which is impressive and just a few up from the bottom when we have the fans cranked up to 100%. Gigabyte didn’t give the card’s triple fan setup a crazy high max fan speed which helps, but even still the card is lower in the noise charts than it is in the RPM chart which shows that they are doing a good job keeping things quiet.
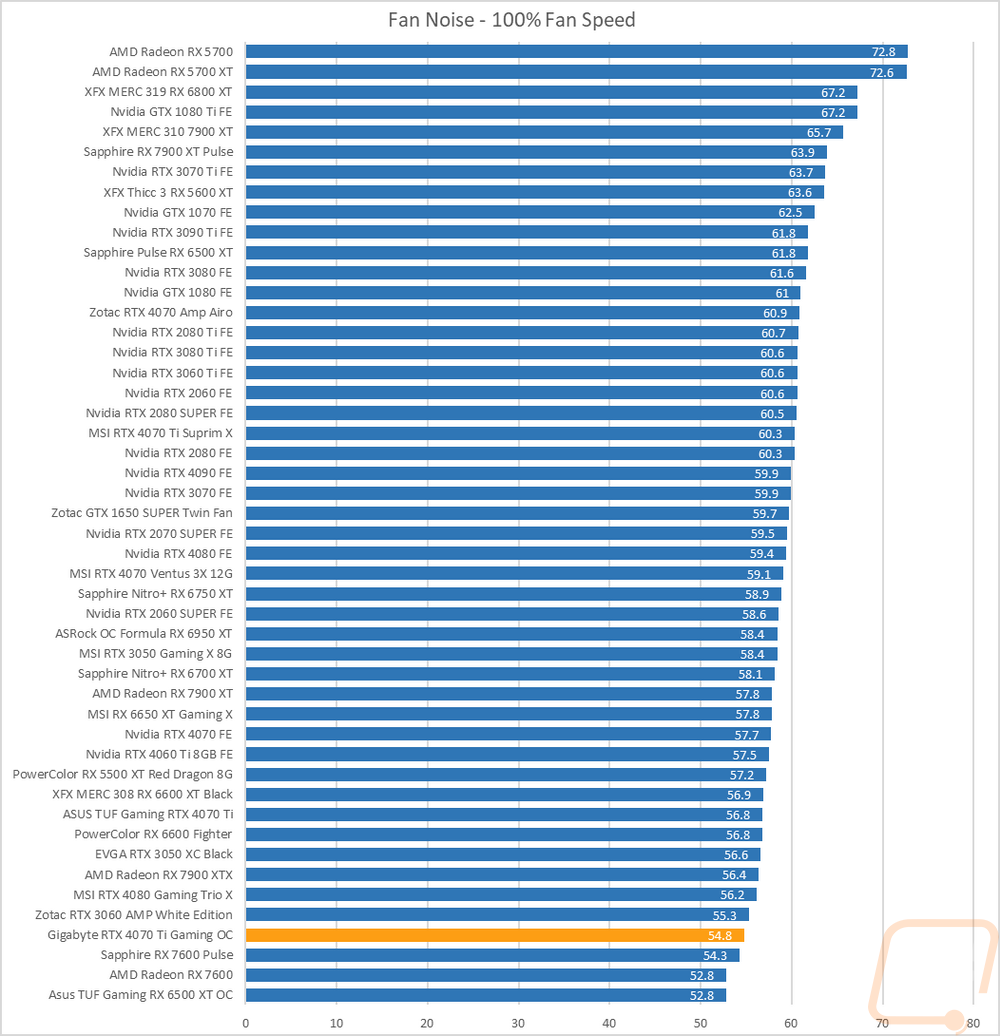
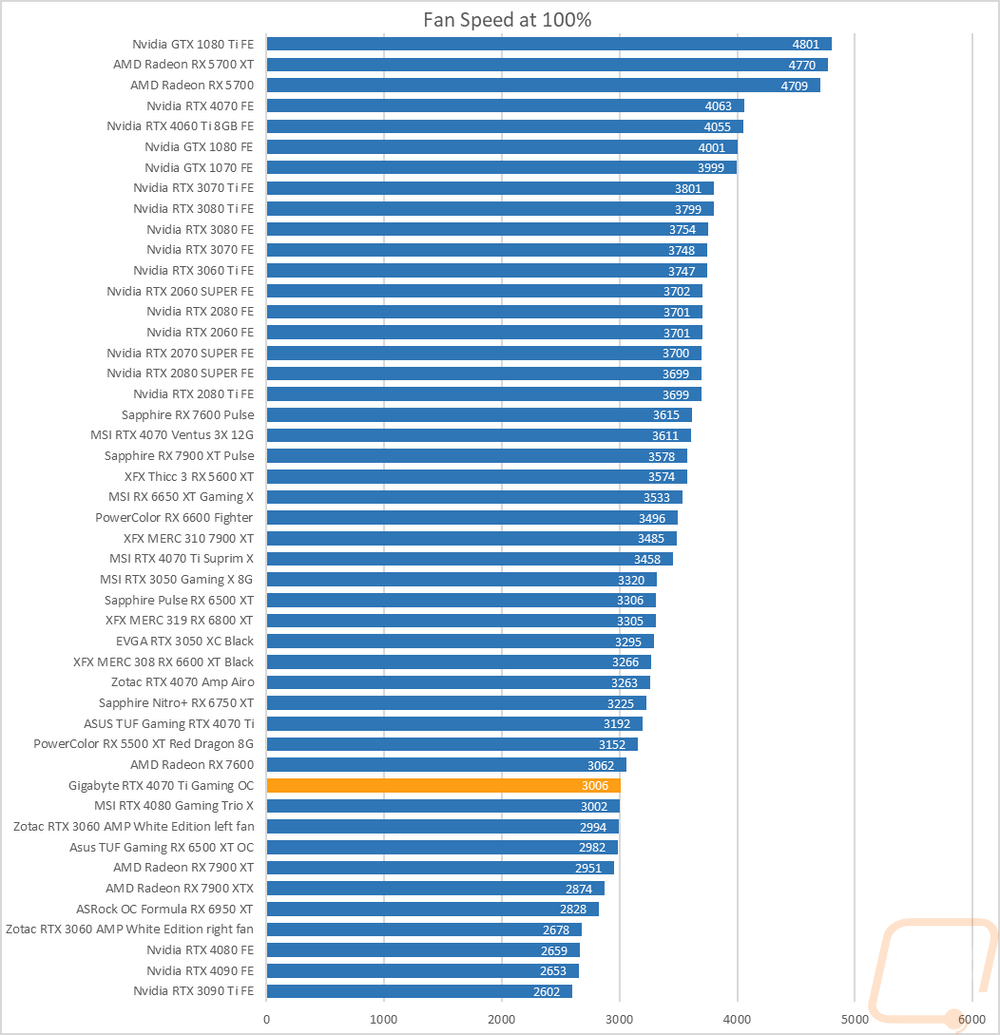
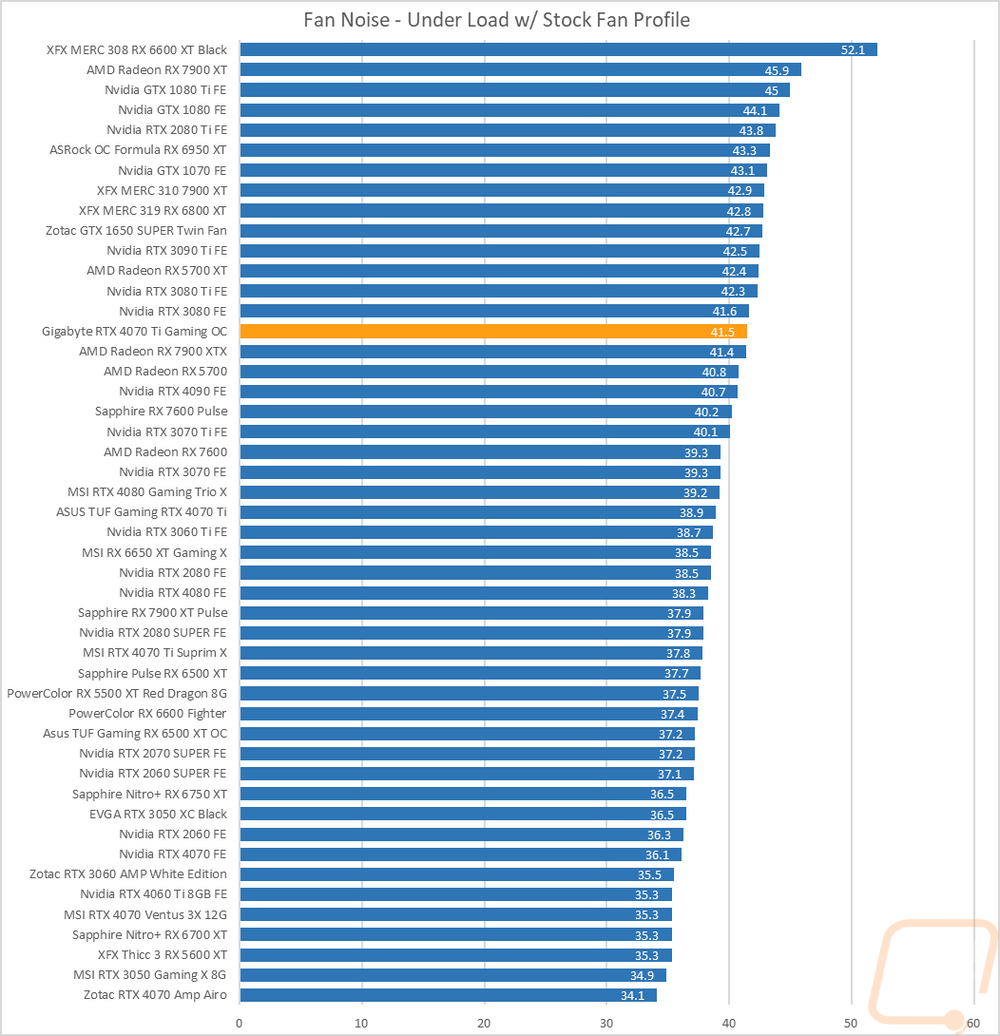
I also take a look at noise performance while under load. For that when running AIDA64’s stress test I wait until the temperature of the card has leveled off and then measure how loud things are when the card is at its worst-case scenario with the stock fan profile. Here the RTX 4070 Ti Gaming OC is a little higher than average with its load noise level at 41.5db, this was 2.6 db higher than the Asus TUF card and 3.7 higher than the Suprim X, an interesting change from the previous noise tests which showed how quiet the card could be. This is because when under load the Gaming OC was at a crazy 74% fan speed, the highest on our chart.
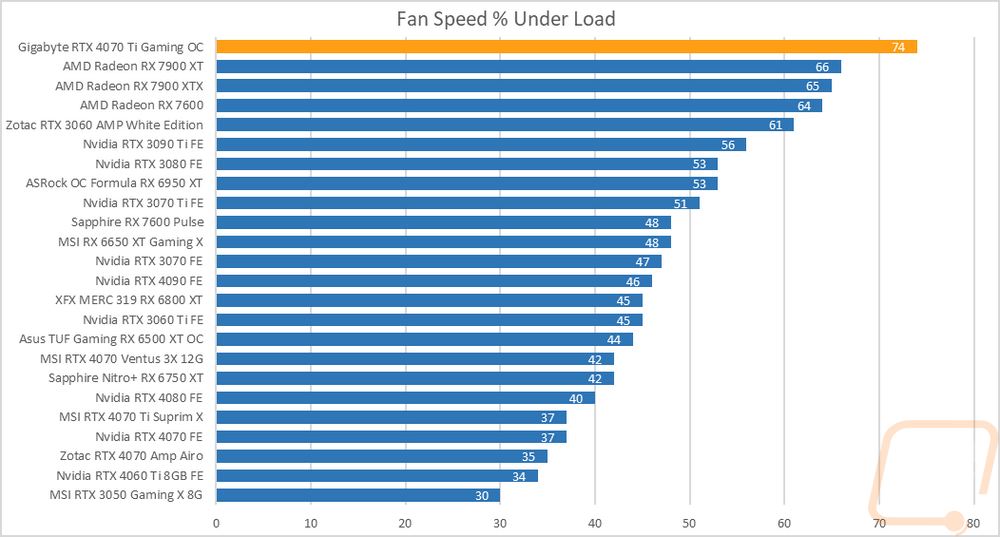
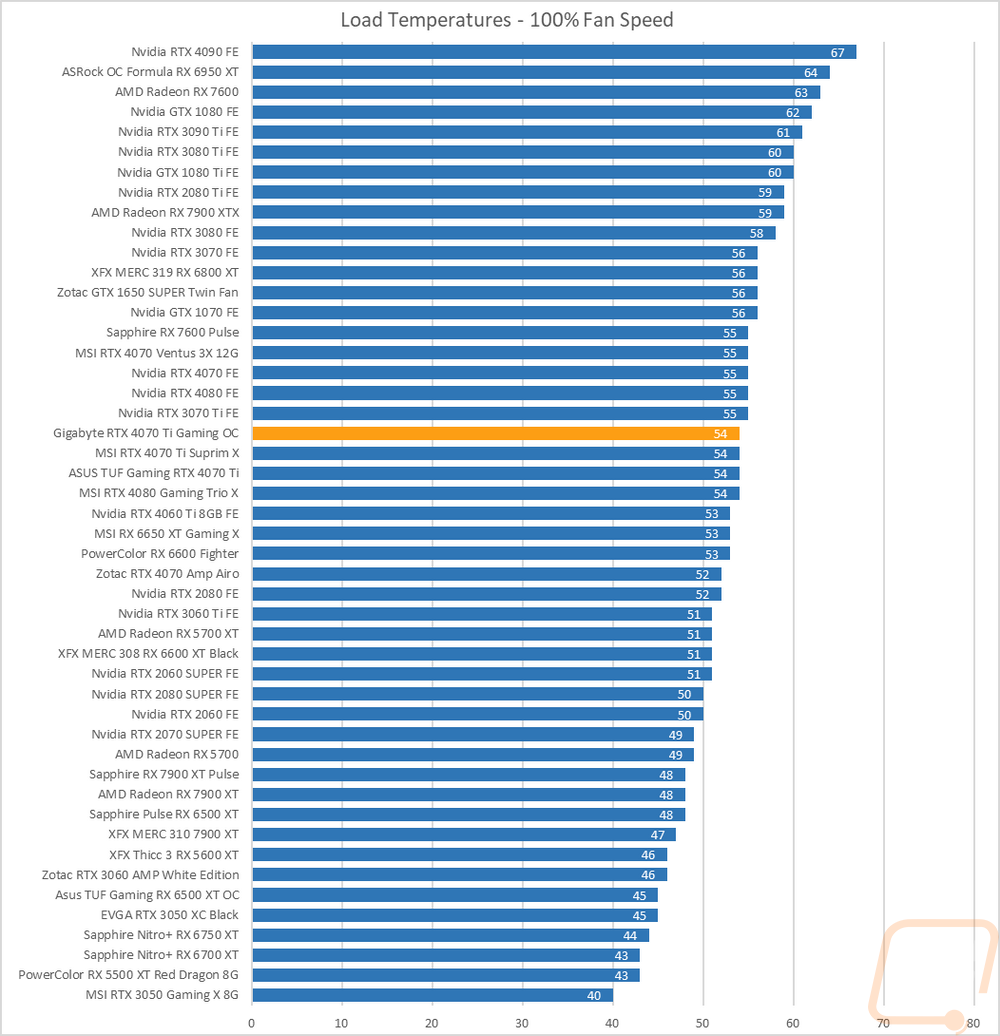
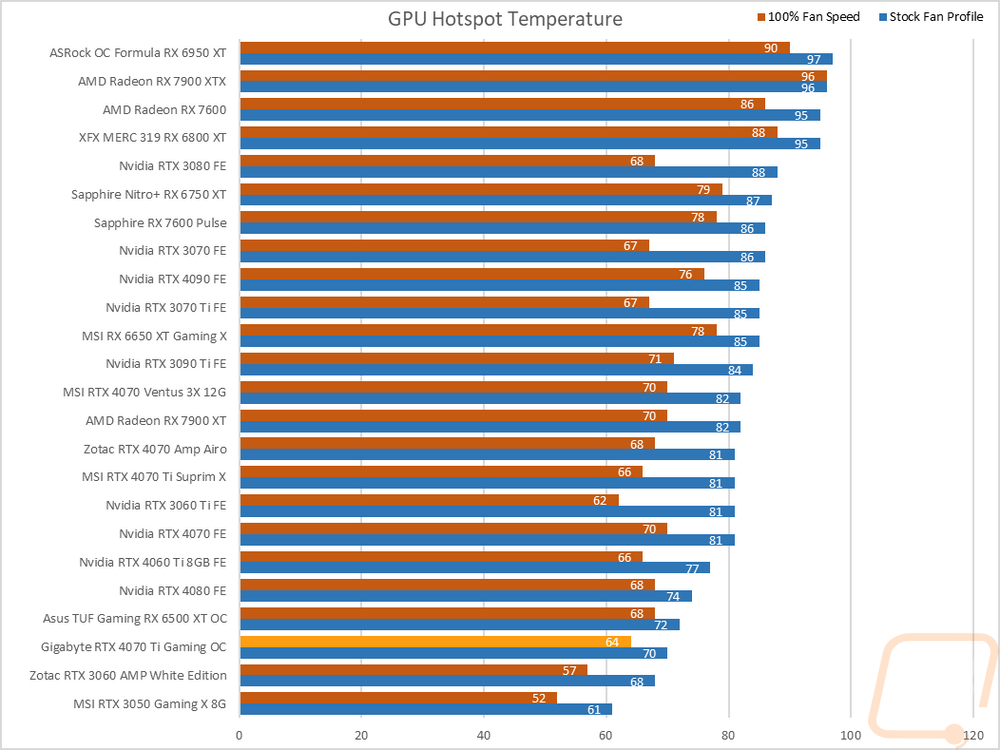
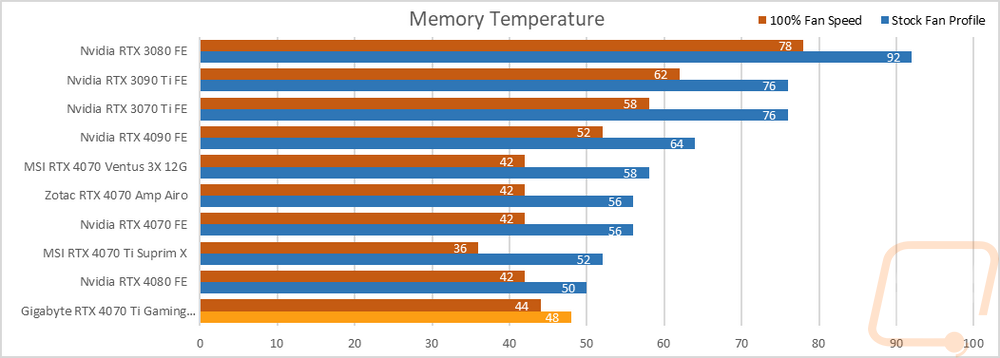
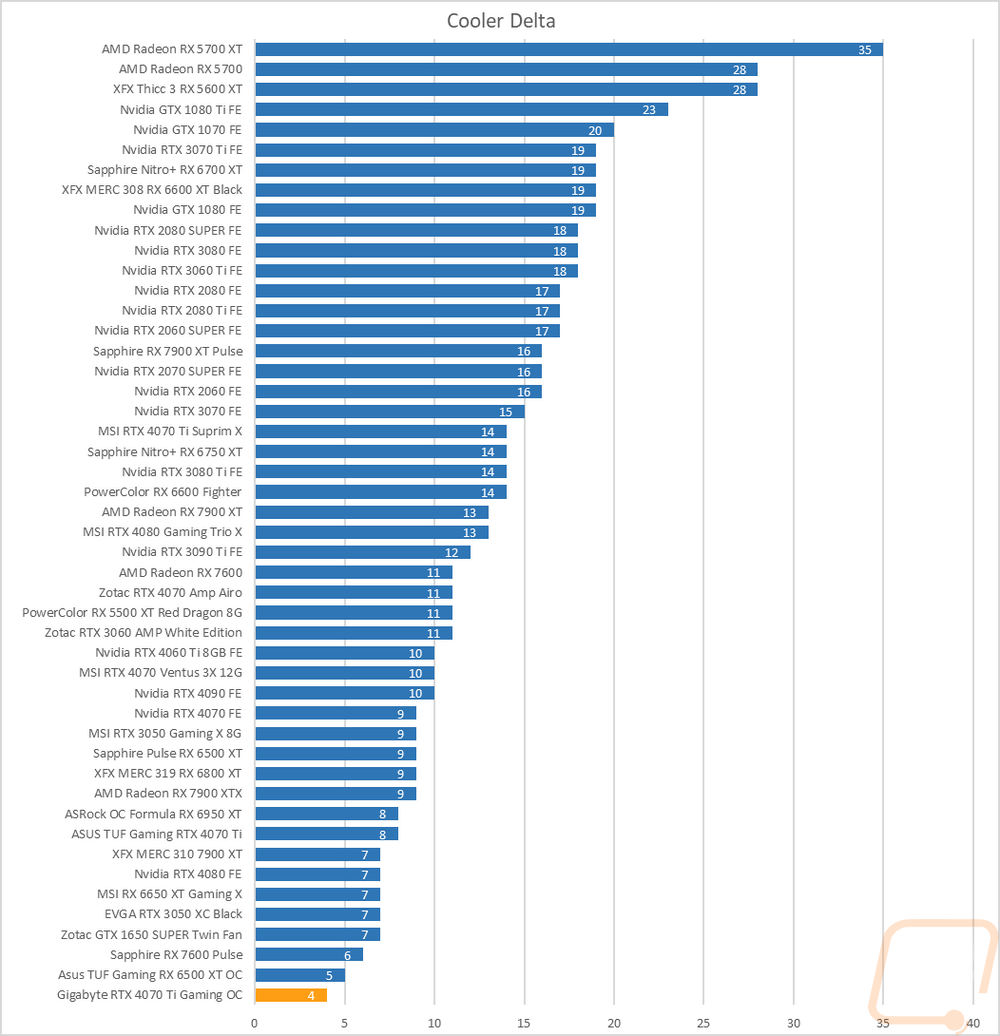
To finish up my testing I of course had to check out the cooling performance. To do this I ran two different tests. I used AIDA64’s Stress Test run for a half-hour each to warm things up. Then I documented what temperature the GPU leveled out at with the stock fan profile and then again with the fans cranked up to 100%. With the stock profile, the RTX 4070 Ti Gaming OC ran extremely cool down at 58c in fact which was 10c cooler than the Suprim X. This explains the crazy fan speeds and how noisy it was under load. The GPU hotspot was at 70c and the memory was at 48c both near or at the bottom of the charts. This profile is a lot more aggressive than it needs to be. Then with the fans cranked up, the Gigabyte RTX 4070 Ti Gaming OC came in at 54c which is right in the middle of the pack and right with the Suprim X. The GPU hotspot dropped down to 64c, and for memory it went down to 44c. Because of the crazy stock fan profile, the delta between the stock fan profile and 100% fan speed was just 4c which is low and shows it is using most of the cooling all of the time. But we know this is because it is running at 74% fan speed when under load and keeping the card abnormally cool.
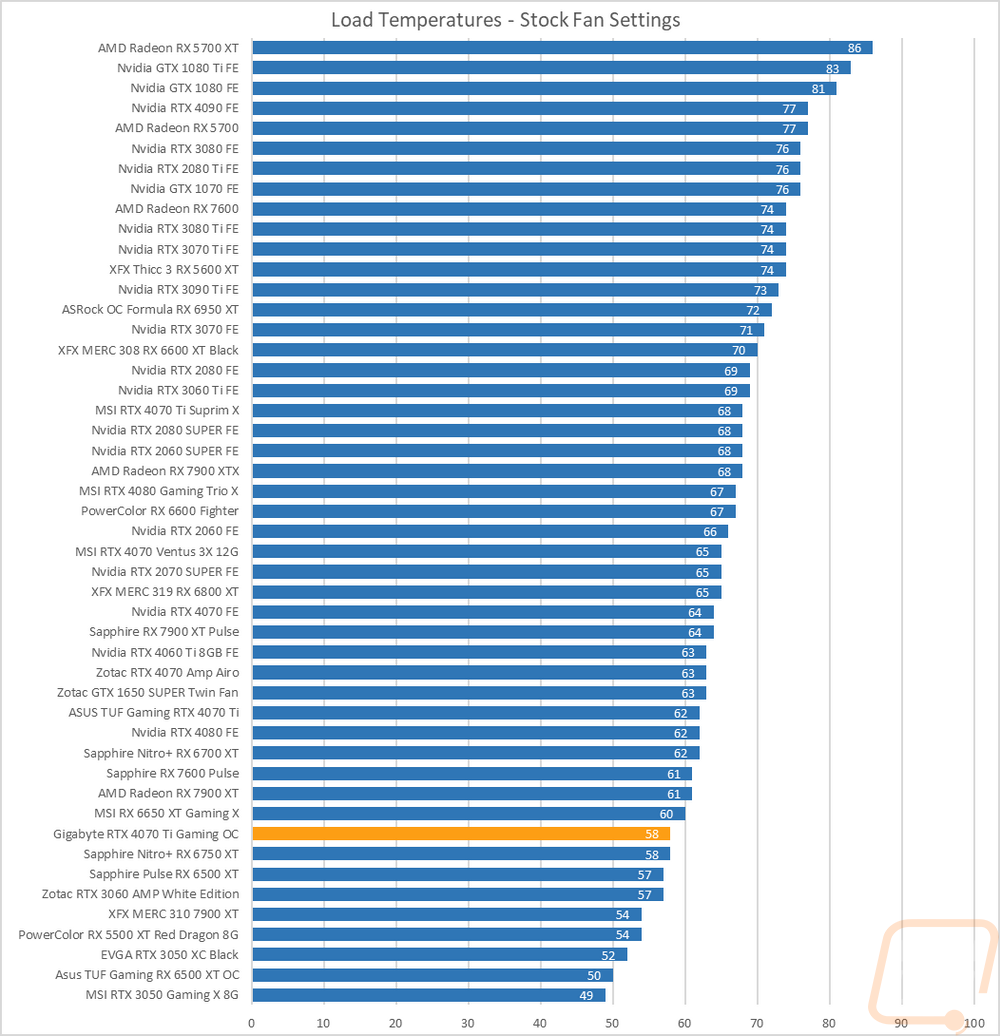
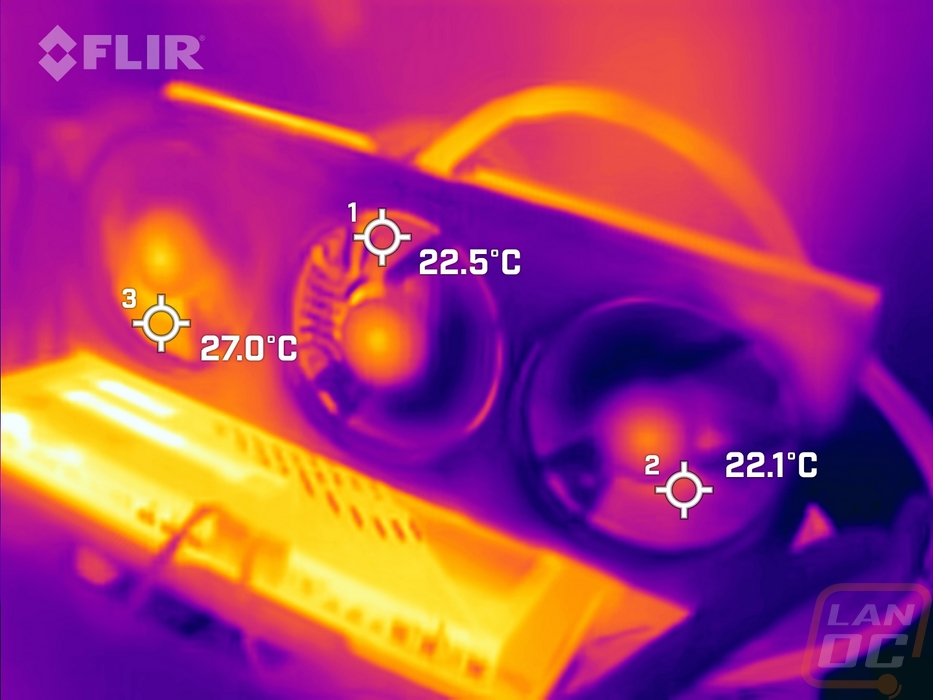
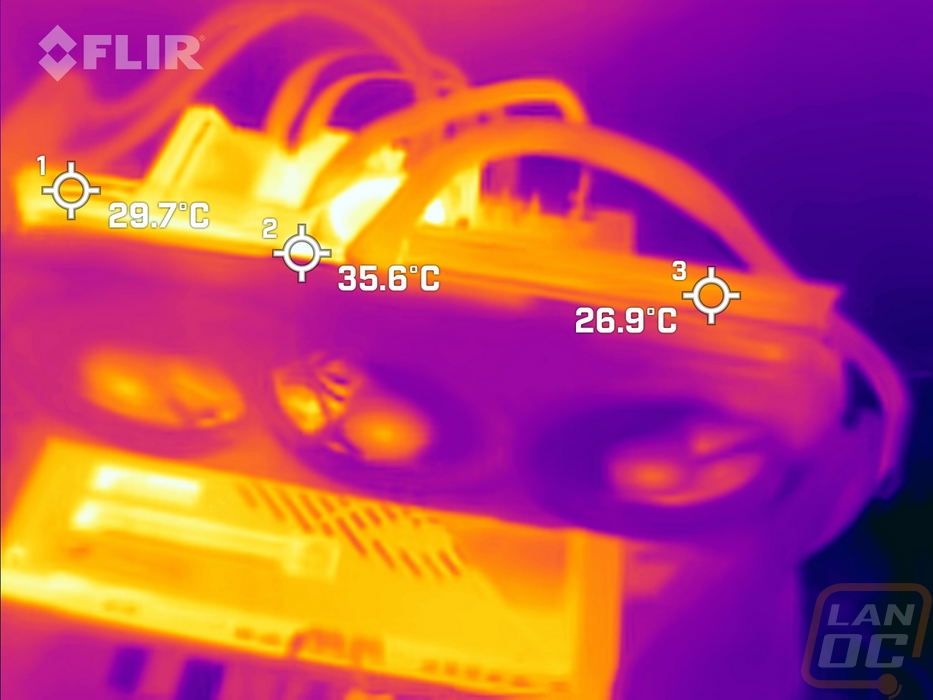
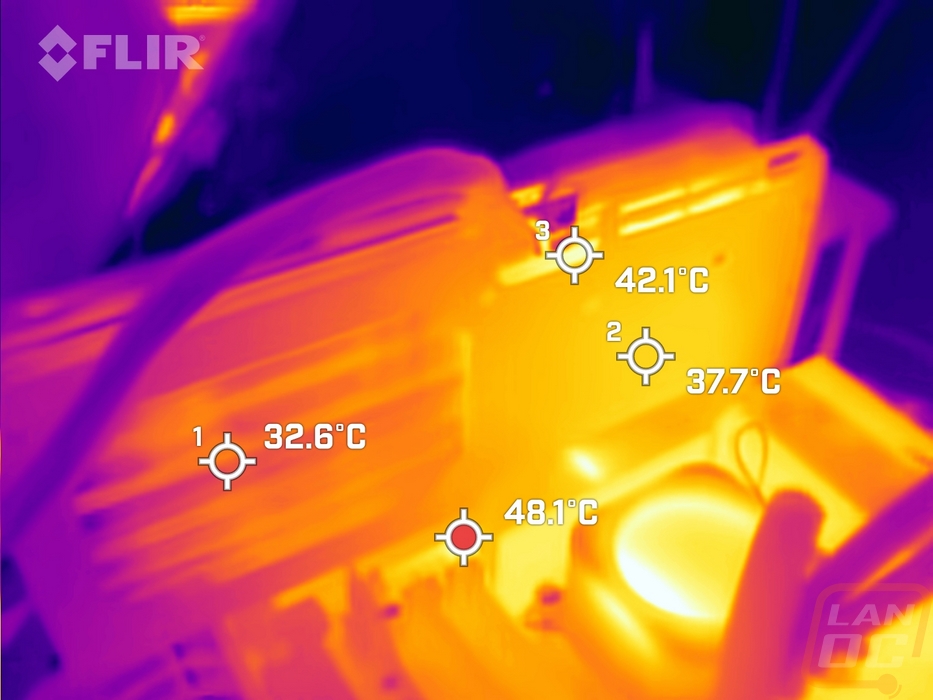
While running the stock fan profile testing I also took the time to get a few thermal images so we could see what is going on. On the fan side of the Gigabyte RTX 4070 Ti Gaming OC, you can see that it is noticeably cooler on the end of the card with the blow-through area and the thicker heatsink, but even on the other end things aren’t too hot. It is hotter up on the top edge where the fans are blowing the warmed air up, especially on the left side. Then at the back, the same can be seen once again with a 10c difference from one side of the card to the other. The heatpipes are pulling the heat over to the better cooling side but it looks like it’s not enough to even the cooling out completely.
Overall and Final Verdict
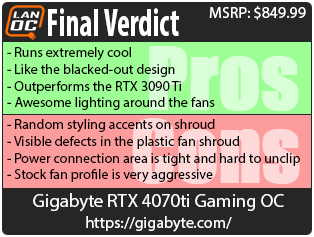
With all of our testing out of the way and having taken a closer look at the Gigabyte RTX 4070 Ti Gaming OC already we can finally sit back and process everything we saw. As far as aesthetics go the RTX 4070 Ti Gaming OC does have the blacked-out look that always goods good and keeps things simple and easy to match up with other components in your build. I wasn’t a big fan of the seemingly random accents all over the fan shroud that didn’t go with each other, but that blacked-out look at least made it so that those weren’t too in your face where some cards will use colors for accents. The RTX 4070 Ti Gaming OC has the Gigabyte logo up on the top edge which is backlit in addressable RGB lighting and I’m never a big fan of the “Times Square” look that too much of that can do, especially if you buy components from different companies. But the lighting that gave the Gaming OC around the fans more than makes up for that. The fan lighting is unique and looks different each time you see it because of the way it blends the lighting changes depending on the fan speeds.
I don’t think that every card will run into the issue, but we did have discolored defects in the fan shrouds plastic. I also wish that they had at least flipped the 12VHPWR connection around to make that easier to reach because the heatsink hardly leaves room to get a finger in to unclip that if you have to remove it. Also while not as big as the Suprim X, the Gaming OC is a big card and you will have to keep that in mind when picking a case to go around it.
As for performance the small overclock that Gigabyte gave the card was hardly enough to register in some of the tests. It did outperform the other 4070 Ti’s in some tests but when it came to the averaged in-game numbers the only card with a noticeable overclock was the Suprim X. In my opinion that performance wasn’t worth the increased power draw and lower efficiency. Its performance was enough to outperform the RTX 3090 Ti which is good to see but AMD is once again ahead in pure raster performance for the money with the RX 7900 XT still being faster. It’s not on Gigabyte at all, they sell both sides. But Nvidia is betting that the crazy performance that DLSS 3 can offer in games that support it (which that game list is growing quickly) will be worth it and if the games you are looking to play support DLSS 3 then it is without a doubt worth it. But if your games aren’t supported then you are out of luck. Ray tracing performance is also a big benefit as well, with the 4070 Ti still handling that better. In the end, it is all depending on what you are going to be playing.
As for cooling performance, the Gaming OC was impressive with just how cool it runs when under load. Of course, that is because the fan profile is way too aggressive, causing the fans to run at 74% when under load. This takes what was impressively quiet fans and in comparison when under load the Gaming OC is loud. It does have the silent BIOS mode, we test cards on the BIOS mode that they ship. But I suspect that the silent mode is going to be the better option. Quieting down the under load noise and cutting back on power.
Gigabyte has the RTX 4070 Ti Gaming OC priced at $849.99 and that is in line with the other overclocked RTX 4070 Ti’s with the Suprim X being significantly higher than that when you can find them. The $50 extra over a stock-clocked RTX 4070 Ti may not be worth it when it comes to the overclock but I do think it is worth it for the extra cooling performance and if you like lighting the RGB lighting around the fans add to that value as well. That is of course when we are comparing 4070 Ti’s to other 4070 Ti’s. Is this the option to get compared to the RX 7900 XT? If just pure raster performance is all you are looking for, the 7900 XT is still going to be a better value and Gigabyte has a Gaming OC version of that as well. If the games you play can utilize DLSS 3 and or ray tracing performance is important to you then the 4070 Ti be a better value. It’s up to you to decide that one, but either way the Gigabyte Gaming OC isn’t too bad of an option even with its flaws.
Live Pricing: HERE


