Cooling Noise and Power
For my last few tests, rather than focusing on in game performance, I like to check out other aspects of video card performance. These are also the most important ways to differentiate the performance between cards that have the same GPU. To start things off I took a look at power usage.
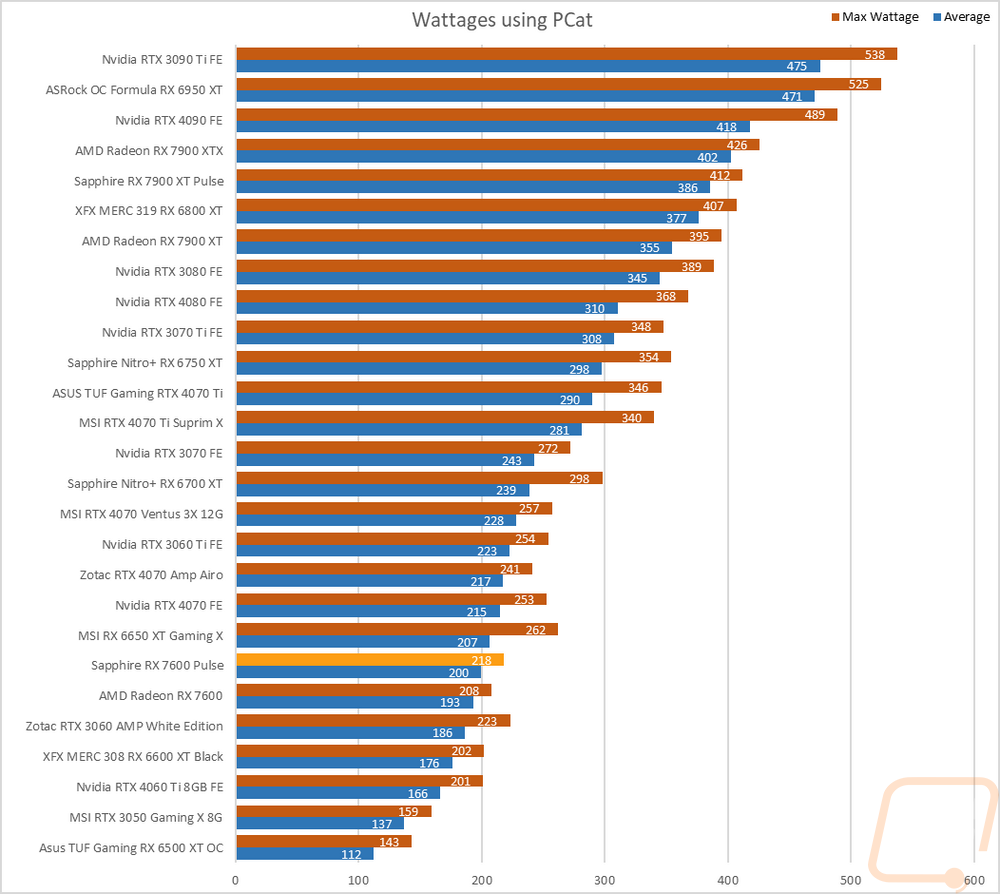
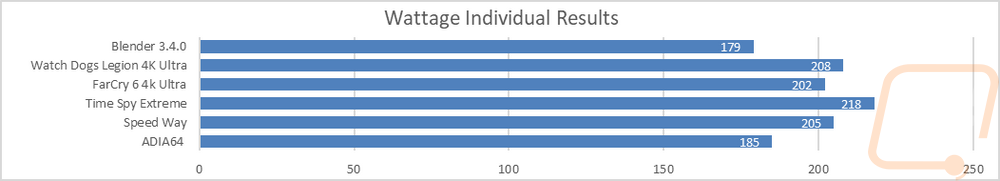
For this, our new test setup utilizes the Nvidia-designed PCat v2 along with cables to handle both traditional 6 or 8-pin connections as well as the new 12VHPWR. The PCat also utilizes a PCIe adapter to measure any power going to the card through the PCIe slot so we can measure the video card wattage exclusively, not the entire system as we have done in the past. I test with a mix of applications to get both in game, synthetic benchmarks, and other workloads like Blender and AIDA64. Then everything is averaged together for our result. I also have the individual results for this specific card and I document the peak wattage result as well which is almost always Time Spy Extreme. The Sapphire RX 7600 Pulse with its slight overclock came in at 218 watts in the highest test which was 10 watts more than the reference RX 7600 and 200 watts for the overall average across all of our tests which is 7 watts more than the reference card. This is still down at the bottom 1/3 of the chart but for comparison, the overclocked RX 6600 was at 202 and 176, so we don’t have an improvement here, in fact, this is a little worse. This is even more noticeable once you add the new RTX 4060 Ti into the mix which has an average of just 166 with 201 watts at its highest.
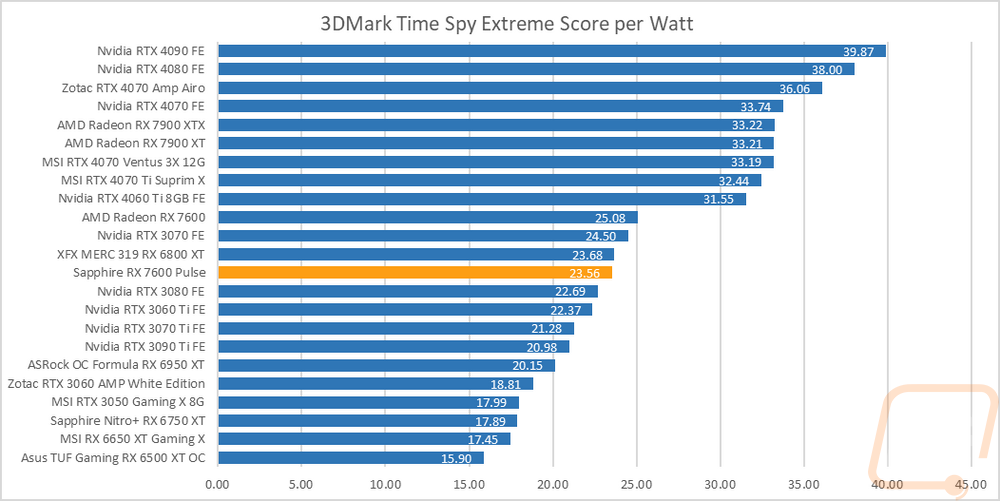
With having exact peak wattage numbers when running Time Spy Extreme I was also able to put together a graph showing the total score for each watt that a card draws which gives us an interesting look at overall power efficiency in the popular and demanding benchmark. The Sapphire RX 7600 Pulse with its overclock and more power usage than the reference card came in at .12 of a point per watt lower than the older RX 6800 XT and 1.52 per watt lower than the reference card. So the slight bump in performance is traded off in overall efficiency. Really both cards are still a lot lower than I would like them to see, there is a clear line between all of the other new-generation cards including the 7900 XT and 7900 XTX, and the RX 7600 should be up near those cards but it isn’t.
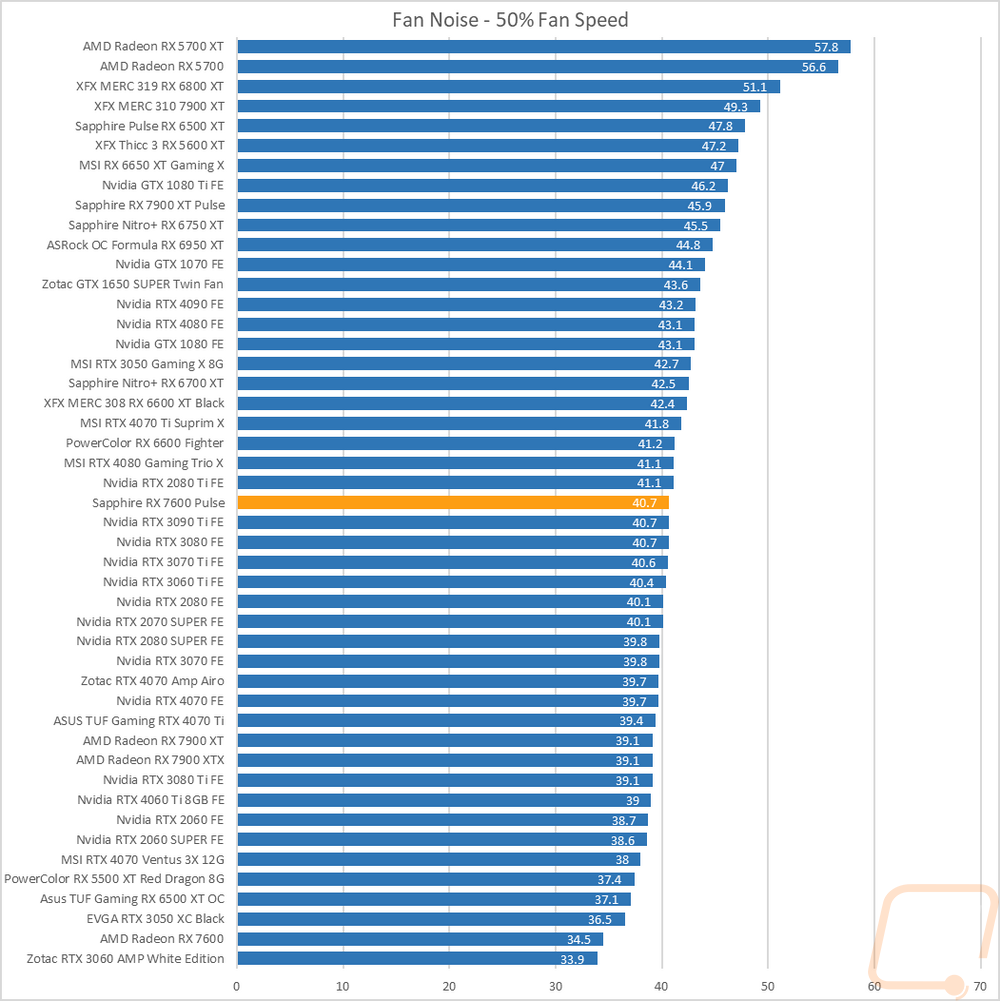
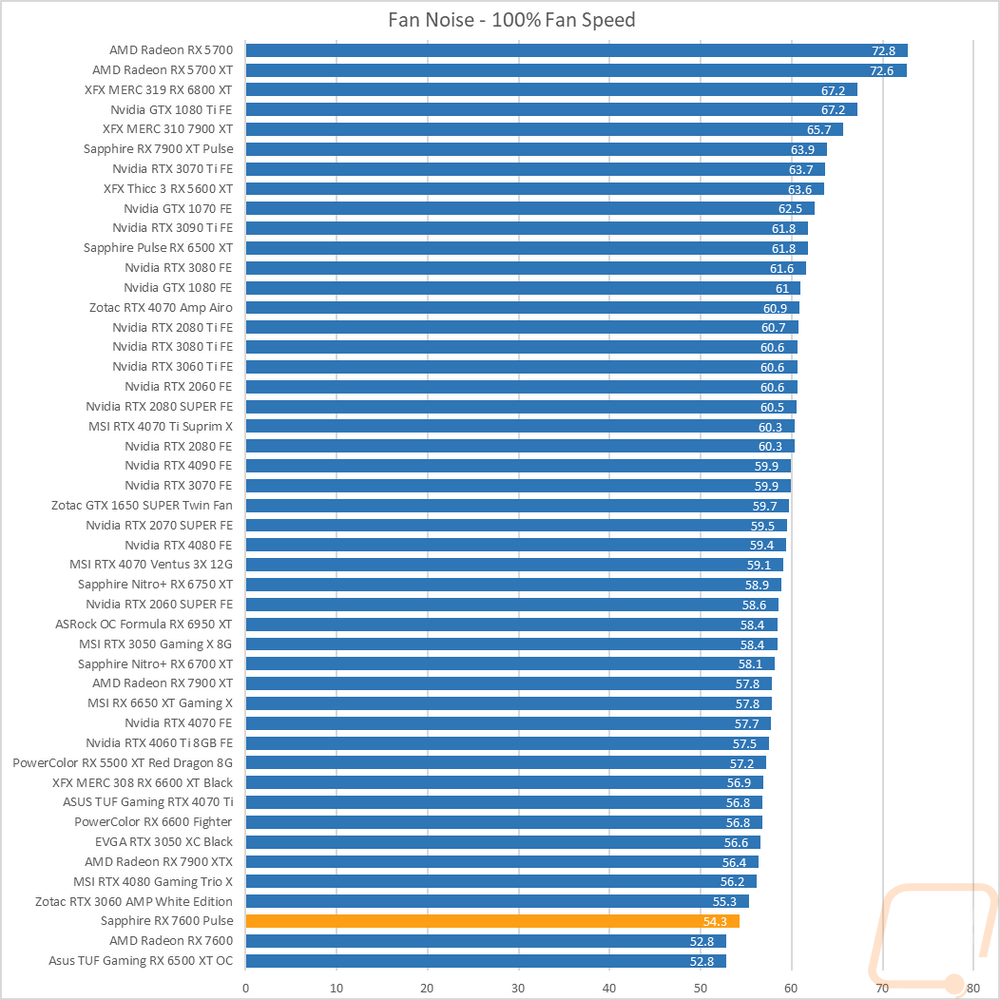
My next round of tests were looking at noise levels. These are especially important to me because I can’t stand to listen to my PC whirling. Especially when I’m not in game and other applications are using the GPU. For my testing, though I first tested with the fan cranked up to 100% to get an idea of how loud it can get, then again at 50% to get an idea of its range. The Sapphire RX 7600 Pulse came in at an impressive 54.3 decibels for the 100% fan speed result which put it down near the bottom of the chart but just slightly above the reference card. Its 50% was 40.7 decibels which is in the middle of the chart and average.
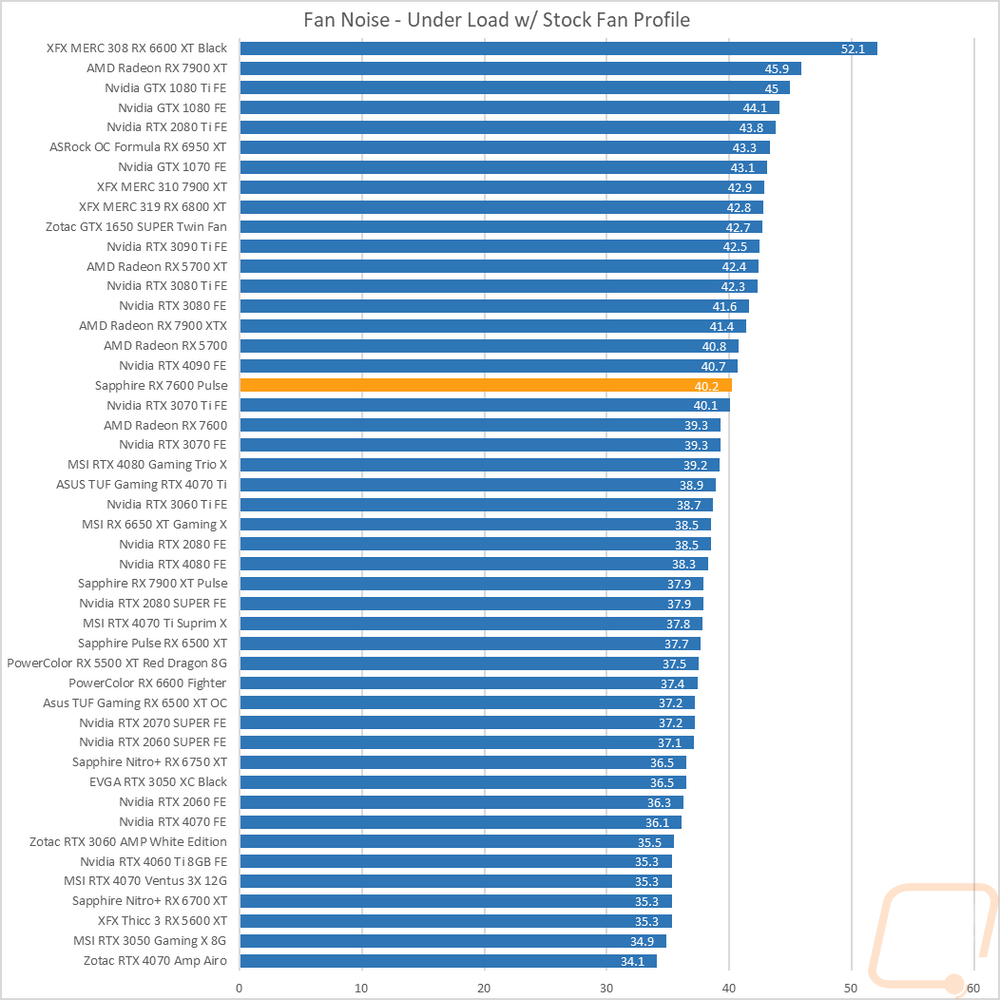
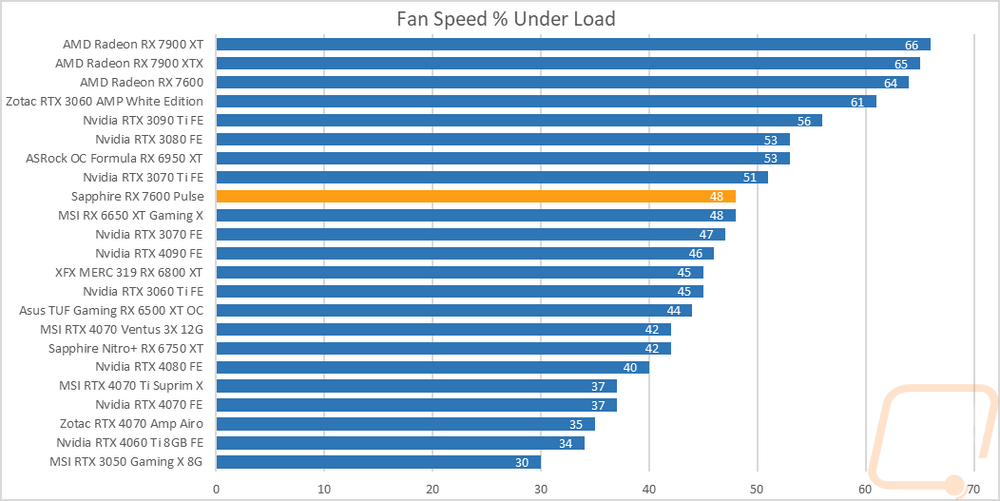
I also take a look at noise performance while under load. For that when running AIDA64’s stress test I wait until the temperature of the card has leveled off and then measure how loud things are when the card is at its worst-case scenario with the stock fan profile. Here the Sapphire RX 7600 Pulse, like with its 50% fan speed result is in the middle of the pack, which makes sense because while under load it was running at 61% fan speed. That is an improvement over the reference card which in the same situation was running at 74%.
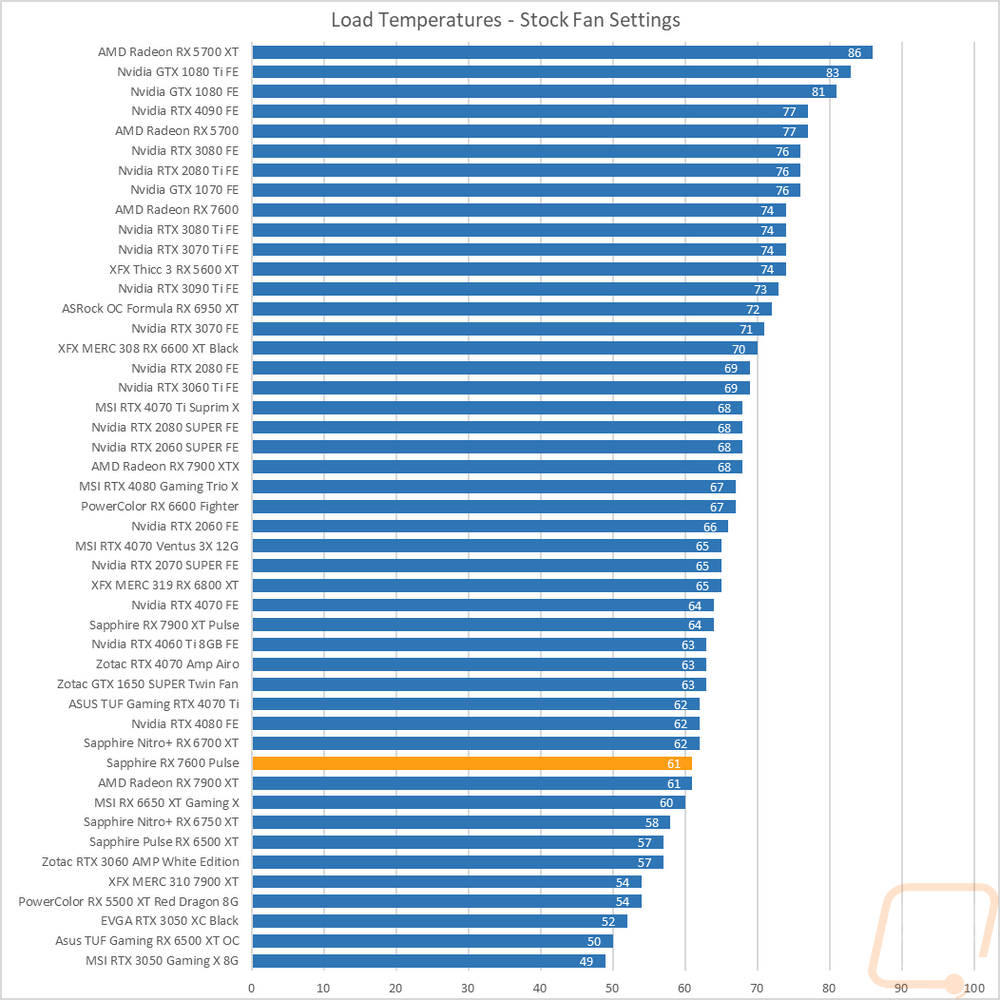
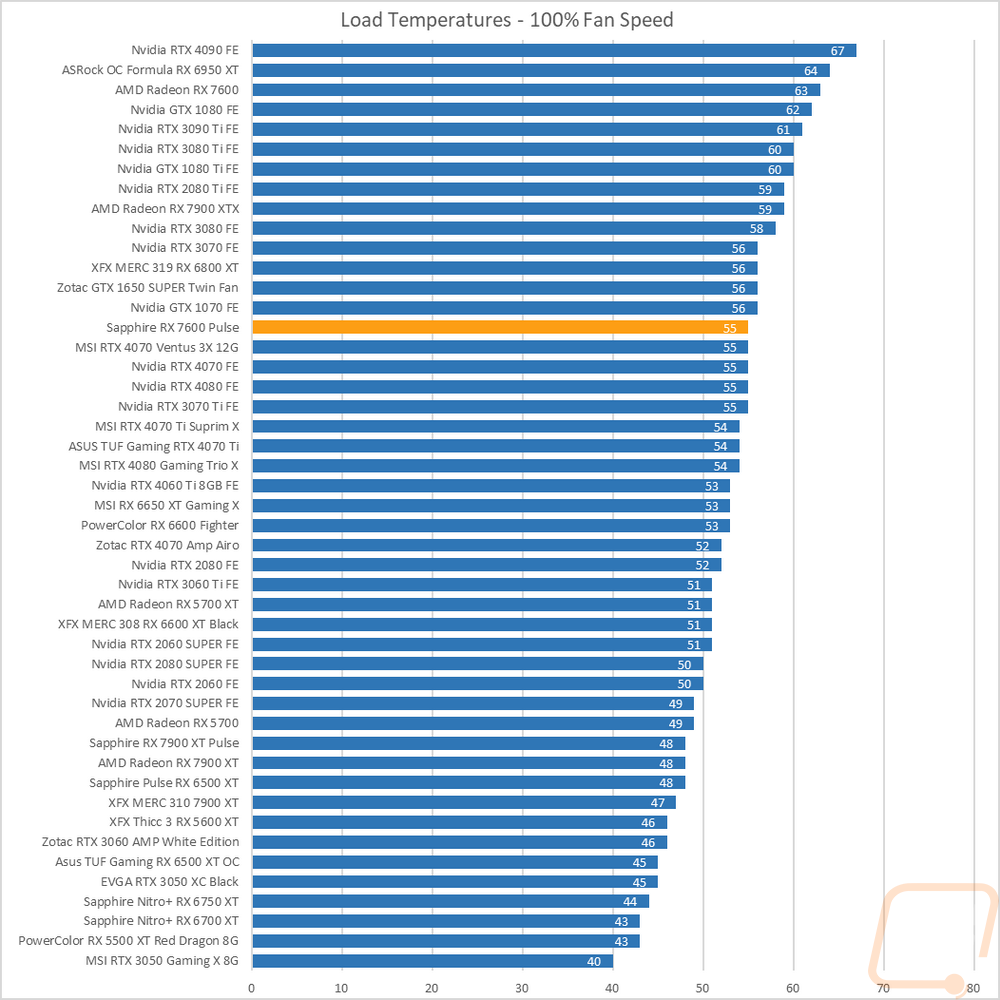
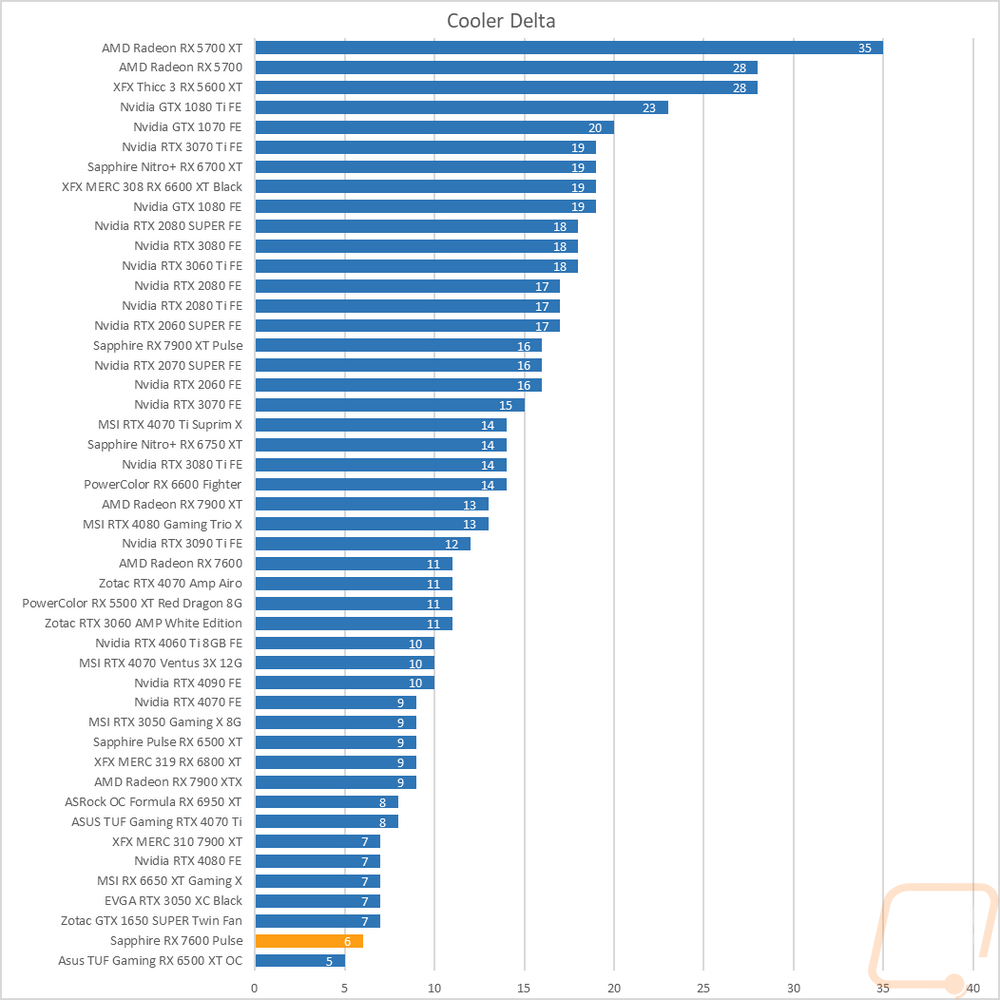
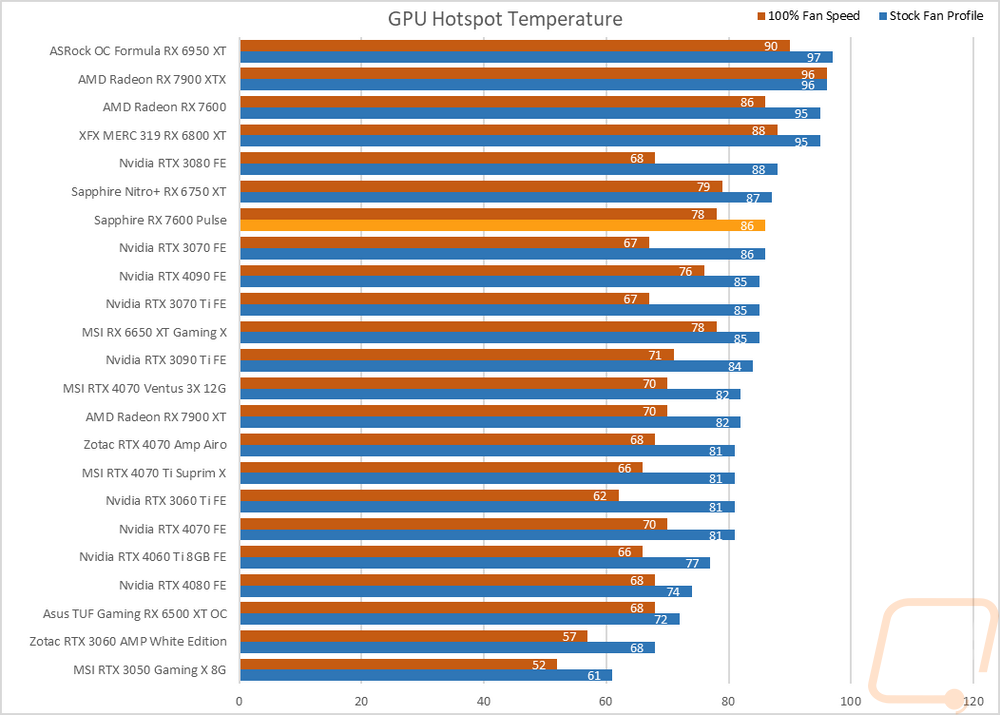
To finish up my testing I of course had to check out the cooling performance. To do this I ran two different tests. I used AIDA64’s Stress Test run for a half-hour each to warm things up. Then I documented what temperature the GPU leveled out at with the stock fan profile and then again with the fans cranked up to 100%. With the stock profile, the Sapphire RX 7600 Pulse did well leveling off at 61c which puts it in the bottom ¼ of the chart and this is 13 degrees lower than the reference card. The GPU hotspot in that same situation was at 86c, 9c down from the reference as well. Then with the fans cranked up, the Sapphire RX 7600 Pulse leveled off at 55c which is in the upper-middle portion of our results. That is still 8c better than the reference card at 100% fan speed and the GPU hotspot was down to 78c which is 8c lower than the reference as well. The delta between the two situations was just 6c which is a little low but overall the Sapphire RX 7600 Pulse is a huge improvement compared to the reference cooler which is what we want to see.
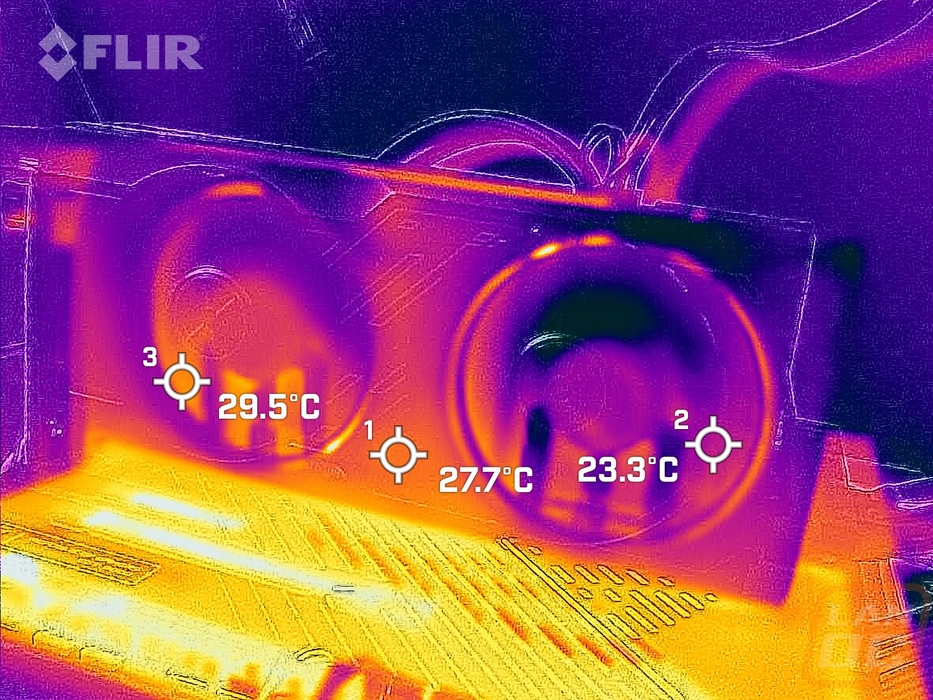
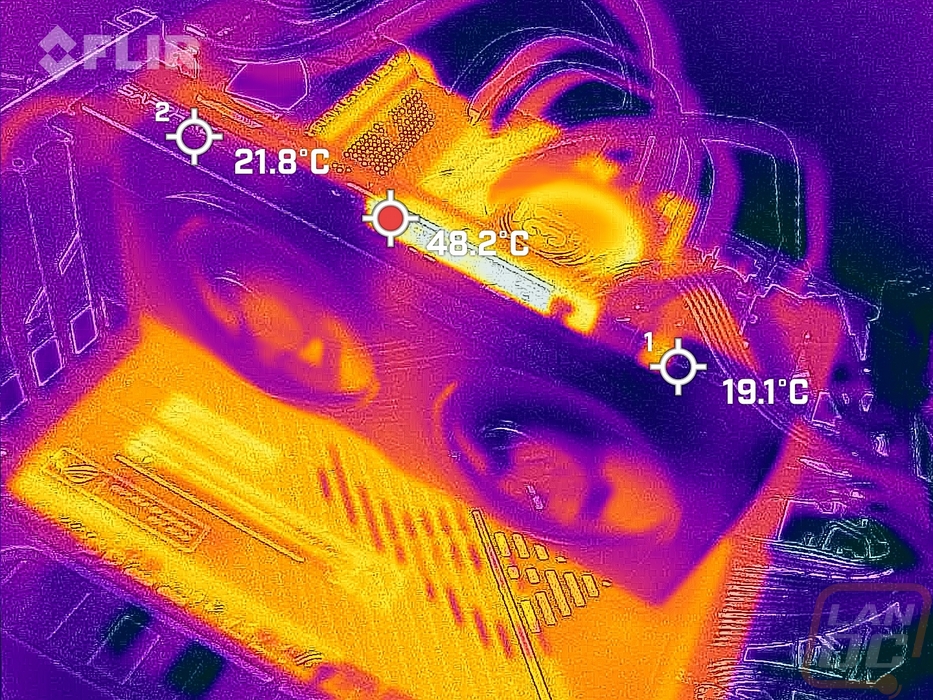
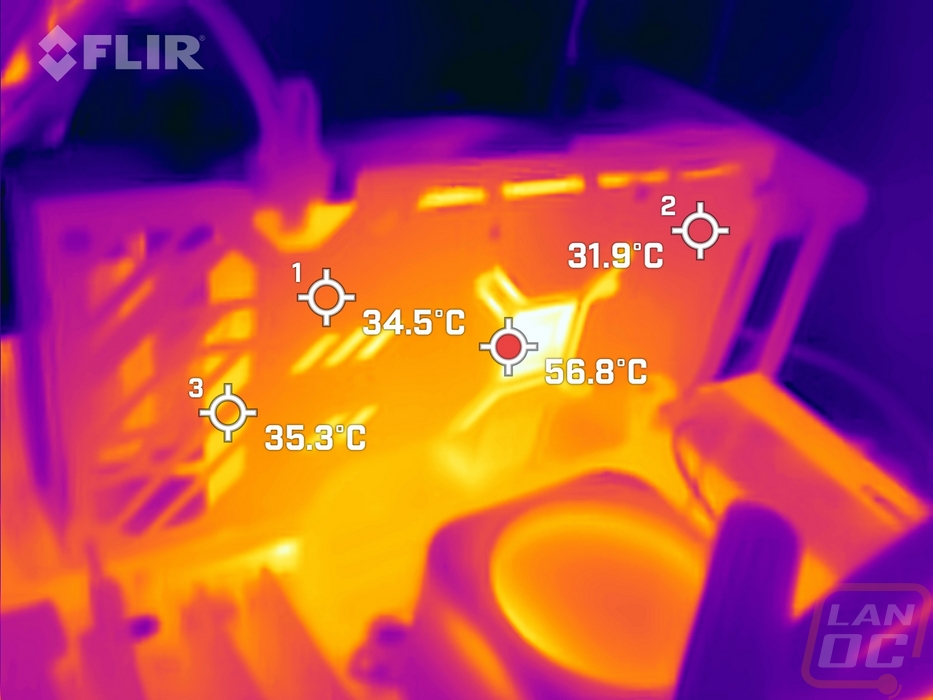
While running the stock fan profile testing I also took the time to get a few thermal images so we could see what is going on. The fan side of the RX 7600 Pulse is looking nice and cool, cool enough that it is making the motherboard look like it is running hot. Up on the top edge of the card in the center where we have some exposed PCB and the exposed heatsink, but as we saw earlier the design should be pushing most of the air towards the ends of the cards so any extra heat here on the top is just heat rising. The rear metal backplate is pulling some heat out but the hot spot here is of course the exposed back of the GPU socket as well as a few of the small windows in the backplate.