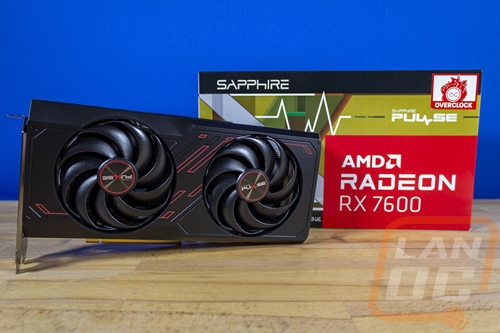
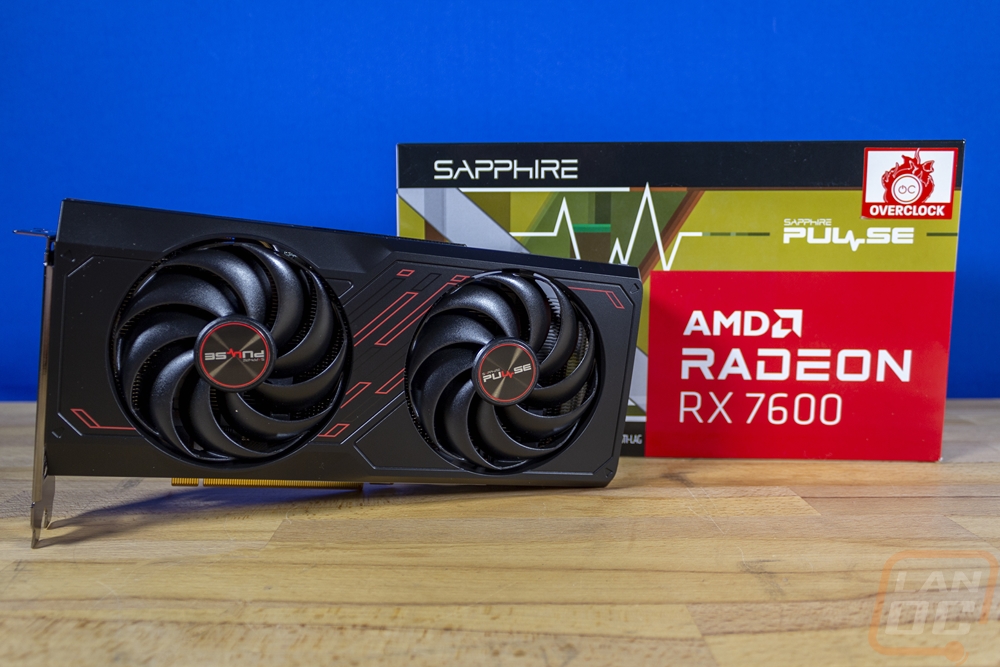
When I think of AMD cards, Sapphire is still the first brand that comes to mind. Much like EVGA did for Nvidia for years. So with today's launch of the Radeon RX 7600, in addition to checking out the reference card which we already have done, I’ve also got the Sapphire RX 7600 Pulse. Their Pulse brand tries to bridge the gap between performance and affordability by cutting out things like RGB lighting. With a focus on 1080p performance, that is the exact mindset needed, so I’m excited to see what the Sapphire RX 7600 Pulse has to offer and to find out how the RX 7600 performs with a slight overclock and a hopefully it has better cooling performance than the reference design. So let’s dive in and see what the RX 7600 Pulse is all about.
Product Name: Sapphire RX 7600 Pulse
Review Sample Provided by: Sapphire
Written by: Wes Compton
Amazon Affiliate Link: HERE
All about the RX 7600
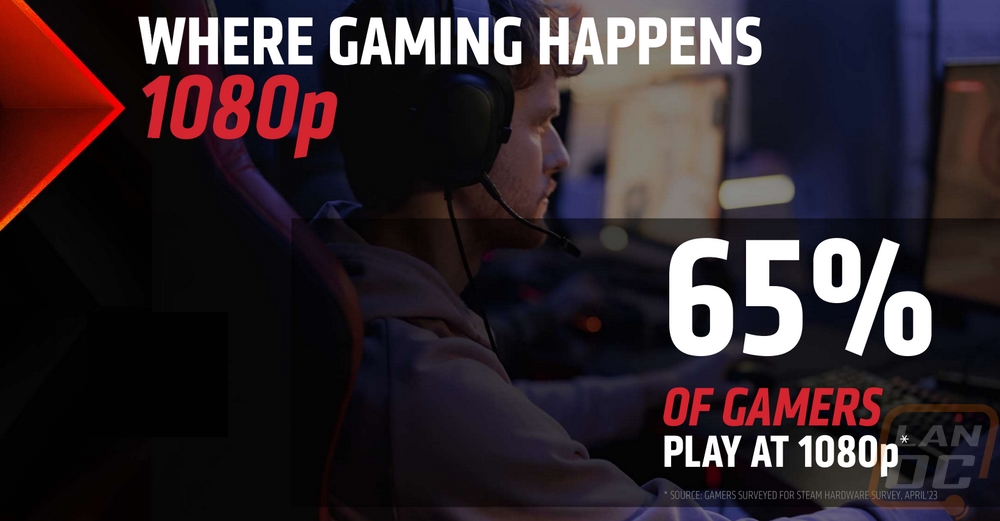
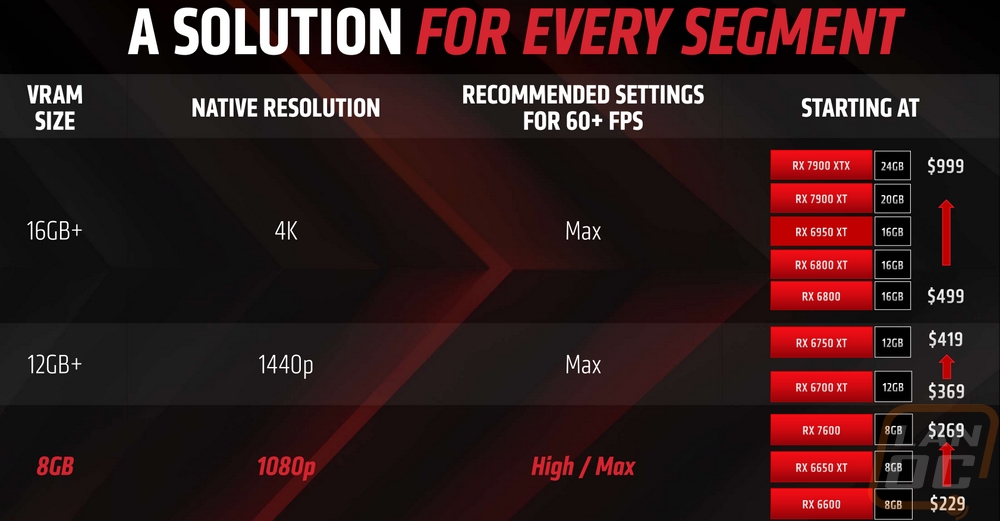
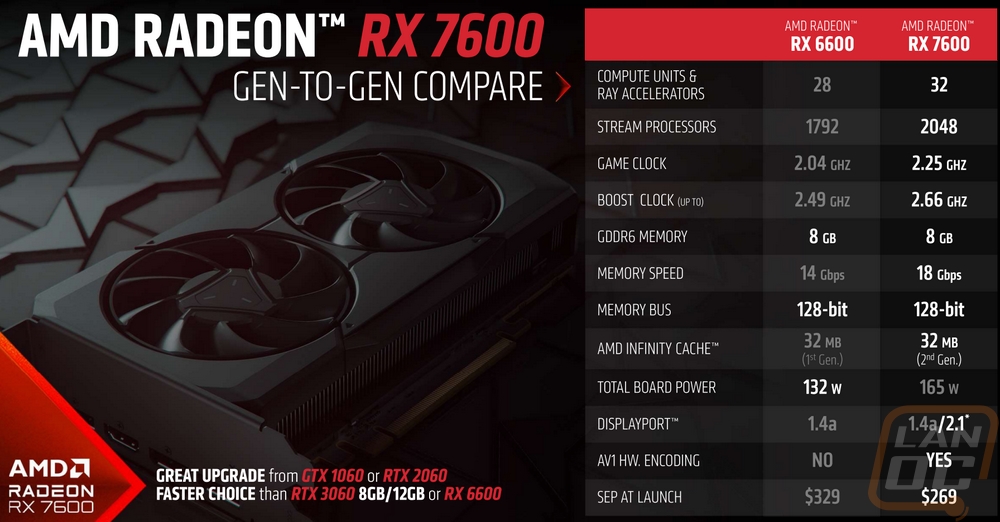
I spoke about it in yesterday's Nvidia RTX 4060 Ti review and I mentioned it in the opening here but it is easy to forget that a majority of gamers are playing at 1080p. With so many new cards coming out and being so capable at 1440p and 4k you would think that is what most people are using. So with the 65% of gamers who are playing at 1080p a lot of those higher-end cards might get them higher frame rates but in most cases, it would be overkill. Obviously, if you are planning a monitor upgrade soon it would still make sense to focus on a card capable of that. But if 1080p is still in your future, why not focus on cards designed specifically for that? The RX 7600 that we are looking at today falls into that category but if you were curious you can usually get a good idea of what a card's target is just by looking at the VRAM. AMD has their lineup broken up this way and Nvidia is similar as well. You can see AMDs current lineup in the picture below from AMDs presentation, interestingly we can see that right now they still have the RX 6650 XT and the RX 6600 as well in their 1080p focus, and because they skipped from their new RX 7900 XT, and RX 7900 XTX down to the RX 7600 everything in the lineup in between that is still from the 6000 Series.
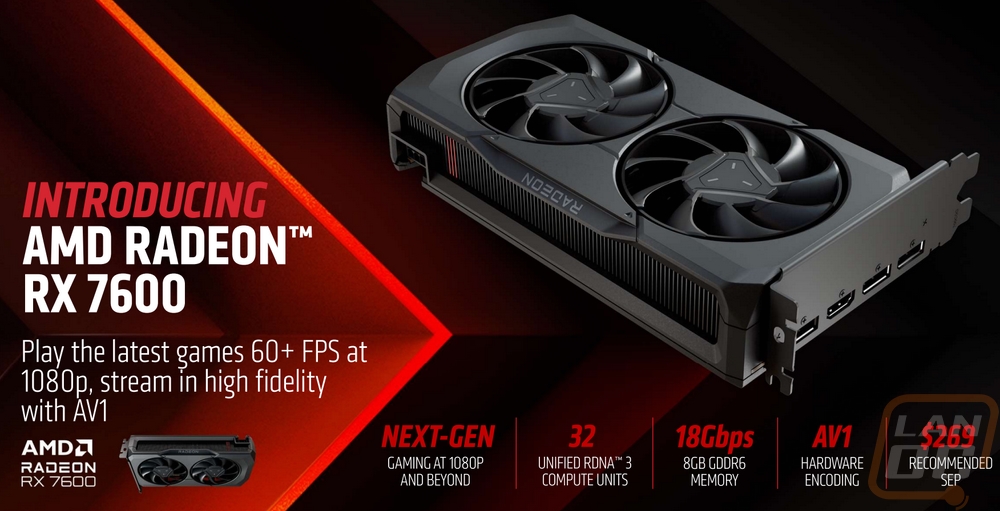
When comparing the new RX 7600 to the previous generation card, the RX 6600 we can see that the transistor count has increased from 11.1 billion to 13.3 billion but with the smaller 6nm build process the die size has also gotten smaller going from 237 mm² to 204 mm². In that smaller space, AMD has increased the compute unit count from 28 up to 32 and the new architecture also adds in the new AI accelerators as well. The stream processor count has improved from 1792 up to 2048. The RX 7600 also has higher game and boost clock speeds with the new boost clock at up to 2655 MHz. All of this together has made huge improvements in the single precision performance which on the RX 6600 was up to 8.93 TFLOPS and the RX 7600 is now up to 21.75 TFLOPS. The 8GB GDDR6 hasn’t changed at all, this is still a 1080p focused card and the RX 7600 still has a 128-bit memory bus but AMD did increase the memory speed up to 18 Gbps. With the higher clock speeds, even the power efficiency that the smaller build process wasn’t enough, the RX 7600 has a higher total board power of 165 watts compared to the RX 6600’s 132 watts. The smaller die size did help with the pricing as well as not being in the middle of a crypto (and covid) fueled card shortage with the price dropping from $329 of the RX 6600’s launch price down to $269 for the RX 7600.
|
Specifications |
Radeon RX 7600 |
Radeon RX 6600 |
|
Architecture |
RDNA 3 |
RDNA 2 |
|
Manufacturing Process |
6nm |
7nm |
|
Transistor Count |
13.3 billion |
11.1 billion |
|
Die Size |
204 mm² |
237 mm² |
|
Compute Units |
32 |
28 |
|
Ray Accelerators |
32 |
28 |
|
AI Accelerators |
64 |
- |
|
Stream Processors |
2048 |
1792 |
|
Game GPU Clock |
2250 MHz |
2044 MHz |
|
Boost GPU Clock |
Up to 2655 MHz |
Up to 2491 MHz |
|
Peak Single Precision Perf. |
Up to 21.75 TFLOPS |
Up to 8.93 TFLOPS |
|
Peak Half Precision Perf. |
Up to 43.5 TFLOPS |
Up to 17.86 TFLOPS |
|
Peak Texture Fill-Rate |
Up to 339.8 GT/s |
Up to 279 GT/s |
|
ROPs |
64 |
64 |
|
Peak Pixel Fill-Rate |
Up to 169.9 GP/s |
Up to 159.4 GP/s |
|
AMD Infinity Cache |
32 MB (2nd Gen) |
32 MB (1st Gen) |
|
Memory |
8GB GDDR6 |
8GB GDDR6 |
|
Memory Speed |
18 Gbps |
14 Gbps |
|
Effective Memory Bandwidth w/AMD Infinity Cache |
Up to 476.9 GB/s |
Up to 412.9 GB/s |
|
Memory Bus Interface |
128-bit |
128-bit |
|
PCIe Interface |
PCIe 4.0 x8 |
PCIe 4.0 x8 |
|
Total Board Power |
165W |
132W |
|
Launch MSRP |
$269 |
$329 |
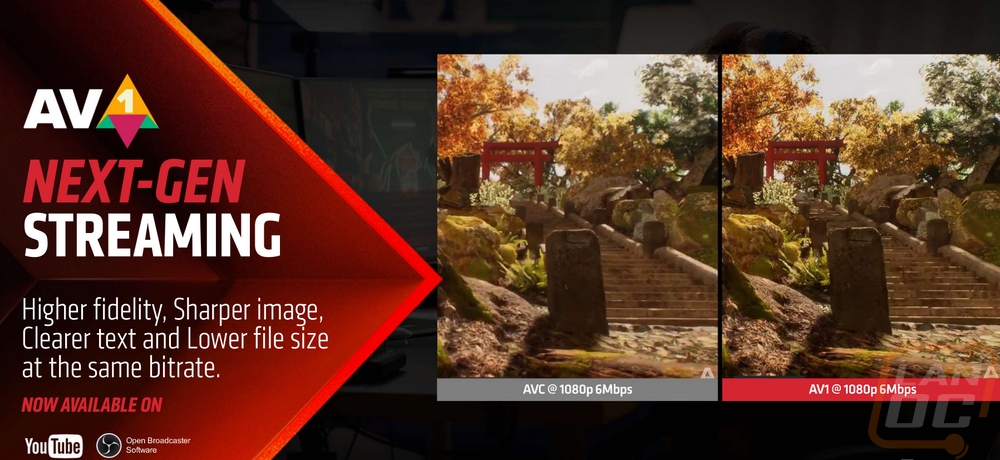
AMDs presentation did also highlight that they are supporting AV1 which is starting to pick up and will be very important. AV1 allows for better video quality at lower bitrates which has a few important uses. For streamers or if you are streaming your game on Discord to your friends this allows for better quality without clogging up your upload connection for those of us with cable internet. It’s not only streamers who will benefit though, AV1 support means less data transferred for companies like YouTube as well.
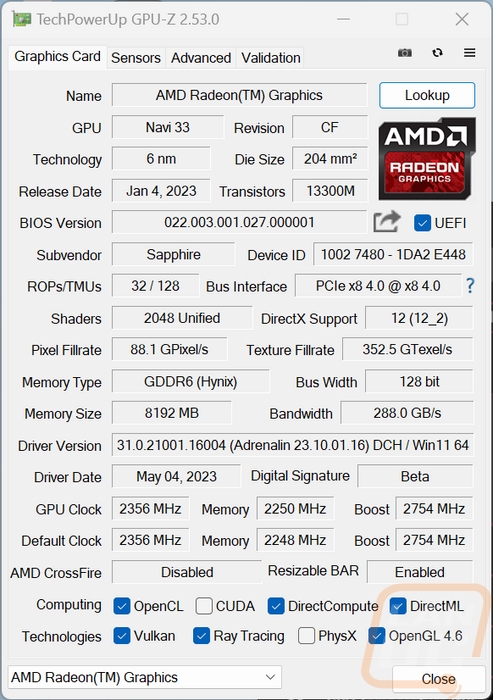
Before getting into testing I did also run GPUz to double-check that our clock speeds match up with the specifications. The Sapphire RX 7600 Pulse has a boost clock of 2751 MHz which is 96 MHz over the reference card's 2655 MHz boost clock speed. It also has a higher default clock speed of 2356 Mhz over the 2250 MHz on the reference card. They aren’t a huge overclock, but a small bump at least. Beyond that GPUz documents, our BIOS revision number in case that is needed in the future as well as the driver I tested on which is the Adrenalin 23.10.01.16 beta press driver from ahead of the launch.
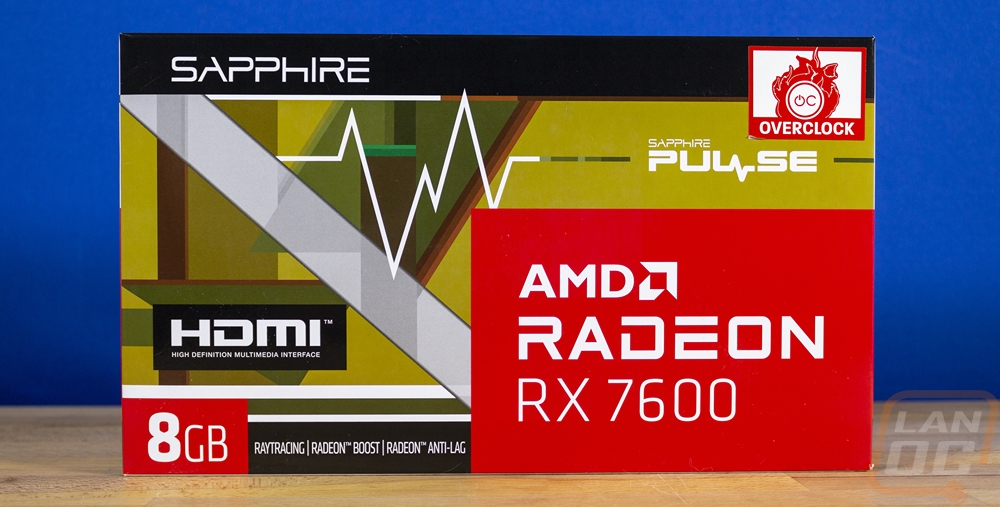
Packaging
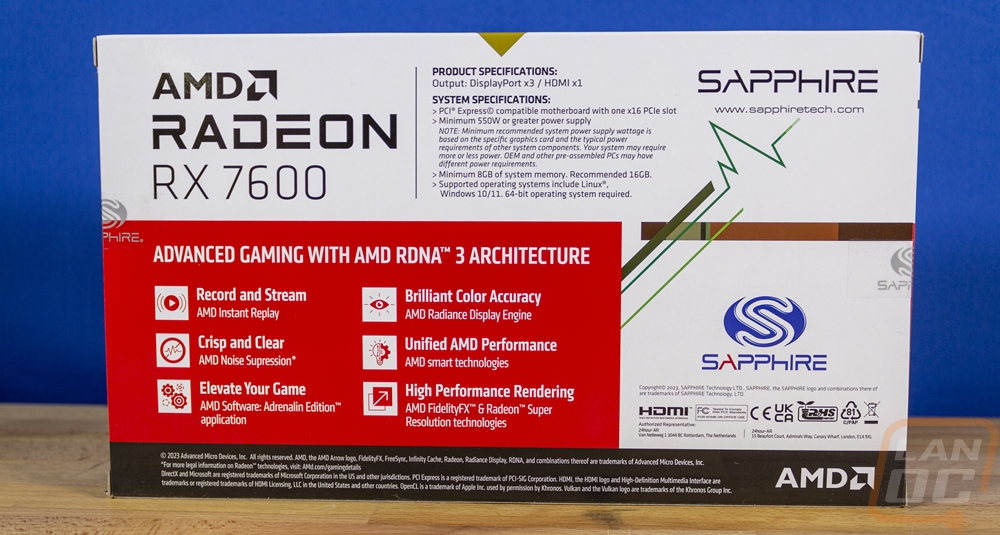
The Sapphire RX 7600 Pulse is a relatively compact card and the box reflects that with its size being small as well. It does share some styling with the last Sapphire Pulse card to come in, only that design had a blue background whereas the RX 7600 Pulse has an ugly green/yellow for the background. Beyond the color, it does have the same zigzag pulse line that runs across the box to the Sapphire Pulse branding and the random shapes in the background. Because of the box’s size, the red wraparound from AMD which has the Radeon RX 7600 branding on it looks gigantic taking up a lot of the space on the front of the box. Sapphire also has a sticker up in the top right indicating this is an overclocked model. Around on the back, the green/yellow background is gone and replaced with a much nicer white background. The AMD wrap around it back here and highlights a few of the base RDNA 3 features. That doesn’t leave much space for anything else, Sapphire has the RX 7600 model name repeated again and then a basic specification that only lists the display connections and system requirements. Sadly there isn’t a picture of the card at all or any important specifications like dimensions or clock speeds to help any shopping decision if you were looking at this in retail.
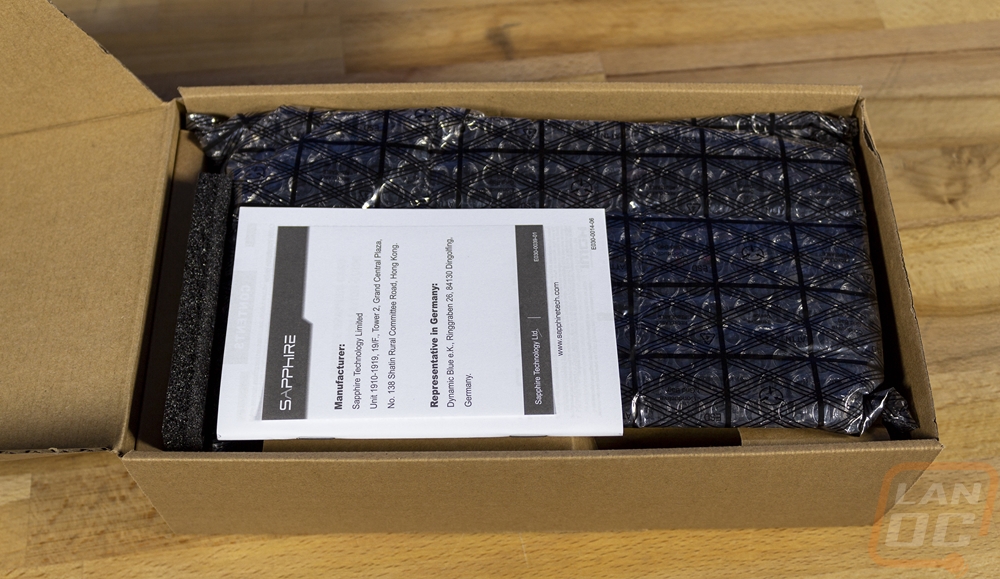
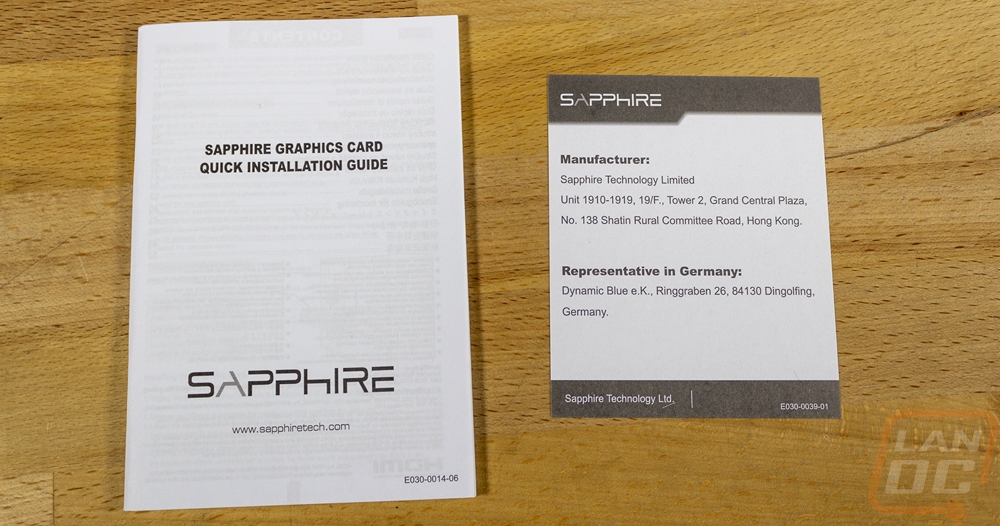
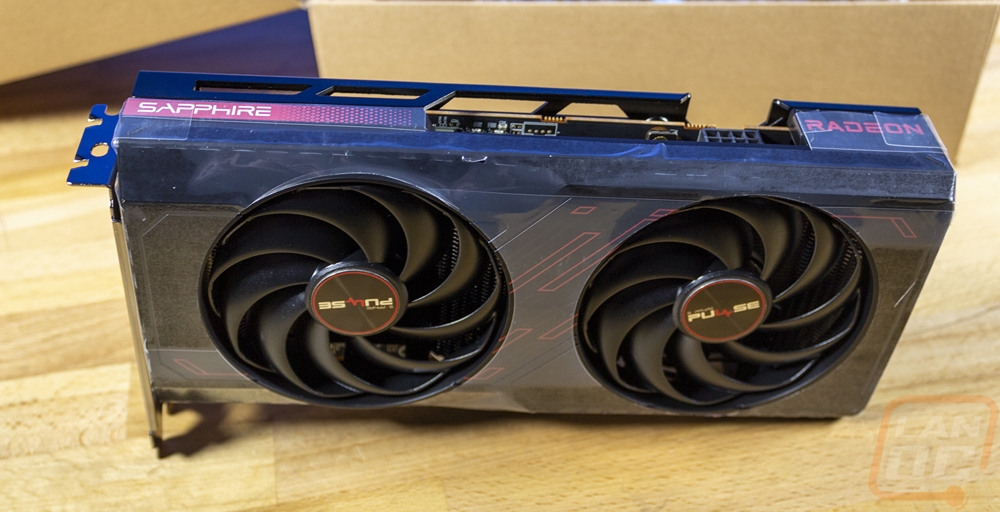
The outer box has a secondary inner box which is a standard brown cardboard. This opens up to the documentation up on top. You get a universal quick installation guide and a small piece of paper with Sapphire's addresses in Hong Kong and Germany. Below that the card itself comes wrapped in a bubble wrap static bag and it sits down in the box locked in place with additional cardboard and foam filling in gaps. The card itself also comes with a layer of plastic over the entire fan shroud as well to protect it from any scuffs or scratches in shipping.
Card Layout and Photos
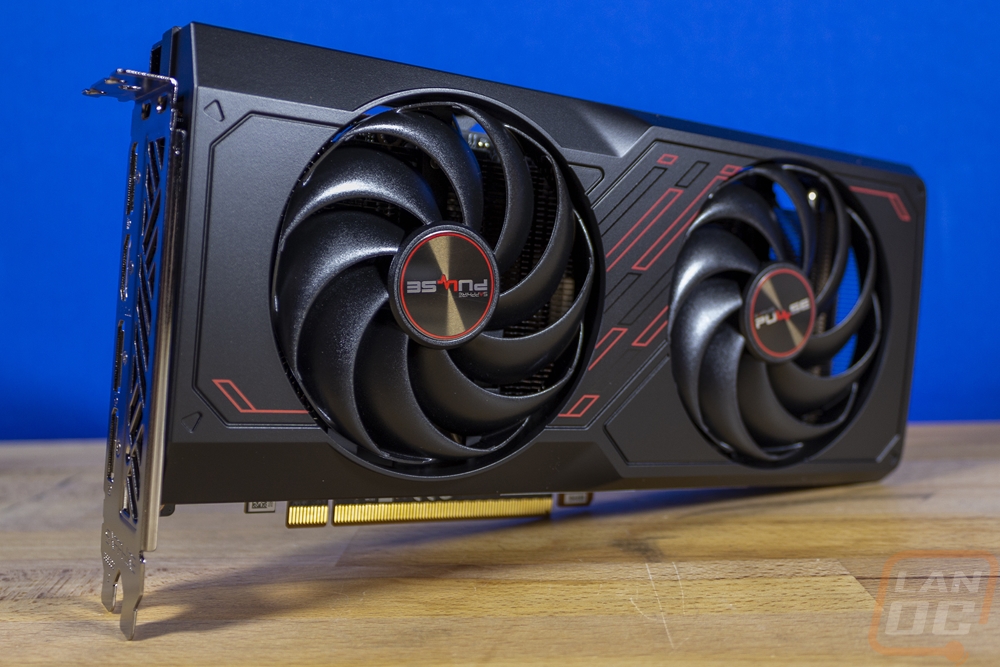
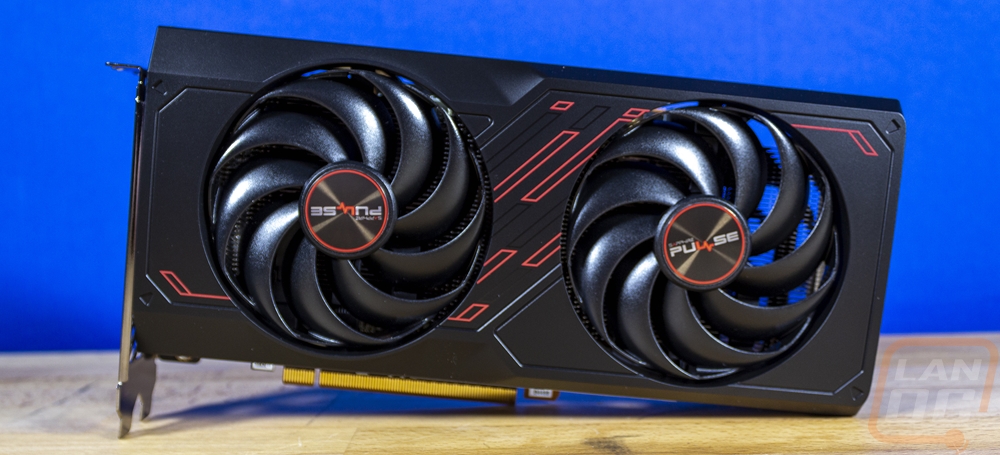
Going from the Sapphire RX 7900 XT Pulse to the Sapphire RX 7600 Pulse is interesting. They share the same blacked-out styling and the red accents but things have changed up as well. Where the red accents printed on the card for the 7900 XT were mostly straight lights the RX 7600 Pulse has outlined stripes, especially through the middle of the card. They also have completely different fan designs with the 7900 XT having a newer angular fan design where these are more traditional. Overall Sapphire has the same mostly black theme with a little red and keeping with the Pulse tradition the RX 7600 Pulse is simple and has no RGB lighting at all which a lot of people will like.
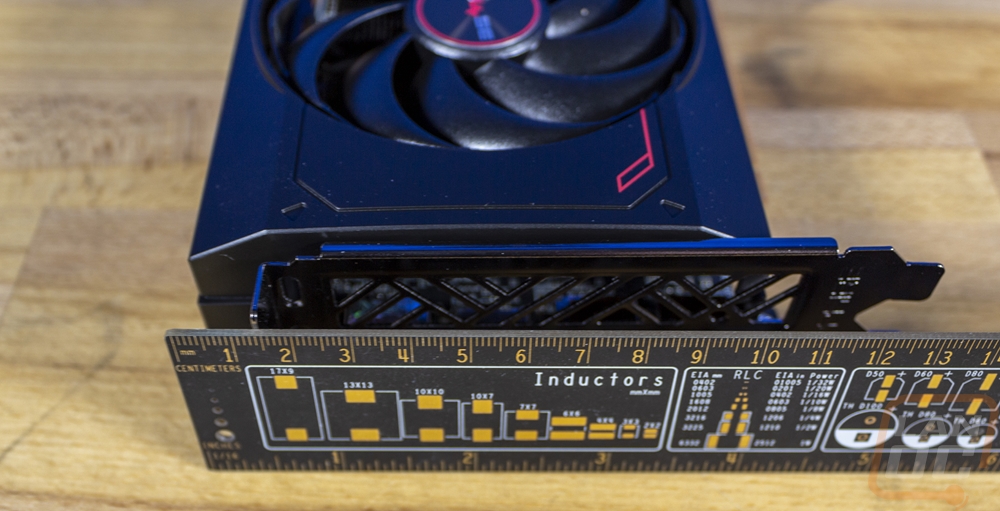
The RX 7600 Pulse is larger than what we saw with the reference Radeon RX 7600. It is still a dual-slot card, but at 44 mm in the middle it is pushing the limits of dual-slot and I would be careful to not put a card right up against it. It is 120 mm tall which is 10 mm taller than a “standard” card but still much smaller than the larger cards we are seeing these days. Then for length, it is 242 mm long by our measurement which is 32 mm or a little over an inch longer than the reference card.
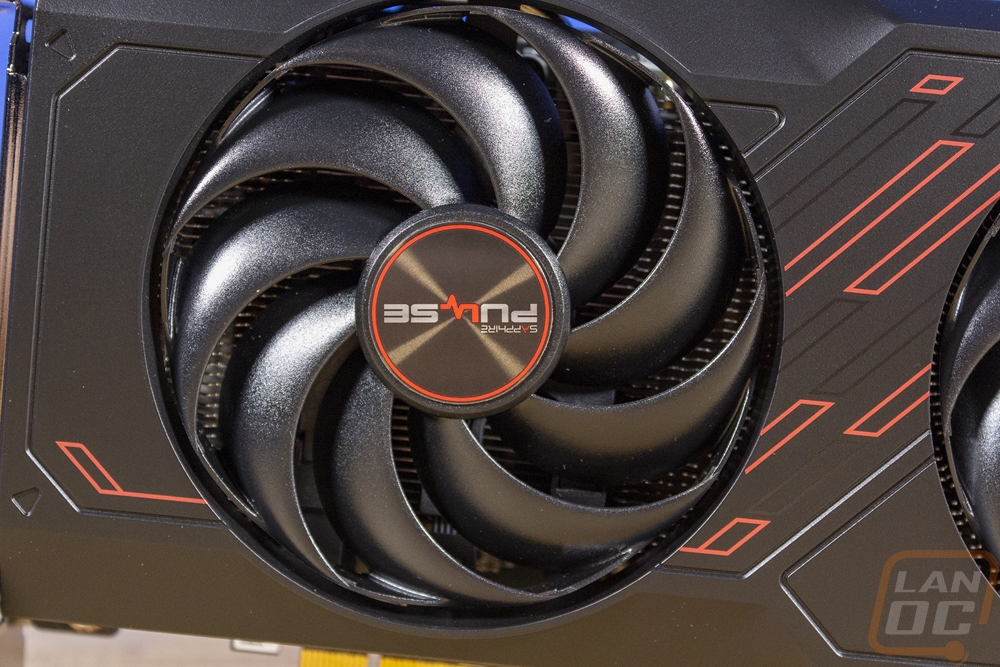
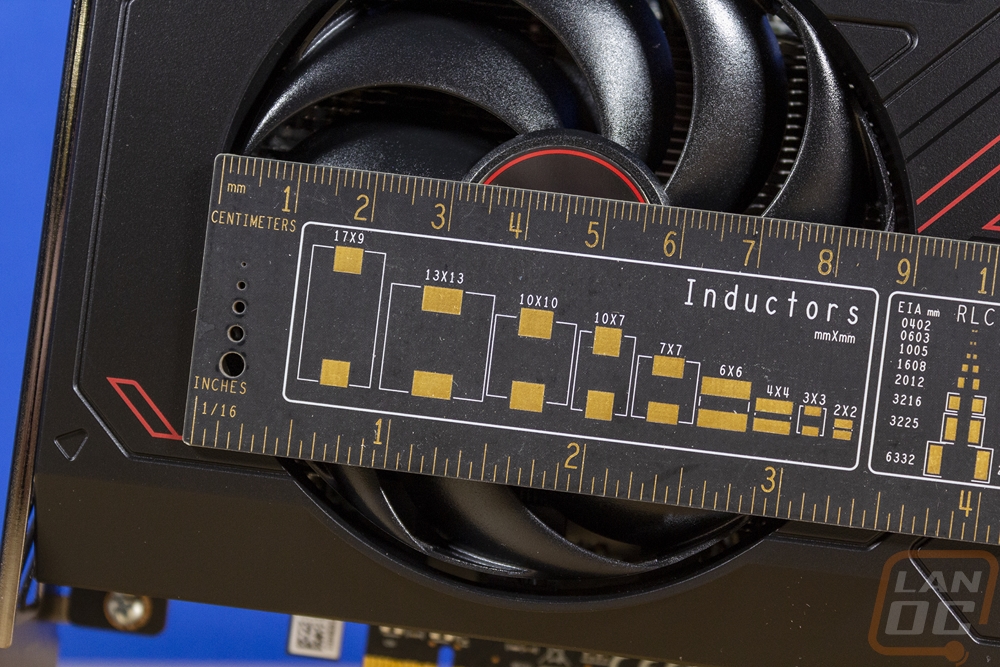
The dual fan configuration on the RX 7600 Pulse has two matching 85 mm wide fans with 9 fan blades each. They have a heavy curve to each blade and each is linked together. Where a lot of GPu fans now have a full ring, these are linked with a smaller piece of plastic and both fans have an axial design that blows down into the horizontally laid out heatsink. The fans have a one-inch gap between the two which is a lot wider than a lot of cards have, but this is a unique situation where it is longer than a compact dual fan card but not long enough to fit three fans. The fan shroud is plastic and has a black finish but Sapphire has used a few black and red accents printed on the card for a little extra styling. The same red is also on the fan centers with a red ring on both around the Sapphire Pulse branding.
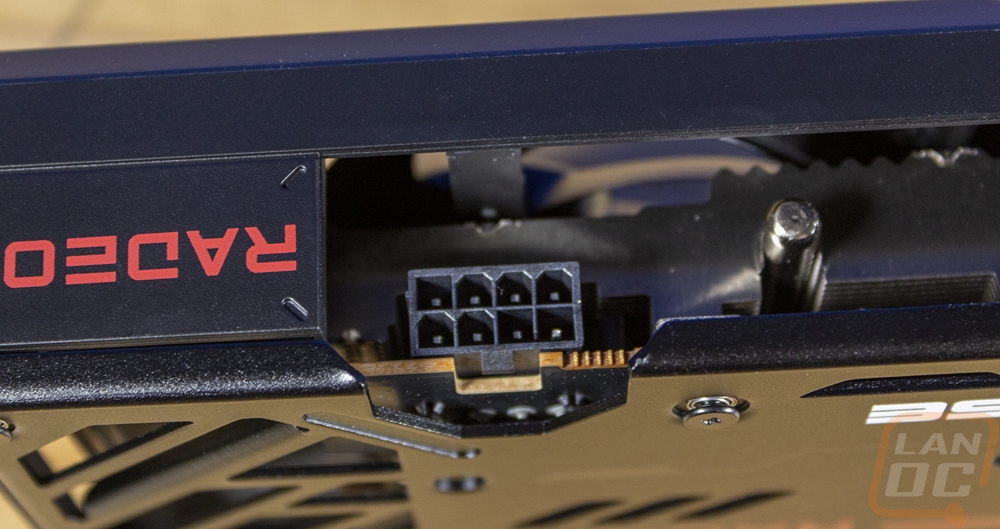
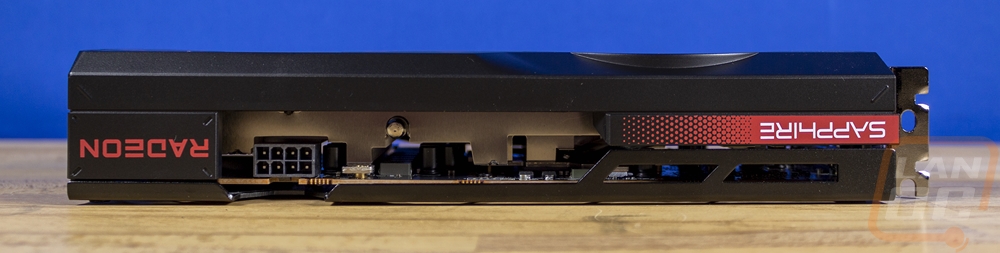
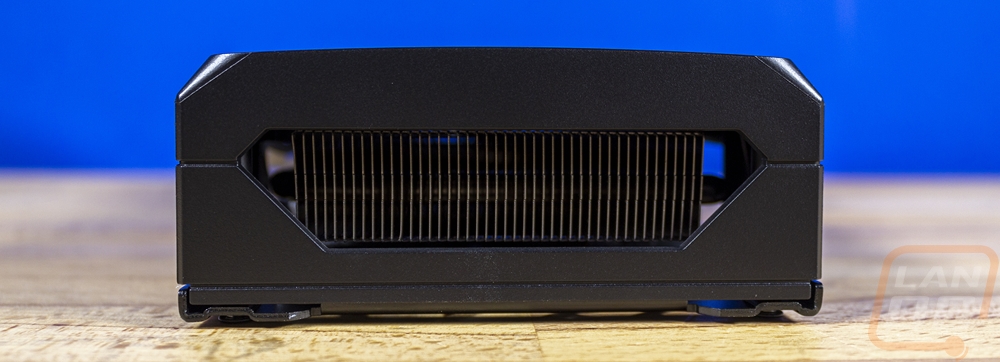
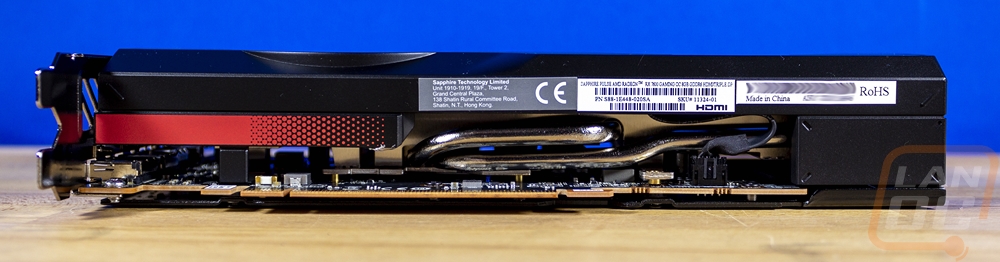
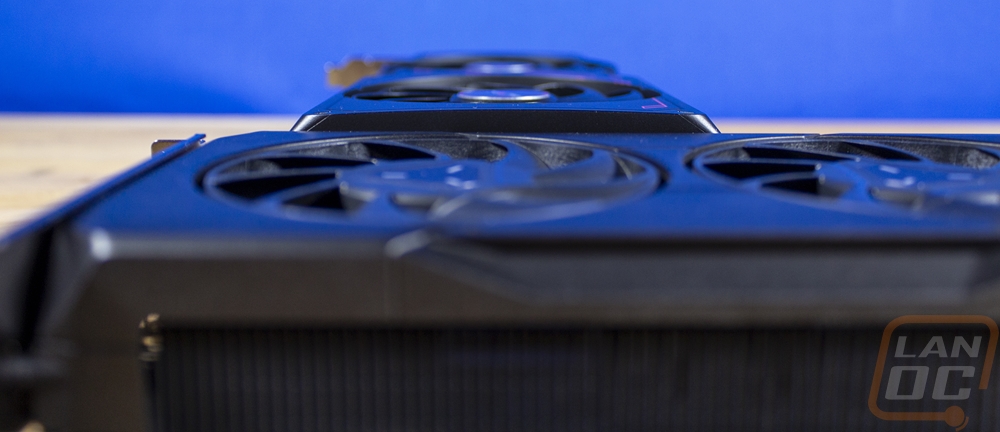
Looking at the top and bottom edges as well as the end of the RX 7600 Pulse we can get a better look at the cooling layout of the card the aluminum heatsink fins are set up in a horizontal layout, so a lot of the airflow from the front fans is designed to run the length of the card. My past experiences with cards that have a layout like this haven’t been good, but I hope Sapphire changes that. That layout allows them to have more of the shroud along the top of the card to include the Sapphire branding and Radeon branding which are printed in red and white on the black card. The top has the power connection which is right near the end of the PCB but 2 inches short of the end of the card. The RX 7600 Pulse has just one 8-pin PCIe power, not the newer 12VHPWR connection that Nvidia has been using. The bottom view shows the heatpipes that come out the bottom of the GPU area to run along the bottom and pull the heat out to the end of the card. The bottom has another red accent which is interesting because I don’t think people will ever see that, it also has the serial number and model information stickers hidden here. Then the end of the card has an opening where most of the card's heat should be going as well as out of the PCI bracket opening.
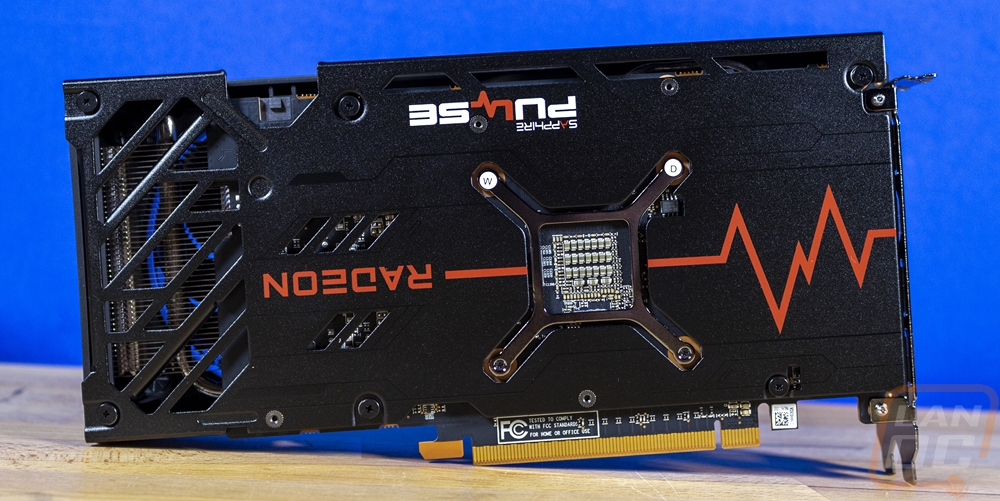
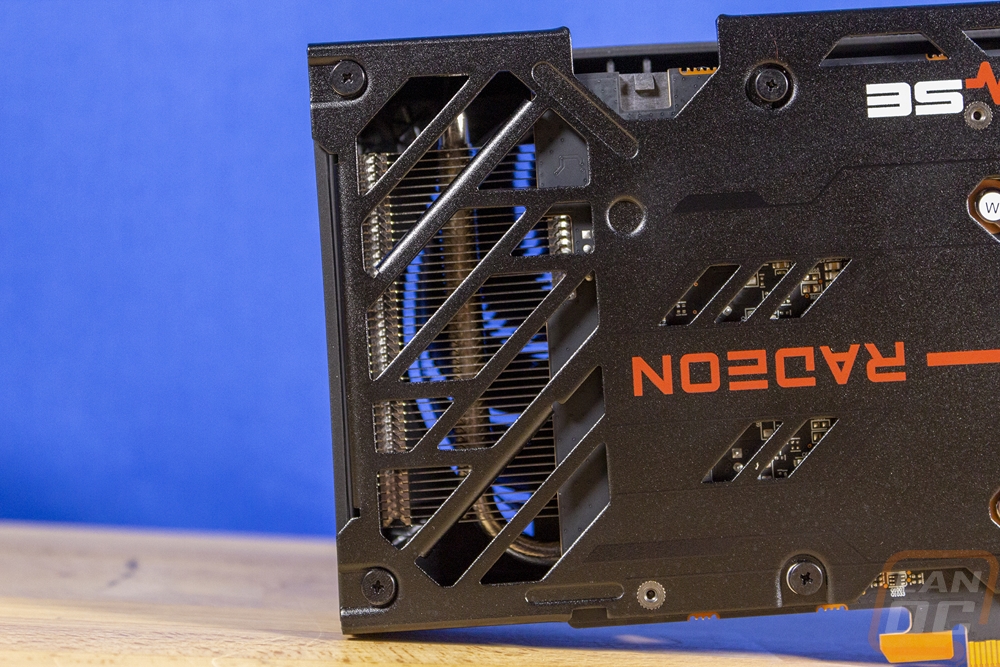
While the fan shroud was plastic, the backplate on the Sapphire RX 7600 Pulse is all metal. It runs the length of the card which runs past the end of the PCB with a partial fan blow-through section down at the end of the card which is opened up with wide slotted vents in the shape of an S. Sapphire has a few other smaller slot vents across the backplate including up near the top and an opening around the power connection up top to make it easier to access. The backplate also has a large X cutout which sits over the back of the GPU to give the back of the GPU some airflow. The backplate itself wraps around at the top which gives it more strength and then it has a nice textured black finish. To counter that they then have the pulse zig-zag line running most of the length of the card in red leading to the Radeon branding. They also have the Sapphire Pulse logo up closer to the edge in white and red, both are upside down to make them readable when installed in a traditional case.
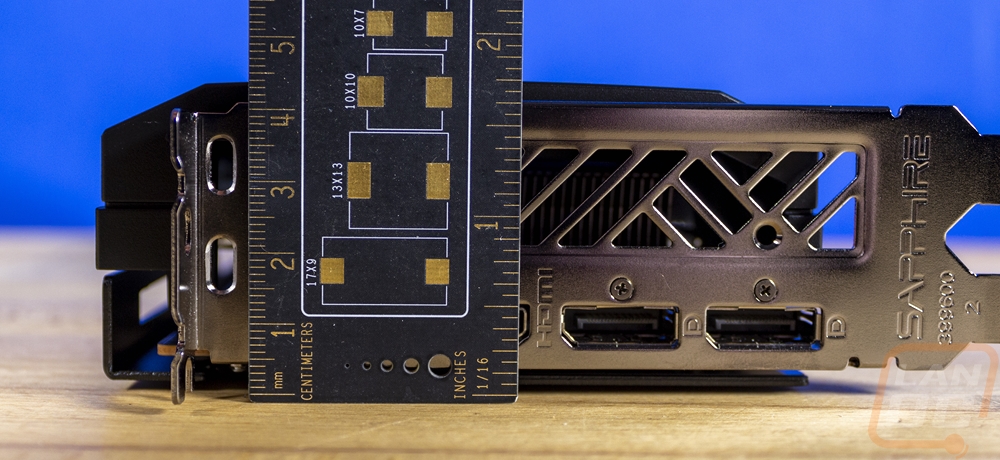
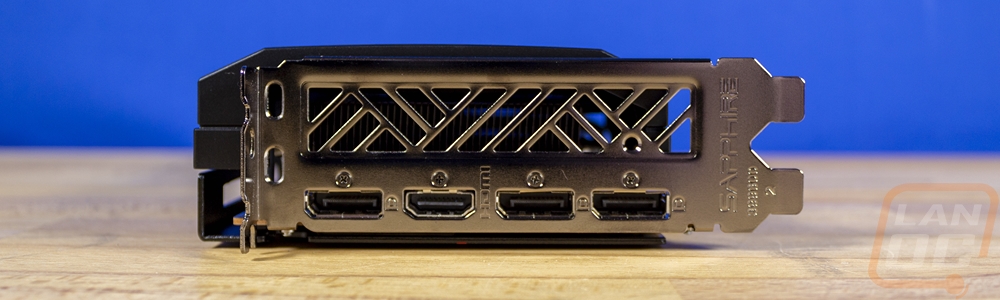
The RX 7600 Pulse has the same display connection layout as the reference RX 7600. This means it has three DisplayPort connections and one HDMI with the HDMI in the middle of the DisplayPorts. Sapphire however didn’t block off the entire PCI bracket like AMD did with their design, there is a vented section here and then the Sapphire logo down at the bottom of the bracket.
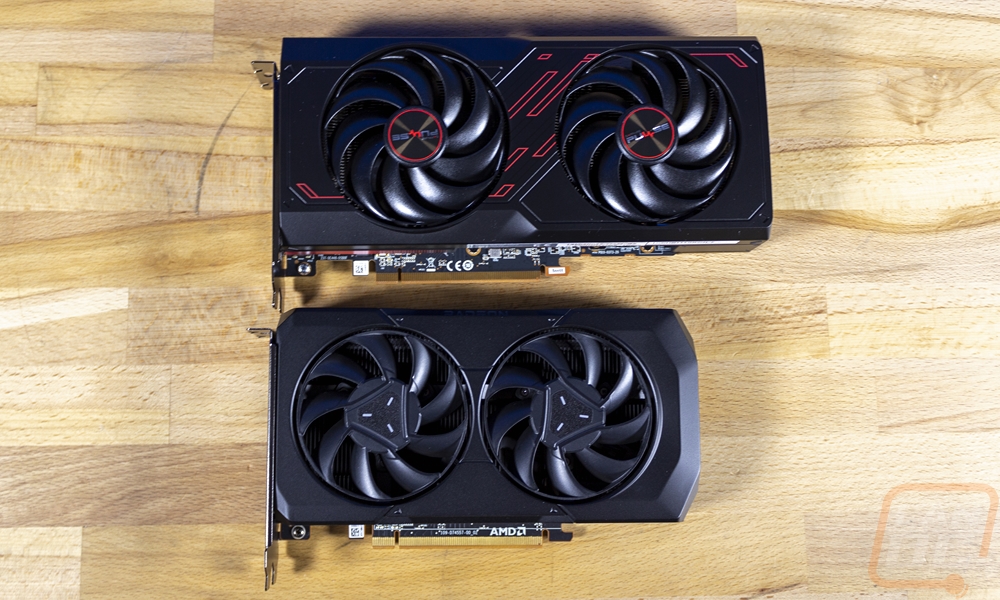
I did also get a comparison shot comparing the RX 7600 Pulse next to the reference RX 7600. The pulse isn’t a big card by any means, but the reference card does a good job of making it look bigger with that extra length. Both cards are dual slot cards but you can see how a slight curve in the fan shroud makes a difference in overall thickness with the Pulse sticking up over the reference card.
Test Rig and Procedures
CPU: Intel Core-i9 13900K – Live Pricing
PL1=PL2: 253, τ: 56 / 307A
Motherboard: Asus Z790 Extreme – Live Pricing
Cooling: Corsair H100i Elite LCD Display - Live Pricing
Noctua NT-H1 Thermal Paste - Live Pricing
Memory: Crucial 32GB Kit (2 x 16GB) DDR5-5600 UDIMM– Live Pricing
Storage: Sabrent Rocket Q4 2TB – Live Pricing
Power Supply: Thermaltake Toughpower GF3 1000W- Live Pricing
Case: Primochill Wetbench - Live Pricing
OS: Windows 11 Pro 64-bit - Live Pricing
|
Our Testing Procedures |
|
|
3DMark |
All 3DMark-based tests are done using the most recent version. We test using all three versions of Fire Strike, Both Time Spy and Time Spy Extreme, and Speed Way. Tests to look at ray tracing performance are done with Port Royal when supported and for Nvidia cards that support DLSS, the DLSS subtest is also done at 1440p with the performance setting and DLSS 2.0 as well as a look at DLSS 1, 2, and 3 at 4K. |
|
Unigine Superposition |
1080p Extreme and 4k Optimized benchmarks along with the VR Future test are done. The VR test is done at the Oculus resolution |
|
VRMark |
Only the Blue room test is run |
|
CS:GO |
This test is done using the workshop map called CS:GO Benchmark. You can find more information at this link. https://www.gamingpcbuilder.com/how-to-install-csgo-fps-benchmark-map/ I test at 1080p, 1440p, and 4K resolutions. All auto settings are turned off and detail is set to their highest settings. shadow quality high, model texture detail high, shader detail very high, AA set to 16x, uber shaders enabled |
|
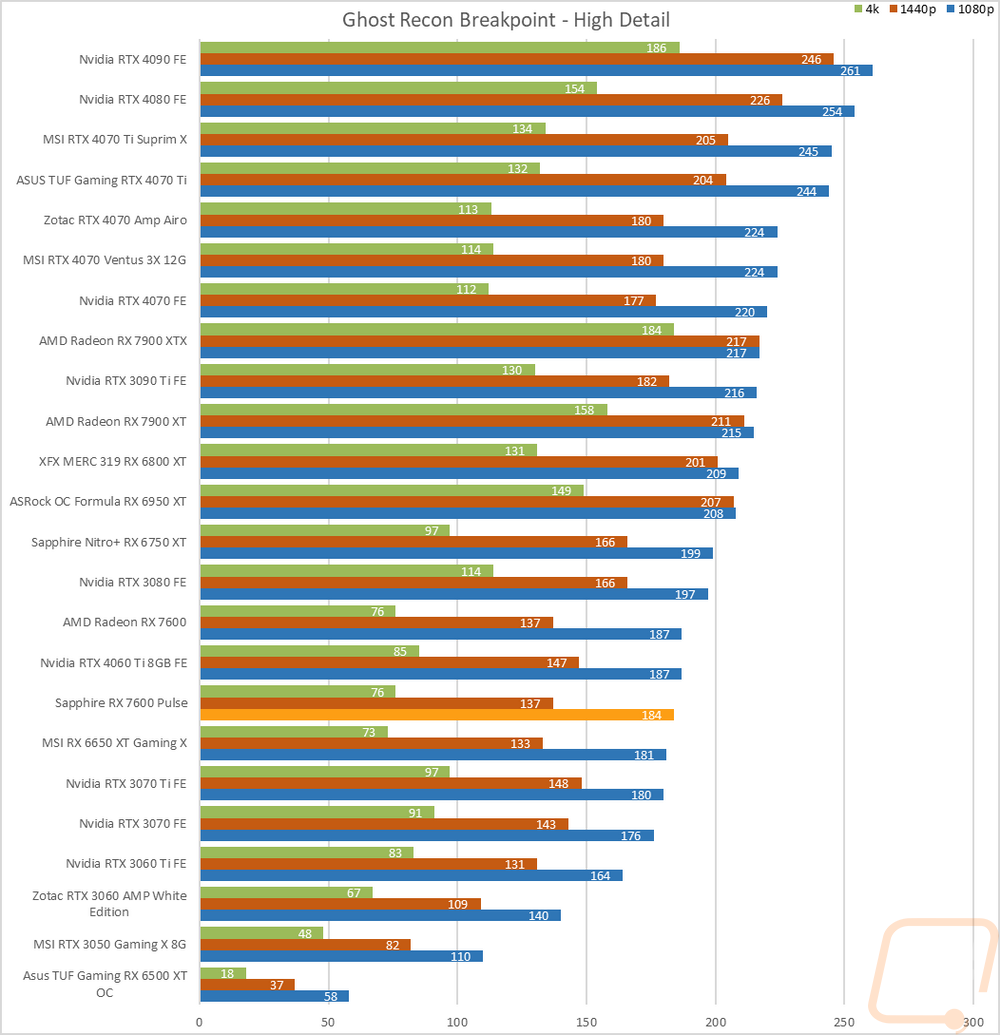
Ghost Recon Breakpoint |
Built-in benchmark tested at 1080p, 1440p, and 4k with the Ultra and Medium detail settings |
|
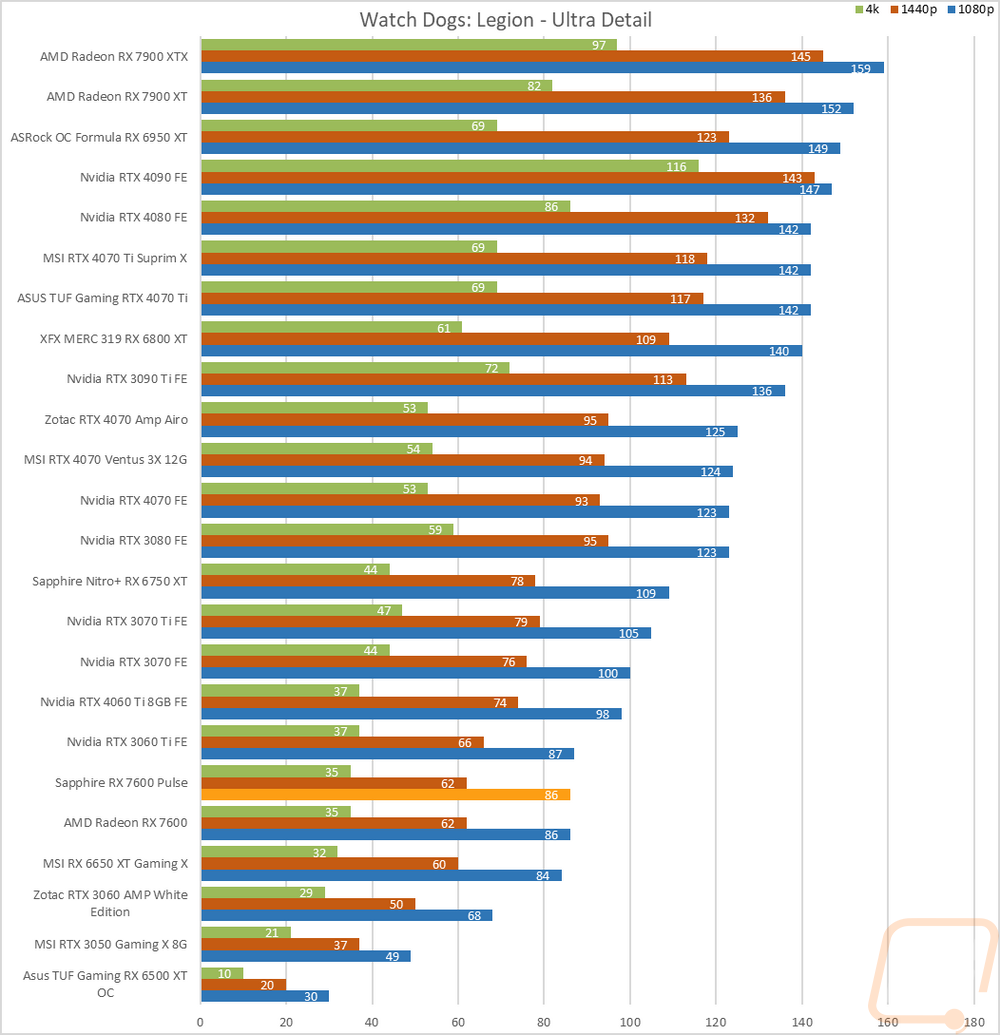
Watch Dogs: Legion |
Built-in benchmark testing at ultra and high details. Tested at 1080p, 1440p, and 4k. I also do RTX and DLSS testing on Nvidia cards at 4K using the Ultra detail settings as a base as well. |
|
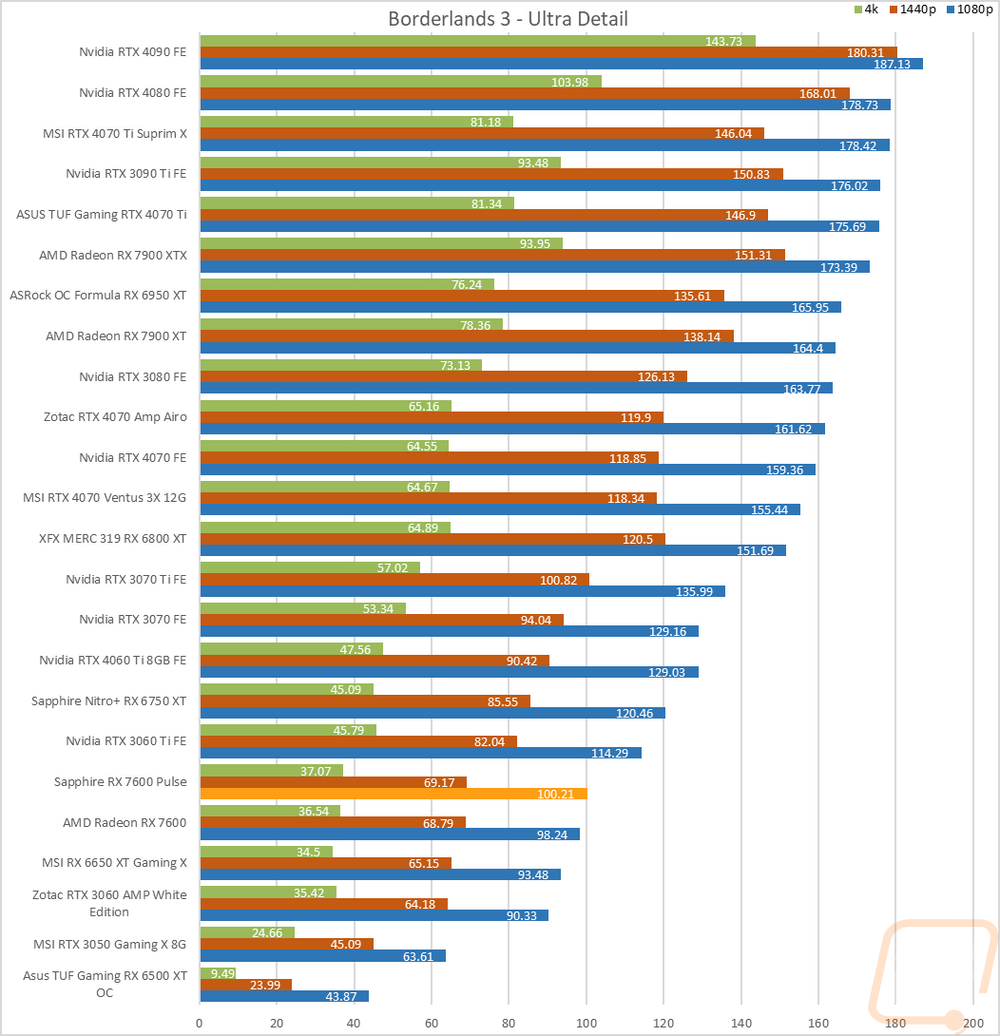
Borderlands 3 |
Built-in benchmark testing with the ultra detail setting and medium detail setting, done at full screen with default settings at 1080p, 1440p, and 4k on DX11 |
|
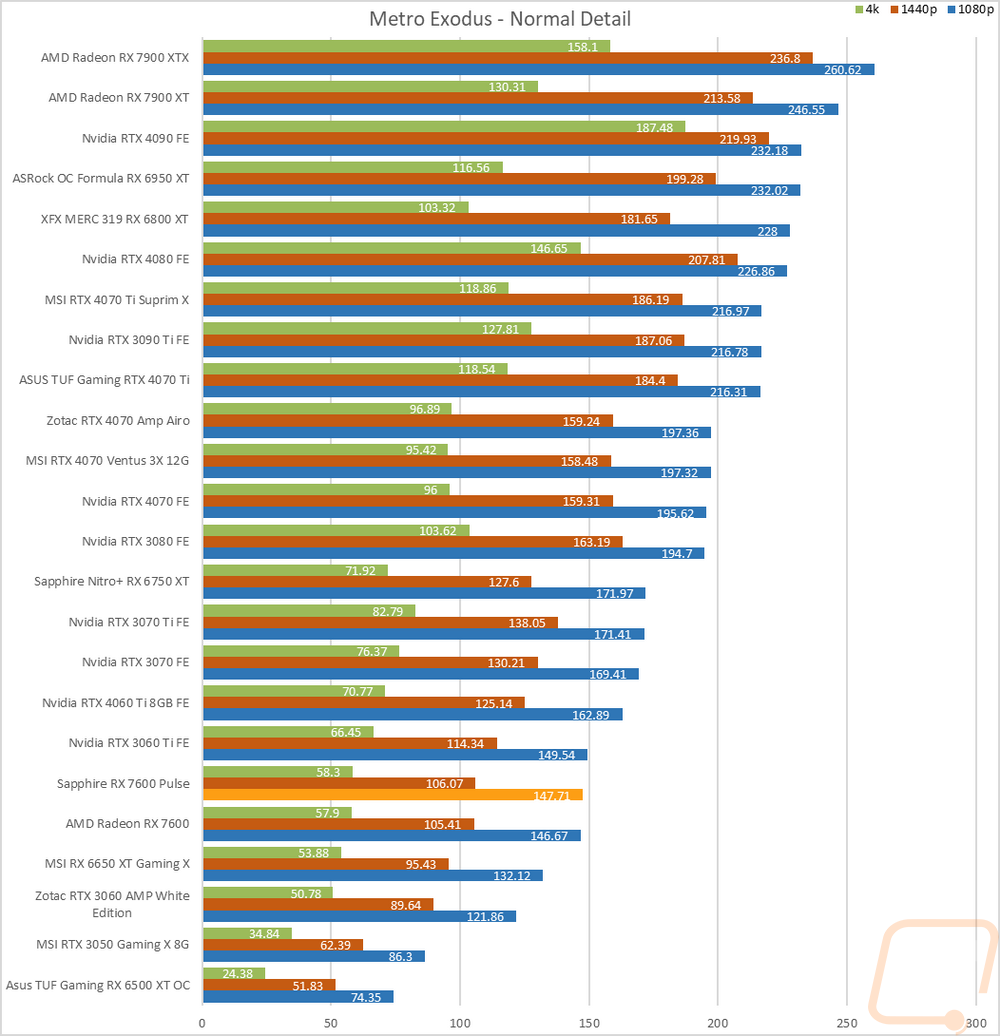
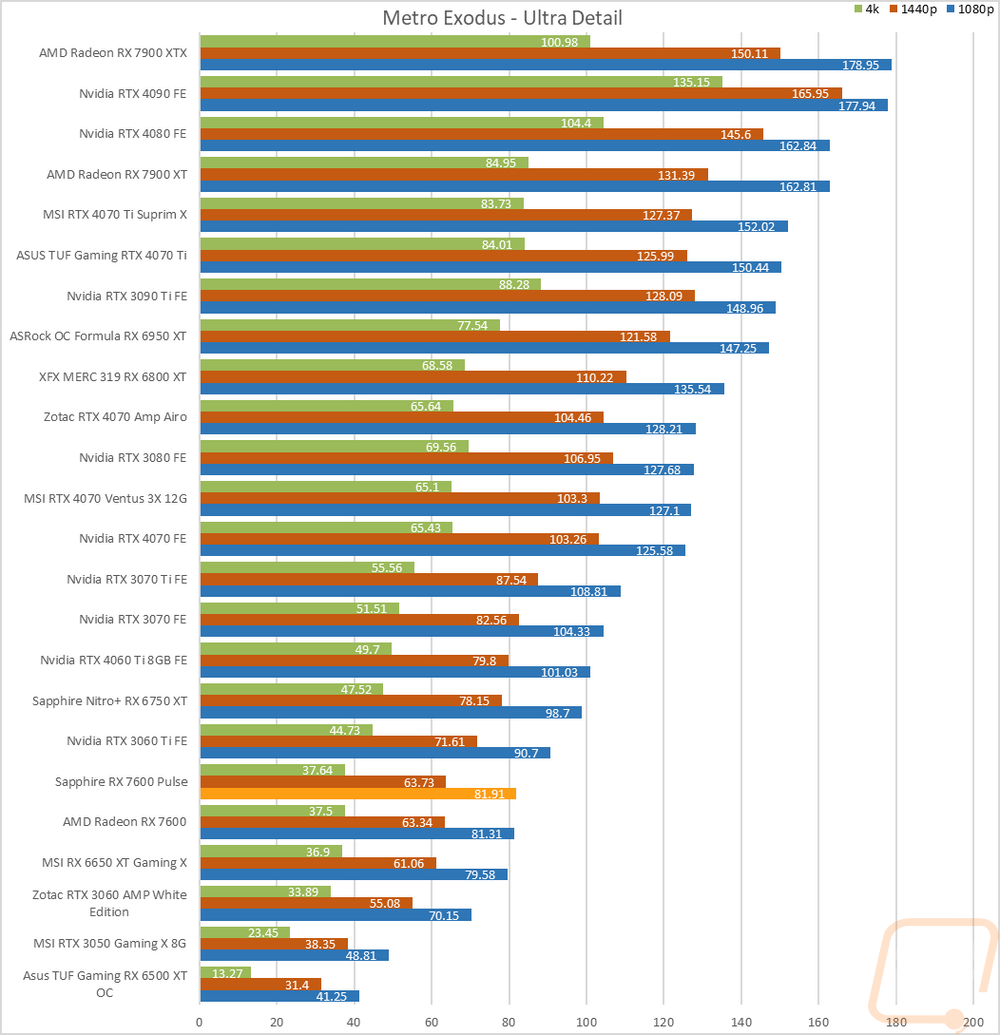
Metro Exodus |
Using built-in benchmark, testing at ultra and normal details at 1080p, 1440p, and 4k. I also do RTX and DLSS testing at 4K with the ultra-detail base settings for Nvidia cards as well. |
|
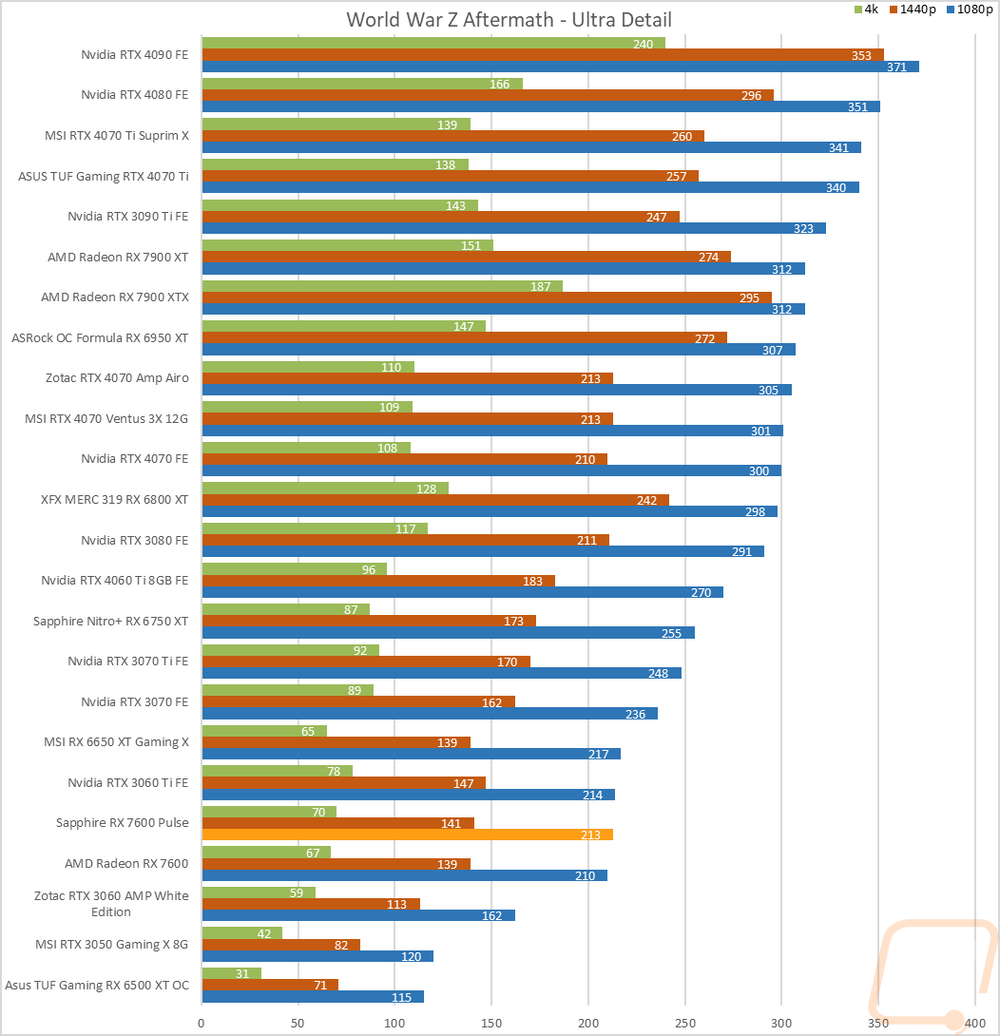
World War Z Aftermath |
Built-in benchmark in DX11 testing both the Ultra detail and Medium detail levels at 1080p, 1440p, and 4K resolutions |
|
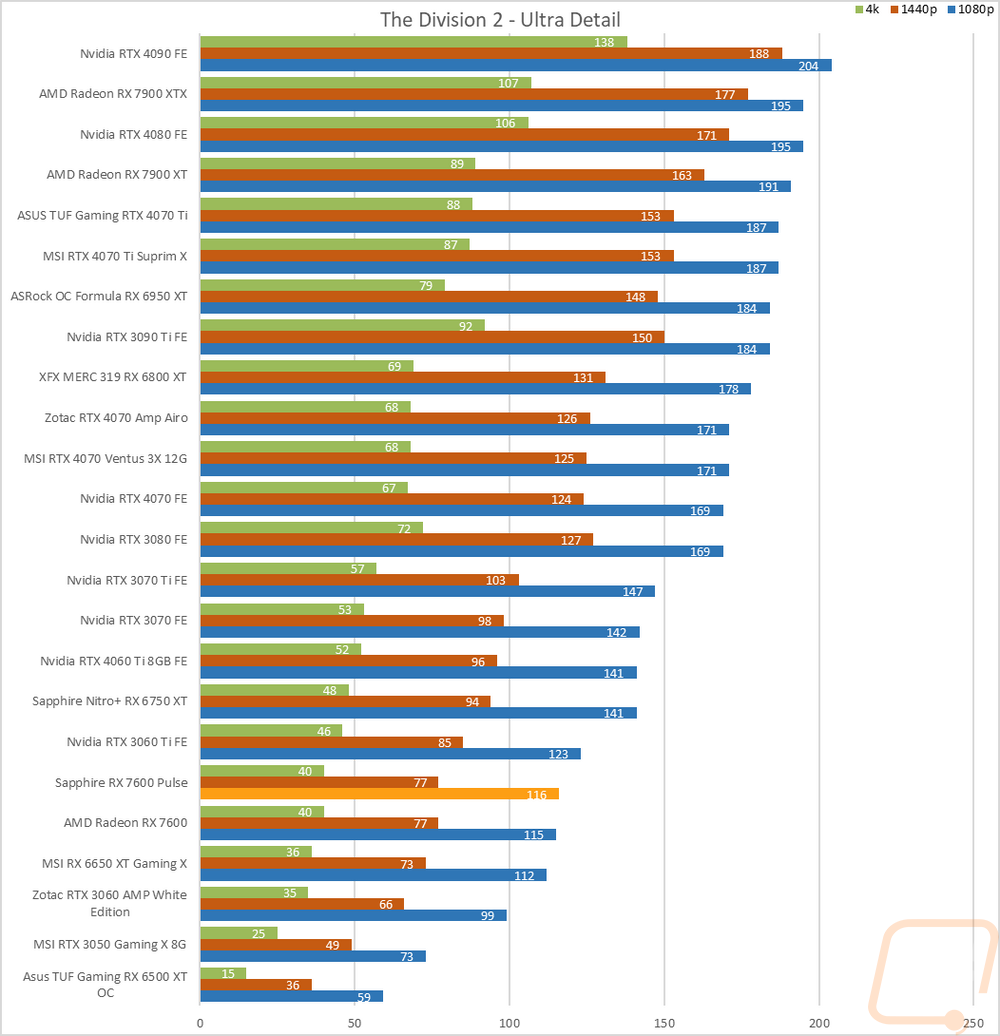
The Division 2 |
Built-in benchmark at Ultra detail with V-Sync turned off at 1080p, 1440p, and 4k resolutions. |
|
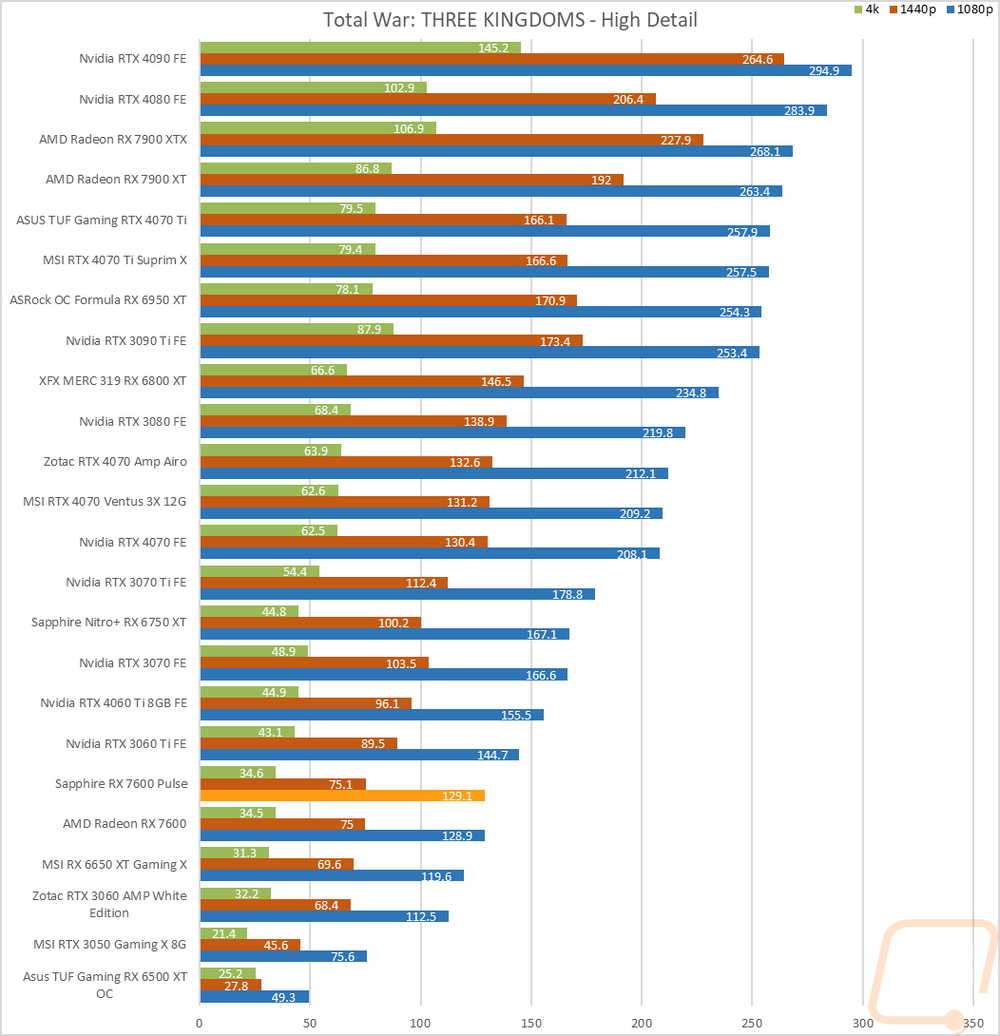
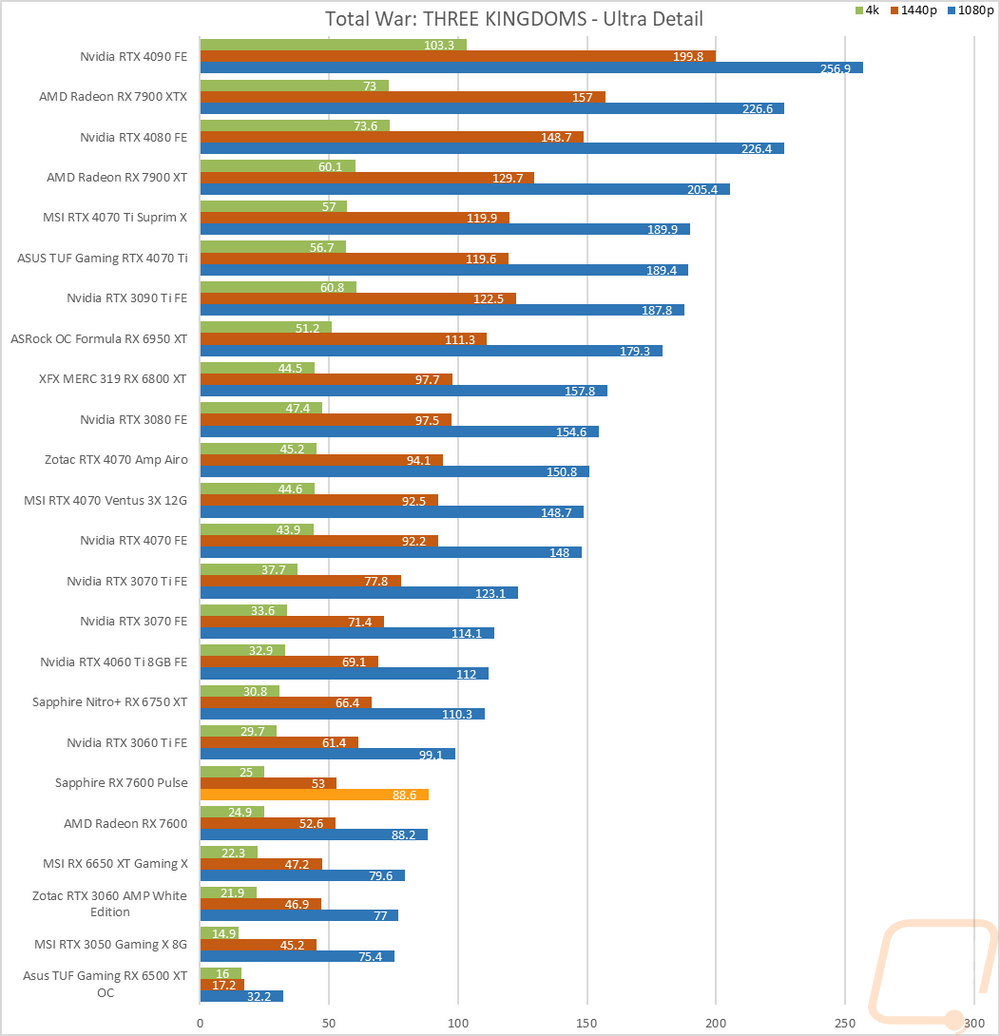
Total War: Three Kingdoms |
Built-in benchmark using the Battle Benchmark setting. Tested at 1080p, 1440p, and 4k at both high and ultra detail settings |
|
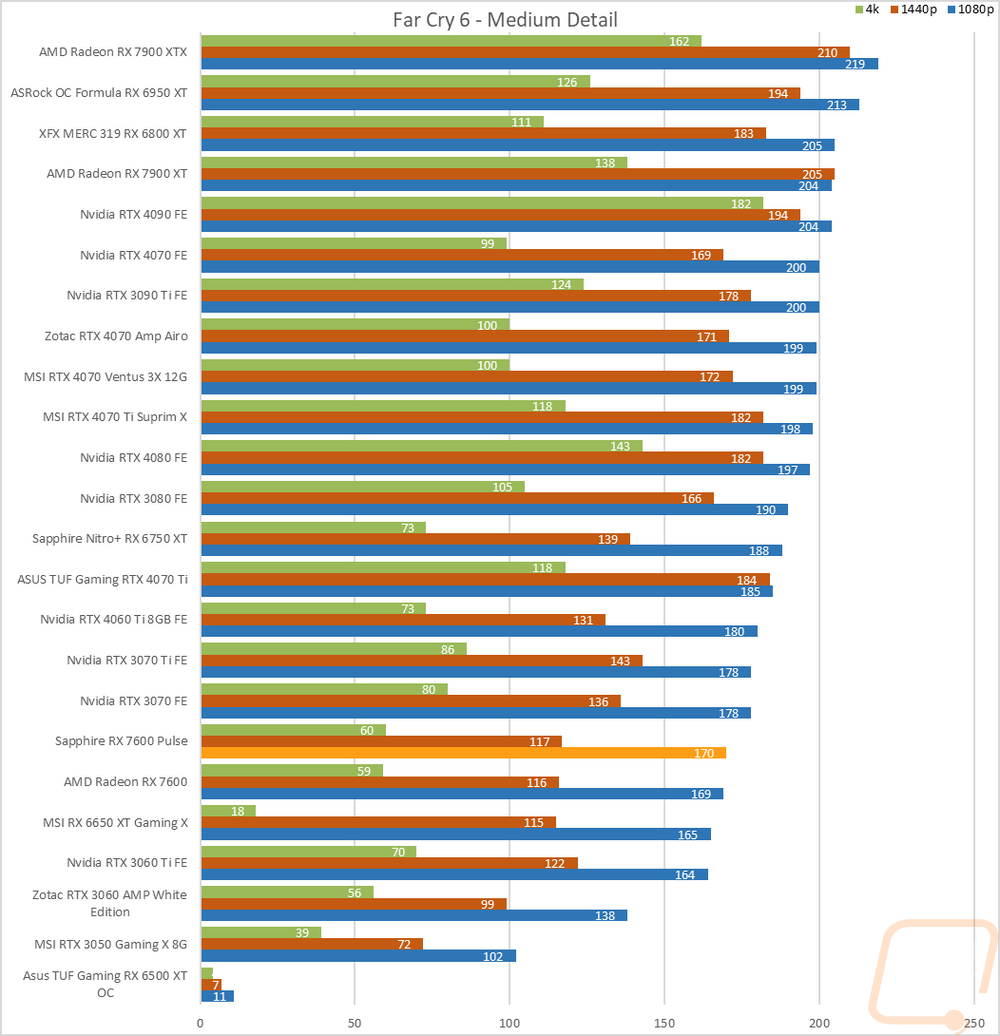
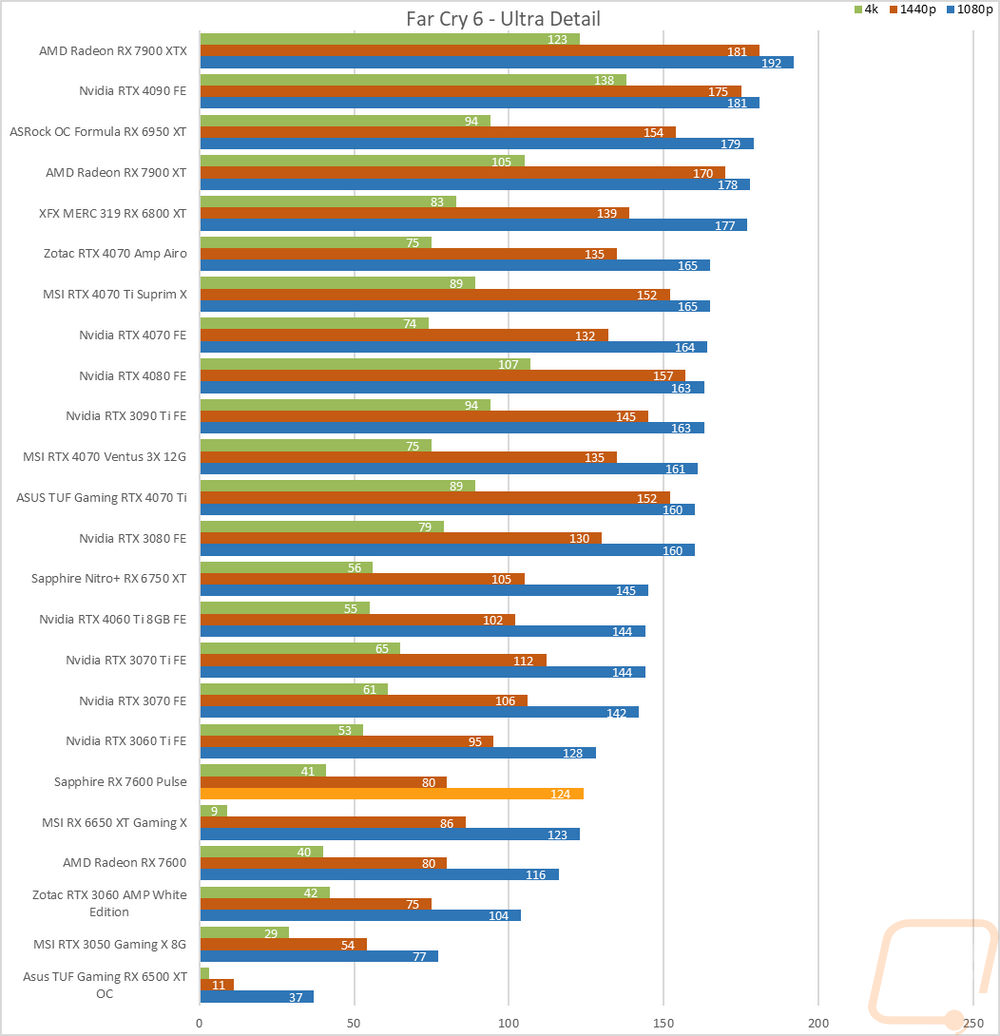
Far Cry 6 |
Built-in benchmark tested at 1080p, 1440p, and 4k with the Ultra and Medium detail settings |
|
V-Ray 5 |
V-Ray 5 benchmark us run with CUDA and RTX settings on cards that support it |
|
Boundary Benchmark |
Testing different DLSS detail levels on cards that support it. All testing is done at 4k with RTX on |
|
Bright Memory Infinite RTX Benchmark |
Benchmark all of the different RTX detail levels. Resolution at 4k and DLSS on balanced for each test |
|
Passmark Performance Test 10.2 |
Test using the GPU Compute Score inside of Passmark’s Performance Test 10.2 |
|
Blender |
Using the standard Blender Benchmark I run the test using the Blender 3.4 setting which tests using the Monster, Junkshop, and Classroom tests. |
|
OctaneBench 2020.1 |
OctaneBench is designed to test rendering in OctaneRender. RTX and non-RTX are both ran. This is a CUDA-only test so only Nvidia cards are tested |
|
Power Testing |
Using a PCat v2 to monitor power between the PCIe slot and the card as well as power through the power cables I test the peak power when running ADIA64, 3DMark Speed Way, 3DMark Time Spy Extreme, FarCry 6 at 4k and Ultra Detail, Watch Dogs Legion at 4K and Ultra detail, and Blender 3.4.0. The results are then averaged as well as the highest result. |
|
Noise Testing |
Our Noise testing is done using a decibel meter 18 inches away from the video card on the bottom/fan side of the card. We test at 50% and 100% fan speeds as well as a third test while under load using AIDA64's stress test. This is done using a Protmex PT02 Sound Meter that is rated IEC651 type 2 and ANSI S1.4 type 2. Tests are done set weighted to A and set to a slow response using the max function. The ambient noise level in the testing area is 33.3 decibels. |
|
Temperature Testing |
Using AIDA64, the GPU stress test is run for 30 minutes or until the result has leveled off. The test is run twice, once with the stock fan profile and a second time with 100% fan speed. During this, I also document the 100% fan speed RPM and document the delta between the fan profile and 100% fan speed as well as get thermal images. |
Synthetic Benchmarks
As always I like to start my testing with a few synthetic benchmarks. 3DMark especially is one of my favorites because it is very optimized in both Nvidia and AMD drivers. It's nice to not have to worry about it being favored too much either way and the repeatability of the results makes it a nice chance to compare from card to card, especially when comparing with the same GPU. While I am still interested to see how the RX 7600 Pulse compares to the 6650 XT, the RTX 3060, and the RTX 3060 Ti that we saw the reference card compete with in our coverage of that card. But I am most interested in seeing how the Pulse compares with AMDs reference card, the Sapphire RX 7600 Pulse has a boost clock of 2751 MHz which is 96 MHz over the reference card's 2655 MHz boost clock speed. It also has a higher default clock speed of 2356 Mhz over the 2250 MHz on the reference card.
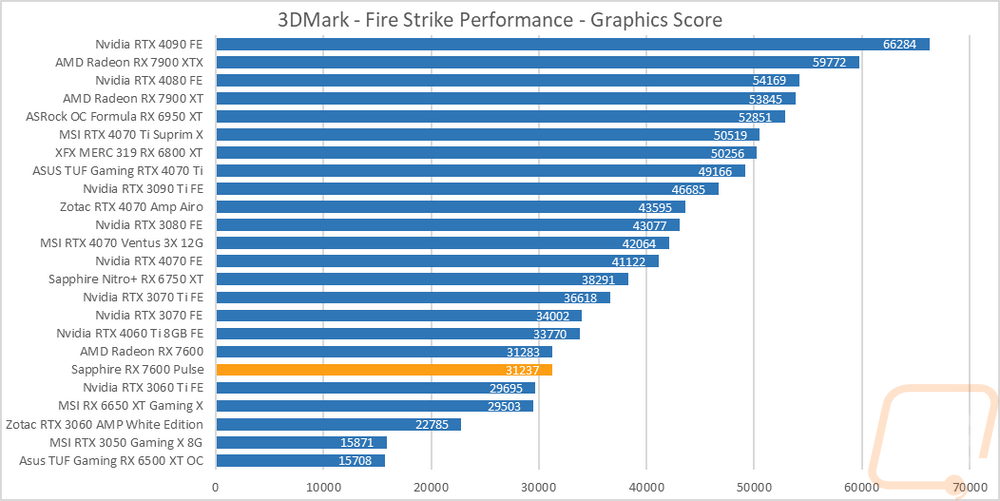
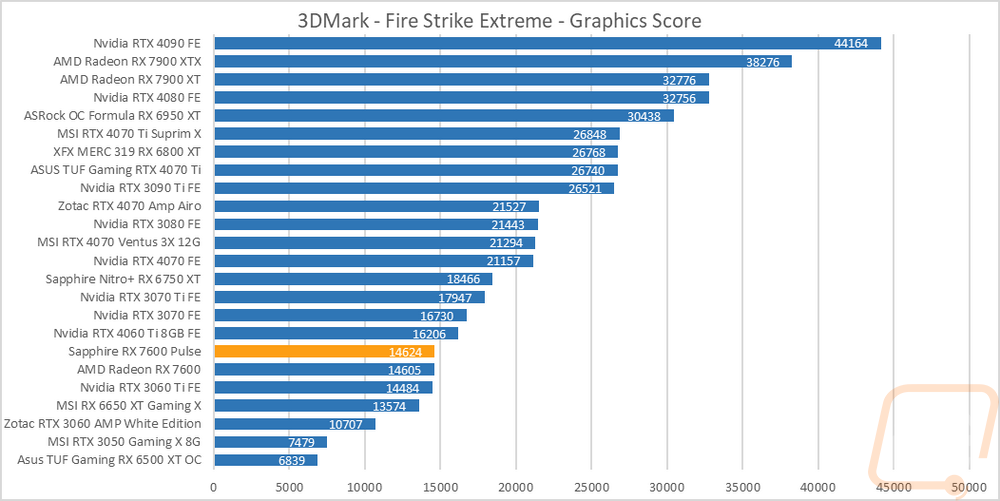
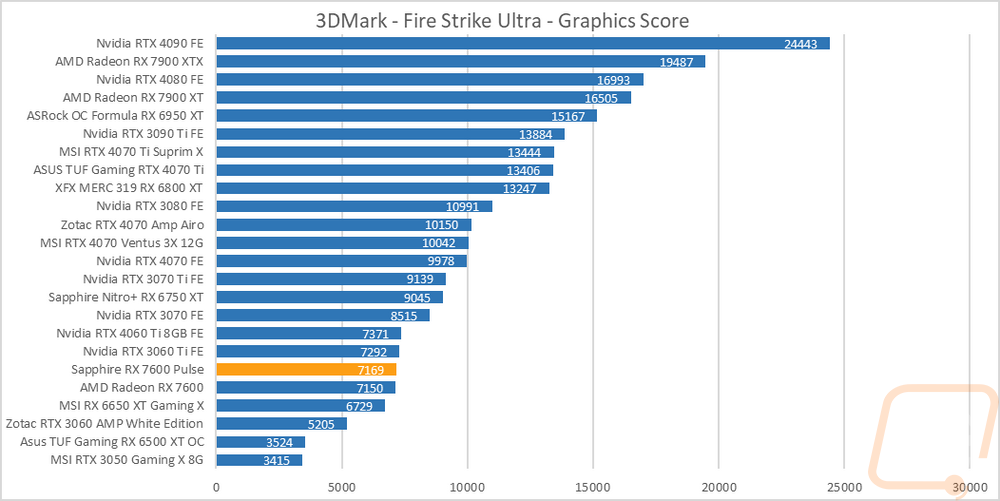
The first round of tests were done in the older Fire Strike benchmark which is a DX11 test. There are three detail levels, performance, extreme, and ultra. The RX 7600 Pulse ended up just slightly behind the reference RX 7600 in the base Fire Strike test but ahead of it my very small margins on the Extreme and Ultra detail settings. It also outperformed the RTX 3060 Ti in the first two tests but is slightly behind it in the ultra test.
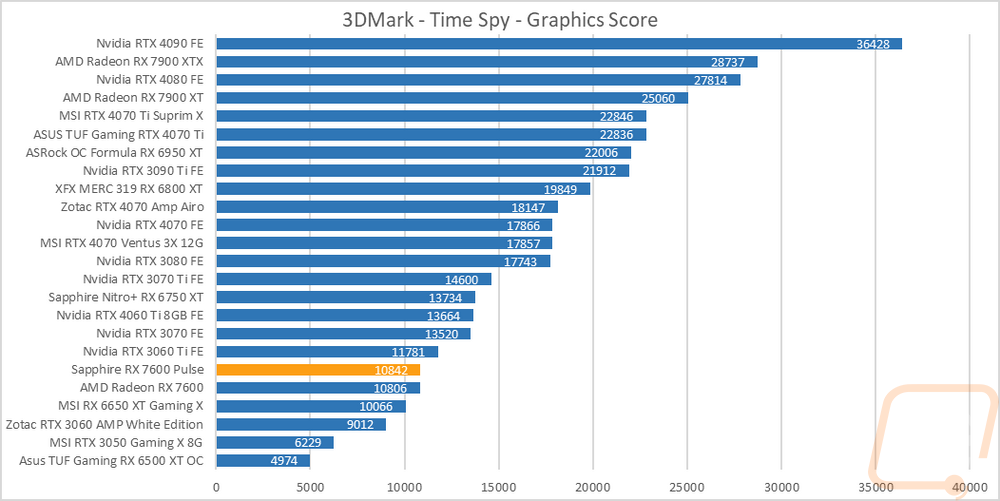
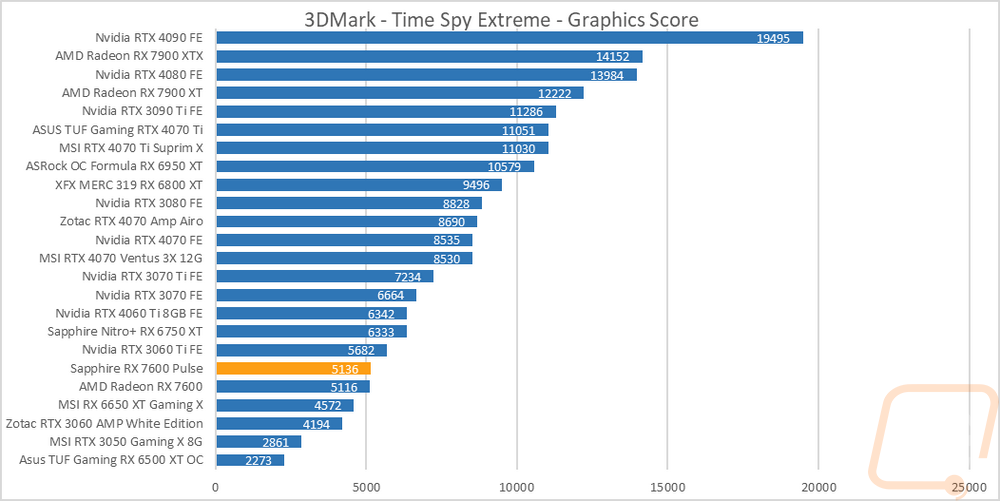
The next two were both based on the Time Spy benchmark. One is the standard test and then there is the extreme detail level. The RX 7600 Pulse is 36 points ahead of the reference card in the base Time Spy and 20 points ahead in the Time Spy Extreme test, both with extremely small margins. Both cards dropped down below the RTX 3060 Ti here and are sitting ahead of the older 6650 XT as well as the RTX 3060.
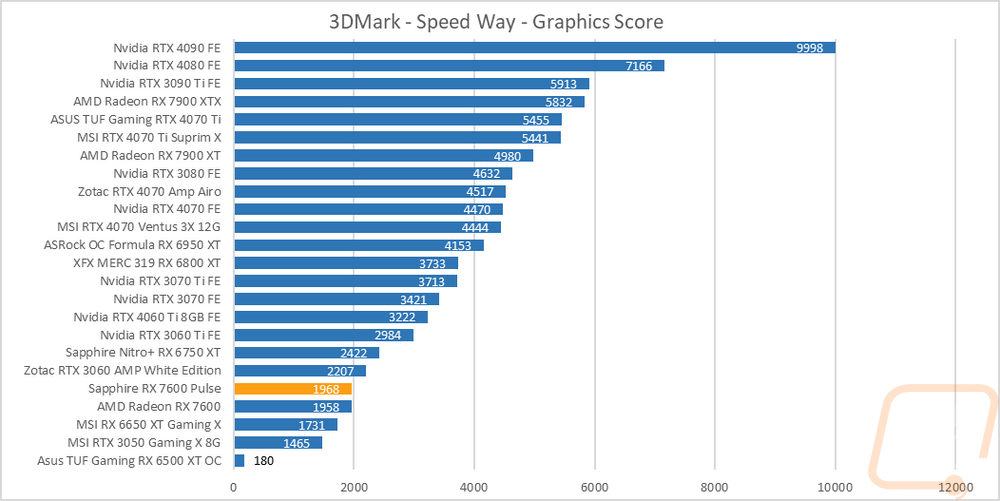
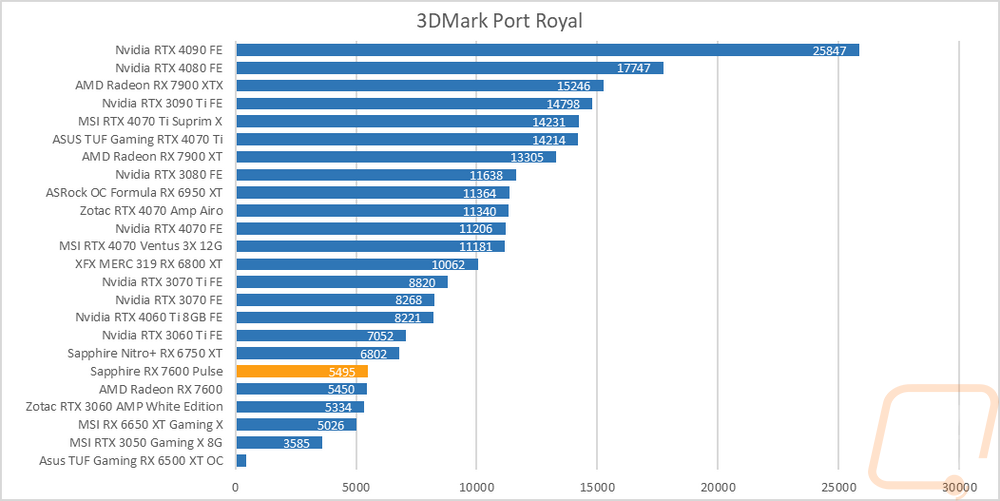
For ray tracing performance, I ran both the 3DMark Port Royal test which is ray tracing focused as well as the new 3DMark Speed Way test which tests all future-looking features including ray tracing. In Speed Way, the RX 7600 Pulse gained 10 points on the reference card but both are still well below the RTX 3060 in this test. The gap between them is a little wider in the Port Royal test at 45 points and both are just slightly ahead of the overclocked RTX 3060.
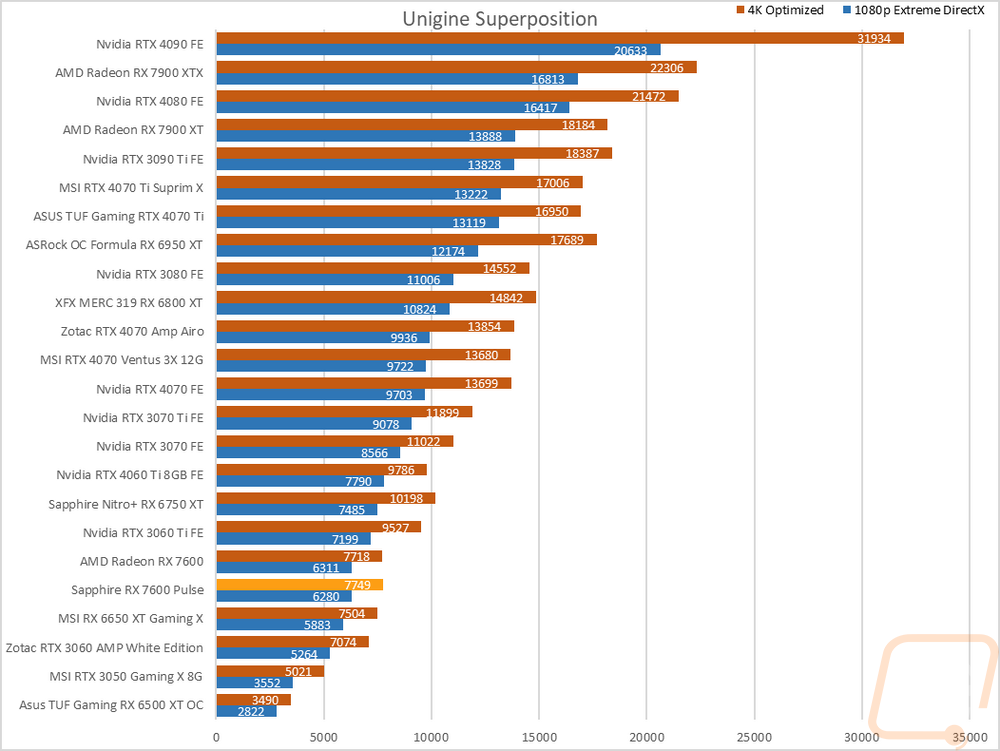
The last test was using the Unigine-based Superposition benchmark and I tested at 1080p with the extreme detail setting as well as the 4K optimized setting. In the extreme detail setting the RX 7600 Pulse is 31 points behind the reference card in the 1080p Extreme test but ahead by 31 points in the 4K optimized test.
VR Benchmarks
As for Virtual Reality, I love it but it is more demanding than traditional gaming. This is partially because of the resolutions needed to render for two eyes and because they render more than what is immediately visible. But also because of post effects to get the proper “fisheye” effect for it to look proper in your eyes with the HMD. You also have to have much higher expectations for frame rates in VR, skipping frames or lower FPS can cause motion sickness in VR. Because of that, I ran a few tests.
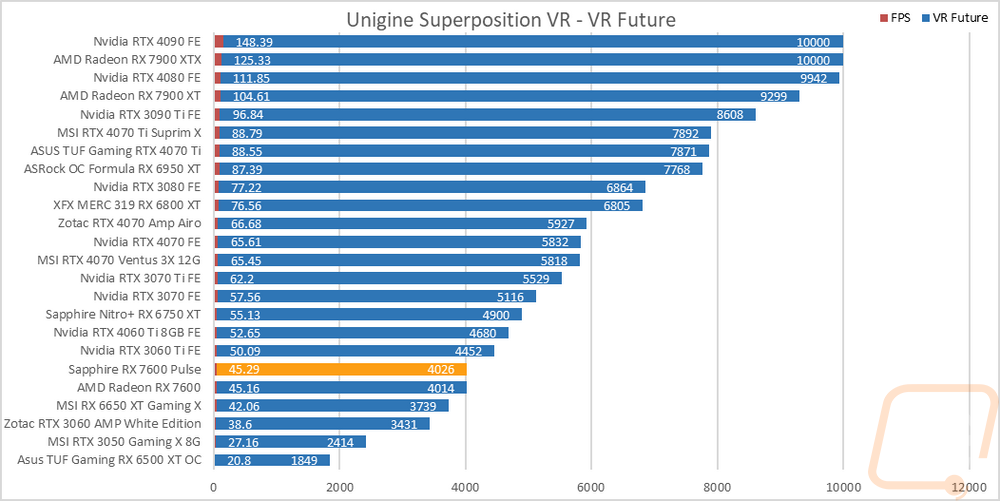
My first test was again in Superposition. This time I tested the VR Future test using the Oculus resolution. I have also included the average frame rate as well which is important for the cards at the top of the chart because for some reason Superposition is capped at 10,000 for its scores and that doesn’t show the performance gap in those cards at the top. Once again the gap between the RX 7600 Pulse and the 7600 Reference card is small but the RX 7600 Pulse is ahead by 12 points in this test. Both cards are ahead of the RTX 3060 here as well as the RX 6650 XT but there is still a big gap between them and the RTX 3060 Ti.
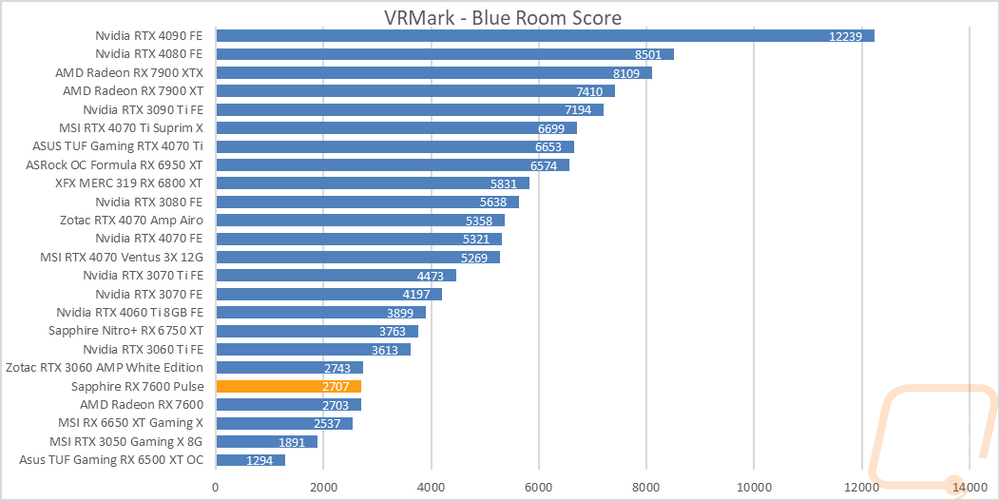
My second round of VR testing was in VRMark which has three tests that are similar to the VR tests in Superposition. I only focused on just the most demanding test called Blue Room which is looking more at future VR performance. The RX 7600 Pulse gained 4 points on the reference 7600 but that wasn’t enough to catch up to the RTX 3060 which is still ahead by just 36 points, all three are practically the same performance here.
In-Game Benchmarks
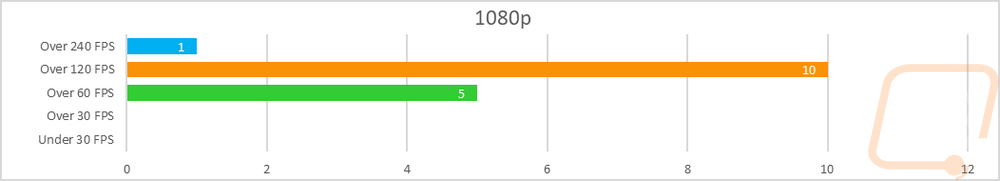
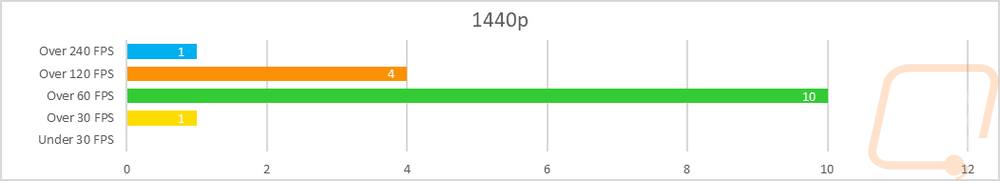
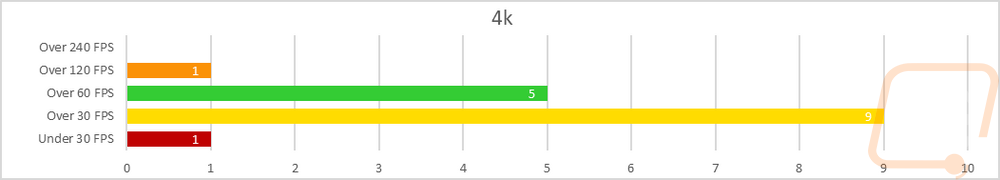
Now we finally get into the in game performance and that is the main reason people pick up a new video card. To test things out I ran through our new benchmark suite that tests 10 games at three different resolutions (1080p, 1440p, and 4k). Most of the games tested have been run at the highest detail setting and a mid-range detail setting to get a look at how turning things up hurts performance and to give an idea of if turning detail down from max will be beneficial for frame rates. In total, each video card is tested 54 times and that makes for a huge mess of results when you put them all together. To help with that I like to start with these overall playability graphs that take all of the results and give an easier-to-read result. I have one for each of the three resolutions and each is broken up into four FPS ranges. Under 30 FPS is considered unplayable, over 30 is playable but not ideal, over 60 is the sweet spot, and then over 120 FPS is for high refresh rate monitors.
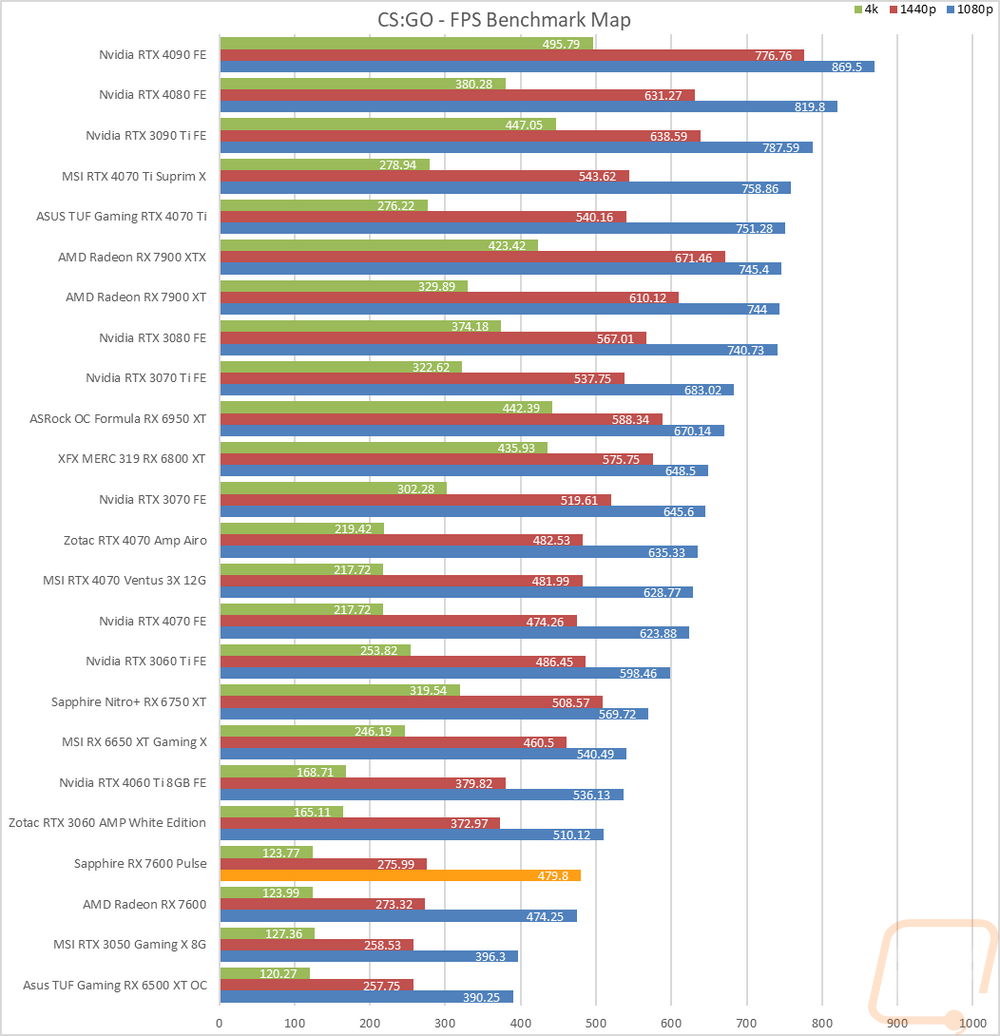
So how did the RX 7600 Pulse do? Well with its 1080p focus, its 1080p performance wasn’t a surprise at all. Five of our tests came in the 60-119 FPS range, an impressive 10 were over 120 FPS, and one (CS:GO) was over 240 FPS. This shows that the RX 7600 Pulse would have great for 1080p with a high refresh rate display with a majority of games, especially esports-focused games. Its performance at 1440p isn’t as good but is still all playable with just one in the playable but not smooth 30-59 FPS range. A majority of the results were over 60 FPS with 10 in that range, 4 were over 120 FPS and then again one (CS:GO) was over 240 FPS. Then at 4K the 8GB VRAM and 128-bit memory bus really catch up with one result under 30 FPS and a majority of the results in the 30-59 FPS range. Five results were still over 60 FPS and one was over 120 FPS.
Another way I have compiled all of our game results is with the overall averages. I do always skip CS: GO, its frame rates are always really high and would skew the overall averages. But this gives us a better comparison point between the RX 7600 Pulse and the reference RX 7600 as well as the RTX 3060, RTX 3060 Ti, and the RX 6650 XT. I was a little concerned when I saw some of the synthetic tests that the small overclock on the Pulse wouldn’t register much in-game but at 1080p it ended up being worth 1 FPS on average. That isn’t a lot, but it wasn’t a big overclock. The 1440p and 4K averages between the two RX 7600s don’t show any big difference. Beyond that though the 7600 as a whole is looking especially impressive compared to the RTX 3060 with 24 FPS between them at 1080p and the RX 7600 is a lot closer to the RTX 3060 Ti than I expected to see.
|
Average FPS (w/o CS:GO) |
1080p |
1440p |
4K |
|
RTX 3060 Ti |
144.8 |
105.4 |
59.2 |
|
Sapphire RX 7600 Pulse |
141.7 |
96.6 |
50.6 |
|
Radeon RX 7600 |
140.8 |
96.7 |
50.4 |
|
MSI RX 6650 XT Gaming X |
138 |
93.9 |
42.9 |
|
Zotac RTX 3060 AMP |
117.2 |
83.2 |
46.2 |
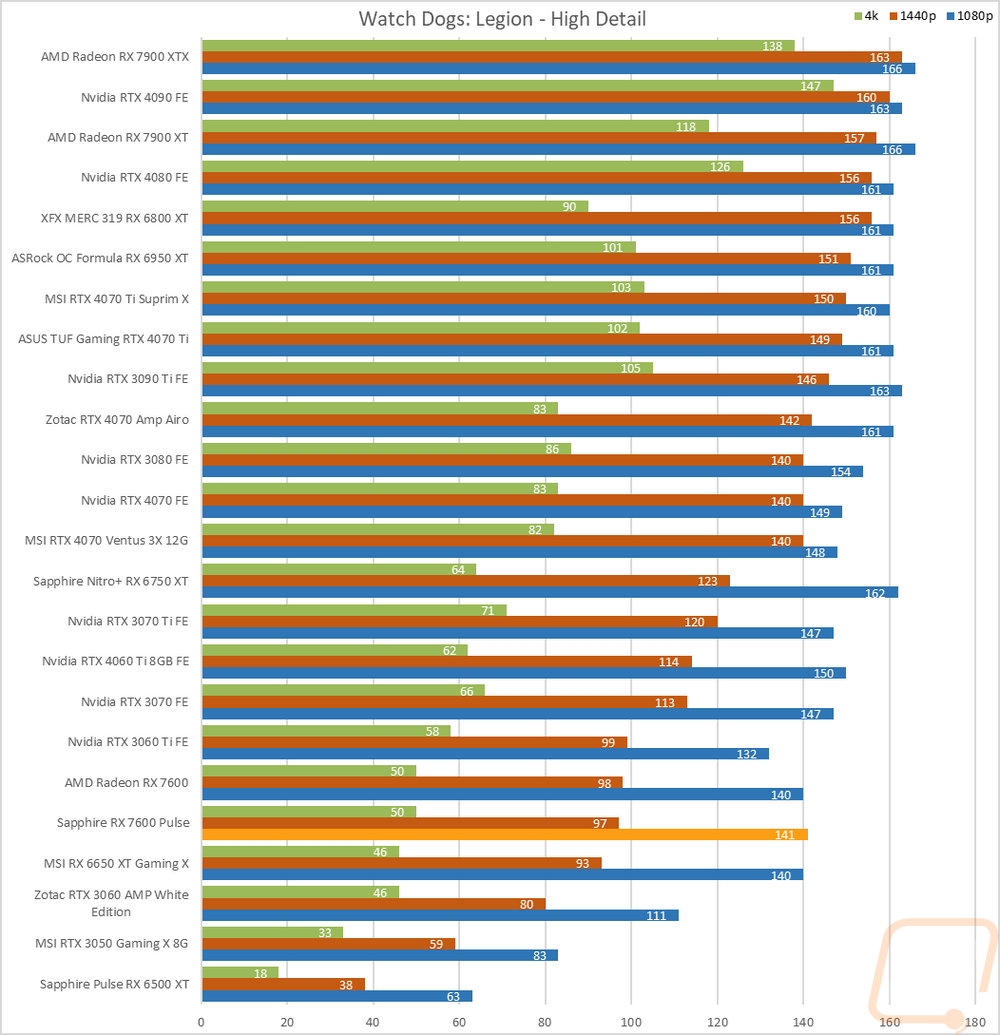
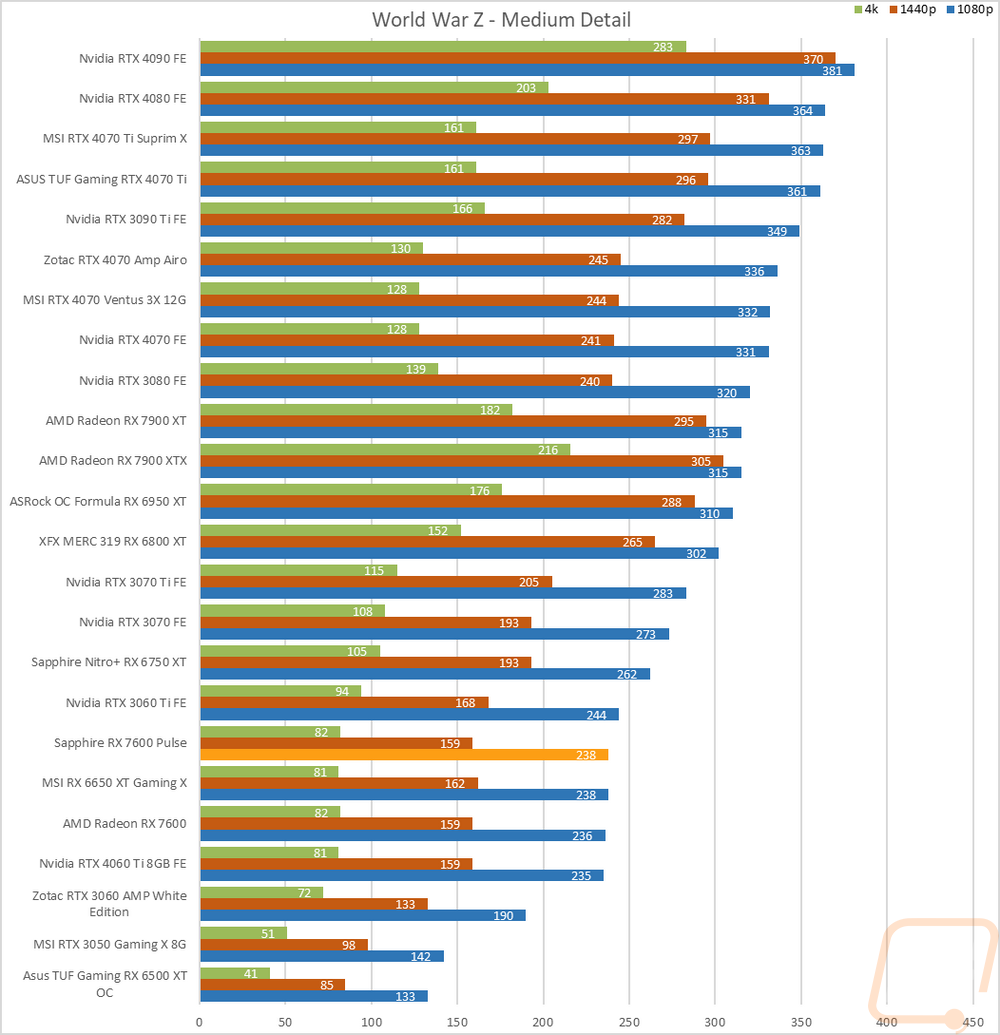
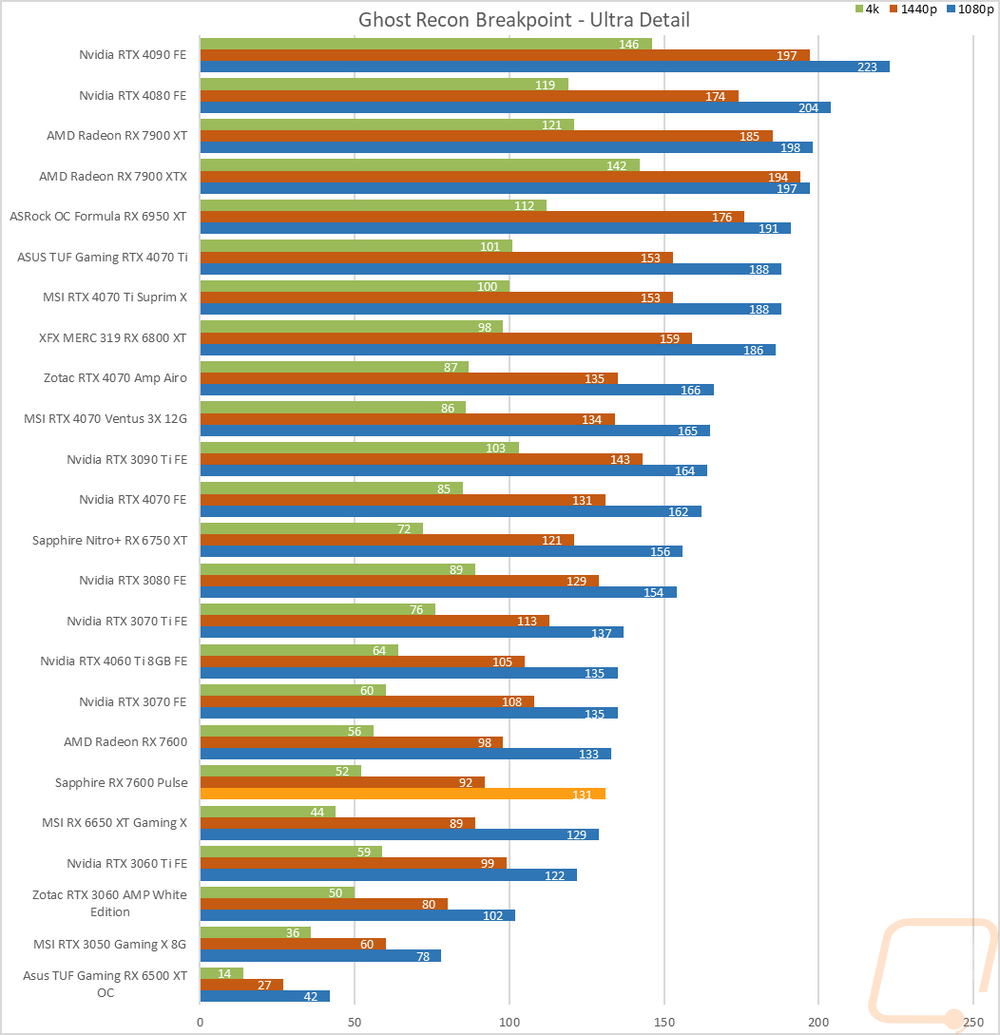
Of course, I have all of the actual in game results as well for anyone who wants to sort through the wall of graphs below. Most of the results just reinforce what we are seeing in the averages above, the Radeon RX 7600 is out in front of the RX 6650 XT but behind the RTX 3060 Ti in most of the results. In a few, you see it does even better like in Ghost Recon Breakpoint where it was up surprisingly close to the new RTX 4060 Ti. But there are also results like Far Cry 6 where the Radeon RX 7600 was behind the 6650 XT.

Compute Benchmarks
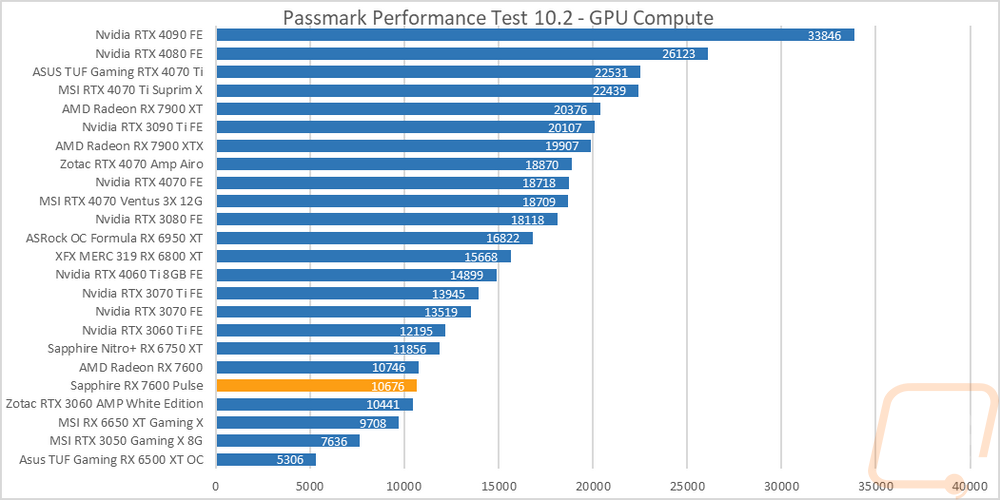
Now some people don’t need a video card for gaming, they need the processing power for rendering or 2D/3D production, or in some cases people who game also do work on the side. So it is also important to check out the compute performance on all of the video cards that come in. That includes doing a few different tests. My first test was a simple GPU Compute benchmark using Passmark’s Performance Test 10 and the Sapphire RX 7600 Pulse was a few points below the reference card, but as a whole, they were nearly tied in performance. Both cards have a good margin on the RX 6650 XT and were just ahead of the RTX 3060.
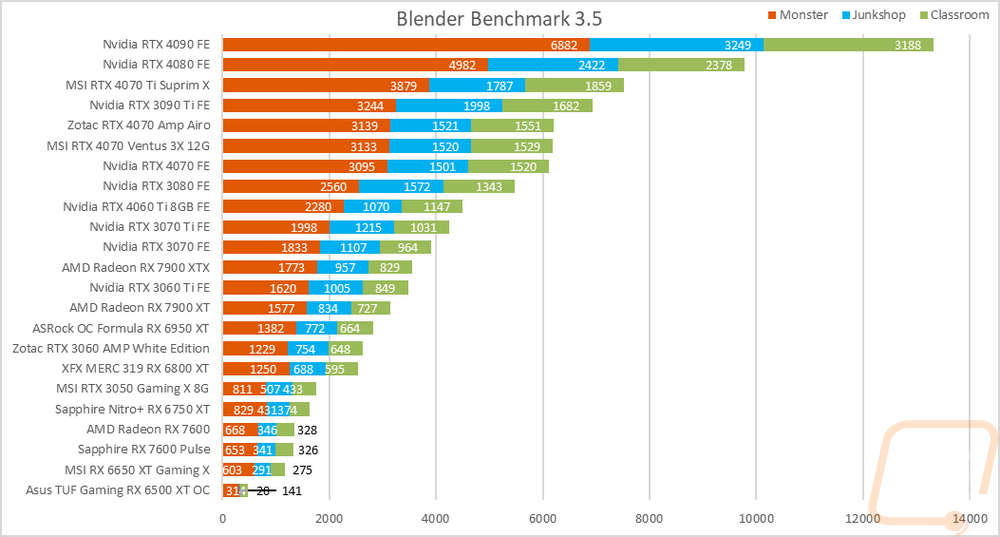
Blender is always my favorite compute benchmark because the open-source 3D rendering software is very popular and it isn’t a synthetic benchmark. With the latest version of Blender, they redid the benchmark so we now have a new test that runs three different renderings and gives each a score. I have all three stacked together so we can see the overall performance. The Sapphire RX 7600 Pulse was once again a few points behind the reference card here but as a whole, they are down near the bottom of the chart with even the RTX 3050 out in front.
Cooling Noise and Power
For my last few tests, rather than focusing on in game performance, I like to check out other aspects of video card performance. These are also the most important ways to differentiate the performance between cards that have the same GPU. To start things off I took a look at power usage.
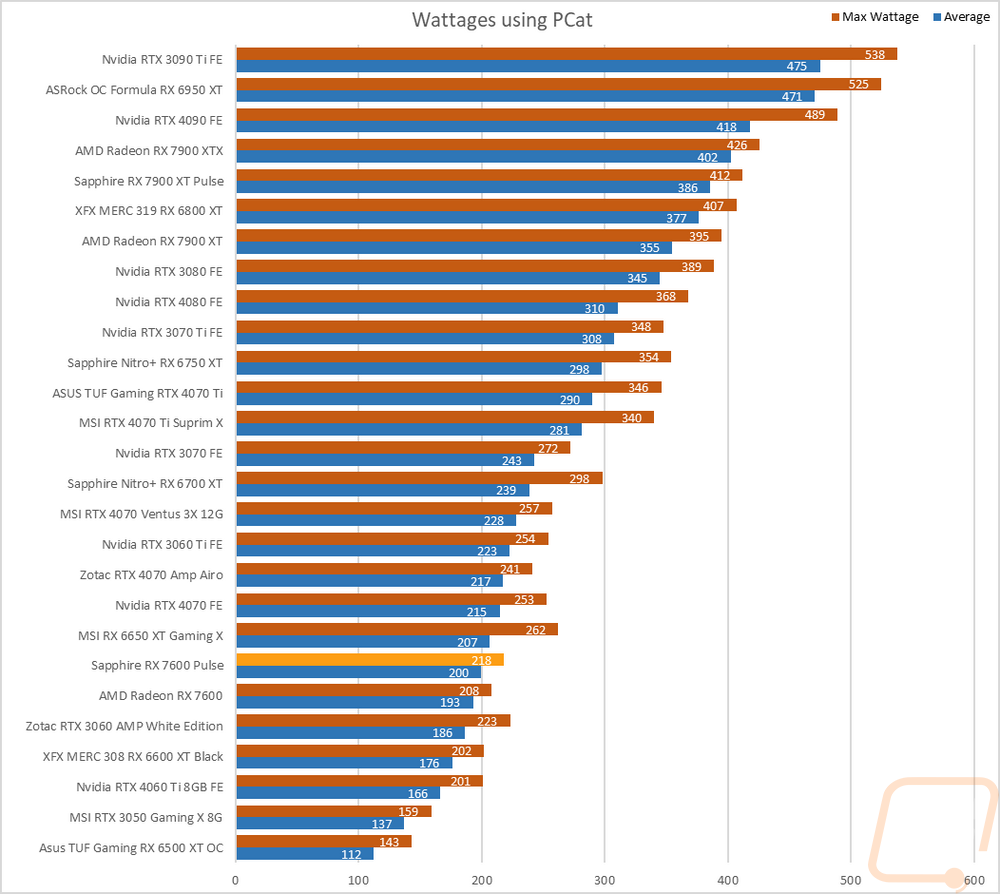
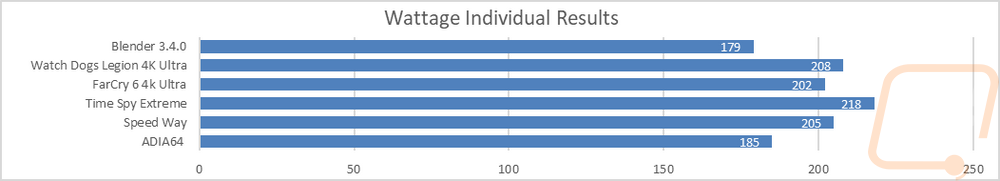
For this, our new test setup utilizes the Nvidia-designed PCat v2 along with cables to handle both traditional 6 or 8-pin connections as well as the new 12VHPWR. The PCat also utilizes a PCIe adapter to measure any power going to the card through the PCIe slot so we can measure the video card wattage exclusively, not the entire system as we have done in the past. I test with a mix of applications to get both in game, synthetic benchmarks, and other workloads like Blender and AIDA64. Then everything is averaged together for our result. I also have the individual results for this specific card and I document the peak wattage result as well which is almost always Time Spy Extreme. The Sapphire RX 7600 Pulse with its slight overclock came in at 218 watts in the highest test which was 10 watts more than the reference RX 7600 and 200 watts for the overall average across all of our tests which is 7 watts more than the reference card. This is still down at the bottom 1/3 of the chart but for comparison, the overclocked RX 6600 was at 202 and 176, so we don’t have an improvement here, in fact, this is a little worse. This is even more noticeable once you add the new RTX 4060 Ti into the mix which has an average of just 166 with 201 watts at its highest.
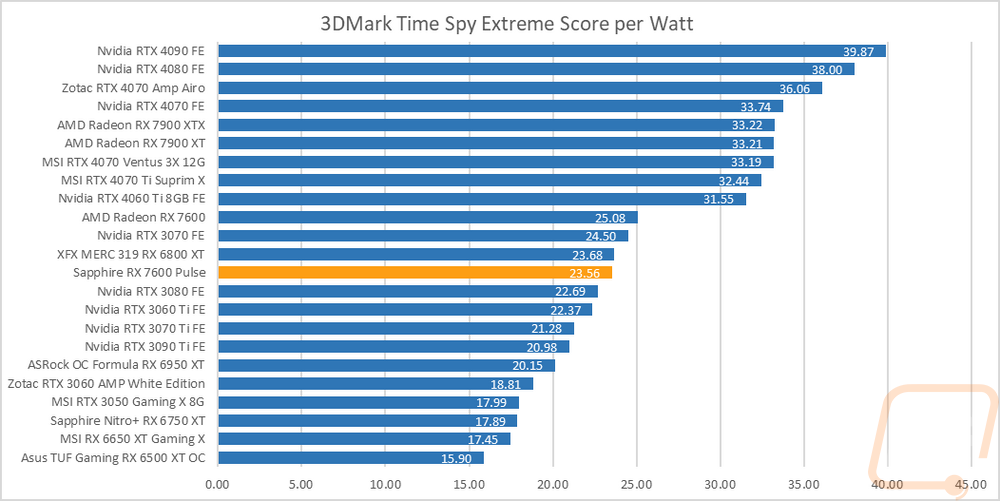
With having exact peak wattage numbers when running Time Spy Extreme I was also able to put together a graph showing the total score for each watt that a card draws which gives us an interesting look at overall power efficiency in the popular and demanding benchmark. The Sapphire RX 7600 Pulse with its overclock and more power usage than the reference card came in at .12 of a point per watt lower than the older RX 6800 XT and 1.52 per watt lower than the reference card. So the slight bump in performance is traded off in overall efficiency. Really both cards are still a lot lower than I would like them to see, there is a clear line between all of the other new-generation cards including the 7900 XT and 7900 XTX, and the RX 7600 should be up near those cards but it isn’t.
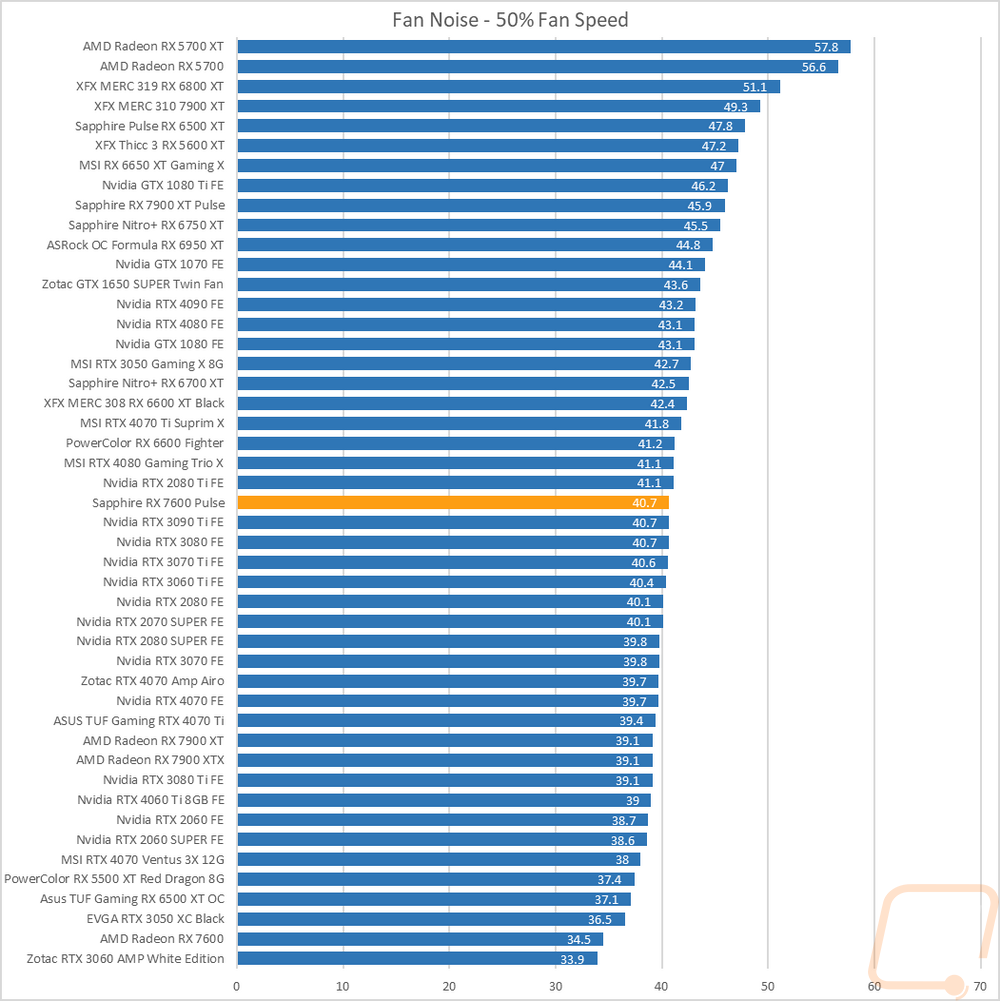
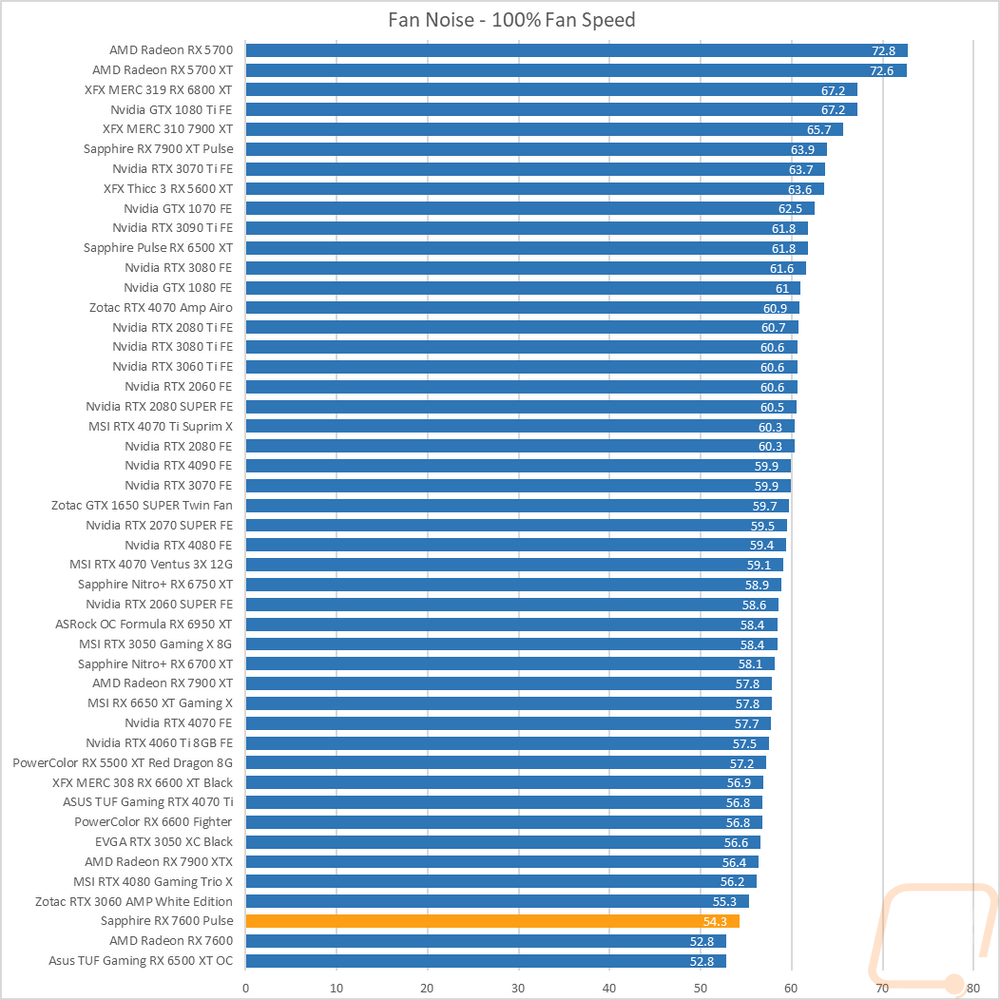
My next round of tests were looking at noise levels. These are especially important to me because I can’t stand to listen to my PC whirling. Especially when I’m not in game and other applications are using the GPU. For my testing, though I first tested with the fan cranked up to 100% to get an idea of how loud it can get, then again at 50% to get an idea of its range. The Sapphire RX 7600 Pulse came in at an impressive 54.3 decibels for the 100% fan speed result which put it down near the bottom of the chart but just slightly above the reference card. Its 50% was 40.7 decibels which is in the middle of the chart and average.
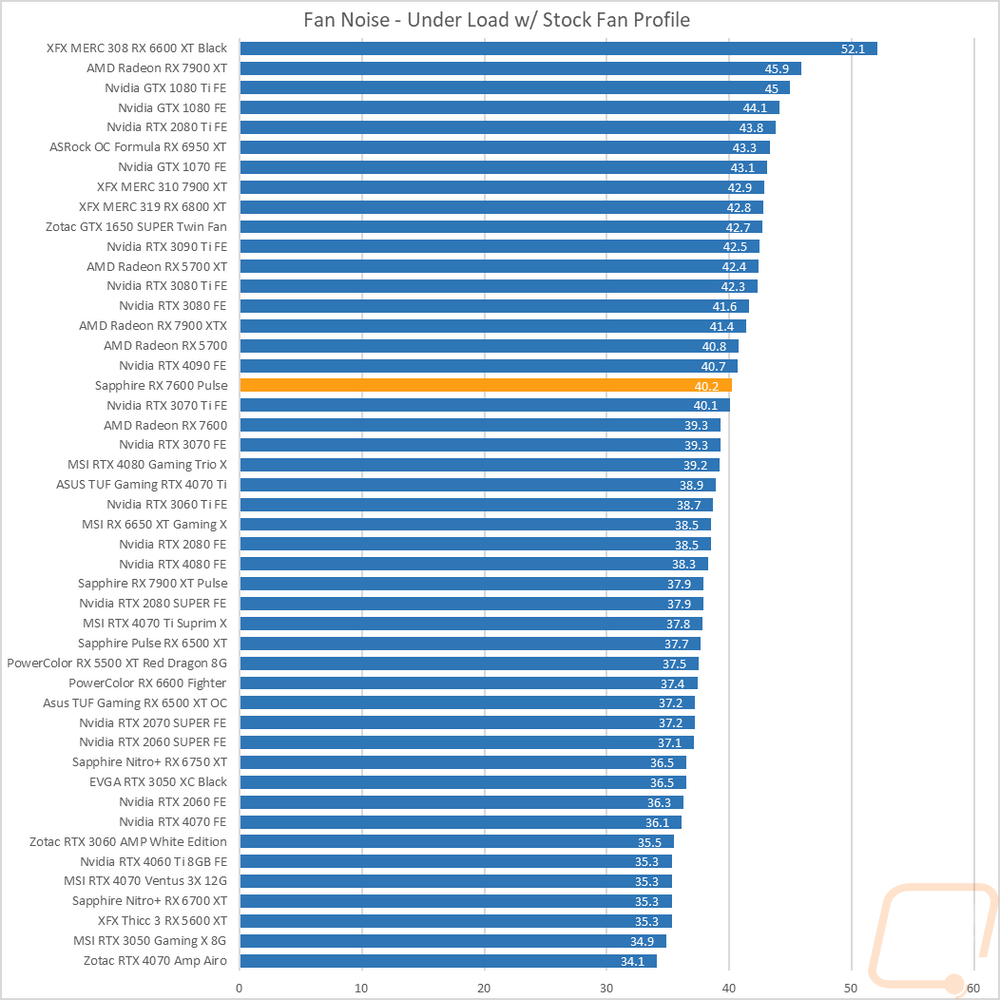
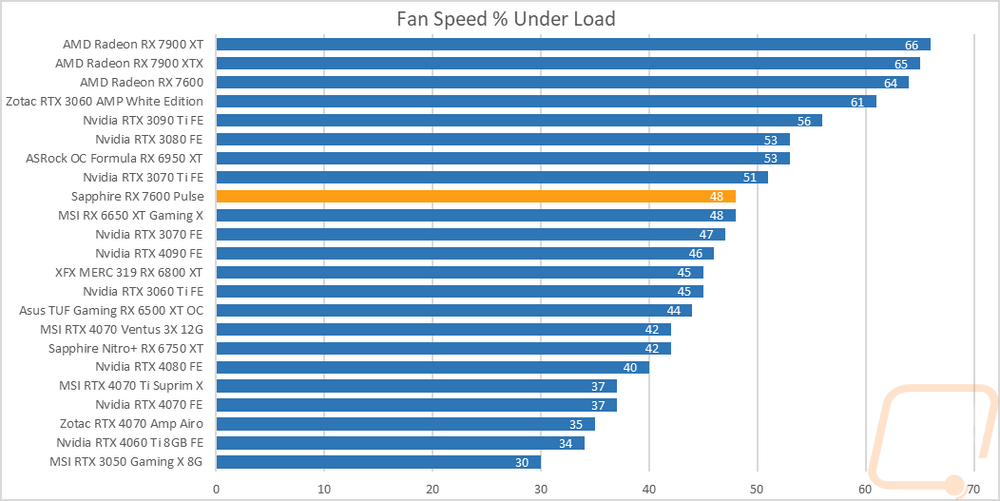
I also take a look at noise performance while under load. For that when running AIDA64’s stress test I wait until the temperature of the card has leveled off and then measure how loud things are when the card is at its worst-case scenario with the stock fan profile. Here the Sapphire RX 7600 Pulse, like with its 50% fan speed result is in the middle of the pack, which makes sense because while under load it was running at 61% fan speed. That is an improvement over the reference card which in the same situation was running at 74%.
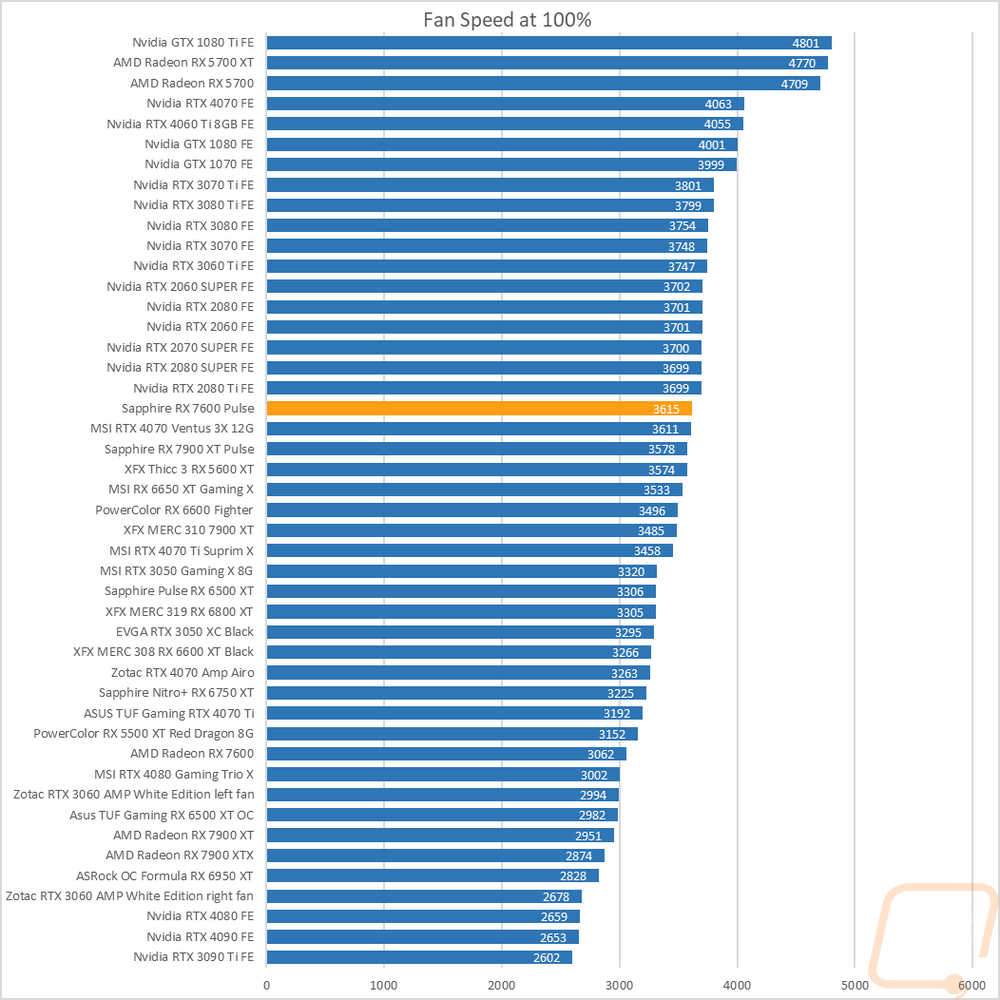
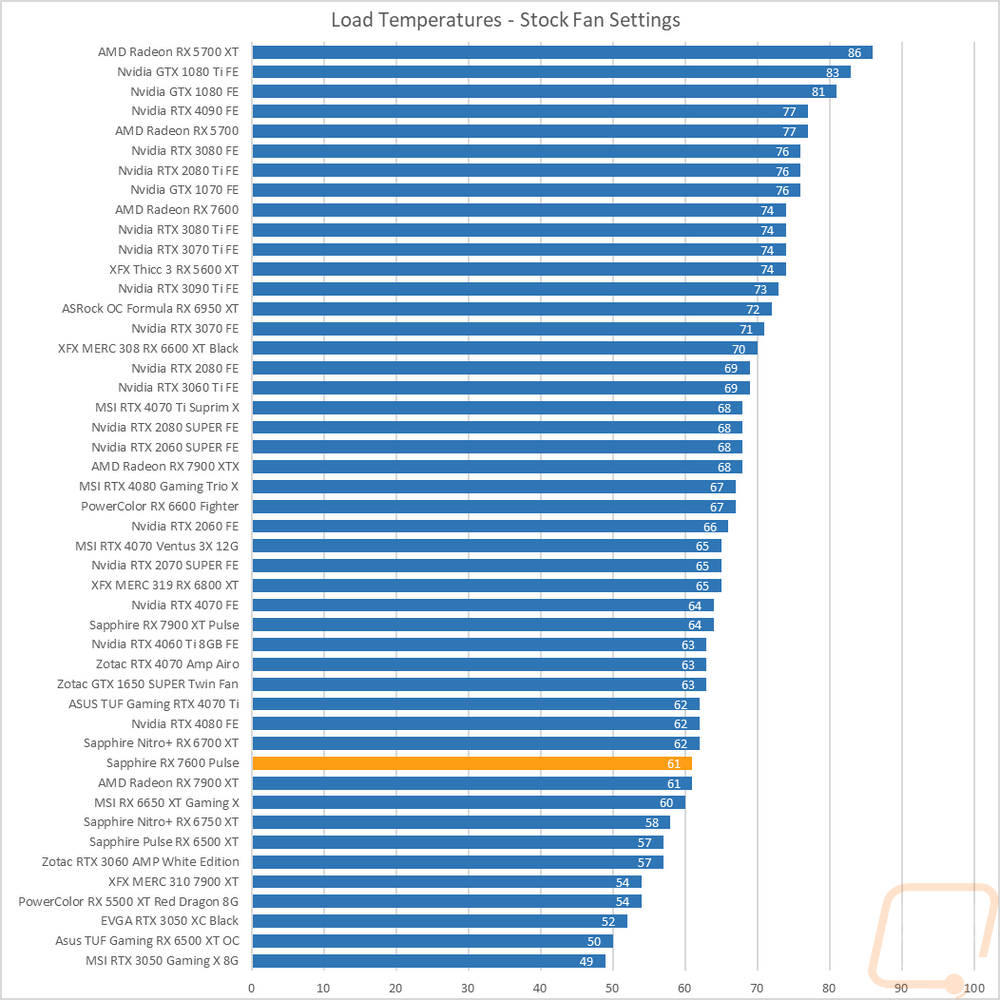
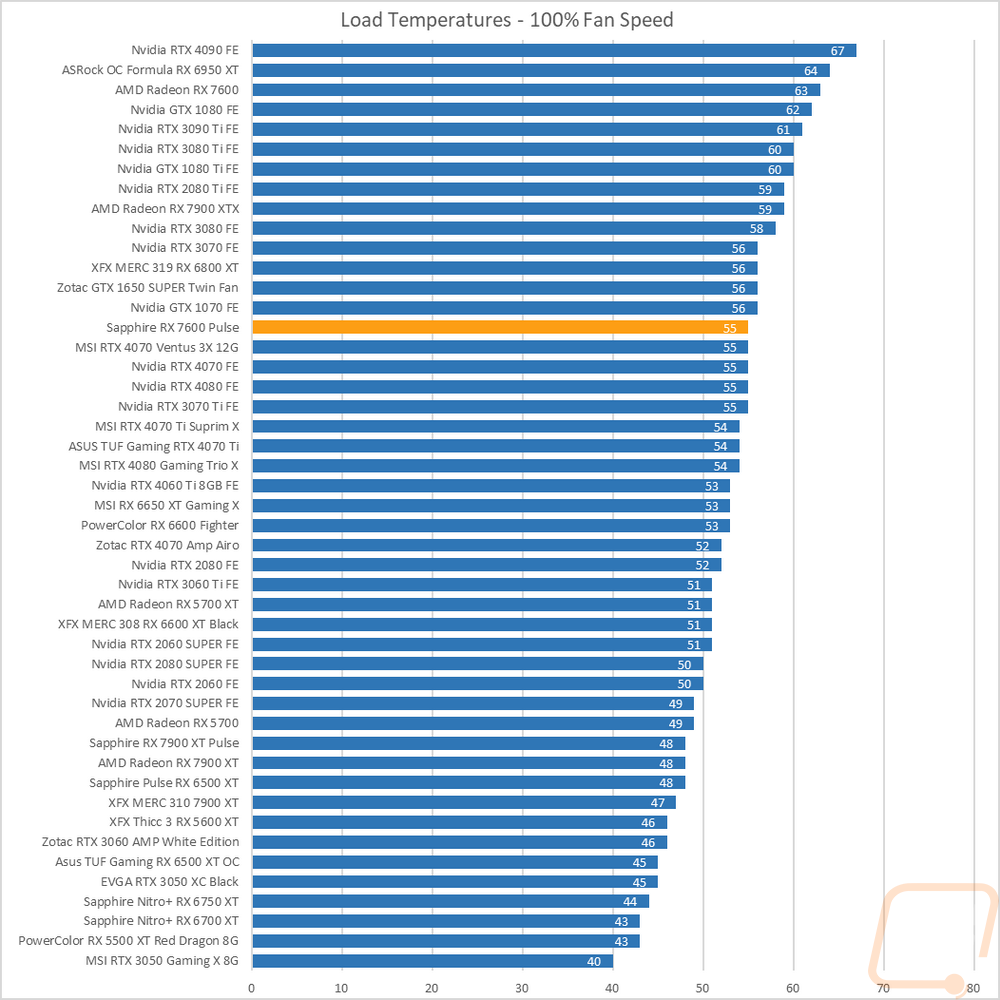
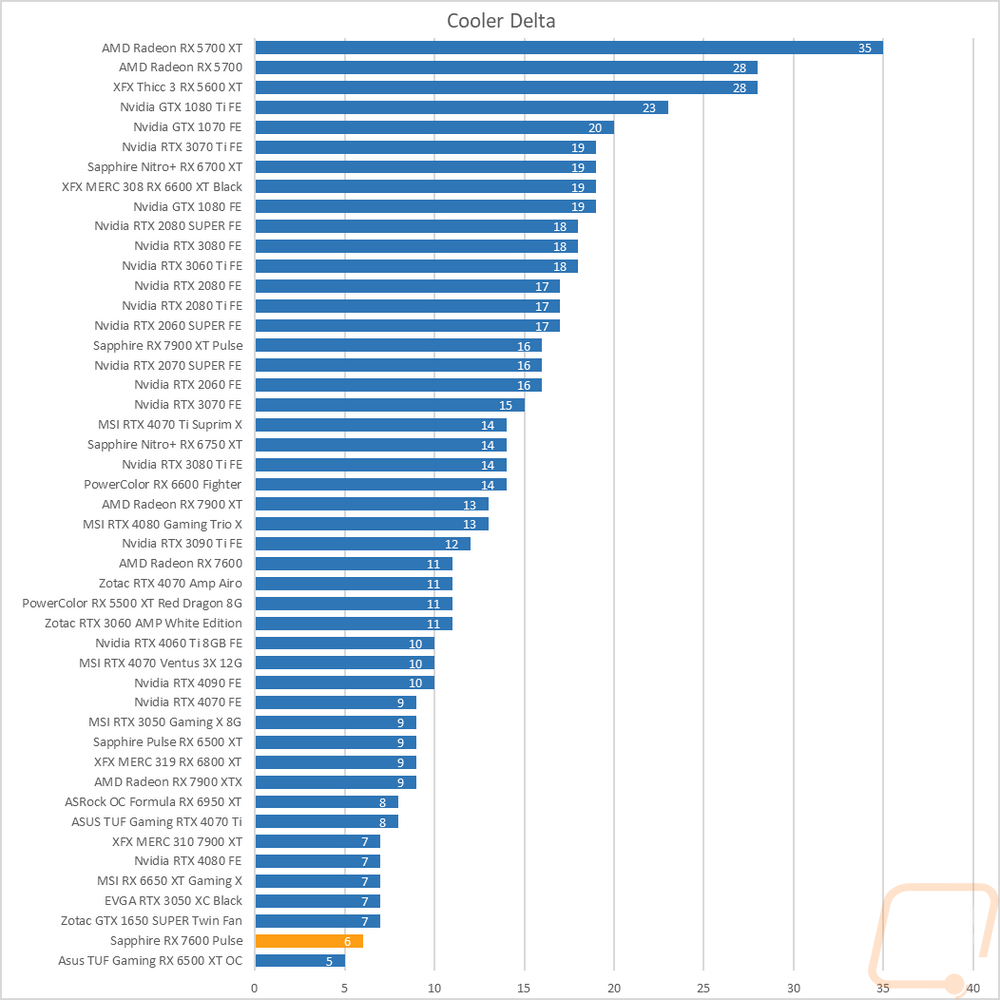
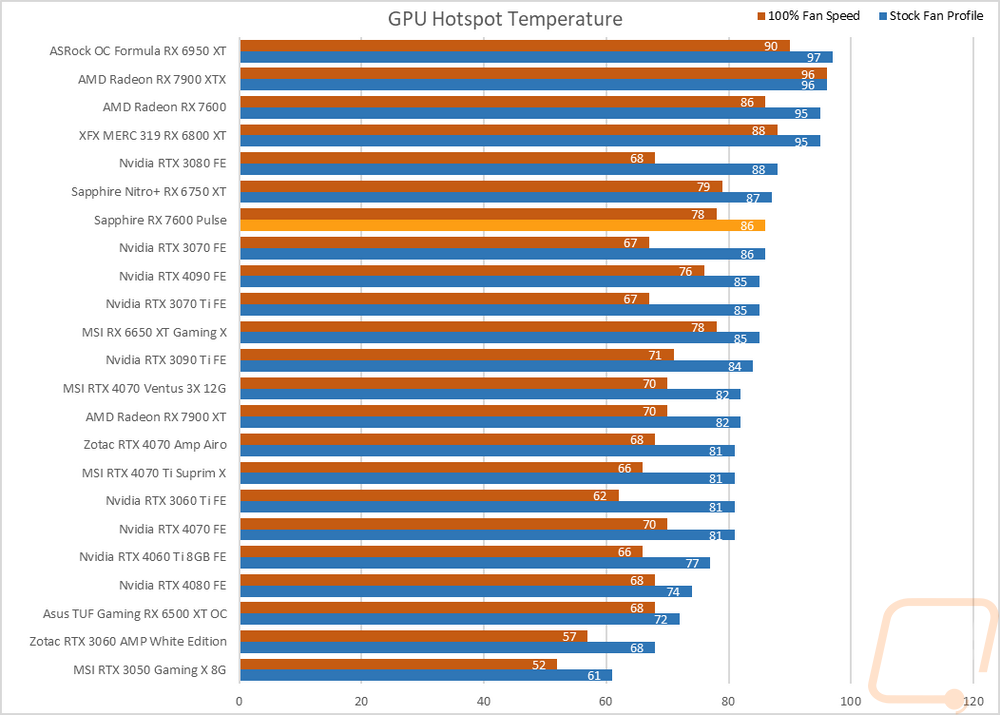
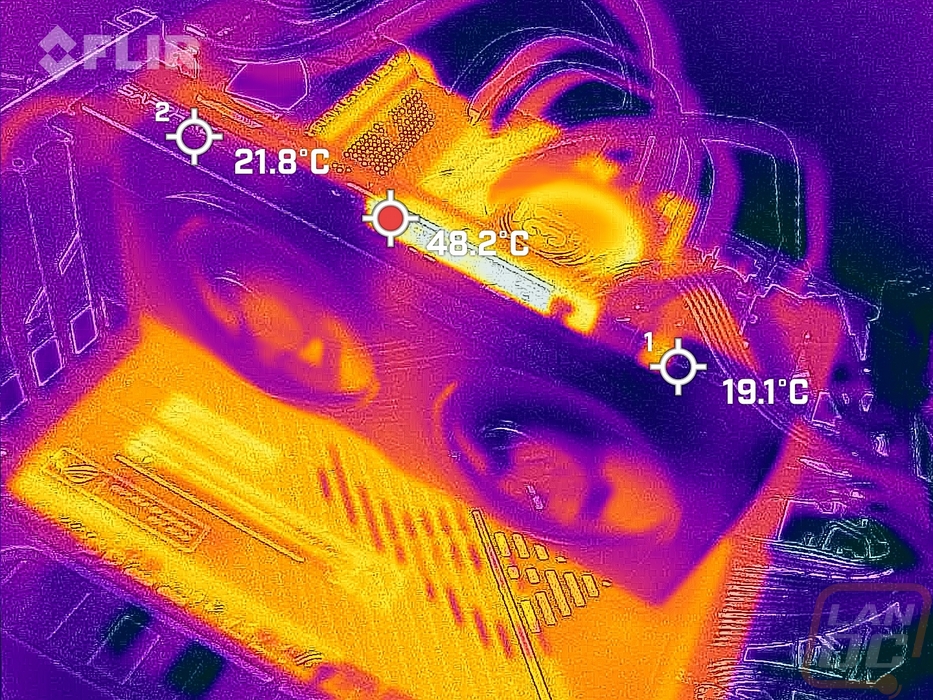
To finish up my testing I of course had to check out the cooling performance. To do this I ran two different tests. I used AIDA64’s Stress Test run for a half-hour each to warm things up. Then I documented what temperature the GPU leveled out at with the stock fan profile and then again with the fans cranked up to 100%. With the stock profile, the Sapphire RX 7600 Pulse did well leveling off at 61c which puts it in the bottom ¼ of the chart and this is 13 degrees lower than the reference card. The GPU hotspot in that same situation was at 86c, 9c down from the reference as well. Then with the fans cranked up, the Sapphire RX 7600 Pulse leveled off at 55c which is in the upper-middle portion of our results. That is still 8c better than the reference card at 100% fan speed and the GPU hotspot was down to 78c which is 8c lower than the reference as well. The delta between the two situations was just 6c which is a little low but overall the Sapphire RX 7600 Pulse is a huge improvement compared to the reference cooler which is what we want to see.
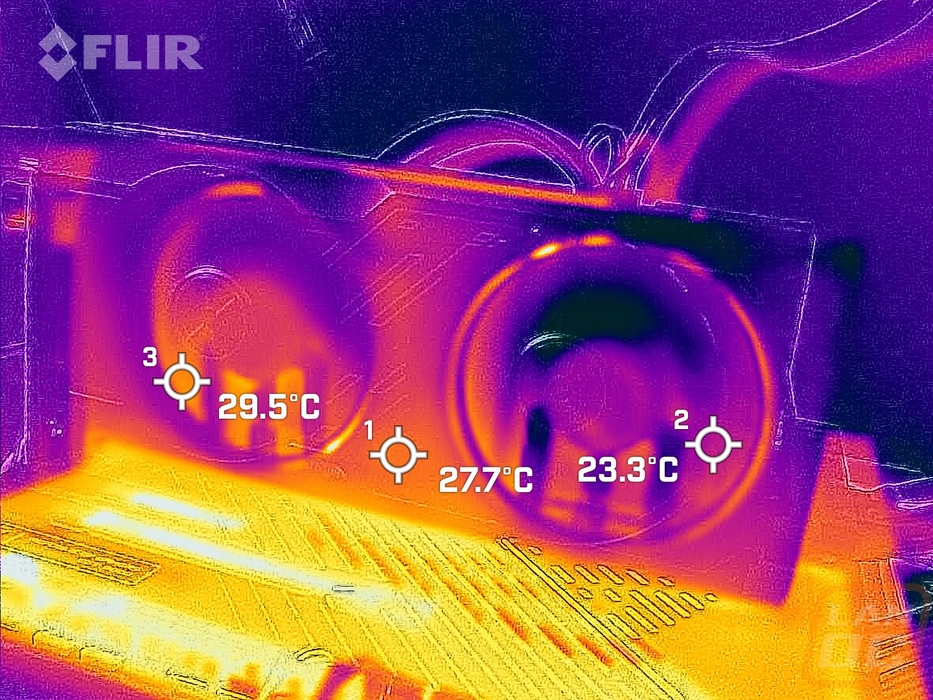
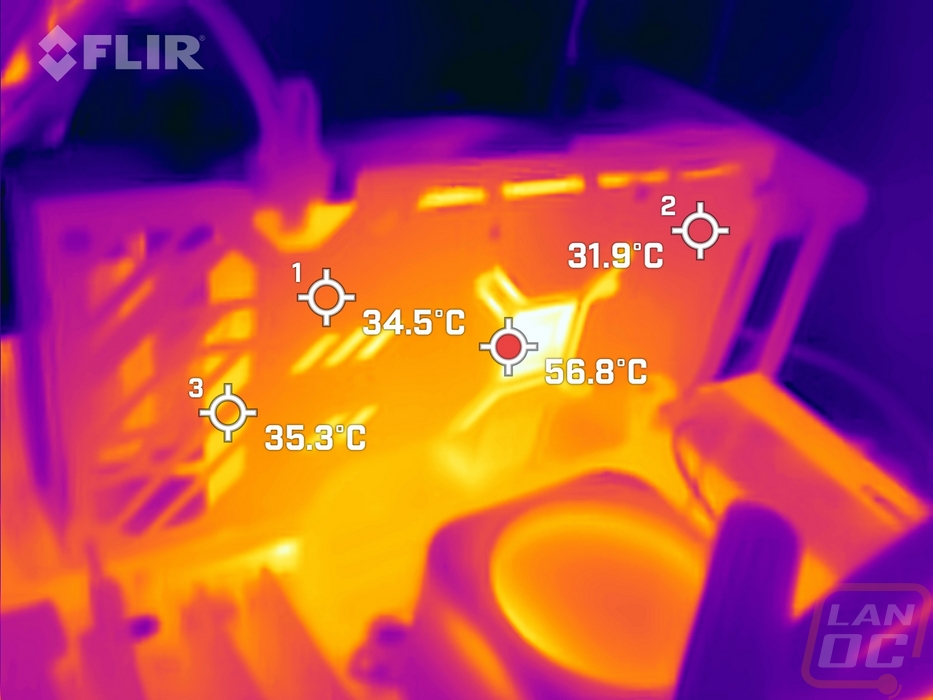
While running the stock fan profile testing I also took the time to get a few thermal images so we could see what is going on. The fan side of the RX 7600 Pulse is looking nice and cool, cool enough that it is making the motherboard look like it is running hot. Up on the top edge of the card in the center where we have some exposed PCB and the exposed heatsink, but as we saw earlier the design should be pushing most of the air towards the ends of the cards so any extra heat here on the top is just heat rising. The rear metal backplate is pulling some heat out but the hot spot here is of course the exposed back of the GPU socket as well as a few of the small windows in the backplate.
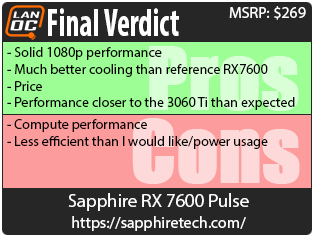
Overall and Final Verdict
After already taking a look at the AMR Radeon RX 7600 reference card, I was impressed with the pricing and the overall gaming performance but the reference design left a lot to be desired when it came to the cooling performance. Sapphire’s RX 7600 Pulse is the perfect follow-up to that coverage because it comes in at the same price point but you get a slight overclock and a different cooler design. I will be in the minority in that I do still prefer the all-metal cooler design over the Pulse for styling, but the Pulse isn’t far off. Sapphire blacked the cooler out for the most part except for a few red accents on the front and back of the card. The RX 7600 Pulse skips RGB lighting and keeps the focus on performance, which it has. Like the reference card, the RX 7600 Pulse has great performance, especially at 1080p in gaming. It was surprisingly close to the RTX 3060 Ti in performance at 1080p which came as a surprise. The overclock helped it gain an extra FPS over the reference card but it did cost it more on the power efficiency which the RX 7600 was already struggling with. Sapphire made all of that up with cooling they could keep the RX 7600 running cool. The RX 7600 Pulse has a standard 8-pin PCIe power connection as well which should save you from having to upgrade your power supply to an ATX 3.0 power supply for a while longer.
Like with the reference card, the RX 7600 Pulse struggled when it came to the compute tests, this just isn’t the ideal card if you are hoping to game and also render in Blender. Its overall power usage wasn’t high at all, but comparing it to the RTX 4060 Ti it does leave a little to be desired. The 4060 Ti was faster and at 34 watts on average less. Of course, the RTX 4060 Ti is in a completely different price class at $399 whereas the RX 7600 Pulse has the same MSRP as the stock-clocked reference card at $269. At that price, the RX 7600 Pulse is an exciting card for 1080p gamers. It’s okay you can come back out, there are a few options now to put together a solid gaming system without completely breaking the bank.

Live Pricing: HERE


