In-Game Benchmarks
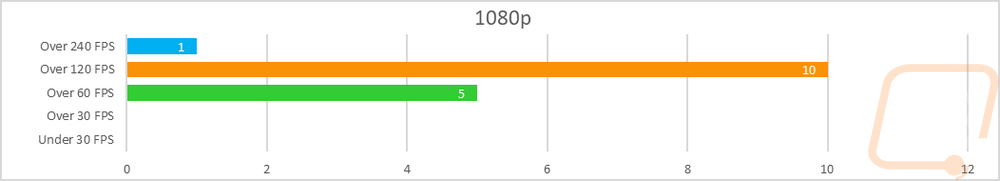
Now we finally get into the in game performance and that is the main reason people pick up a new video card. To test things out I ran through our new benchmark suite that tests 10 games at three different resolutions (1080p, 1440p, and 4k). Most of the games tested have been run at the highest detail setting and a mid-range detail setting to get a look at how turning things up hurts performance and to give an idea of if turning detail down from max will be beneficial for frame rates. In total, each video card is tested 54 times and that makes for a huge mess of results when you put them all together. To help with that I like to start with these overall playability graphs that take all of the results and give an easier-to-read result. I have one for each of the three resolutions and each is broken up into four FPS ranges. Under 30 FPS is considered unplayable, over 30 is playable but not ideal, over 60 is the sweet spot, and then over 120 FPS is for high refresh rate monitors.
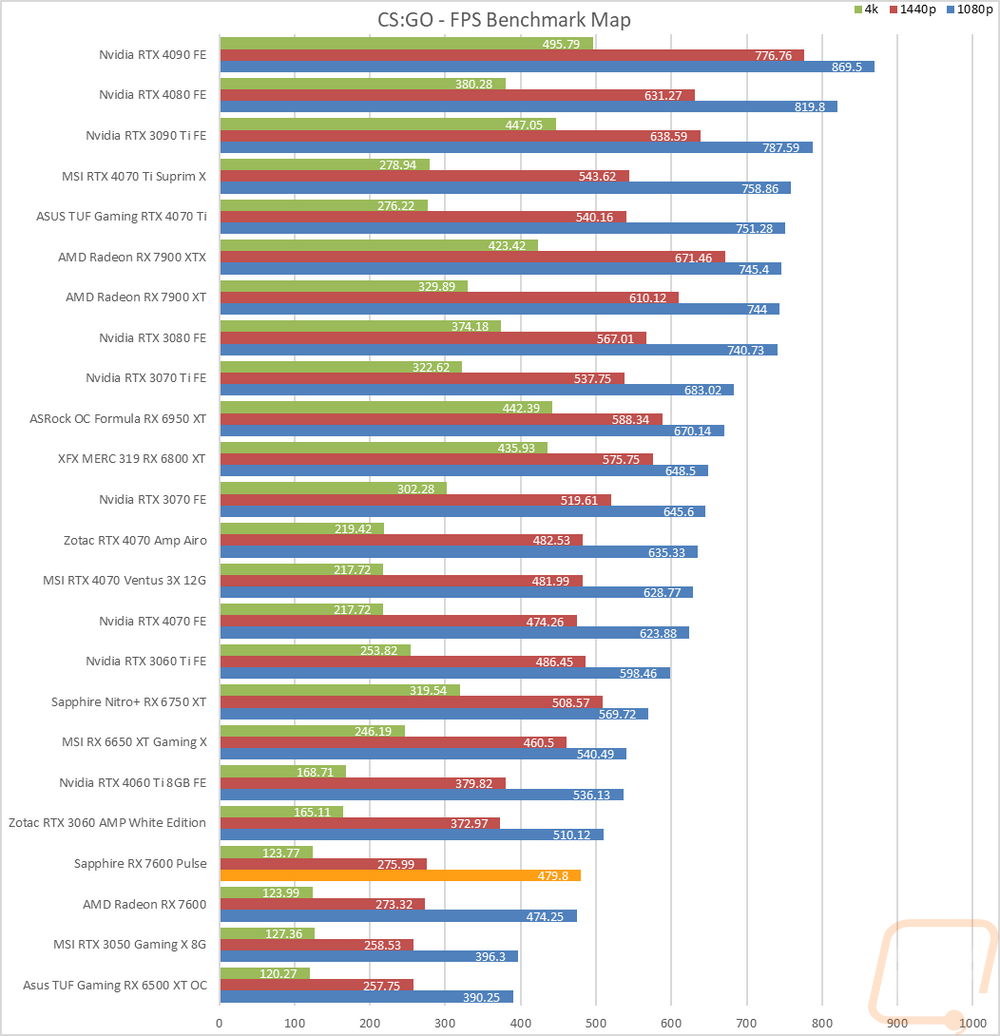
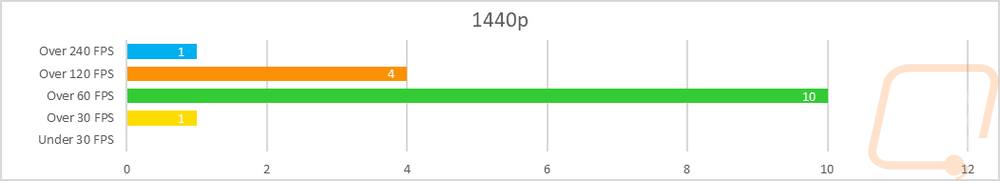
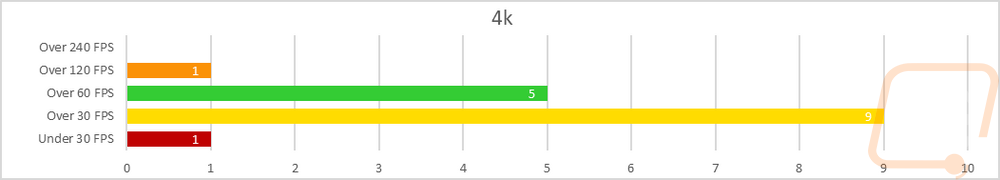
So how did the RX 7600 Pulse do? Well with its 1080p focus, its 1080p performance wasn’t a surprise at all. Five of our tests came in the 60-119 FPS range, an impressive 10 were over 120 FPS, and one (CS:GO) was over 240 FPS. This shows that the RX 7600 Pulse would have great for 1080p with a high refresh rate display with a majority of games, especially esports-focused games. Its performance at 1440p isn’t as good but is still all playable with just one in the playable but not smooth 30-59 FPS range. A majority of the results were over 60 FPS with 10 in that range, 4 were over 120 FPS and then again one (CS:GO) was over 240 FPS. Then at 4K the 8GB VRAM and 128-bit memory bus really catch up with one result under 30 FPS and a majority of the results in the 30-59 FPS range. Five results were still over 60 FPS and one was over 120 FPS.
Another way I have compiled all of our game results is with the overall averages. I do always skip CS: GO, its frame rates are always really high and would skew the overall averages. But this gives us a better comparison point between the RX 7600 Pulse and the reference RX 7600 as well as the RTX 3060, RTX 3060 Ti, and the RX 6650 XT. I was a little concerned when I saw some of the synthetic tests that the small overclock on the Pulse wouldn’t register much in-game but at 1080p it ended up being worth 1 FPS on average. That isn’t a lot, but it wasn’t a big overclock. The 1440p and 4K averages between the two RX 7600s don’t show any big difference. Beyond that though the 7600 as a whole is looking especially impressive compared to the RTX 3060 with 24 FPS between them at 1080p and the RX 7600 is a lot closer to the RTX 3060 Ti than I expected to see.
|
Average FPS (w/o CS:GO) |
1080p |
1440p |
4K |
|
RTX 3060 Ti |
144.8 |
105.4 |
59.2 |
|
Sapphire RX 7600 Pulse |
141.7 |
96.6 |
50.6 |
|
Radeon RX 7600 |
140.8 |
96.7 |
50.4 |
|
MSI RX 6650 XT Gaming X |
138 |
93.9 |
42.9 |
|
Zotac RTX 3060 AMP |
117.2 |
83.2 |
46.2 |
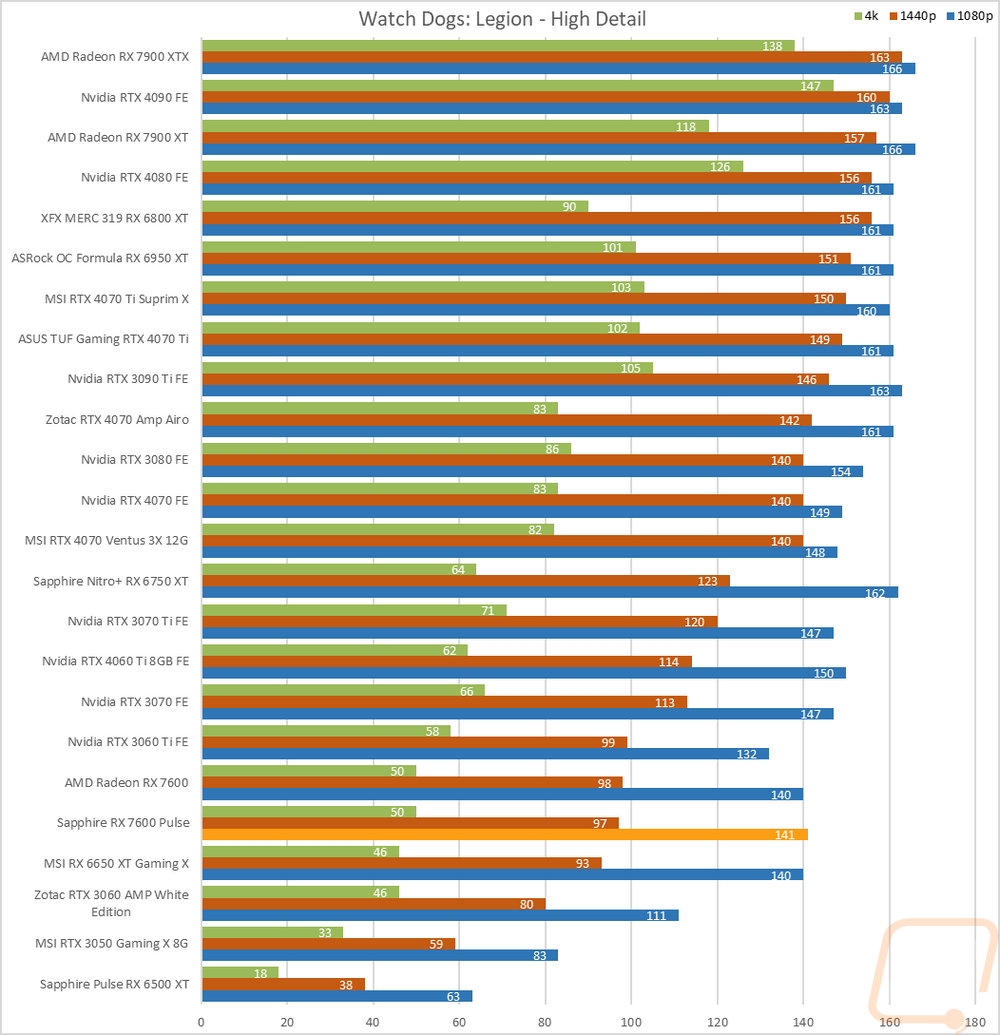
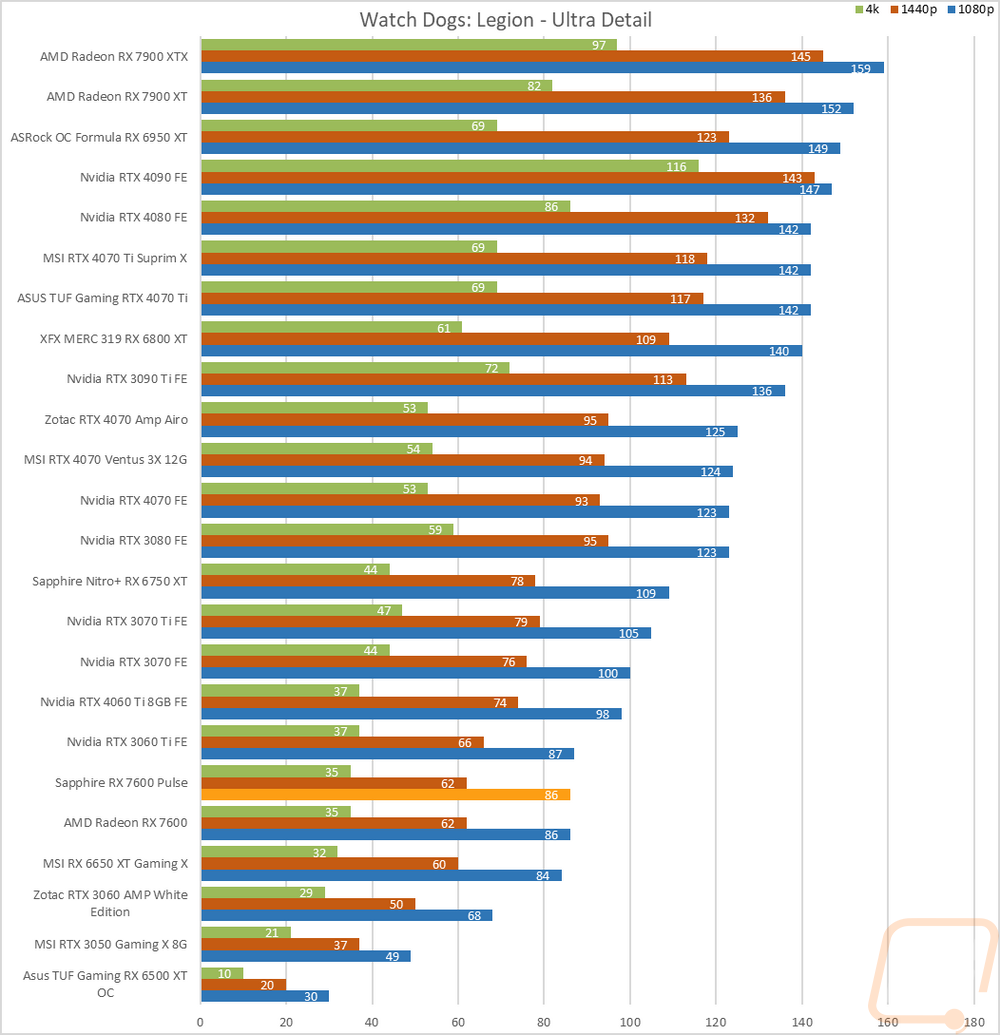
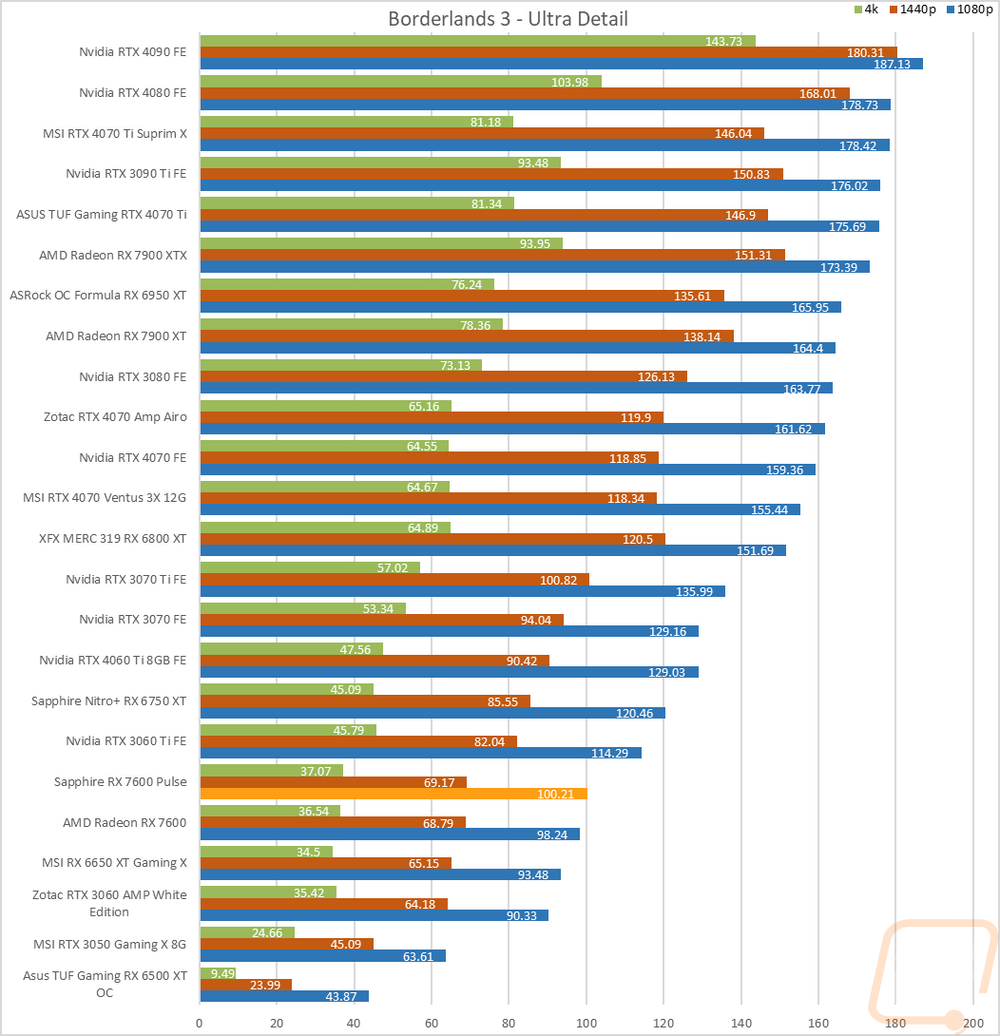
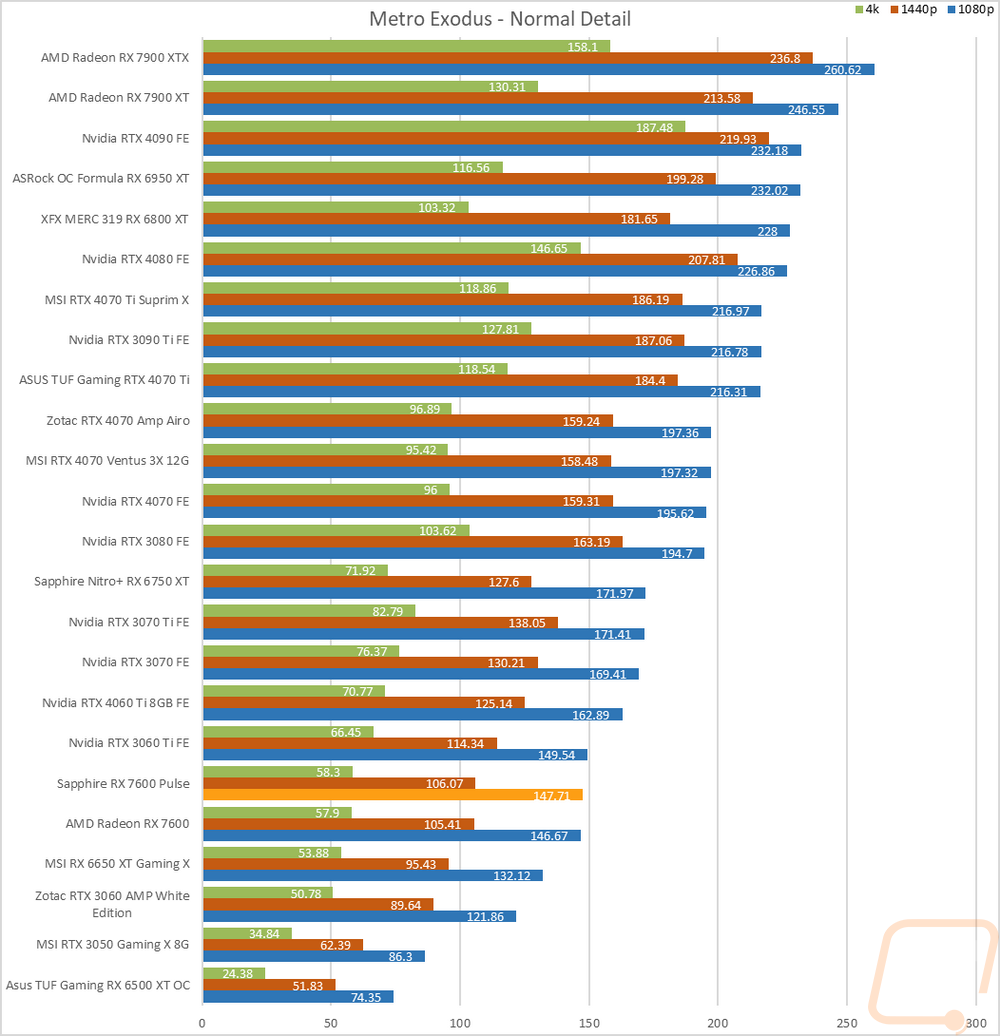
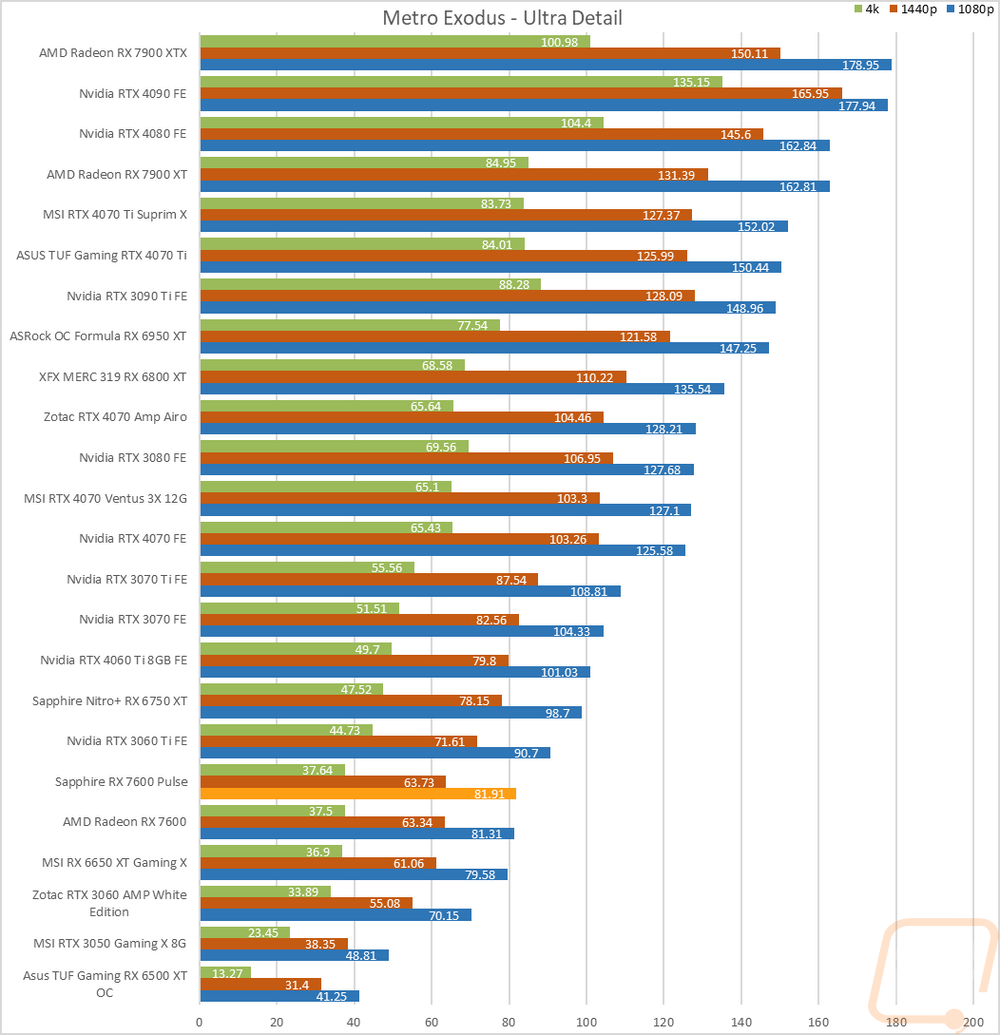
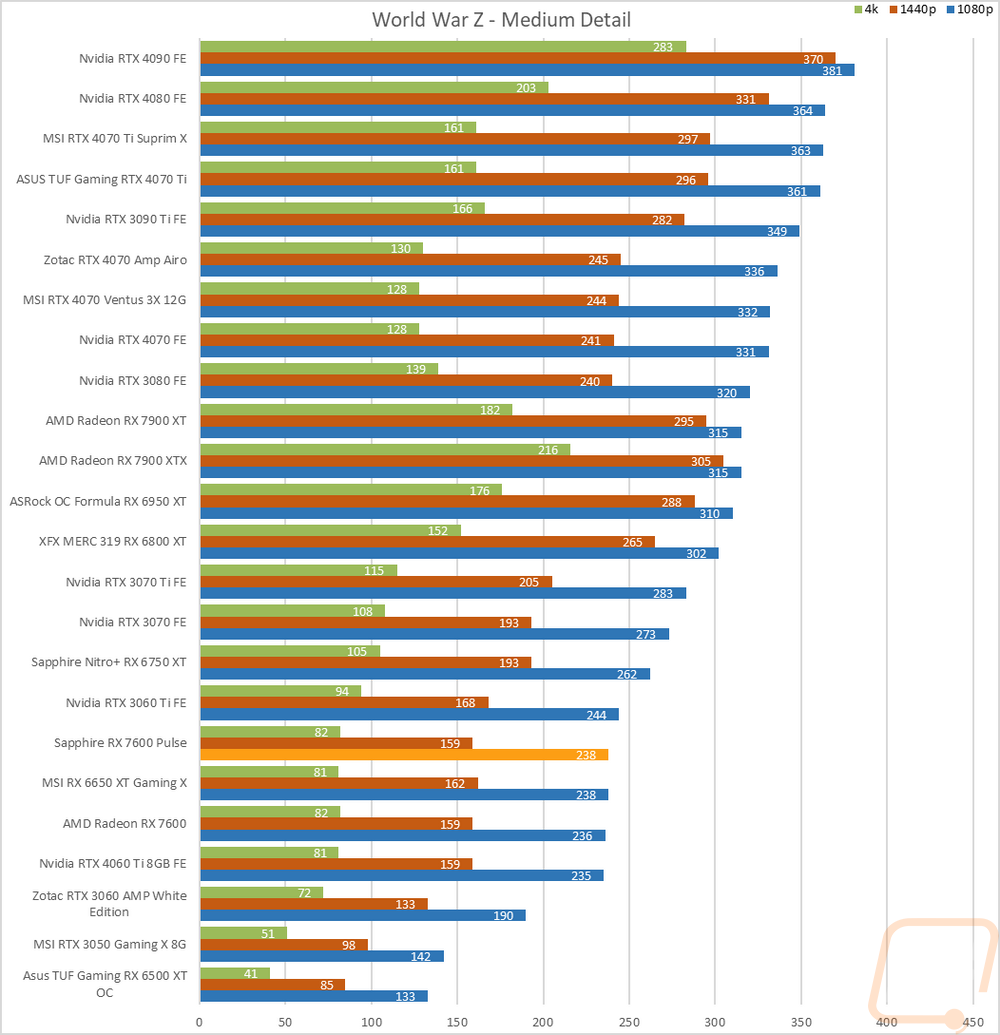
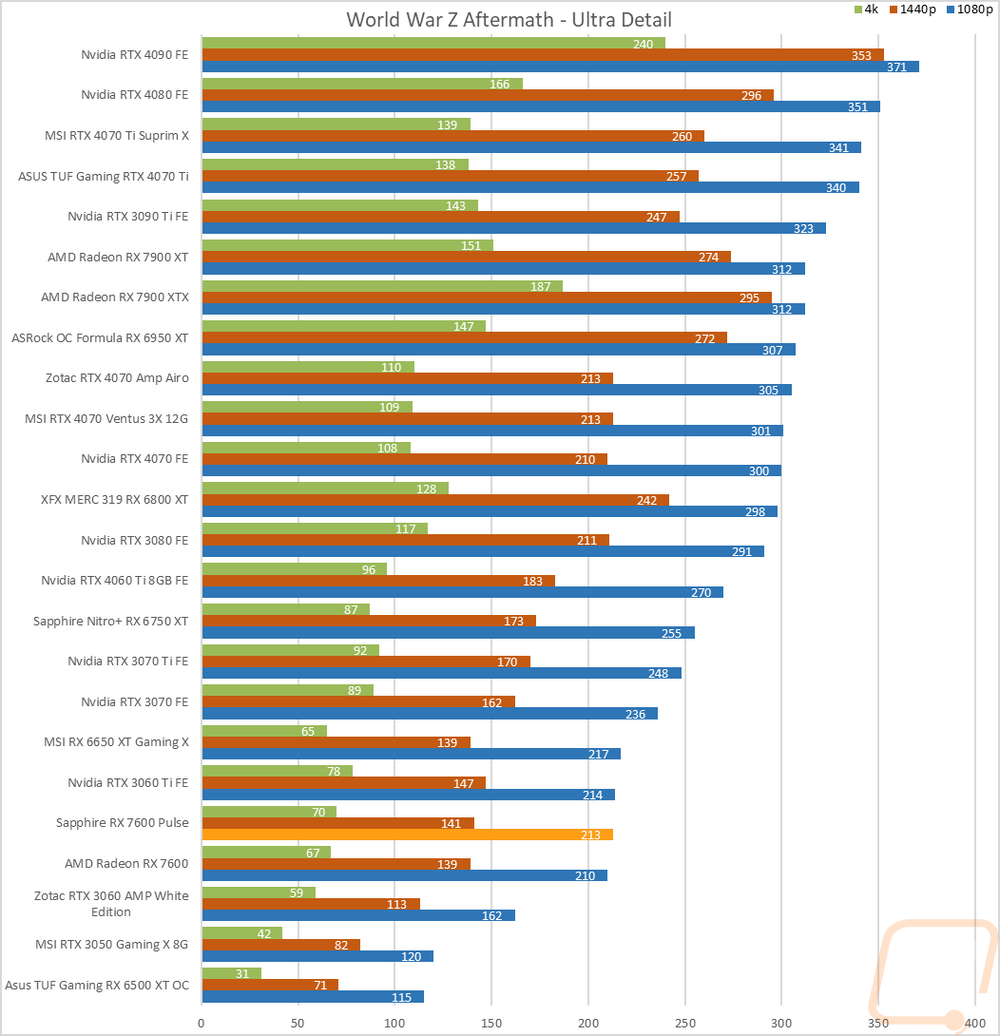
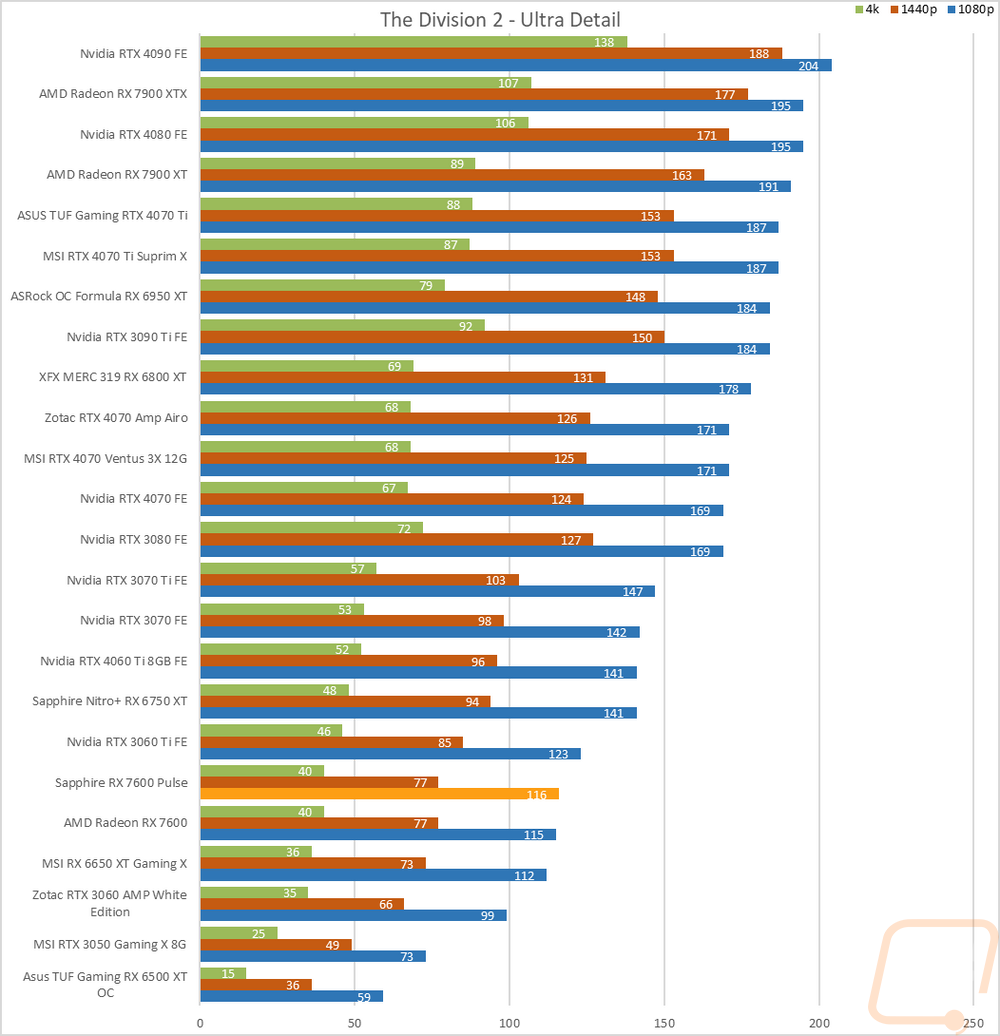
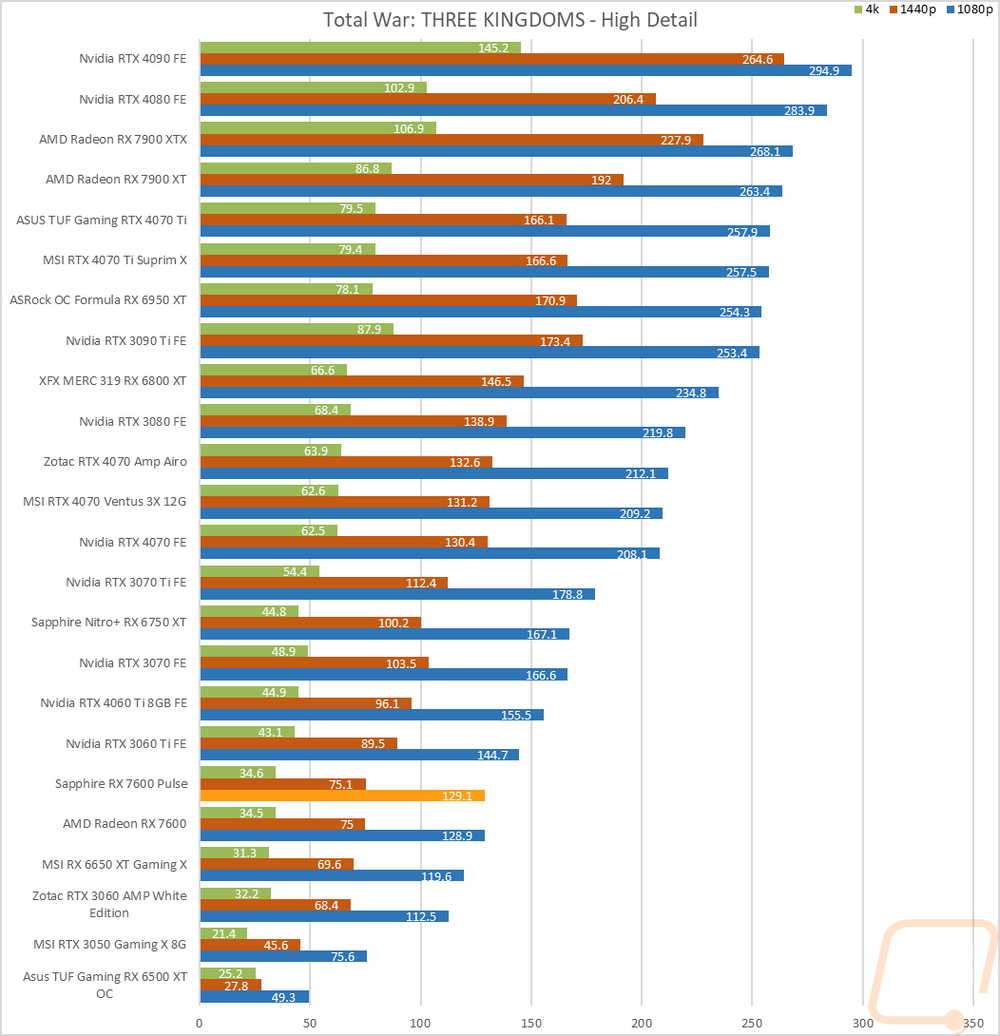
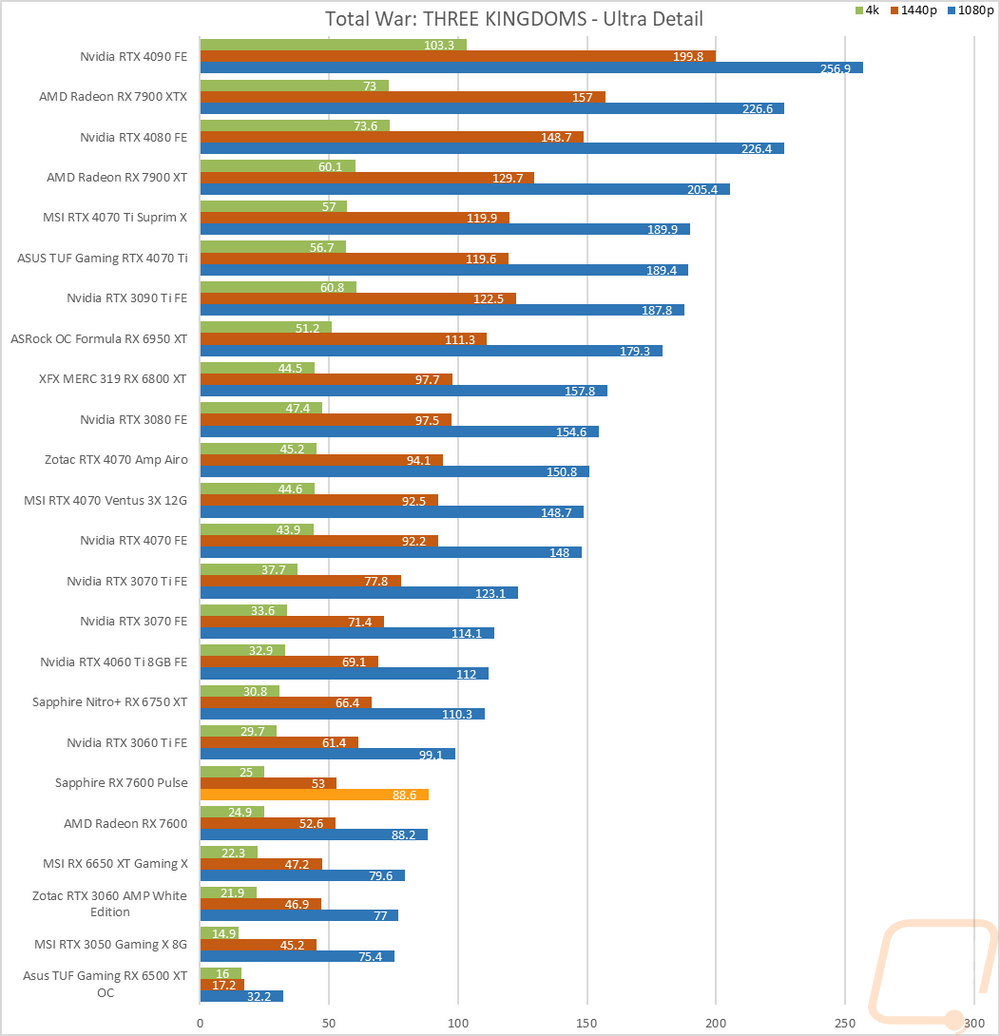
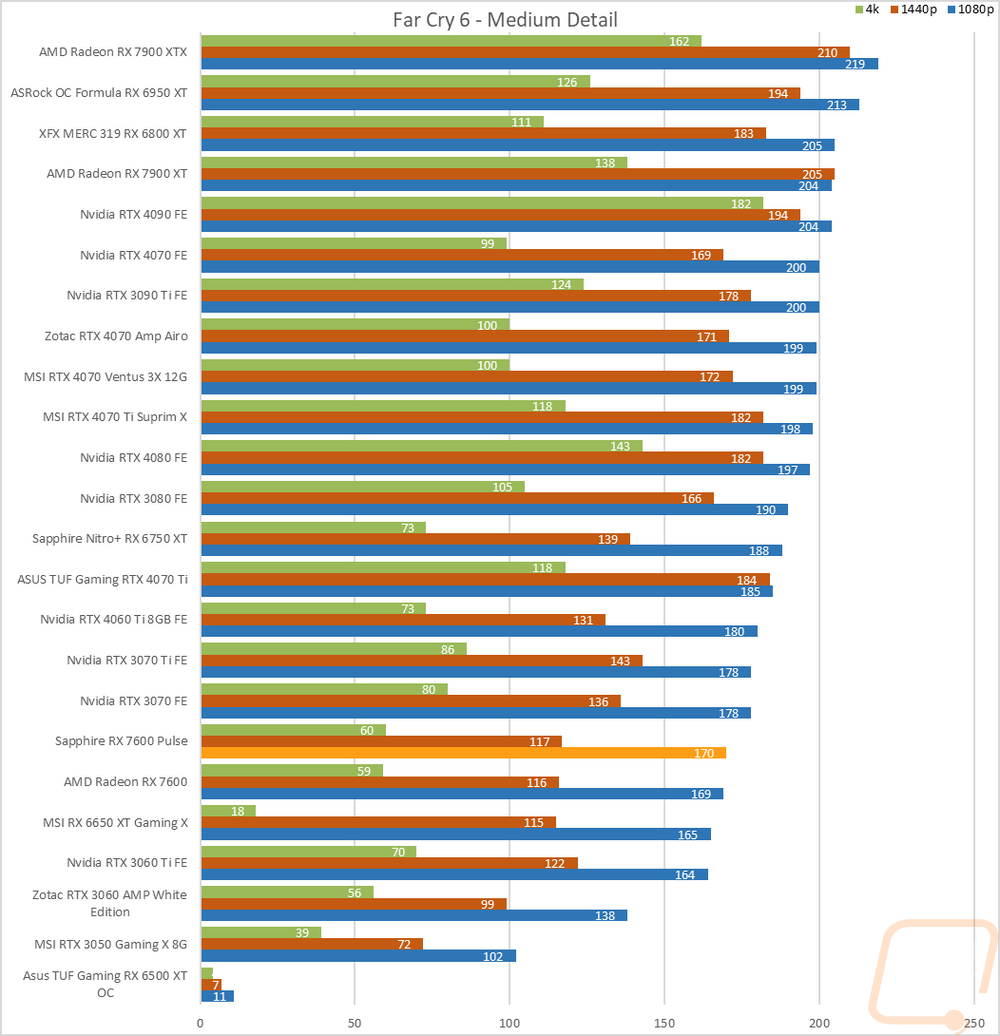
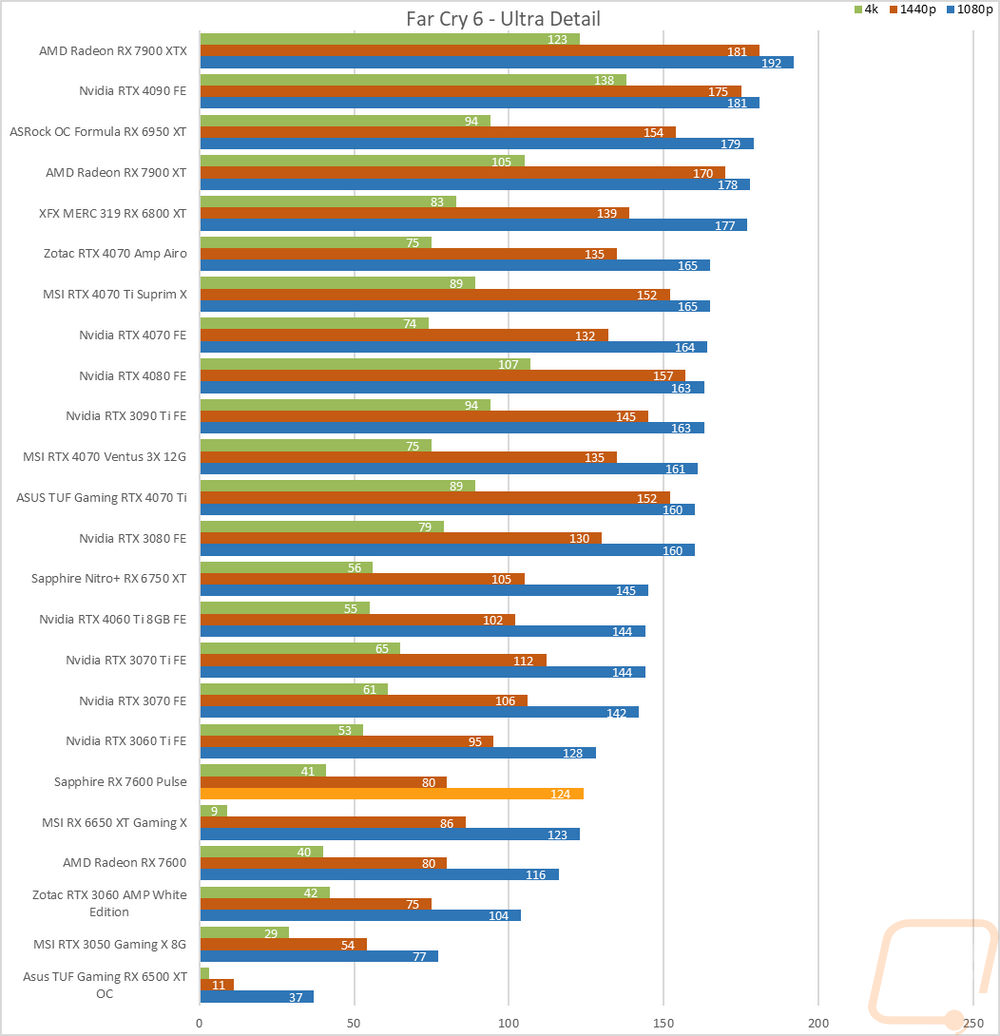
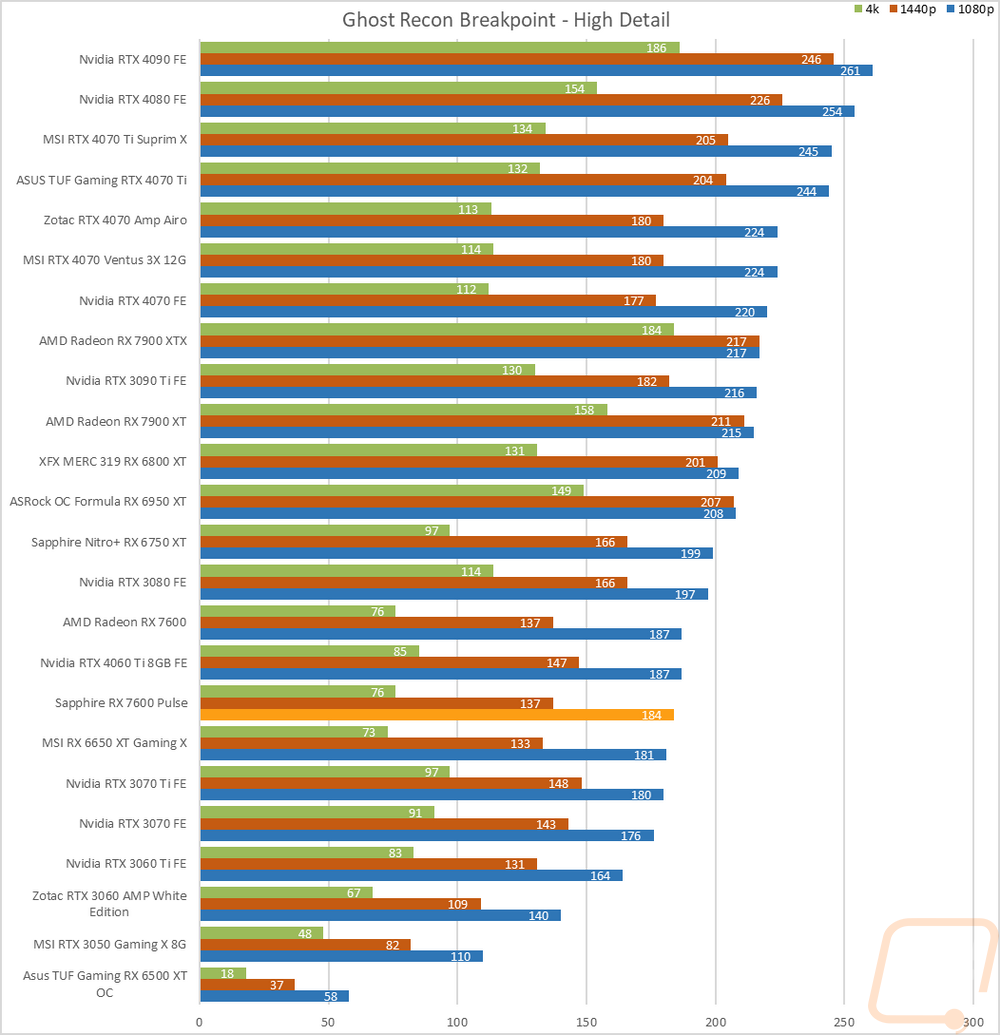
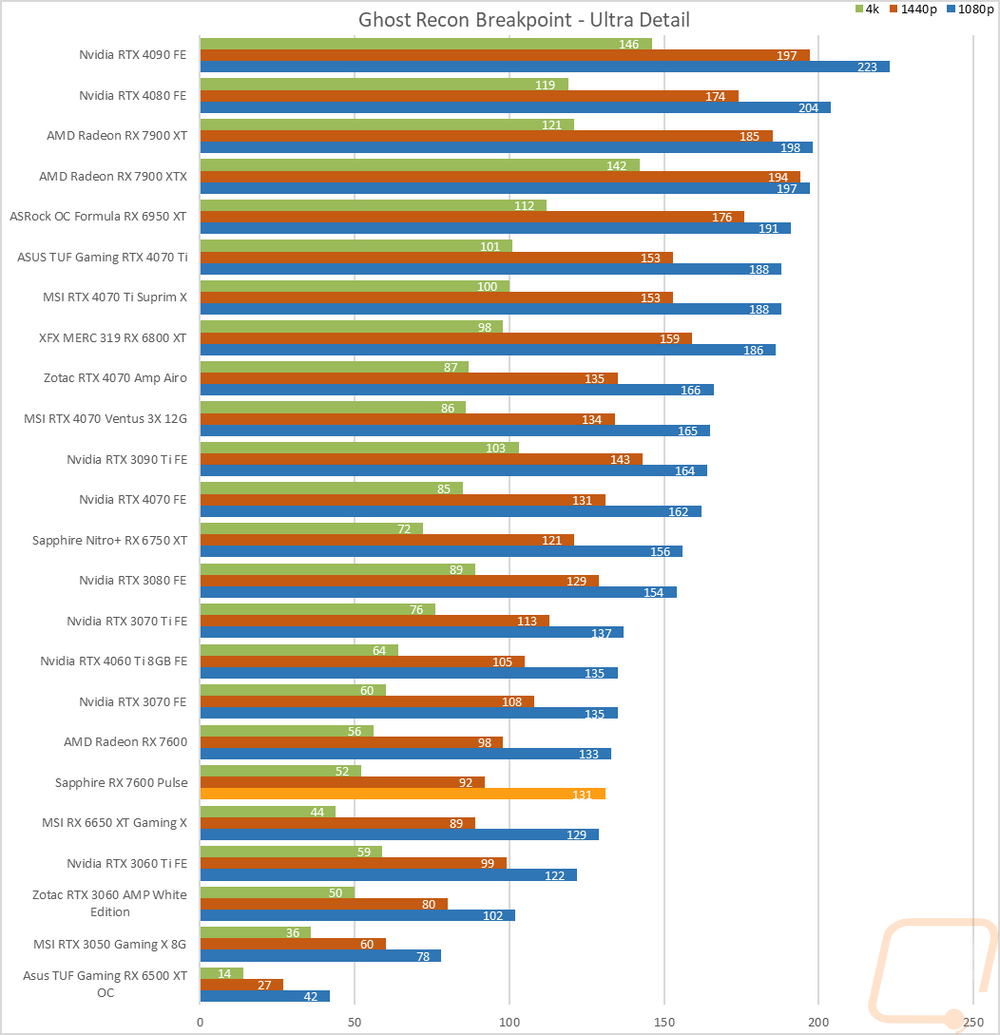
Of course, I have all of the actual in game results as well for anyone who wants to sort through the wall of graphs below. Most of the results just reinforce what we are seeing in the averages above, the Radeon RX 7600 is out in front of the RX 6650 XT but behind the RTX 3060 Ti in most of the results. In a few, you see it does even better like in Ghost Recon Breakpoint where it was up surprisingly close to the new RTX 4060 Ti. But there are also results like Far Cry 6 where the Radeon RX 7600 was behind the 6650 XT.