After checking out an aftermarket RX 480, the reference RX 480, and both together in Crossfire you might think we were done. But Gigabyte was a little late to the party with their sampling and their RX 480 G1 Gaming with 8GB of vRAM came in while I was on vacation. Add in the RX 460 and GTX 1050 launches and I’m just now getting around to take a look at the card. So today I’m going to take a look at the card and see what it is all about. Then I’m going to run it through our test suite including the recently added Deus Ex tests and see how it compares to the rest of the RX 480 options. This also gives me a good chance to revisit the RX 480 and see if its location in the market has changed at all with the price changes. So get into everything and see what Gigabyte has going on.
Product Name: Gigabyte RX 480 G1 Gaming 8GB
Review Sample Provided by: Gigabyte
Written by: Wes
Pictures by: Wes
Amazon link: HERE
| Specifications | |
| Graphics Processing | Radeon RX480 |
| Core Clock | 1290 MHz |
| Process Technology | 14 nm |
| Memory Clock | 8,000 MHz |
| Memory Size | 8 GB |
| Memory Type | GDDR5 |
| Memory Bus | 256 bit |
| Card Bus | PCI-E 3.0 x 16 |
| Output |
Dual-link DVI-D *1 Display Port *3 |
| Digital max resolution | 7680x4320 |
| Multi-view | 5 |
| Card size | H=40 L=232 W=116 mm |
| PCB Form | ATX |
| DirectX | 12 |
| OpenGL | 4.5 |
| Recommended PSU | 500W |
| Power Connectors | 8 pin*1 |
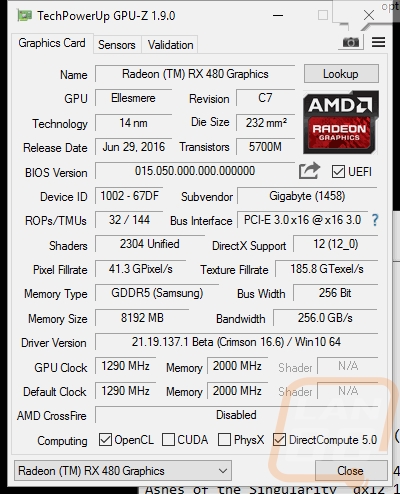
I also make sure to include a copy of the GPUz for each card tested. This way we can confirm the clock speeds are in line with the specifications. In this case, we can see the G1 Gaming is running at the 1290 MHz that Gigabyte has listed on their website without any software required. It also lets you guys/girls know what driver I tested on and the firmware revision as well.
Packaging
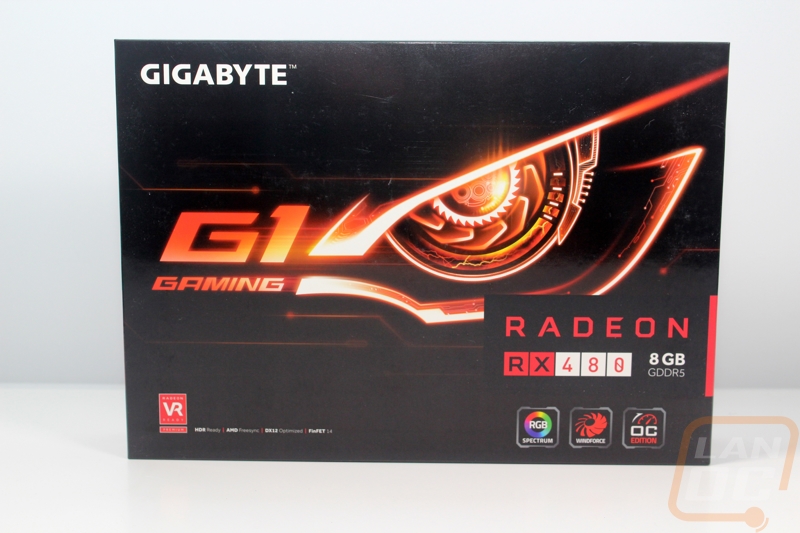
The packaging for the Gigabyte RX 480 G1 Gaming 8GB sticks with the same theme that I have seen on all of the G1 Gaming products. The box has a black background with an orange G1 Gaming logo on the front as well as a big eye. The box has the wrap around Radeon panel with the model name and memory capacity, just like Nvidia has had on cards for a long time. Beyond that, the front of the box has the Gigabyte logo up in the corner, a VR Ready logo in the bottom left corner, and a few card features as badges in the bottom right.
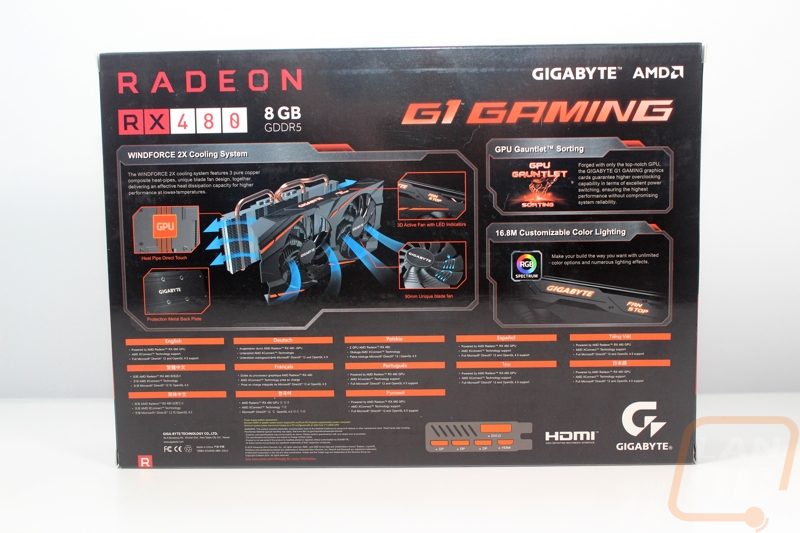
On the back of the box, they continue with the orange theme. The three features highlighted on the front have sections here on the back with photos and short explanations, like the broken down cooler photo showing how the cards Windforce cooling works. This and the RGB photo are the only two photos that show what the card looks like as well. There is a drawing of the PCI slot that helps show the card is a two slot card and the 5 connection options you have available.
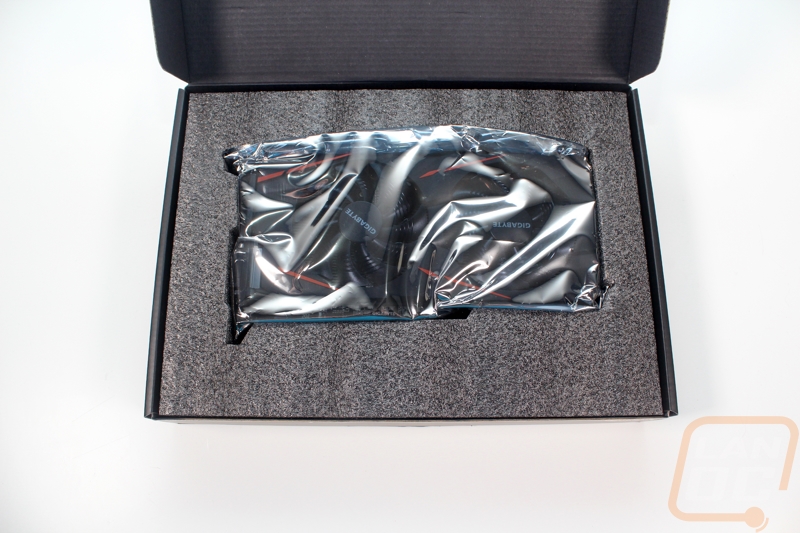
Inside the card comes in another box. Inside that the card is wrapped up in a static protective bag like normal and it sits in a thick foam tray that really protects the card from being banged around in shipping. For documentation, they include a quick guide, but beyond that, there was nothing else in the box. In other words, no power adapter cable or driver disc.
Card Layout and Photos
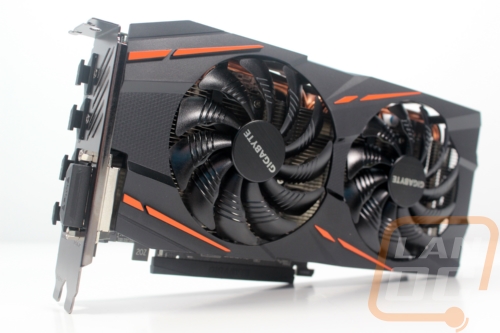
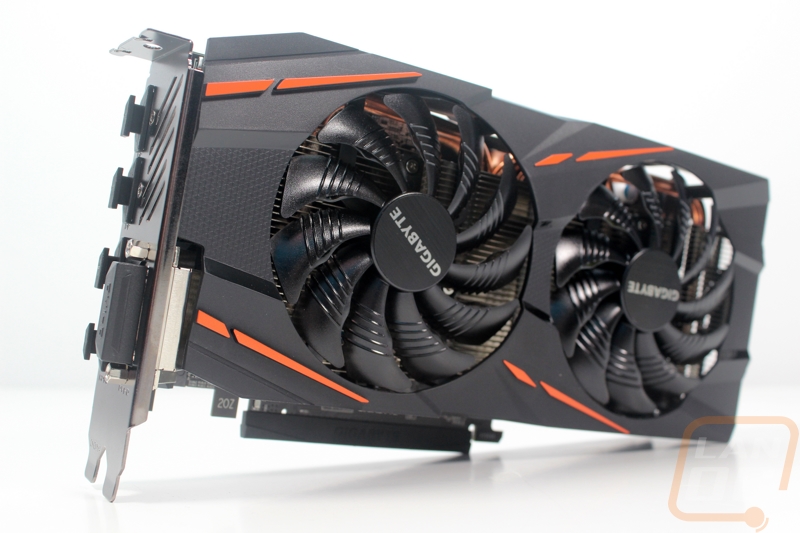
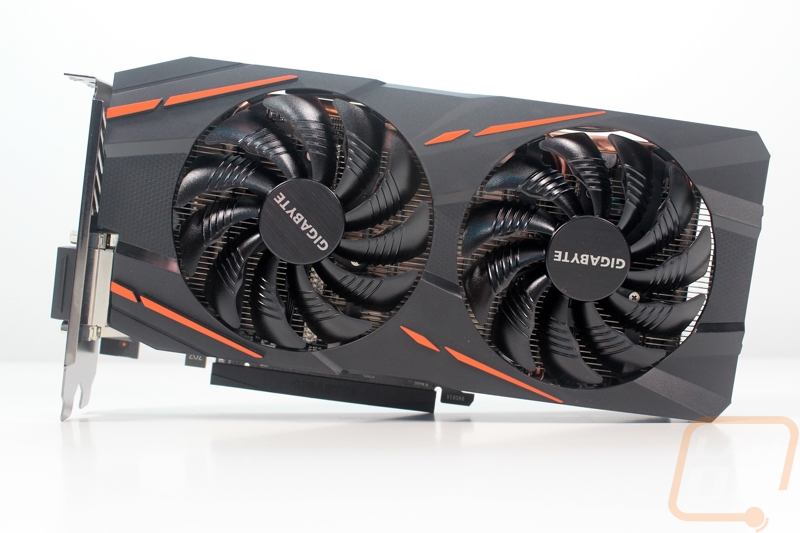
Having tested the RX 460 and the GTX 1070 from the G1 Gaming lineup I had an idea of what to expect with the RX 480 G1 Gaming. I knew it would have a black and orange theme and if you haven’t noticed from the website itself, we like a little orange so I can’t complain about that color choice. The card itself is completely different from the GTX 1070 where it had three cooling fans. It is a lot closer to the RX 460 with two fans, but the RX 480 is a little longer. The fan shroud is plastic and molded with aggressive styling all over the front including the orange dashes to the top left and bottom left of each of the two fans. The card is slightly taller than a standard video card, but it is still significantly shorter than a few of the cards on the market right now. The two fans have 11 blades each and each blade has 5 groves as well. They also both have the Gigabyte logo on the middle sticker.
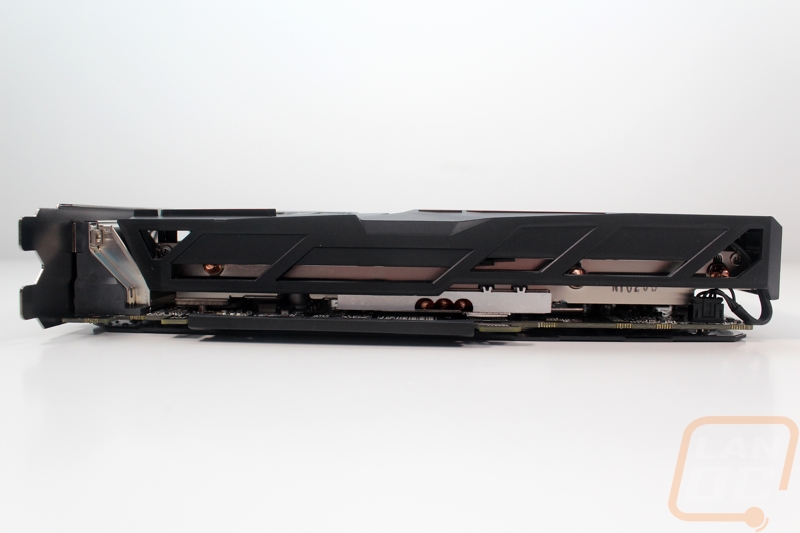
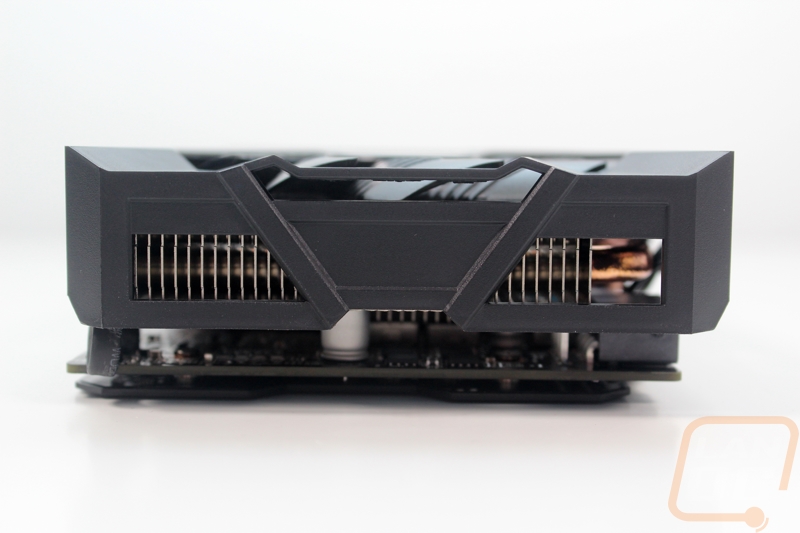
The Windforce cooling on the RX 480 G1 Gaming sticks with the same basic setup that Gigabyte has been using for a while with good results. They have a baseplate that sits directly on the GPU die and inside of that there are three copper heatpipes. The heatpipes pull the heat up and around to the sides of the large heatsink that runs the length of the card. The heatsink itself also sits on top of the baseplate and gets part of its heat from there, the heatpipes mostly just help spread things more evenly. Unlike a lot of manufacturers the three heatpipes all run out the top of the card, most split it up with the bottom to save space. This means most of the top is heatpipes and because they packed them in behind the fan shroud there is a little extra space taken up there, that is where the card gets its extra height. The two fans blow down across the heatsink to cool things down and that air then vents out the top, bottom, and end of the card and into your case. The fan shroud doesn;t go all the way to the PCB to help with this and there are a few openings all around the card as well. The top of the fan shroud does, however, have the Gigabyte logo on it for facing out of your window. That logo and the Fan Stop sign next to it both light up in full RGB colors that you can set in Gigabytes software. The fan stop is a little silly, but they have that to let people know that the fans being off most of the time is normal. The low noise feature freaks most people out and I'm sure it causes a lot of support calls.
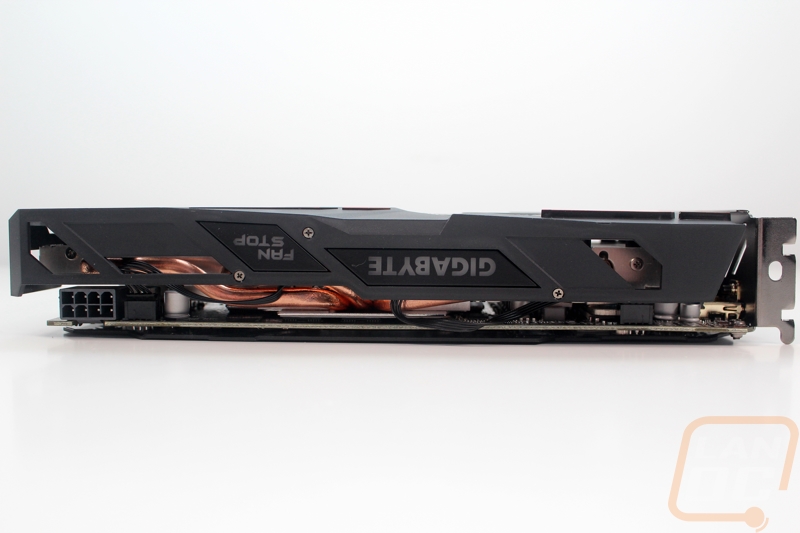
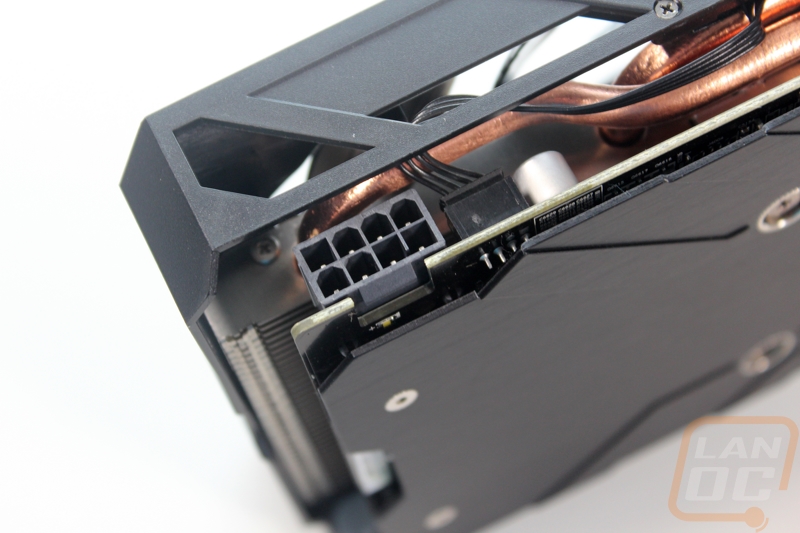
So the reference RX 480 had its 6 pin power connection, but all of the aftermarket cards including the G1 Gaming all scrambled to make sure they had an 8-pin after the power issues found right after the RX 480 launch. Gigabytes connection is flipped around with the clip facing the PCB with a notch in the PCB for clearance. This means they don’t have to make room on the cooler for people to fit a finger in to unplug the power cable later on. Gigabyte used this space to fit one of the heatpipes close to the connection and the fan shroud is also right up next to it.
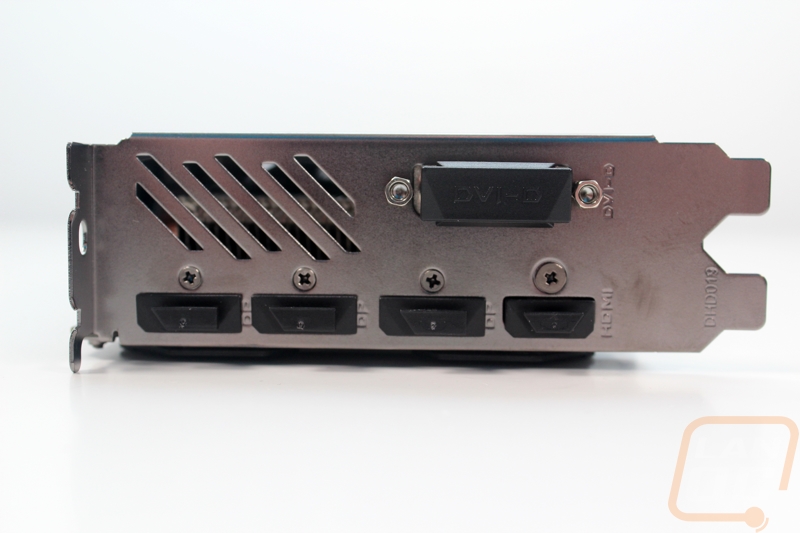
The rear facing PCI slot cover is almost completely covered in display connections. In fact, where most RX 480’s have gone with one slot for ventilation Gigabyte only went with half a slot and even that vent is hardly a vent if you ask me, the slots aren’t very open. You do get a DVI connection, though, something not every RX 480 comes with. The DVI doesn’t cut into the three DisplayPort connections or the HDMI connection.
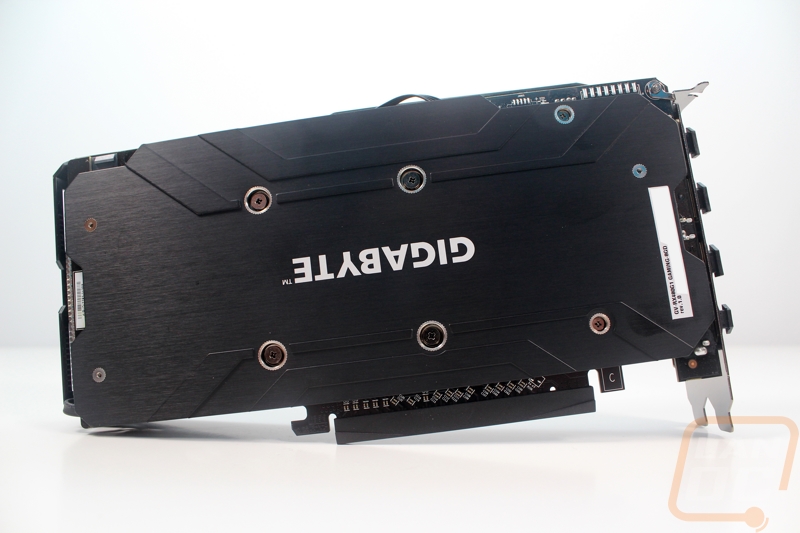
While the RX 480 G1 Gaming does have a black PCB, Gigabyte stepped things up with a full cover backplate. The backplate has a few raised features to add some style and it also has the Gigabyte logo in the middle. The logo faces out when you have the card installed in a standard PC case, that’s why it is upside down from this angle. There is a sticker on the back with the model name, revision number, and your serial number for RMA use should you need it.
Our Test Rig and Procedures
| Our Test Rig | ||
| CPU | Intel i7-5960X | Live Pricing |
| Memory | Kingston HyperX FURY Black 32GB Quad Channel Kit 2666 MHz | Live Pricing |
| Motherboard | Gigabyte X99-SOC Champion | Live Pricing |
| Cooling | Noctua NH-U12S Cooler | Live Pricing |
| Power Supply | Cooler Master V1000 Power Supply | Live Pricing |
| Storage | Kingston Hyper X Savage 960GB SSD | Live Pricing |
| Case | Dimastech Test Bench | Live Pricing |
| Our Testing Procedures | |
| 3DMark | The same goes for the most current version of 3DMark using the Fire Strike benchmark in normal, extreme, and ultra settings |
| Unigine Valley Benchmark 1.0 | Using the Extreme HD preset to get an average FPS |
| Catzilla 4k | Default tests for 1080p, 1440p, and 4k resolutions using the overall score for each as our result |
| SteamVR | Default SteamVR test using Average Quality score |
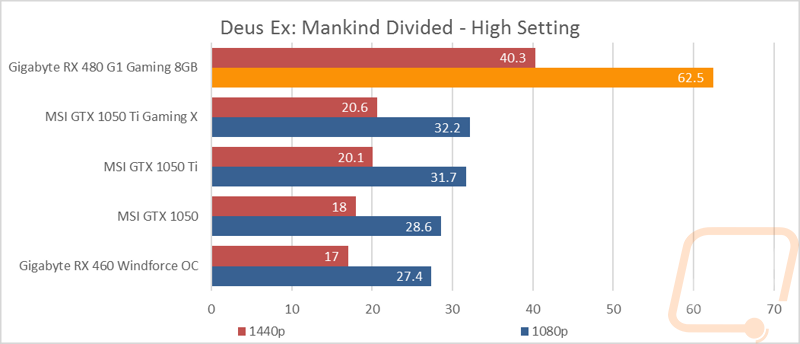
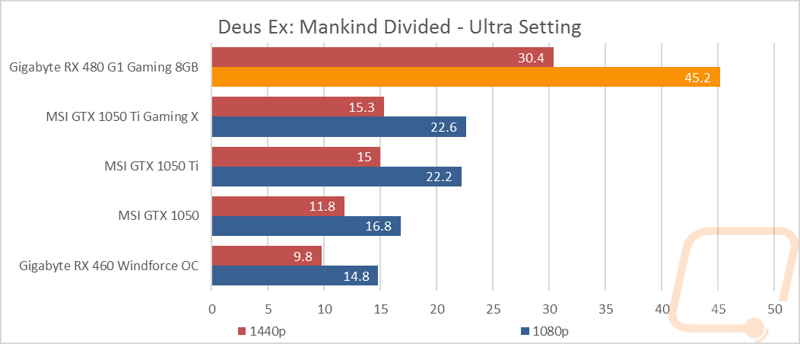
| Deus Ex: Mankind Divided | Tests are done using the built-in benchmark at High and Ultra graphic settings at both 1080p and 1440p resolutions. |
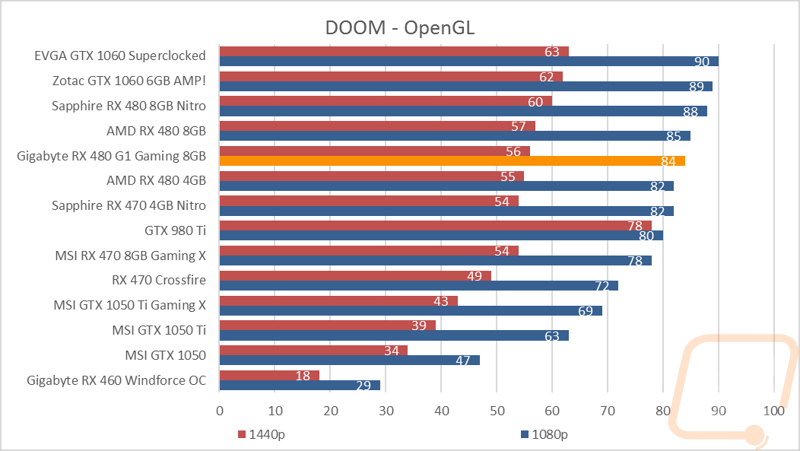
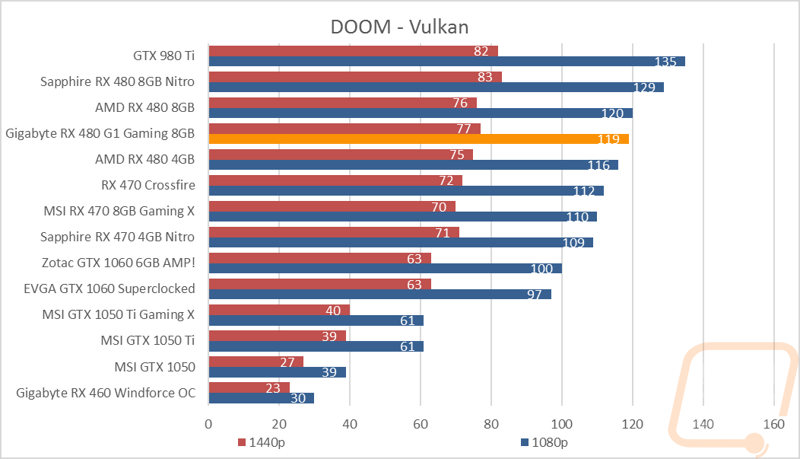
| DOOM | Doom is tested on the Ultra quality setting. Tests are run at 1080p and 1440p using both OpenGL and Vulkan. The benchmark is a basic one using just the average FPS in the opening scene. |
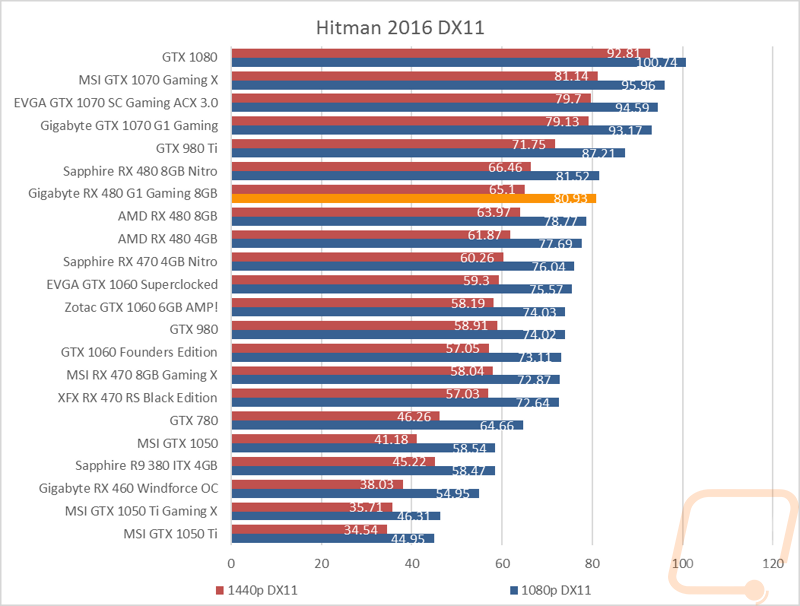
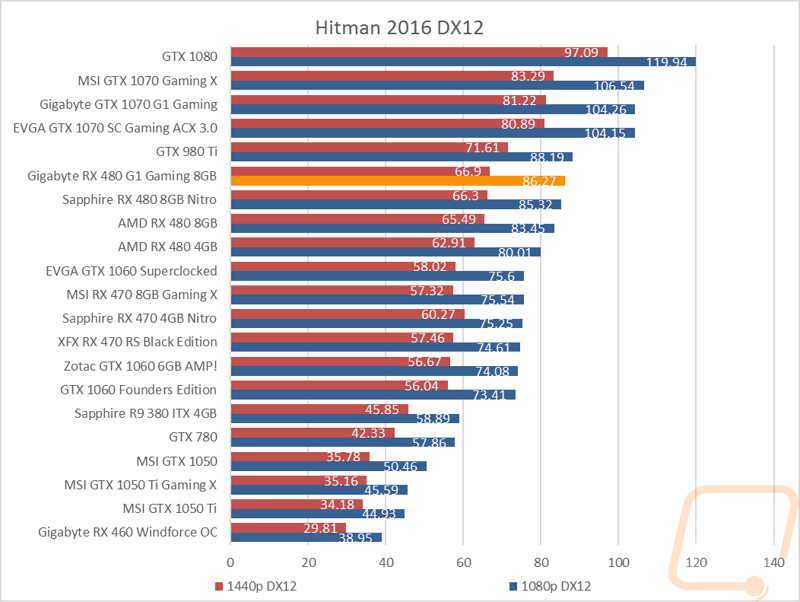
| HITMAN 2016 | Fullscreen with V-Sync turned off Detail, Texture Quality, Shadow Maps, and Shadow Resolution all set to their highest settings. We test using both DX11 and DX12 at both 1080p and 1440p resolutions. |
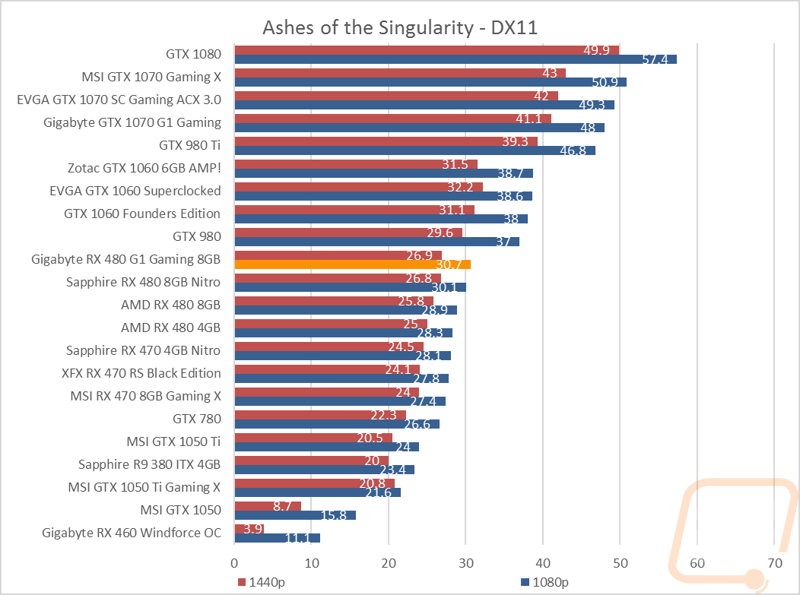
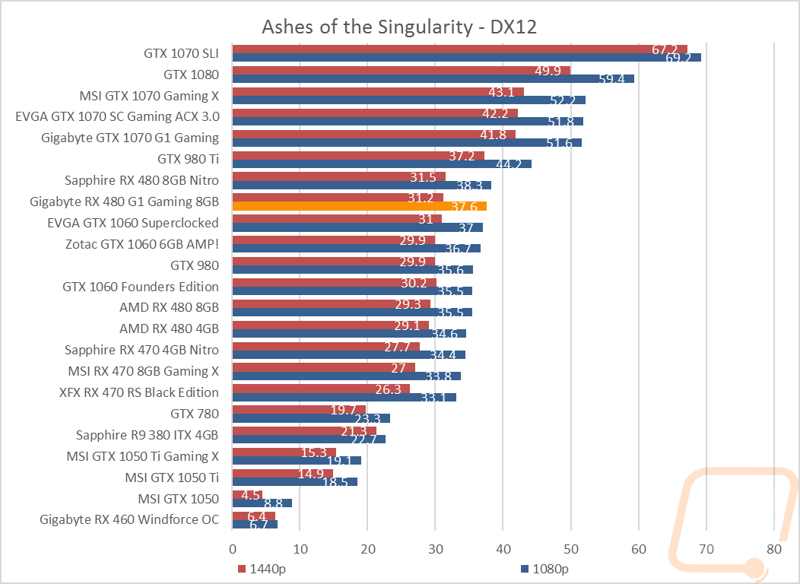
| Ashes of the Singularity | Built-in benchmark ran at 1080p and 1440p with graphics settings set to the “Crazy” setting with the exception of turning off V-Sync Mode. The benchmark scenario is set to GPU Focused and we use the Average Framerate for All Batches as the result. Tests are run both in DX11 and DX12 |
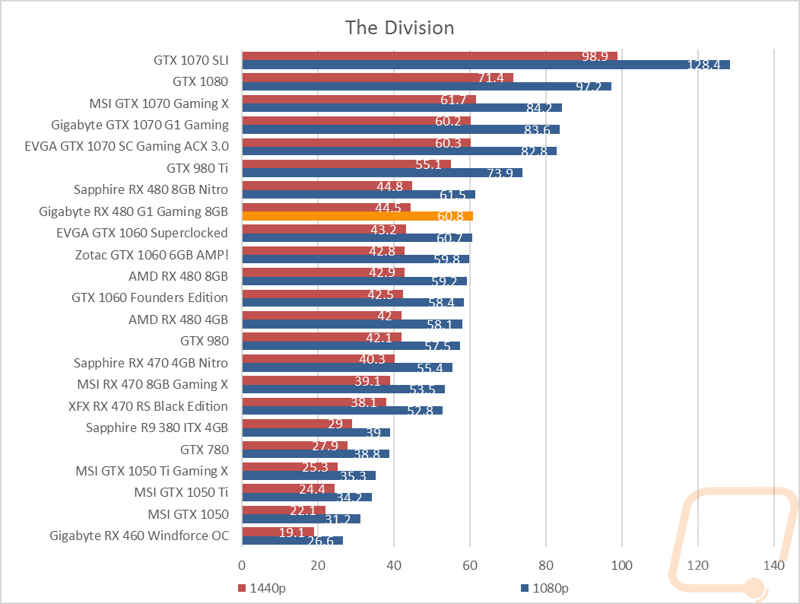
| The Division | Built-in benchmark ran at 1080p and 1440p with graphics settings set to the default “Ultra” setting with the exception of turning off V-Sync Mode |
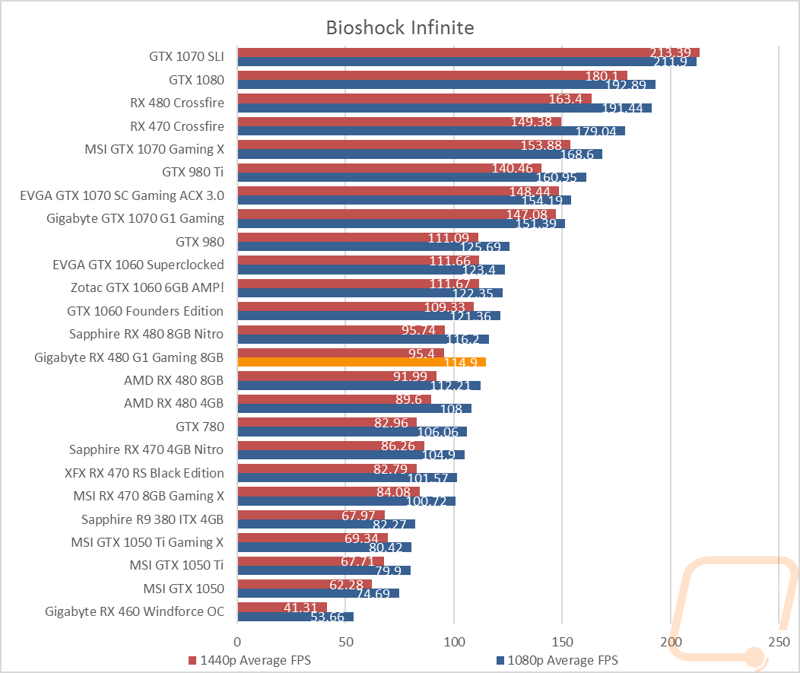
| Bioshock Infinite | Using the Adrenaline Action Benchmark Tool we run Bioshock Infinite on the “Xtreme” quality setting. This has a resolution of 1920x1080, FXAA turned on, Ultra Texture detail, 16x Aniso Texture Filtering, Ultra Dynamic Shadows, Normal Postprocessing, Light Shafts on, Ambient Occlusion set to ultra, and the Level of Detail set to Ultra as well. We also run this same test at 2560x1440 using the same settings as mentioned above. |
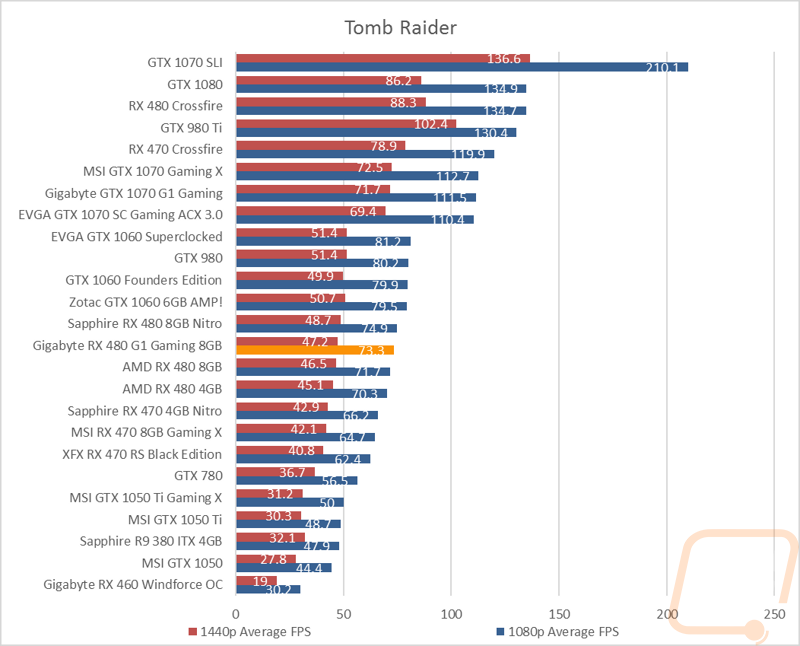
| Tomb Raider | Using the Adrenaline Action Benchmark Tool we run Tomb Raider on the “Xtreme” quality setting. This has a resolution of 1920x1080, Exclusive Fullscreen turned on, Anti-Aliasing set to 2xSSAA, Texture Quality set to Ultra, Texture Aniso set to 16x Aniso, Hair Quality set to TressFX, Shadow set to Normal, Shadow Resolution on High, Ultra SSAO, Ultra Depth of Field, High Reflection quality, Ultra LOD scale, Post-Processing On, High Precision RT turned on, and Tessellation is also turned on. We also run this same test at 2560x1440 using the same settings as mentioned above. |
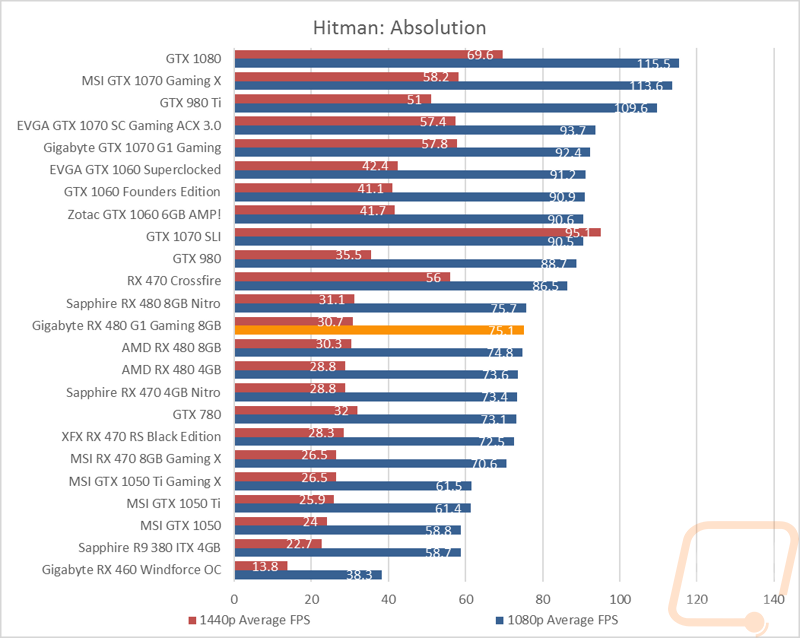
| Hitman: Absolution | Using the Adrenaline Action Benchmark Tool we run Hitman: Absolution on the “Xtreme” quality setting other than the MSAA setting is turned down from 8x to 2x. That setting puts the resolution at 1920x1080, MSAA is set to 2x, Texture Quality is set to High, Texture Aniso is set to 16x, Shadows are on Ultra, SSA is set to high, Global Illumination is turned on, Reflections are set to High, FXAA is on, Level of Detail is set to Ultra, Depth of Field is high, Tessellation is turned on, and Bloom is set to normal. We also run this same test at 2560x1440 using the same settings as mentioned above, except on the “high” setting. |
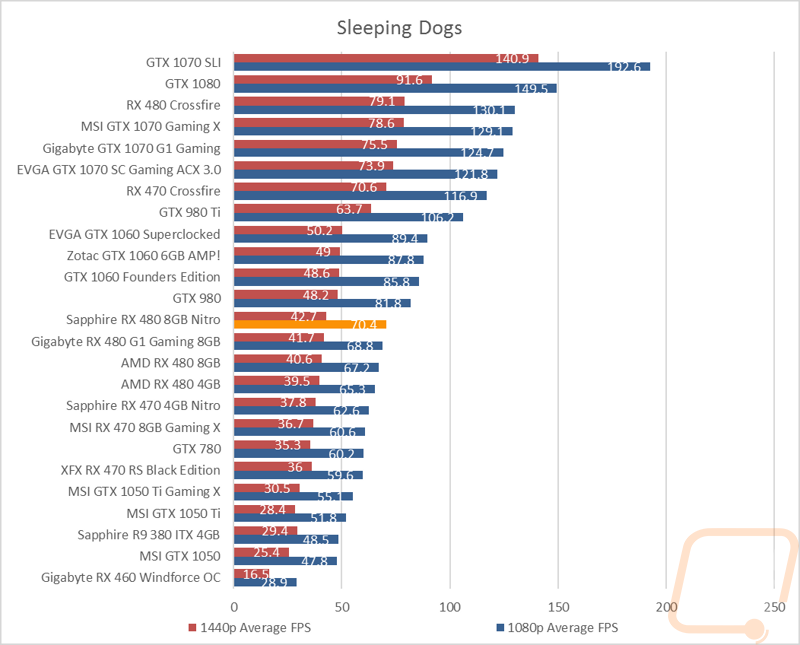
| Sleeping Dogs | Using the Adrenaline Action Benchmark Tool we run Sleeping Dogs on the “Xtreme” quality setting. That means our resolution is set to 1920x1080, Anti-Aliasing is set to Extreme, Texture Quality is set to High-Res, Shadow Quality is High, Shadow Filter is set to high, SSAO is set to High, Motion Blur Level is set to High, and World Density is set to Extreme. We also run this same test at 2560x1440 using the same settings as mentioned above. |
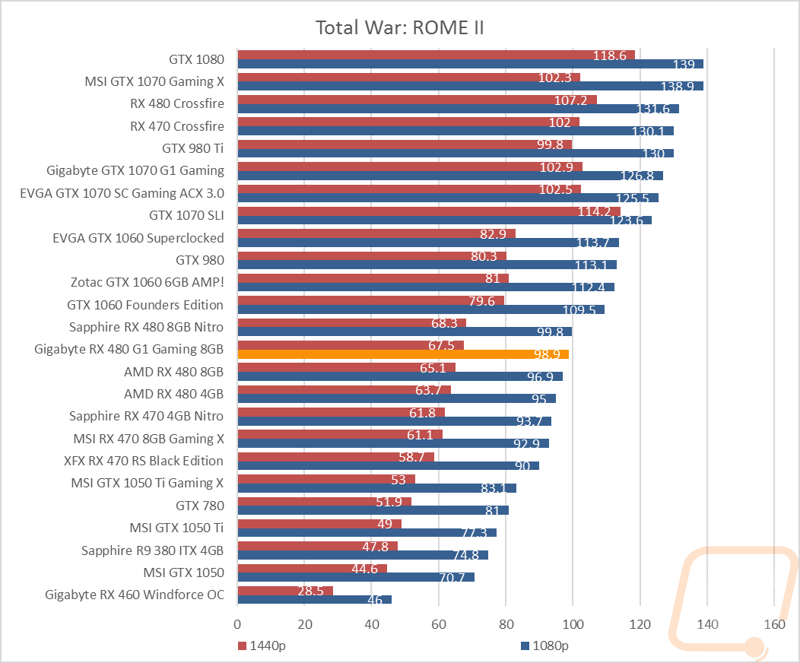
| Total War: ROME II | Ultra-setting tested at 1920x1080 and 2560x1440, built in forest benchmark |
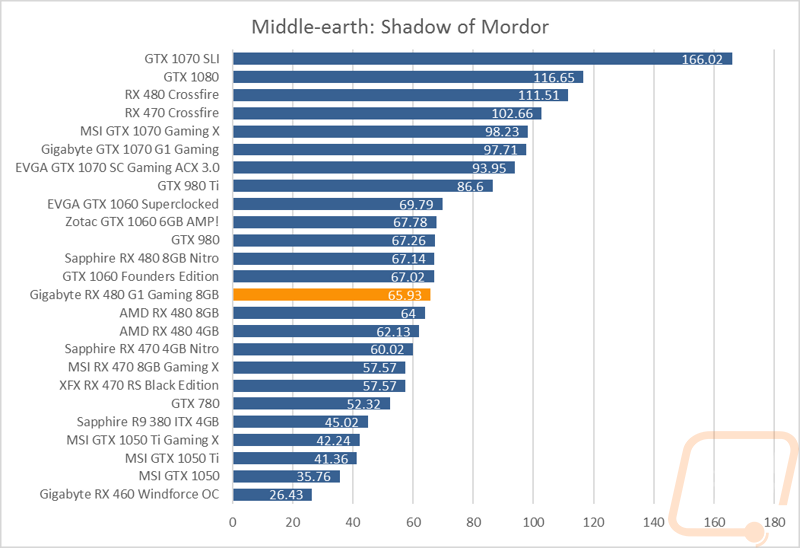
| Middle-earth: Shadow of Mordor | Using the built-in benchmark we test with ultra settings at 1440p |
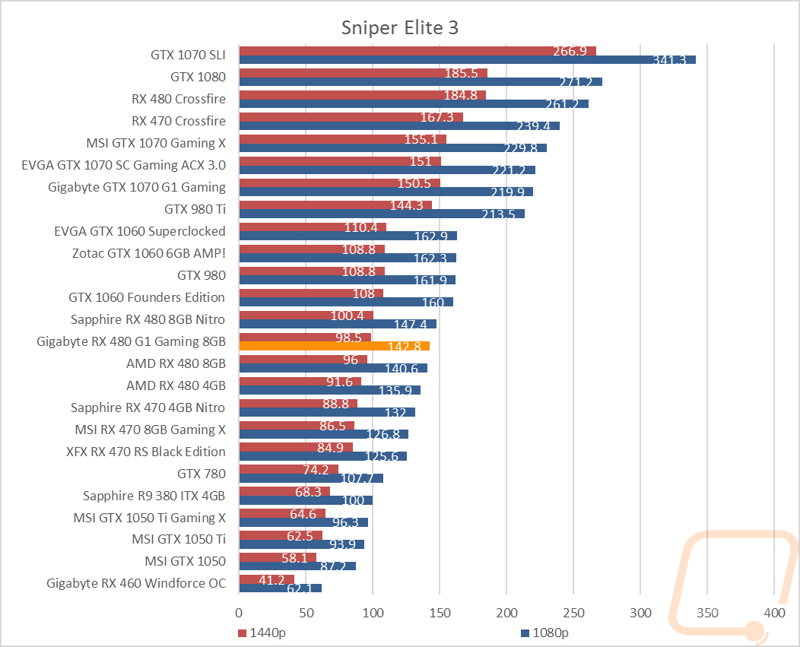
| Sniper Elite 3 | Ultra-setting tested at 1920x1080 and 2560x1440, built in benchmark |
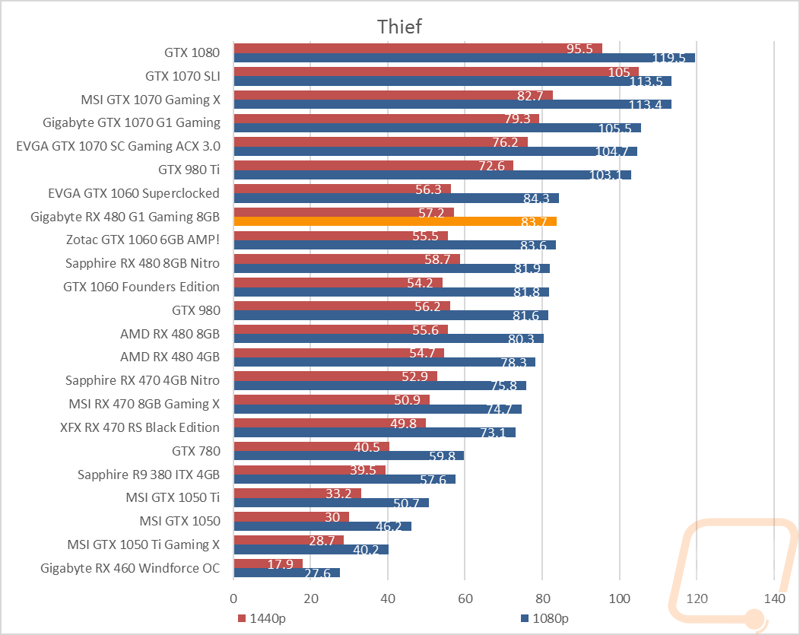
| Thief | Tested using the “Very High” setting at 1920x1080 and 2560x1440 |
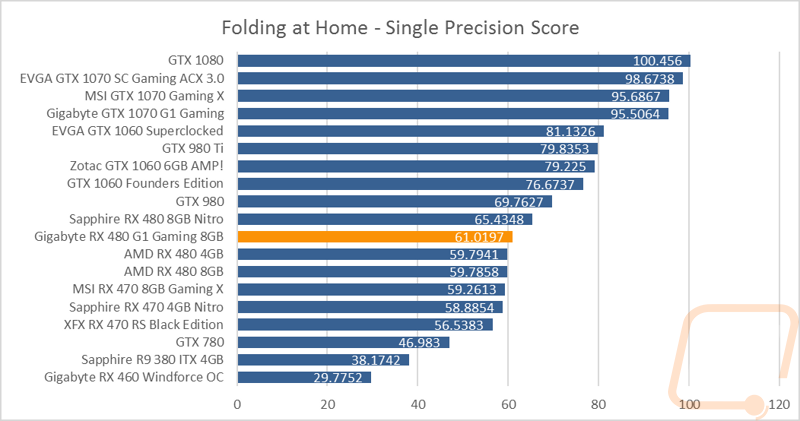
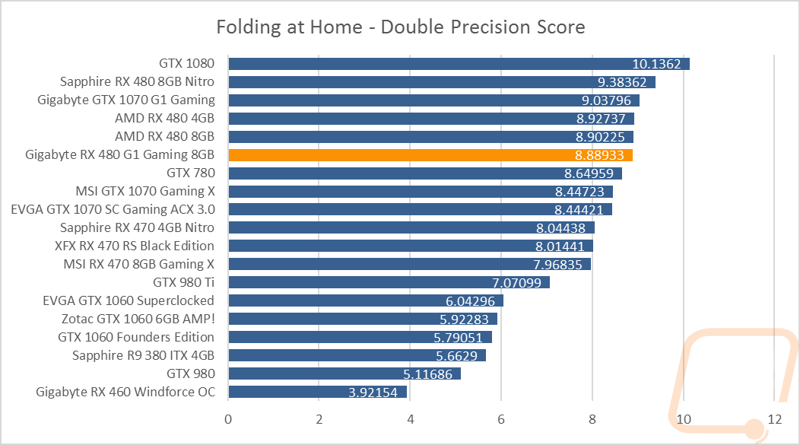
| Folding at Home 2.2 | Using the Folding at Home benchmark 2.2.5 set to OpenCL, WU set to dhfr, and run length set to the default 60 seconds. We test at both double and single precision and use the score at the result |
| CompuBenchCL | Video Composition and Bitcoin tests |
| Unigine Valley Benchmark 1.0 heat testing | We run through Unigine Valley using the “Extreme” preset for 30 minutes to test in game cooling performance with the fan speed set to auto then again with the fan set to 100%. |
| Power Usage | Using Unreal Valley Benchmark 1.0, we get our “load” power usage number from the peak power usage during our test. We get our numbers from a Kill-A-Watt connected to the test benches power cord. |
| Noise Testing | Our Noise testing is done using a decibel meter 3 inches away from the video card on the bottom/fan side of the card. We test an idle noise level and then to get an idea of how loud the card will get if it warms all the way up we also turn the fan speed up to 50% and 100% and test both speeds as well. The 100% test isn’t a representation of typical in-game noise levels, but it will show you how loud a card can be if you run it at its highest setting or if it gets very hot. |
Synthetic Benchmarks
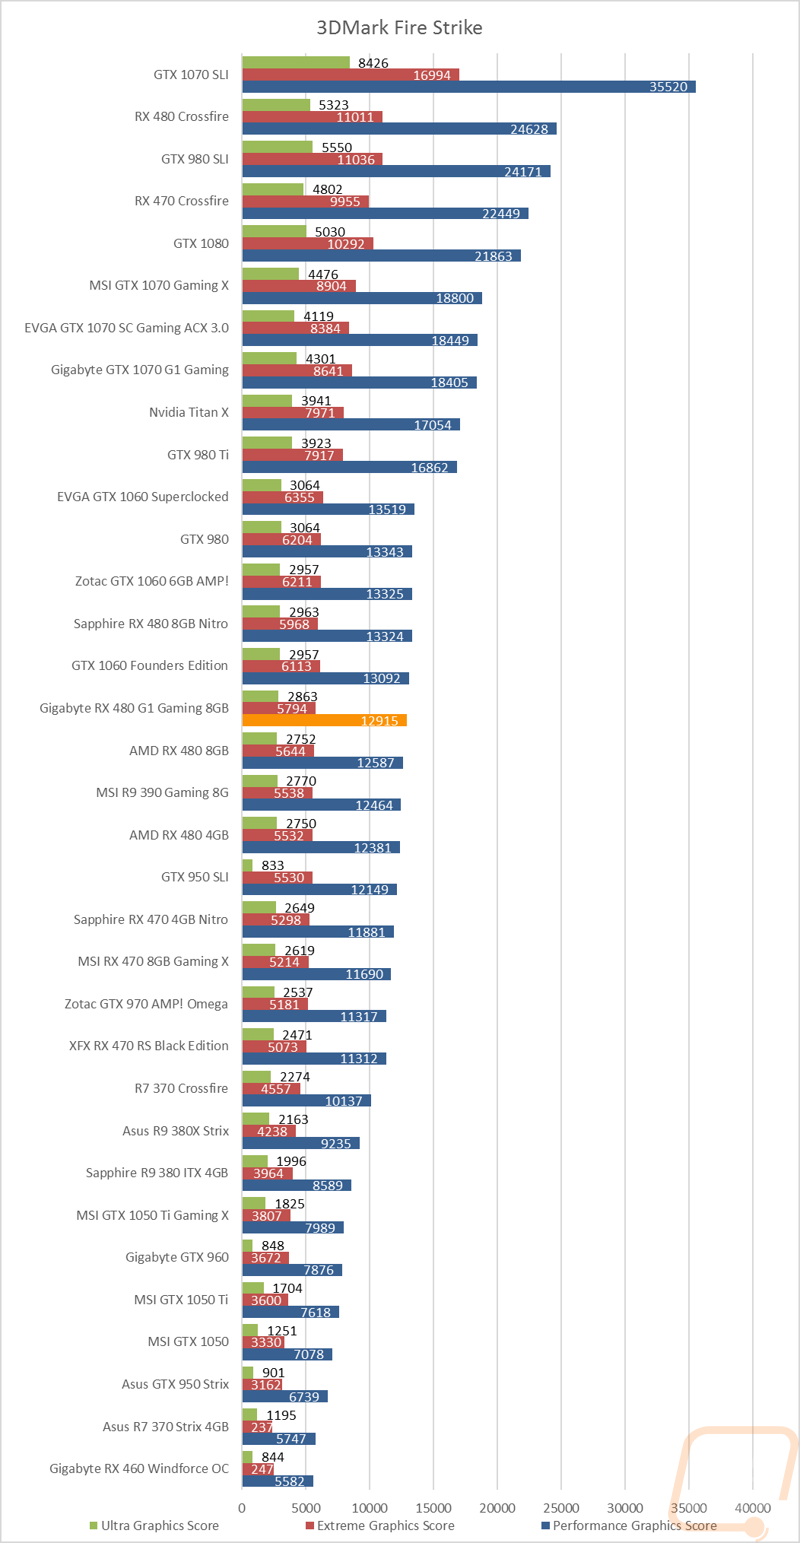
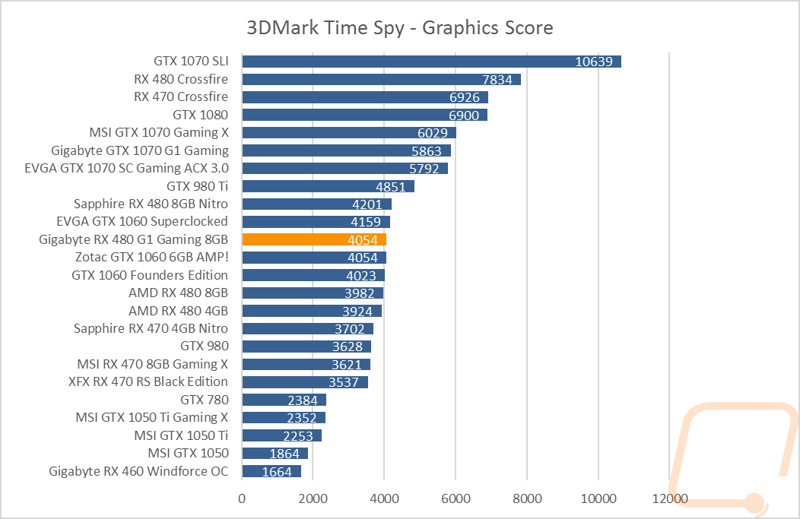
To start off my testing I ran the Gigabyte RX 480 G1 Gaming through our synthetic benchmark test suite. These benchmarks are typically very consistent and help us compare performance between cards with the same GPU. In this case, I’m especially curious how the G1 Gaming compares to the reference RX 480 and the Sapphire RX 480. My first test was Futuremark's 3DMark using their Fire Strike benchmark and the new DX12 focused Time Spy benchmark. With Fire Strike, I tested using the performance setting for 1080p testing, the extreme setting for 1440p testing, and ultra for 4k. The G1 Gaming performed well, outperforming the reference card and coming in almost dead even with the GTX 1060 reference card but the 1290 MHz clock speed wasn’t enough for the Sapphire cards 1342 MHz overclock. The Time spy result was nearly the same as well only with the RX 480’s being a little faster than the GTX 1060’s in this test.
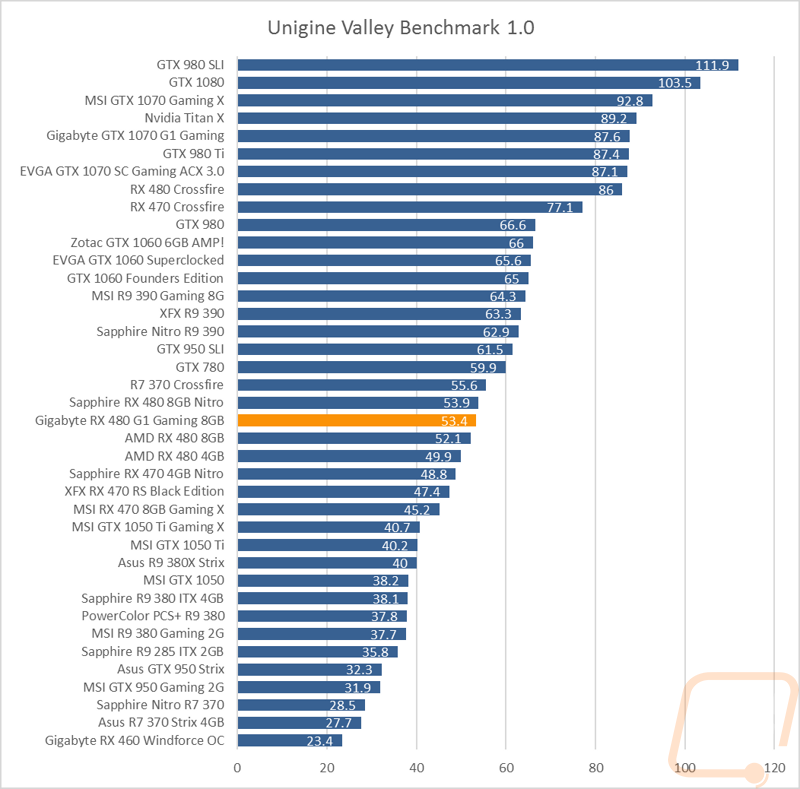
My next test was Unigine’s Valley Benchmark, this benchmark is as close as our synthetic tests get to being a real game as this test is based on a common game engine. Here the G1 Gaming edged out an extra 1.3 FPS over the reference card but the Sapphire still had a little more on it with its extra half an FPS.
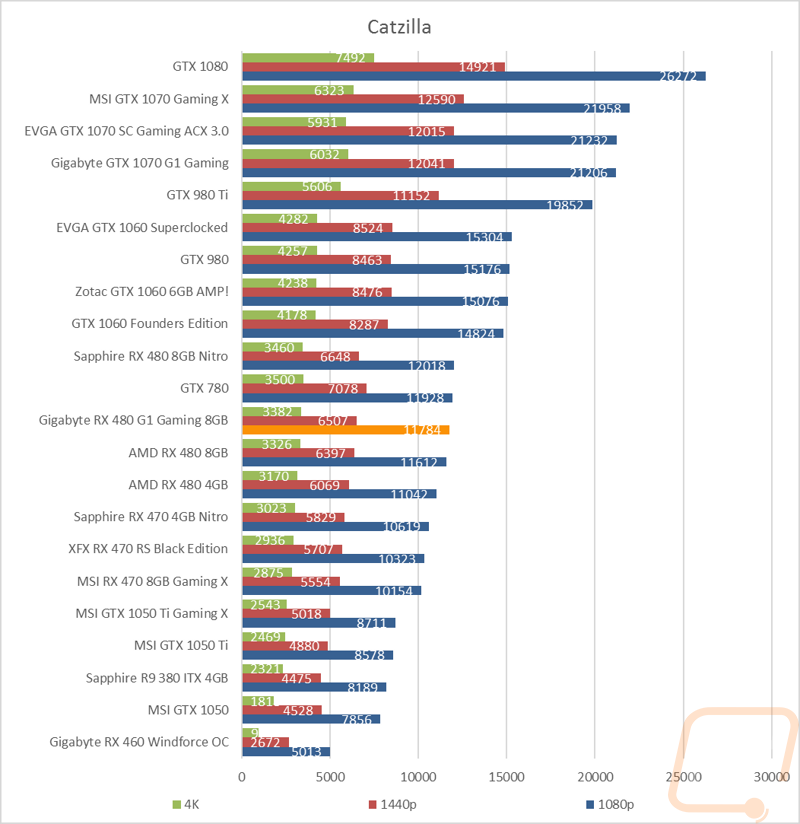
In Catzilla I once again test across the entire range of resolutions but the results are still the same. In all three tests the Sapphire 480 is faster but the G1 Gaming is still a nice performance jump over the reference RX 480’s.
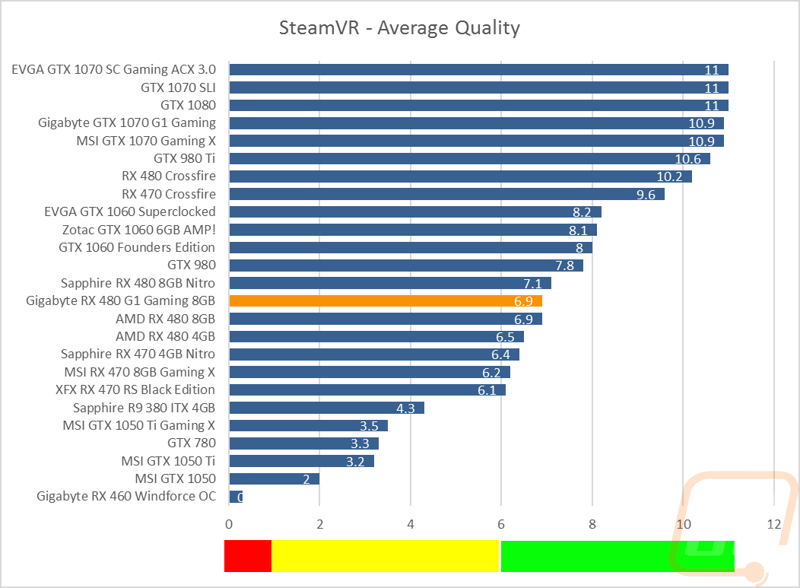
For the last test I used Valves SteamVR benchmark to take a look at virtual reality performance. This test is especially important for the RX 480’s because AMD has promoted the RX 480 as their premium VR experience card. In this test, the G1 Gaming and the reference card have the same 6.9 result. A result that puts the RX 480 in the green “great performance” range.
In-Game Benchmarks
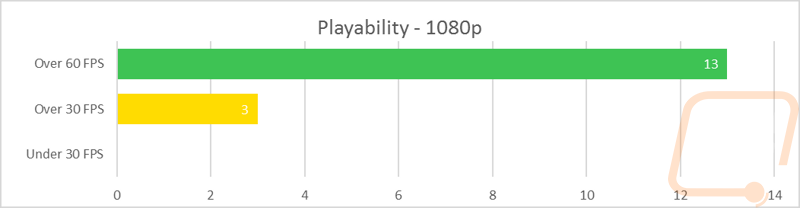
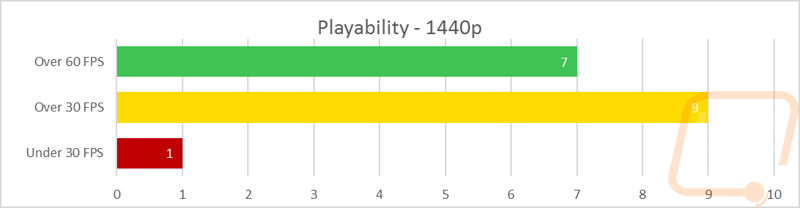
Now that we have an idea of how the cards stand compared to each other, it’s finally time to get down to the in-game performance numbers. To do that I ran through our entire in-game benchmark test suite. The suite has 13 different games tested at both 1080p and 1440p at their highest settings. Four of the games are also tested in more than one configuration to see the difference between DX11 and DX12 performance or in the case of the most recent addition, DOOM I test out both OpenGL and Vulkan performance. The problem is, with so many results it can be a little too much to take in. To help with that I have condensed our results into two graphs, one for 1080p and the other for 1440p. All of our games are run at their max settings and we use the average FPS as the end result. The graphs below are broken down into three FPS ranges to represent unplayable (below 30), playable but not ideal (30 to 60), and ideal (over 60 FPS). So what did I find from those results?
Well at 1080p the RX 480 G1 Gaming doesn’t have even one game that comes up unplayable at our extremely high test settings. 13 of the results are over and in most cases WELL over 60 FPS with just a few falling in the 30-60 range. It's impossible to compare our past results to this completely because we have added a few results. But the Sapphire RX 480 had a similar result with 12 and 2. The 1440p results were promising as well. All but one result was playable and 7 of the playable results were in the 60+ range. This was a little less than the Sapphire, but it was a little faster than most RX 480’s due to its high power draw to better avoid slowdowns.
Of course, as always, I also have all of the individual results for everyone to check out as well. When digging through all of the results I was looking for a few different things. For one, I was curious how the G1 Gaming compared to the other RX 480’s and the GTX 1060’s. In most of the tests, the results were similar to what the synthetic benchmarks showed us. The G1 Gaming outperforms the reference design due to its overclock, but the Sapphire 480 still tops the charts for RX 480’s because of its higher clock speed. My Doom results were a little suspect, though, with the G1 Gaming being a touch lower than the reference card on those results. Doom, however, is a little more inconsistent than I would prefer and I suspect that is why I saw this. That said switching to Vulkan mode still gave us the same crazy improvement that I’ve seen with almost all AMD cards showing just how much potential the cards can have with future Vulkan and DX12 titles. The rest of the results show that even with an overclock the GTX 1060’s are faster in the DX11 titles. So it's really a split depending on if you plan on playing more of the current titles and how quickly new DX12 titles will be coming out.
Compute Benchmarks
As always I also ran the RX 480 G1 Gaming through our Compute benchmarks while I was doing my testing. This testing includes single and double precision tests in Folding at Home and a few tests in CompubenchCL. My first tests were Folding at Home and not to sound like a broken record but the results were once again similar to previous tests. The single precision result had the G1 Gaming slightly ahead of the reference 480 and the Sapphire father ahead. The GTX 1060 was ahead of all three. The double precision test, however, shows Nvidia's lack of fp64 cores and all of the AMD cards jump ahead of everything except the GTX 1080 and the overclocked GTX 1070.
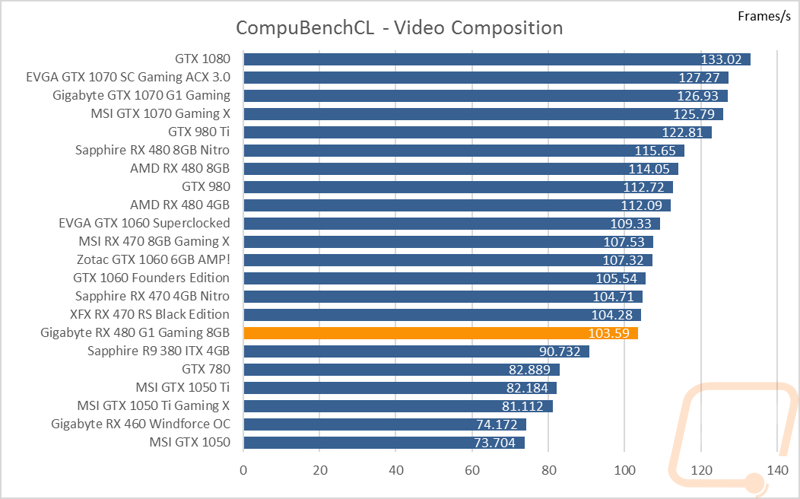
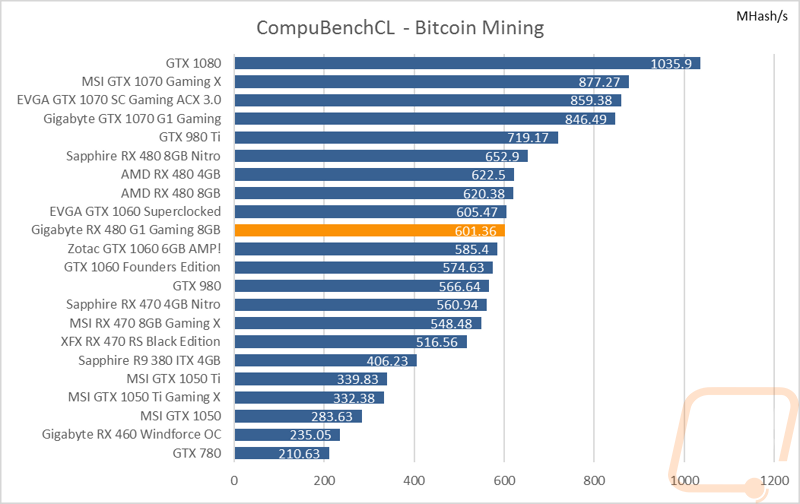
My second set of tests were in CompubenchCL. Here I focused on the video composition and bitcoin results as they are both likely uses for GPUs outside of gaming. In the Video Composition results the G1 Gaming floundered a little, having a result that was quick but noticeably lower than our other RX 480 results. The same can be said for the Bitcoin Mining results. I suspect this was related to the newer driver I used when testing this card, the results were consistent even when testing additional times.
Cooling, Noise, and Power
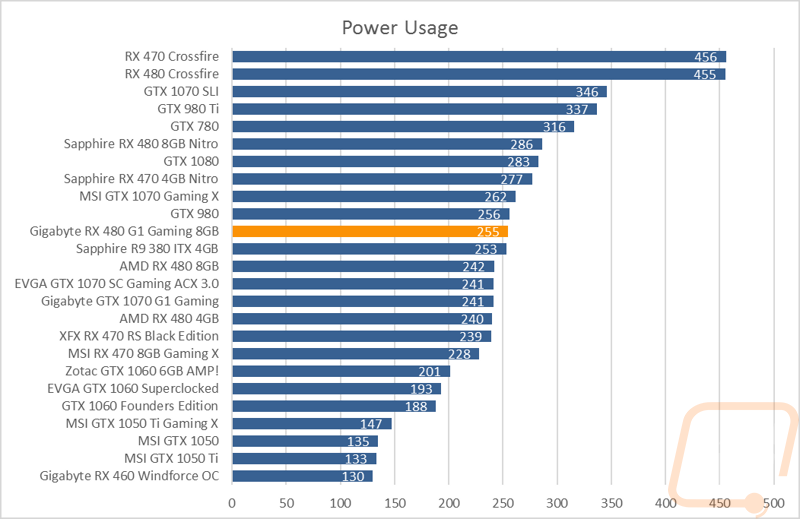
My last batch of testing focuses on a few of the performance aspects that people forget about when looking for a video card. While I game performance is important, you also need to keep in mind the cooling systems noise and heat performance as well as overall power draw. They are also aspects that are all specific to each manufacturer, so they are a great way to compare similar cards. To start things off I tested the power draw of our test bench with the 480 G1 Gaming installed while looping Valley Benchmark. This gives us a look at peak in game draw of the overall system, not just the card, to help find a good power supply. In this case, the G1 Gaming pulled 255 watts, 13 watts higher than the reference card but still significantly lower than the Sapphire RX 480 or the Sapphire RX 470 for that matter.
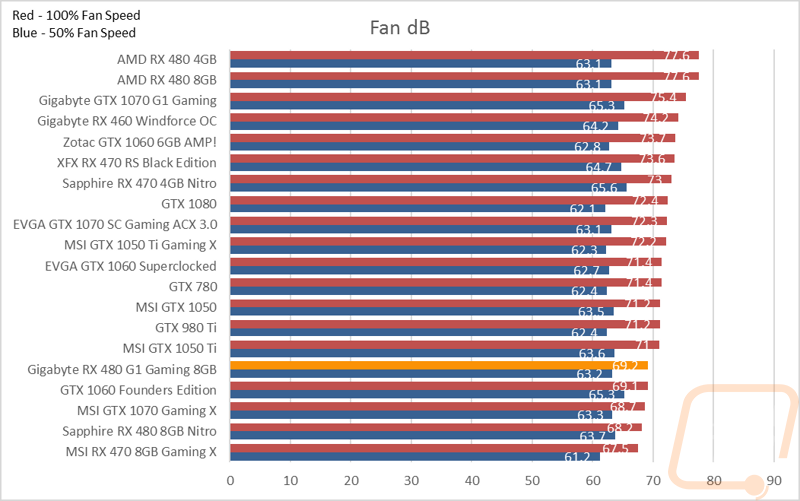
Next, I tested the overall noise output of the card using a decibel meter. Our office has a high ambient noise level so when doing this the test is done with the card on an open test bench and the results are from a short distance away from the fan side of the card, so keep in mind these aren’t numbers you would expect to hear with the card in a case and away from you. They do however let me get results that can be consistently compared against each other to see how much noise the fans make at 50% and 100% fan speeds. Surprisingly the G1 Gaming did very well here with both of the fan speeds giving results lower than most of the cards tested in the office this year.
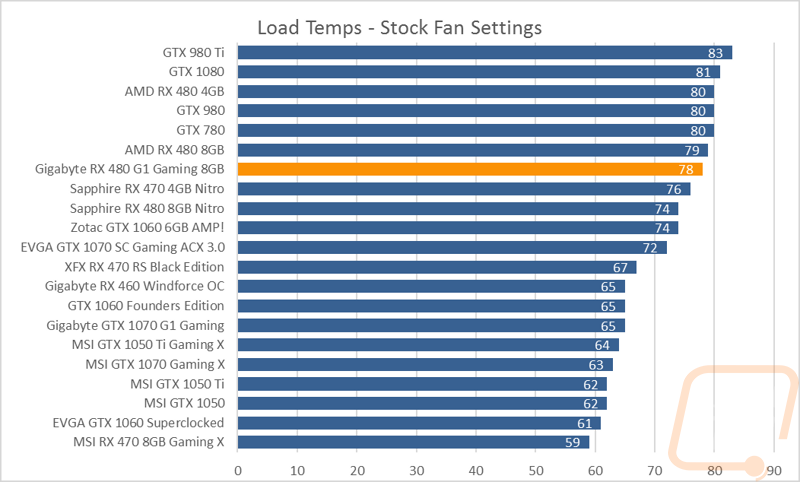
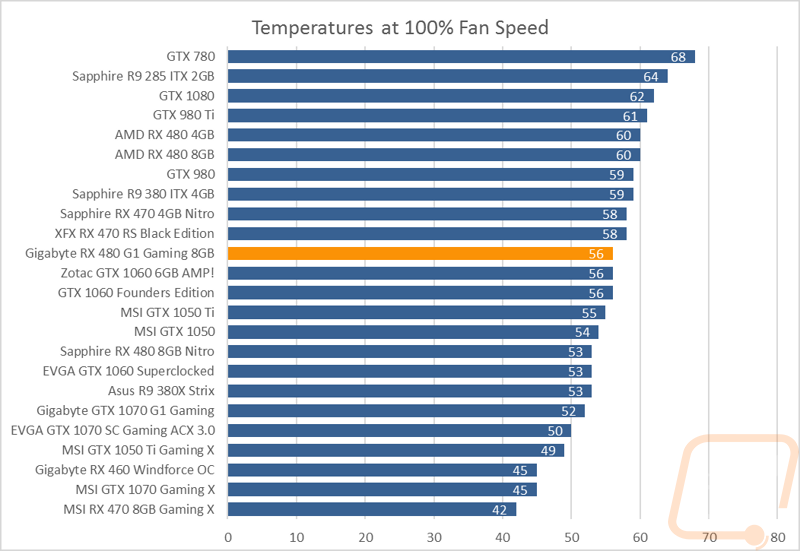
The last test is my favorite and typically is the most informative. I test the cooling performance by looping Valley Benchmark looking for the highest temperature reached. I do this once with the stock fan settings and again with the fans cranked up to 100% fan speed. The reason for the two results is because one shows us what you can expect out of the box with the manufactures fan speed profiles and the 100% fan speed result lets us see how good the cooler can perform if needed. In this case, with the stock profiles, the G1 Gaming hardly performed any better than the reference RX 480, even letting the Sapphire card with its higher overclock and high power draw run a little cooler. With the fans cranked up though the results were a lot better. It looks like Gigabyte could use a little work on the fan profile, especially considering how quiet the cards fans ran in our tests, turning them up a little wouldn’t hurt.
Overall and Final Verdict
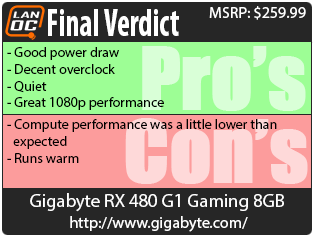
Today I set out to take a closer look at Gigabytes G1 Gaming RX 480 8GB and to find out how it compares to the other RX 480 options on the market. While doing that I was also curious to see if driver changes, as well as price, had changed AMDs RX 480 location in the market. For starters, the G1 Gaming is very similar to the rest of Gigabytes Windforce cards with the exception of a higher overclock. Its overclock ended up being relatively good though it was hard to ignore that the Sapphire card I tested a while back did have a higher overclock and this showed in the performance results. The G1 Gaming performed great, especially when testing at 1080p and other than a few exceptions that I think are driver related, it outperformed the reference cooler RX 480. Unlike the Sapphire, Gigabyte didn’t run an extreme power profile to get their overclock so when doing power testing the G1 Gaming performed well. The two fan design ran quieter than any of the other RX 480 options. The card could use a little work on its fan profiles however, the cooler was more than capable of cooling the card but the fan profile ended up hardly running cooler than a reference card.
In the end, the G1 Gaming seems to be a good option but it left me wondering if I wouldn’t be better off getting the Gigabyte Windforce card for $10 less and just overclocking it myself. Even the price of the G1 Gaming, however, wasn’t bad compared to the rest of the market. There are a few cards (like the Windforce) selling for a little less with lower overclocks, but it was still cheaper than the Sapphire. It is a better choice than going with a card with the reference cooler, that’s for sure. I do still think the Sapphire 480 is the best card on the market, but the G1 Gaming seems to be a happy medium for people who don’t want to trade another 30+ watts for 50 MHz.

Live Pricing: HERE


