Synthetic Benchmarks
As always I like to start my testing with a few synthetic benchmarks. 3DMark especially is one of my favorites because it is very optimized in both Nvidia and AMD drivers. It's nice to not have to worry about it being favored too much either way and the repeatability of the results makes it a nice chance to compare from card to card, especially when comparing with the same GPU. In this case, this is our first 4070 Ti, so my focus is mostly on how the 4070 Ti compares to the RTX 4080, the RTX 3070, and the 3070 Ti from the last generation, and AMD's recently launched RX 7900 XT.
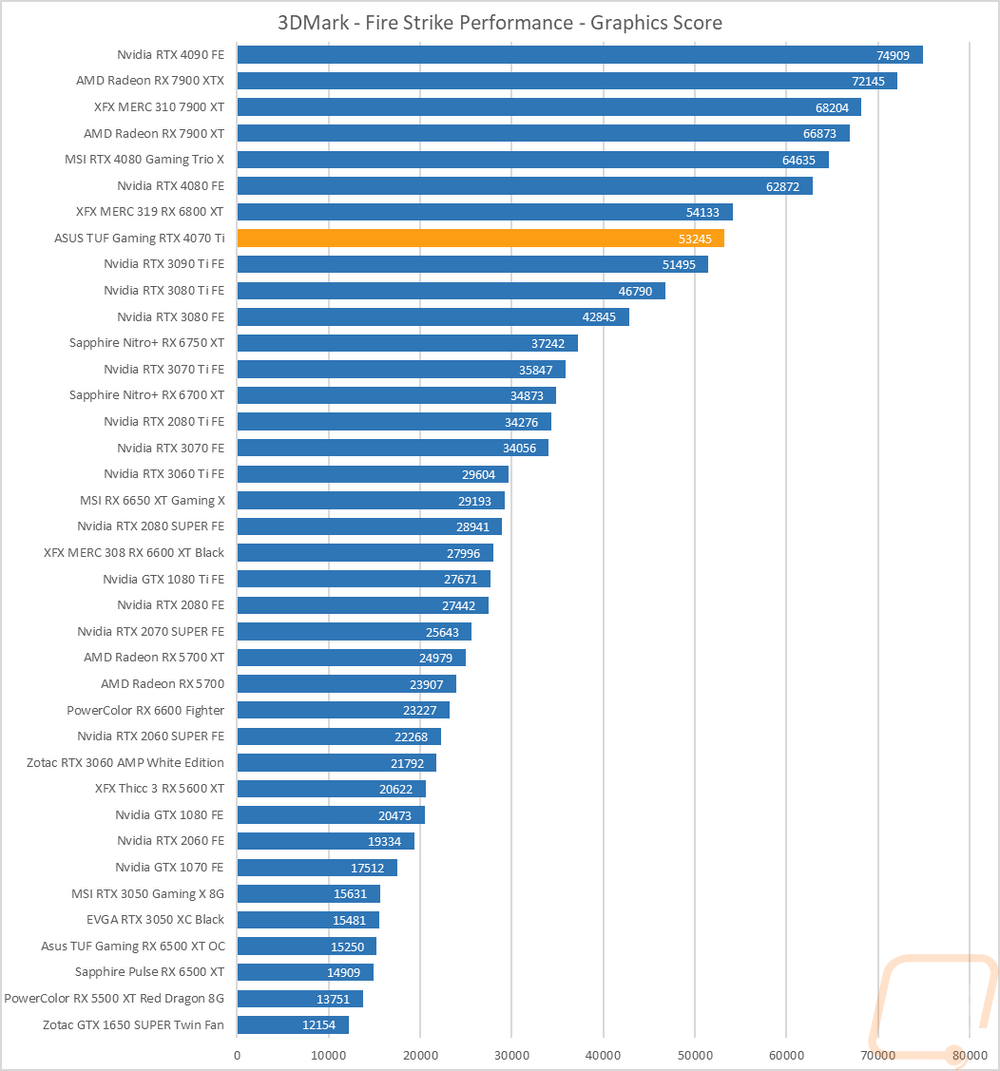
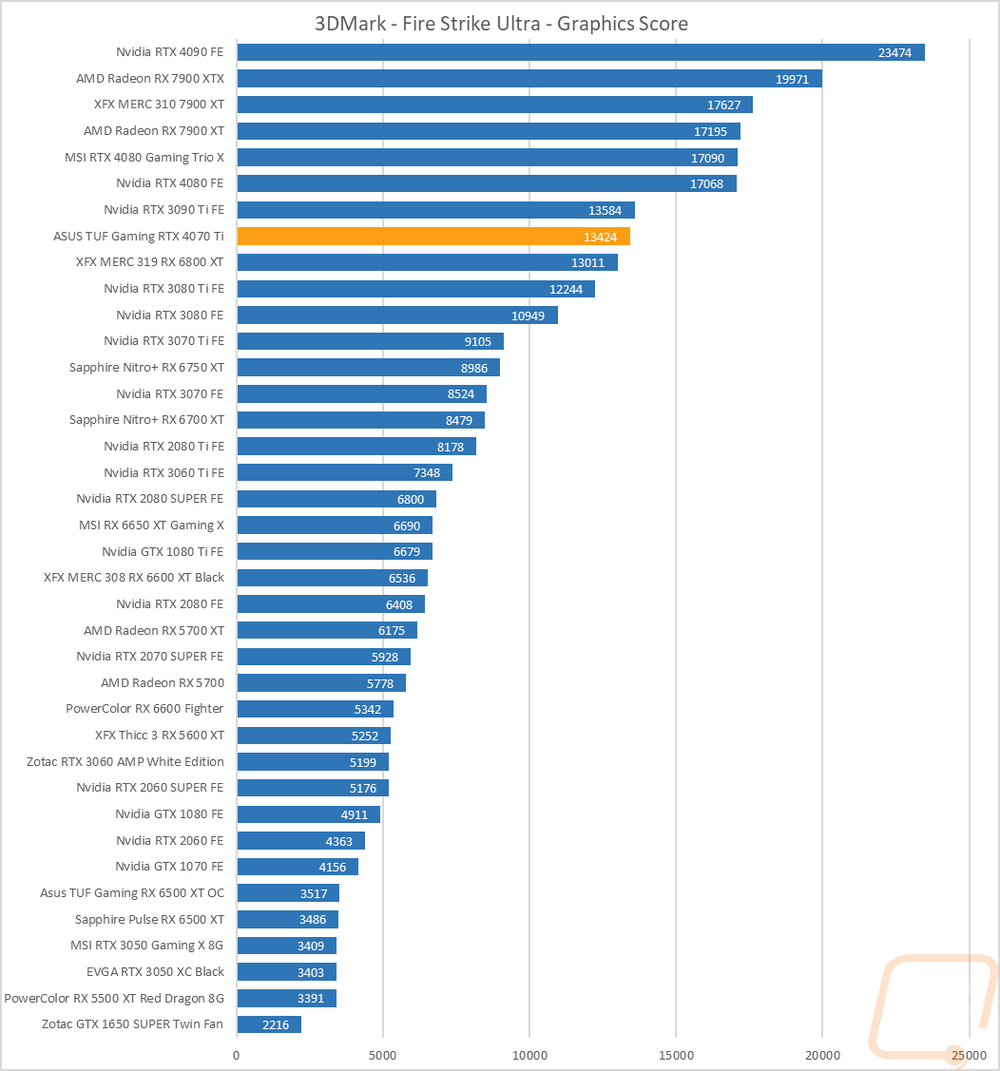
The first round of tests were done in the older Fire Strike benchmark which is a DX11 test. There are three detail levels, performance, extreme, and ultra. The TUF Gaming RTX 4070 Ti OC scored a 53245 on the base Fire Strike test which put it behind last year's overclocked RX 6800 XT but ahead of the RTX 3090 Ti. In Fire Strike Extreme it jumped ahead of the 6800 XT but in the Ultra test, the 3090 Ti improved and jumped ahead of it. Nvidia’s performance in the older DX11 Fire Strike benchmark is always lower but it is cool to see it outperforming last generation's flagship in two out of the three tests.

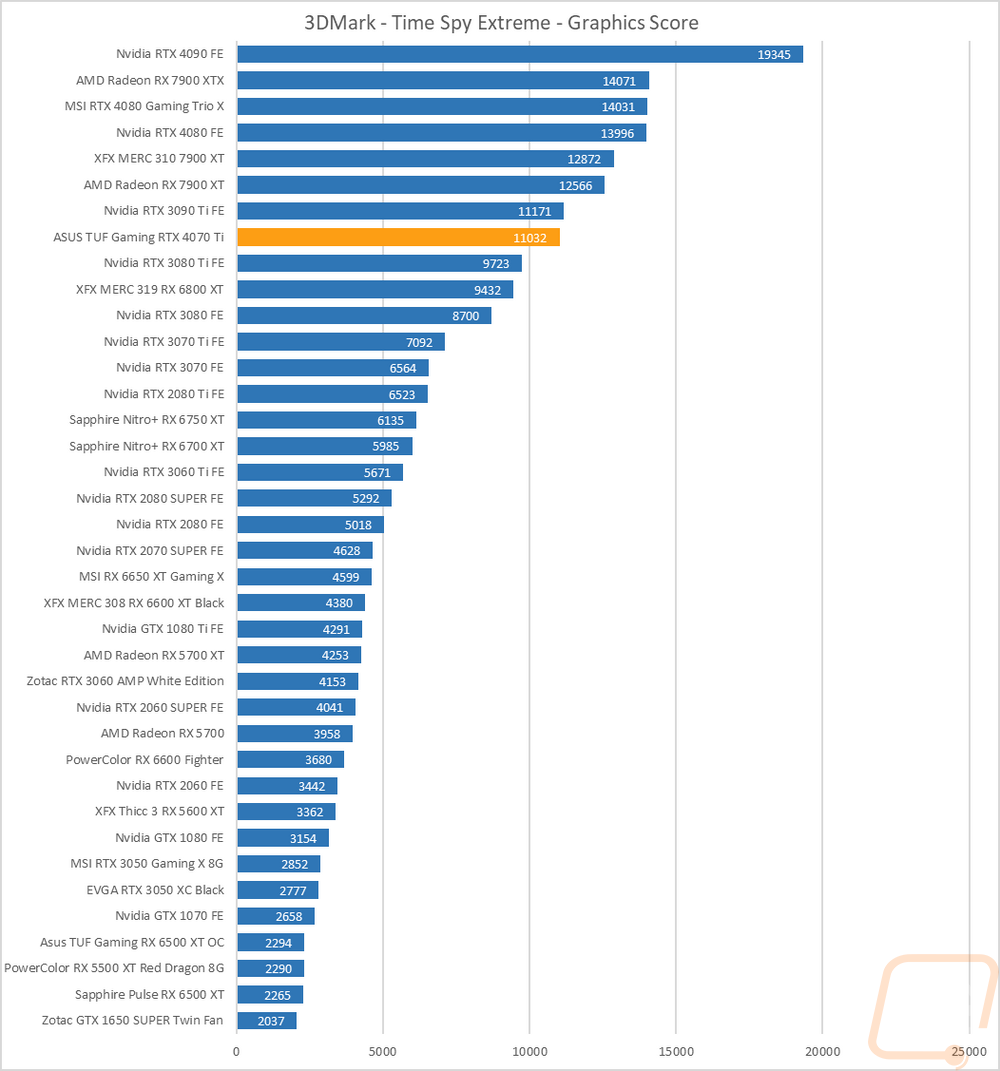
The next two were both based on the Time Spy benchmark. One is the standard test and then there is the extreme detail level. The TUF Gaming RTX 4070 Ti OC improved a lot compared to the 6800 XT here with it sitting 3000 points higher in the base Time Spy test. This was 1475 points higher than the 3090 Ti but still way behind the new 7900 XT. In the Time Spy Extreme benchmark the 3090 Ti edged it out just slightly but it is still sitting well behind the 7900 XT. Looking at the 3070 Ti to the TUF Gaming RTX 4070 Ti OC however is a 55.5% performance increase which is huge.

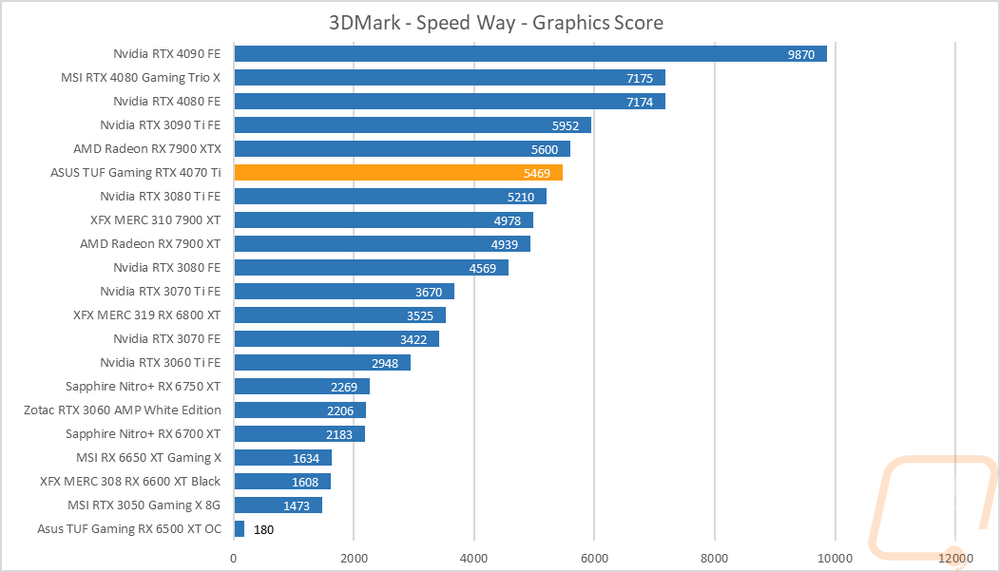
I did also test using the new 3DMark Speed Way which is their latest benchmark. Speed Way is DX12 as well but adds in more future-focused tech like Ray Tracing which up until now 3DMark has only used in feature tests. Here the TUF Gaming RTX 4070 Ti OC performed significantly better with it jumping ahead of both of the 7900 XTs that we have tested and is sitting just behind the RX 7900 XTX. It’s above the RTX 3080 Ti but below the 3090 Ti and is 1700 points behind the RTX 4080.
The last test was using the Unigine-based Superposition benchmark and I tested at 1080p with the extreme detail setting as well as the 4K optimized setting. In the 4k setting, the TUF Gaming RTX 4070 Ti OC scored a 12519 putting it behind the RTX 3090 Ti and ahead of the 3080 Ti which is great company but the 7900 XT is well ahead of it up at 14104 for its score. The extreme detail 1080p results are similar as well.

