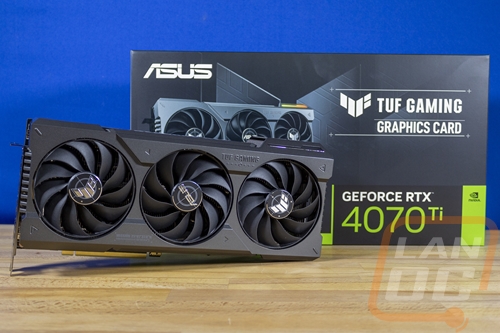
Well here we are in the new year and with it being CES time there are lots of new tech announcements and Nvidia has pulled the cover off of their latest 4000 Series GPU the RTX 4070 Ti and this is a case of what is old is new again as those of you who have been paying attention may recognize this as the unlaunched RTX 4080 12GB. After fixing that mistake and renaming the card we finally have the chance to check out Nvidia’s planned step below the RTX 4080. This is great timing as well, this is the first card launched after AMD’s 7900 XT and 7900 XTX and the 4070 Ti looks positioned to compete with the 7900 XT. The new cards don’t have a Founders Edition sadly but Nvidia along with Asus has sent over the Asus TUF Gaming RTX 4070 Ti OC that I’m going to check out so let’s learn a little more about the RTX 4070 Ti and then check out what Asus’s card is all about.
Product Name: ASUS TUF Gaming RTX 4070 Ti OC
Review Sample Provided by: Asus/Nvidia
Written by: Wes Compton
Amazon Affiliate Link: HERE
What is the RTX 4070 Ti all about?
Like with the RTX 4080 and RTX 4090 the new RTX 4070 Ti is also based on the Ada Lovelace and with that has brought a few big upgrades like the new 4th generation tensor cores for AI processing and 3rd generation ray tracing cores. The 4070 Ti is based on the AD104 GPU which is different from the RTX 4080 and RTX 4090 which were on the AD102 and AD103 GPUs. Being Ada based the 4070 Ti is designed to work with DLSS 3 which includes frame generation which helps with huge performance improvements when running DLSS 3 even for CPU-limited situations and games. The AD104 GPU in the 4070 Ti has 35.8 billion transistors compared to 45.9 billion on the RTX 4080. But in the specifications below where I compare the 4070 Ti with the 4080 and last generation’s 3070 Ti you can see how big of a jump it is over the 17.4 billion that the 3070 Ti had. The new GPU has 5 GPCs (Graphics Processing Clusters) which each have 6 TPCs (Texture Processing Clusters) which each TPC has two SMs (Streaming Multiprocessors) making for 60 in total. For comparison, the 3070 Ti had 48 and the 4080 has 76. This translates to 7680 CUDA cores on the 4070 Ti, 240 of the new 4th-gen Tensor cores, and 60 of the new 3rd-gen ray tracing cores.
Nvidia has the RTX 4070 Ti boost clock turned up compared to both the 3070 Ti which ran at 1770 MHz and the RTX 4080 which runs at 2505 MHz, the 4070 Ti has a boost clock of 2610 MHz. the 12GB of GDDR6X memory is clocked lower than the RTX 4080 though running at 1325 MHz compared to 1400 MHz which is still faster than last gens 3070 Ti which had its 8GB of memory running at 1188 MHz. The one area where the RTX 4070 Ti drops in specs is its memory interface which is 192-bit whereas both the 3070 Ti and the 4080 have 256-bit memory interfaces. With that its total memory bandwidth is lower than either of the other cards at 504 GB/sec vs 608 GB/s on the 3070 Ti and 716 GB/sec for the RTX 4080. Like with the other Ada-based GPUs, the 4070 Ti does have a much larger L2 Cache compared to the last gen, the 3070 Ti had 4MB whereas the 4070 Ti has 49 MB. That is lower than the RTX 4080 which has 64MB, as expected. It is built on the same TSMC 4N NVIDIA Custom Process as the other 4000 Series cards and has the same 3 DisplayPort and 1 HDMI configuration as last gen and this gen. That is HDMI 2.1 and DisplayPort 1.4a and while the extra doesn’t matter on this range of card for comparison AMD did include DisplayPort 2.1 on their 7900 XT which is the competitor for the RTX 4070 Ti. For TGP Nvidia has the 4070 Ti listed at 285 watts which is 5 watts less than the 3070 Ti and because they don’t have a Founders Edition of this GPU at all the power connection will depend on the model with some having the new 12vHPWR PCIe Gen 5 cable and others with two 8-pin PCIe power plugs.
|
|
RTX 3070 Ti |
RTX 4070 Ti |
RTX 4080 |
|
Graphics Processing Clusters |
4 |
5 |
7 |
|
Texture Processing Clusters |
24 |
30 |
38 |
|
Streaming Multiprocessors |
48 |
60 |
76 |
|
CUDA Cores |
6144 |
7680 |
9728 |
|
Tensor Cores |
192 (3rd Gen) |
240 (4th Gen) |
3040 (4th Gen) |
|
RT Cores |
48 (2nd Gen) |
60 (3rd Gen) |
76 (3rd Gen) |
|
Texture Units |
192 |
240 |
304 |
|
ROPs |
96 |
80 |
112 |
|
Boost Clock |
1770 MHz |
2610 MHz |
2505 MHz |
|
Memory Clock |
1188 MHz |
1313 MHz |
1400 MHz |
|
Memory Data Rate |
19 Gbps |
21 Gbps |
22.4 Gbps |
|
L2 Cache Size |
4MB |
49 MB |
64 MB |
|
Total Video Memory |
8 GB GDDR6X |
12 GB GDDR6X |
16 GB GDDR6X |
|
Memory Interface |
256-bit |
192-bit |
256-bit |
|
Total Memory Bandwidth |
608.3 GB/sec |
504 GB/sec |
716.8 GB/sec |
|
Texture Rate (Bilinear) |
330 Gigatexels/sec |
626 Gigatexels/sec |
761.5 GigaTexels/sec |
|
Fabrication Process |
Samsung 8 nm 8N NVIDIA Custom Process |
TSMC 4N NVIDIA Custom Process |
TSMC 4N NVIDIA Custom Process |
|
Transistor Count |
17.4 Billion |
35.8 billion |
45.9 billion |
|
Connectors |
3 x DisplayPort 1 x HDMI |
3 x DisplayPort 1 x HDMI |
3 x DisplayPort 1 x HDMI |
|
Power Connectors |
1x12 pin (Dongle to 2x 8-Pins) |
2x PCIe 8-pin cables OR 300w or greater PCIe Gen 5 cable |
1x16-pin (Dongle to 3x 8-Pins) |
|
Minimum Power Supply |
600 Watts |
700 Watts |
750 Watts |
|
Total Graphics Power (TGP) |
290 Watts |
285 Watts |
320 Watts |
|
Maximum GPU Temperature |
93° C |
90° C |
90° C |
|
PCI Express Interface |
Gen 4 |
Gen 4 |
Gen 4 |
|
Launch MSRP |
$599 |
$799 |
$1199 |
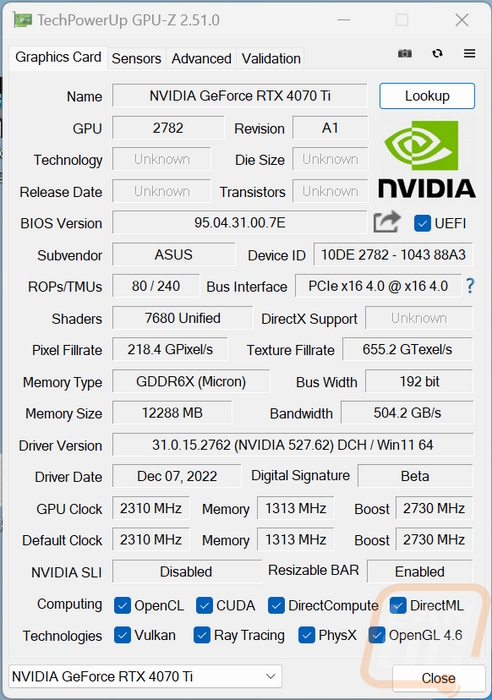
Before getting into testing I did also run GPUz to double-check that our clock speeds match up with the specifications. The ASUS TUF Gaming RTX 4070 Ti OC is an overclocked card which can be seen with its boost clock speed sitting at 2730 Mhz to the 2610 MHz that Nvidia has as their reference boost clock. While GPUz didn’t have full support for the 4070 Ti at the time of testing it did document the BIOS revision and testing was done with the 527.62 driver which was provided by Nvidia to the press to test before the launch.
Packaging
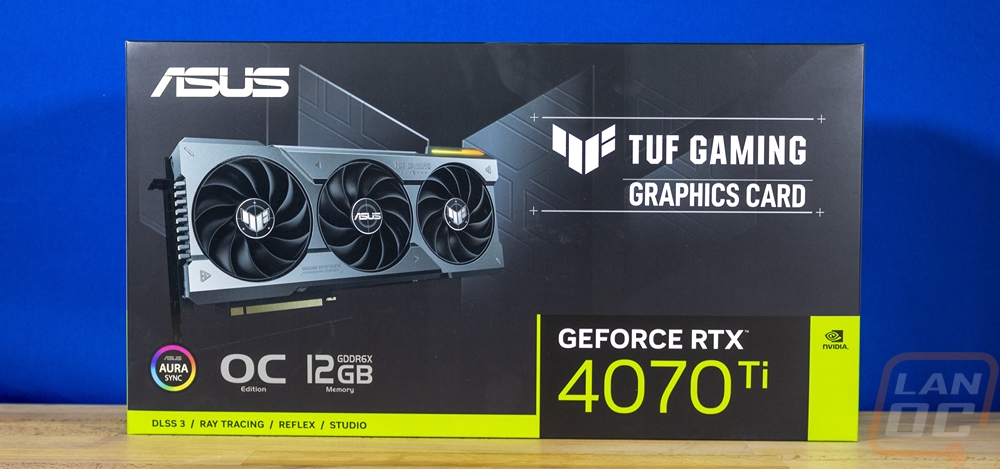
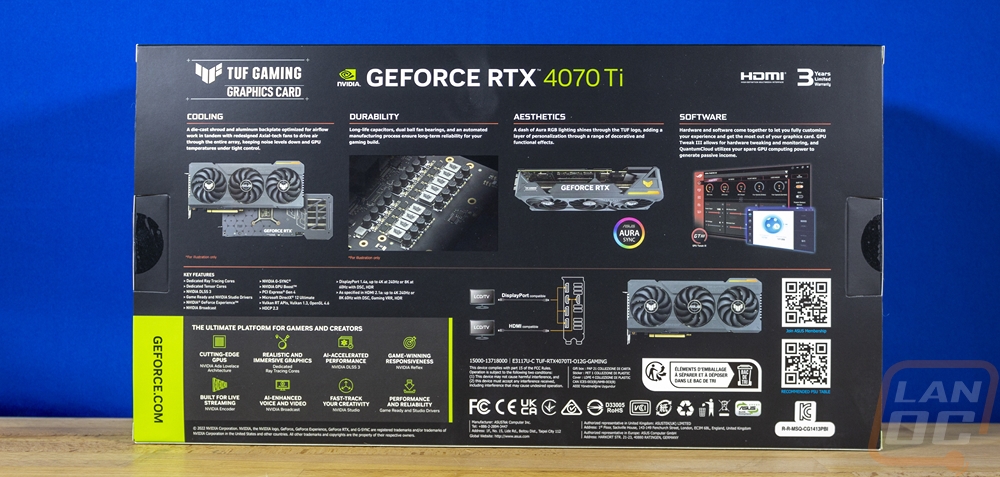
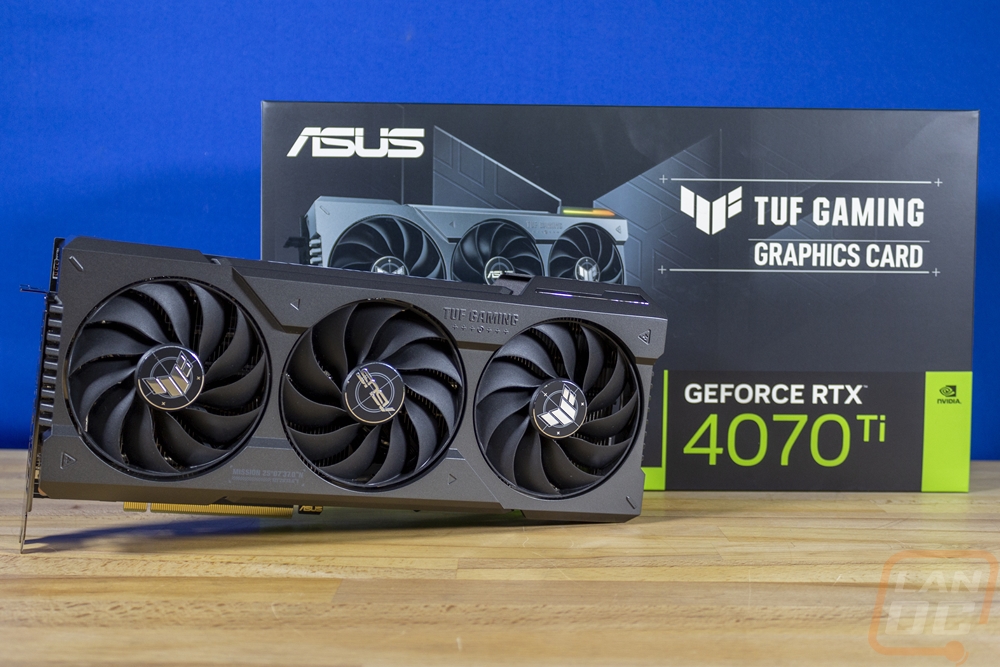
Unlike the Asus Strix line and the ROG lineup as a whole, the Asus TUF branding doesn’t go down the normal red and gaming them for their packaging so the ASUS TUF Gaming RTX 4070 Ti OC doesn’t have that standard look. They have a picture of the card right on the front of the box which I love and in the background, the TUF logo is floating in front of a black backdrop. It has the Asus logo in the top left corner and the TUF Gaming logo on the right. Beyond that, it has the Nvidia black and green wrap around which has the model name and on the left Asus also lets you know this is an overclocked card with their OC badge. Around on the back, the TUF Gaming RTX 4070 Ti OC packaging has a few more detailed pictures of the card used to highlight some of the key features. Asus also has a line drawing showing the rear I/O, the only thing missing as far as information needed if shopping in person would be the card dimensions and potentially the overclock speed.
Inside the box is a second black box, this has the TUF branding all over it. When you open it up Asus has the TUF Gaming RTX 4070 Ti OC sitting under a foam layer in a cutout section in the foam. The card is in a static protective bag so you don’t get the same experience as the Founders Edition cards and AMD's reference cards but you can see through the bag and can see the card when you open things up. There is a second cutout in the foam which houses the accessories as well.
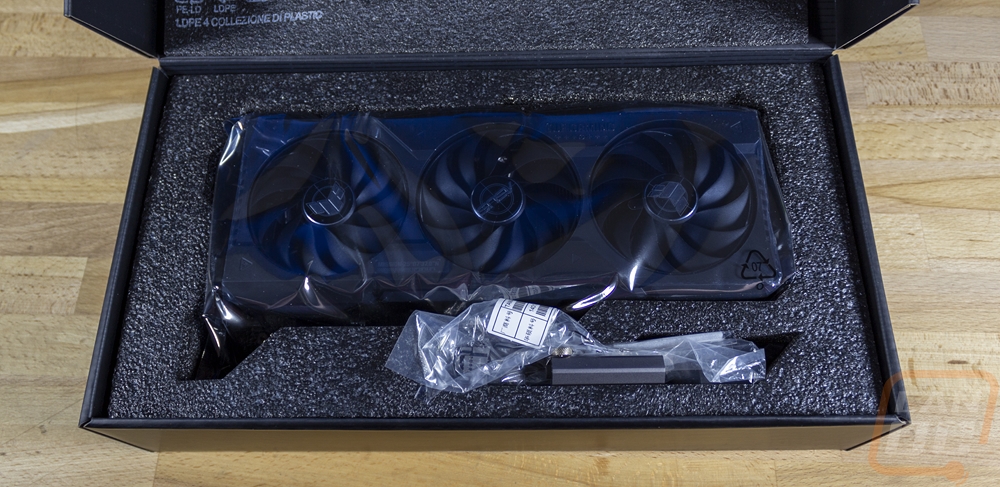
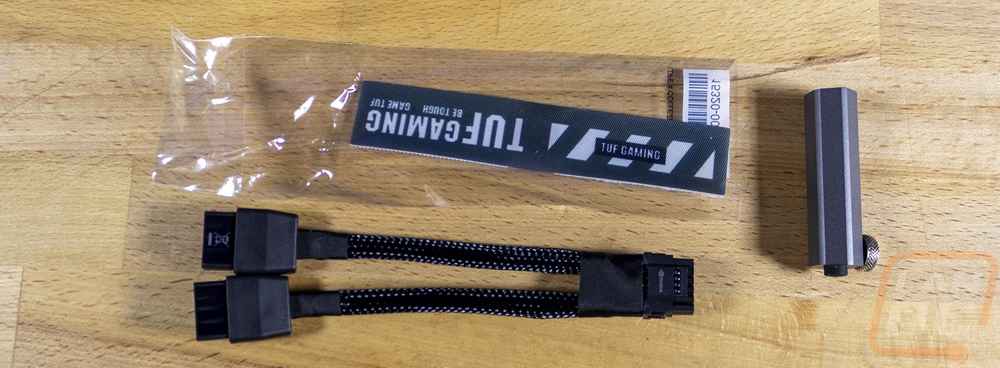
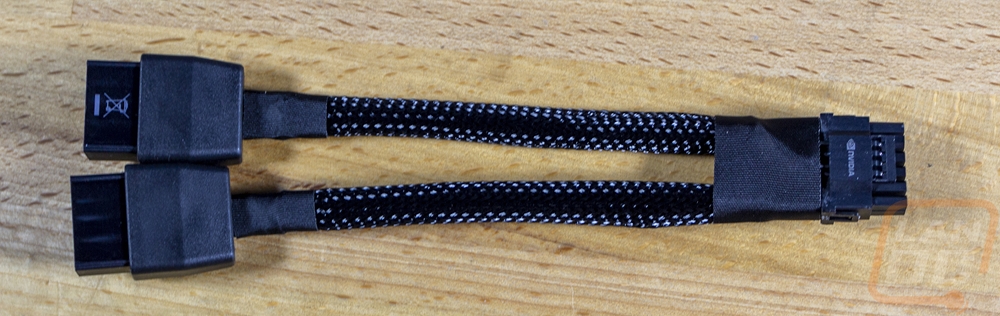
For accessories, the TUF Gaming RTX 4070 Ti OC comes with three things. You get the 12VHPWR power adapter which has the new 16-pin power plug on one end and two 8-pin PCIe power plugs on the other end. The new plug has been controversial but I am glad that they have included the adapter and not forced everyone to upgrade PSUs to the new PCI 5.0 standard just yet. Along with that is a small aluminum card support and also a TUF-branded Velcro strap.
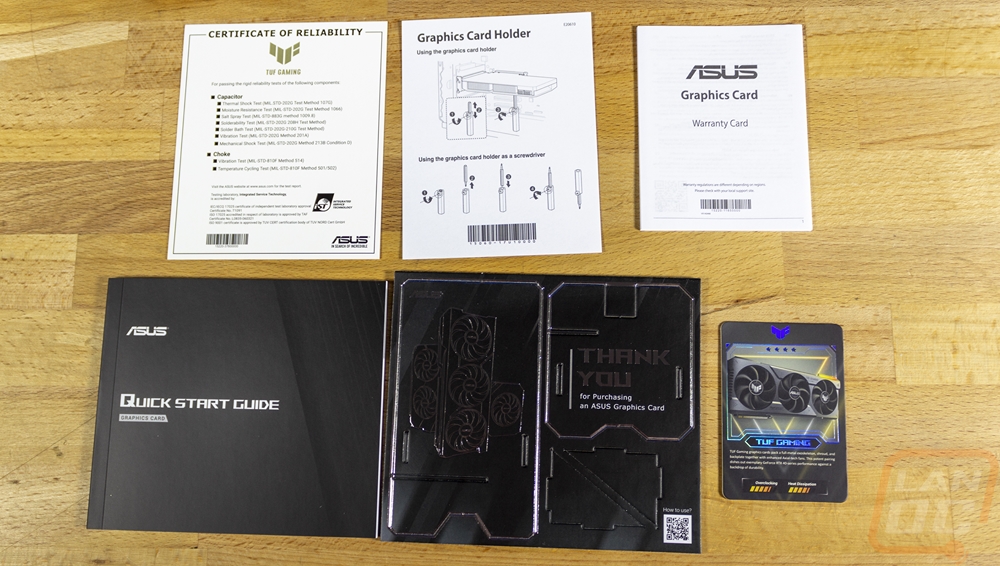
Up under the TUF Gaming RTX 4070, Ti OC Asus also has a small black pouch. This has all of the documentation inside and I was surprised by how much was inside. You get a certificate of reliability from TUF Gaming, an instruction card on how to use the support, a warranty card, a quick start guide, a thick playing card with the card on it, and a punch-out Asus standee that thanks you for your Asus purchase. The card and the standee are simple but cool swag that goes with the card support and Velcro strap that give you a little extra on top of the card itself which is nice.
Card Layout and Photos
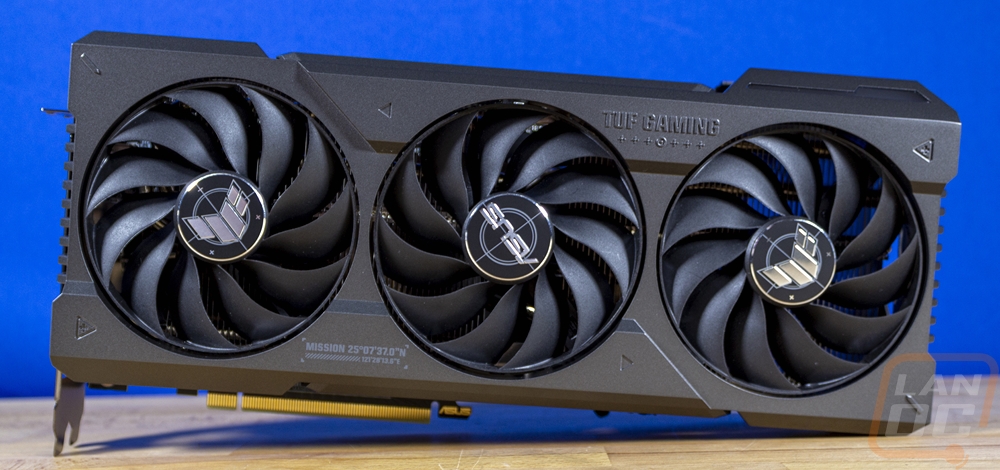
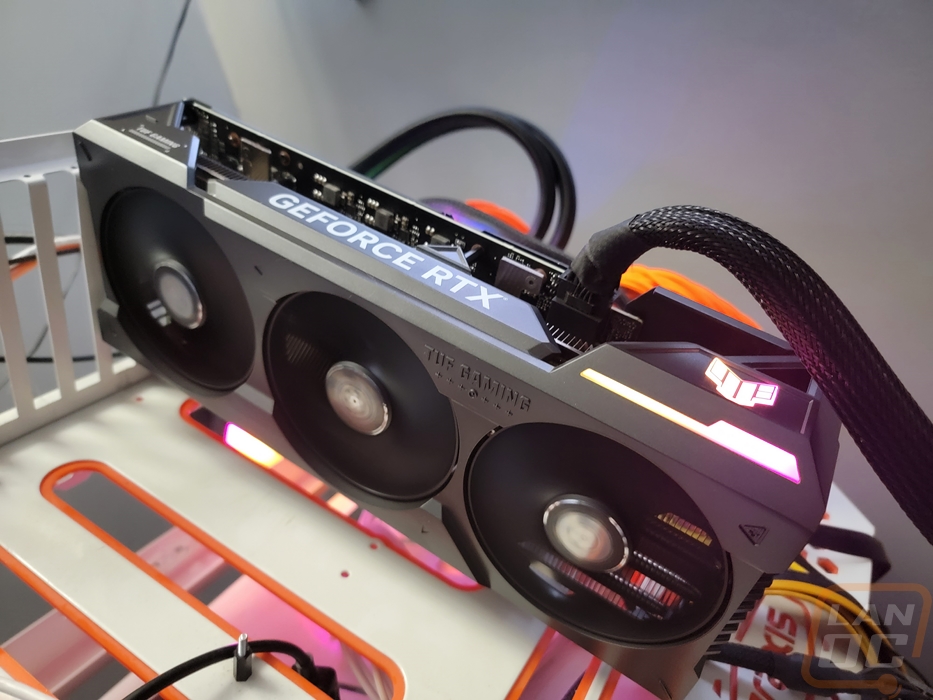
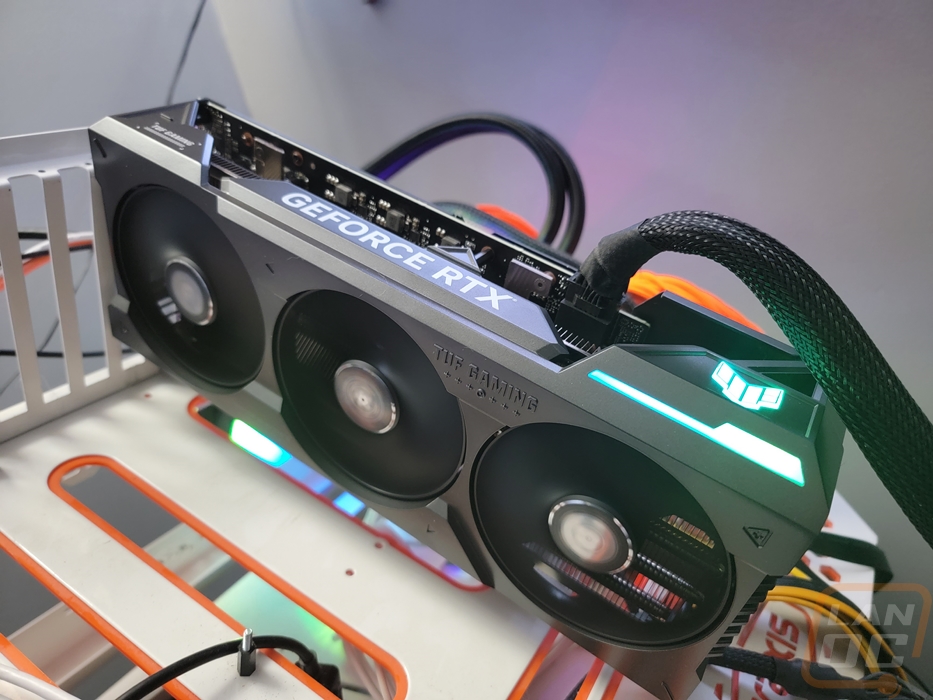
With the TUF Gaming RTX 4070 Ti OC being from the TUF lineup, while it is a gaming card the TUF styling is a little simpler than the crazy angular designs that a lot of gaming-focused cards have. The TUF Gaming RTX 4070 Ti OC has a triple fan layout and a dark grey plastic fan shroud. The Shroud isn’t completely plain, but other than having the TUF Gaming embossed in the side they have just a few raised areas for styling. There isn’t a lot of lighting or any other colors used to go over the top making this a simple-looking card even with its size in mind.
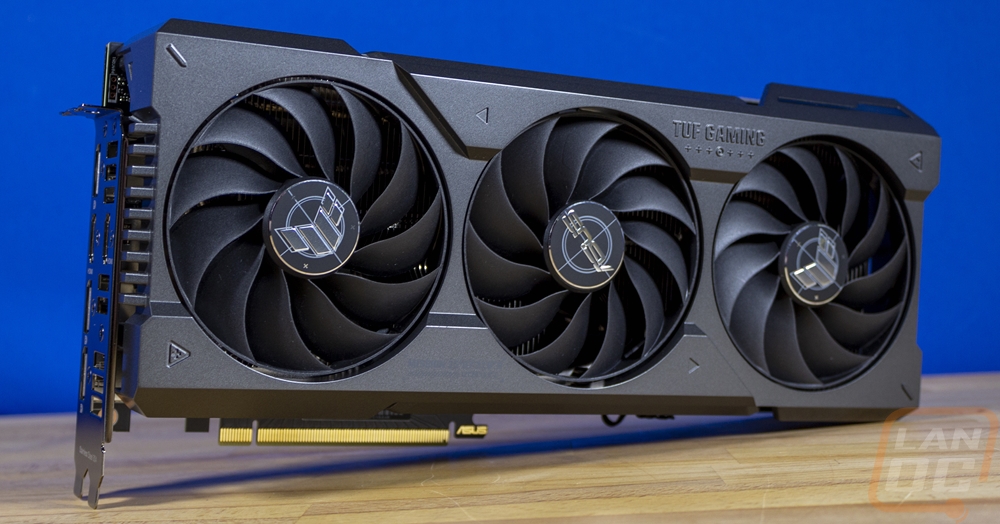
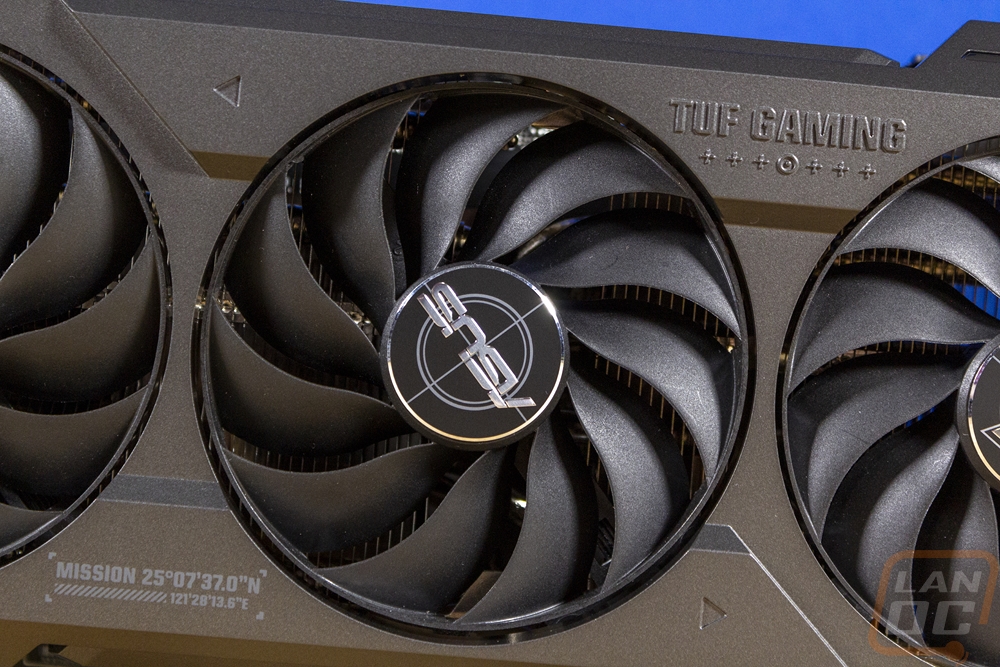
The side view gives us a better look at the triple fan layout. All three fans are 90mm wide but Asus has combined two different fan directions here. The two outer fans rotate counterclockwise and the inner fan rotates clockwise. You can see this with the blade layout which is flipped for the inner fan. Other than that the fans are the same with 11 blades each and a twisted blade shape. The outside of each fan has a ring around it to give the blades more strength as well. The center of each fan then has a black and chrome sticker on it, the outer blades have the TUF logo and the center fan has the Asus logo. The fan shroud also has 25°07'37.0"N 121°28'13.6"E printed on it as the mission, as it turns out is the Latitude & Longitude of the Asus location in Taipei which is a cool little easter egg.
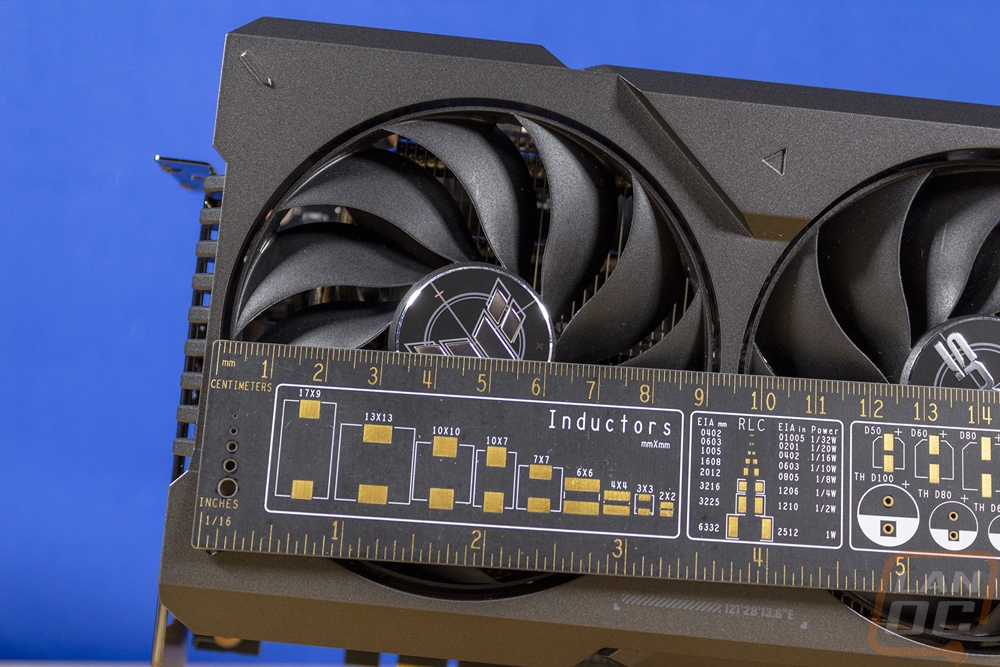
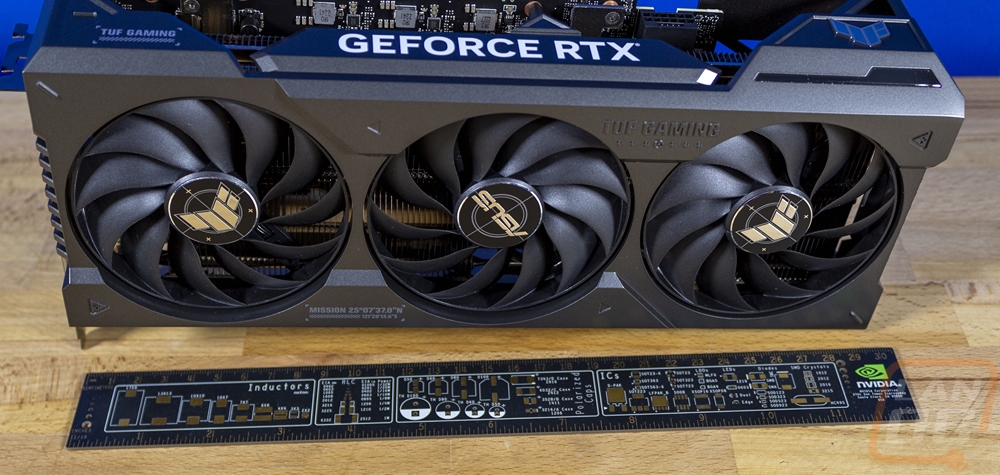
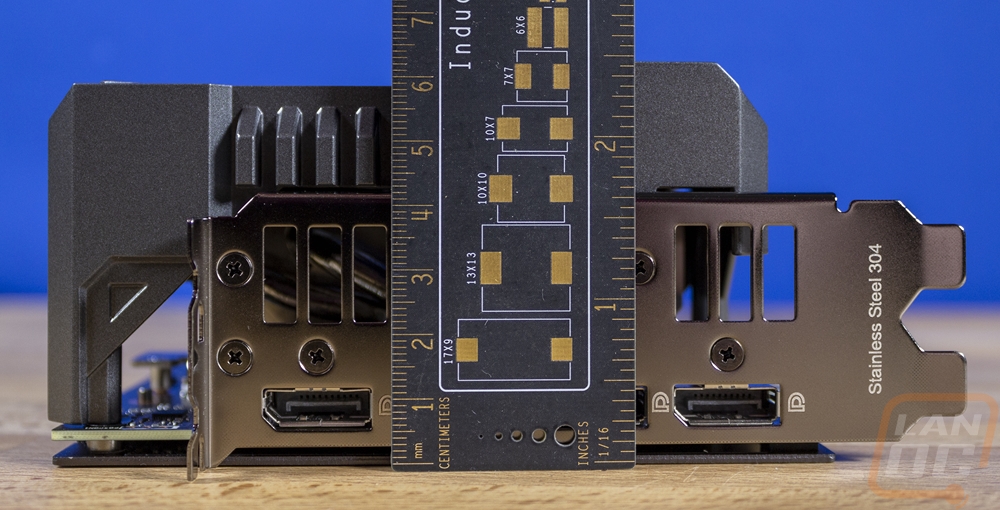
As far as size goes, the TUF Gaming RTX 4070 Ti OC isn’t up there in the crazy card sizing that a majority of the aftermarket and even Founders Edition cards have been doing but it also isn’t small as well. While they didn’t go as long with the card just a hair past 300mm long Asus did make up for that with thickness. The card is 64mm thick which is past what most would consider a 3-slot card. Then for card height, you can see that the TUF Gaming RTX 4070 Ti OC is 27mm above the top of the PCI bracket which is less than some cards but still tall. I dig that Asus did give the fan shroud some styling on this end with the card having a 2 slot bracket and the shroud having to cover up the rest of the thickness.
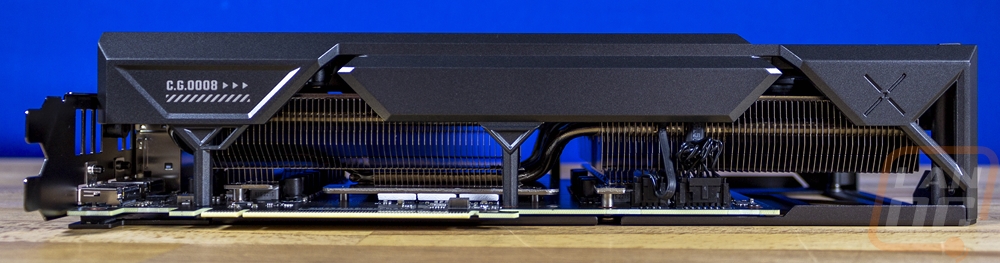
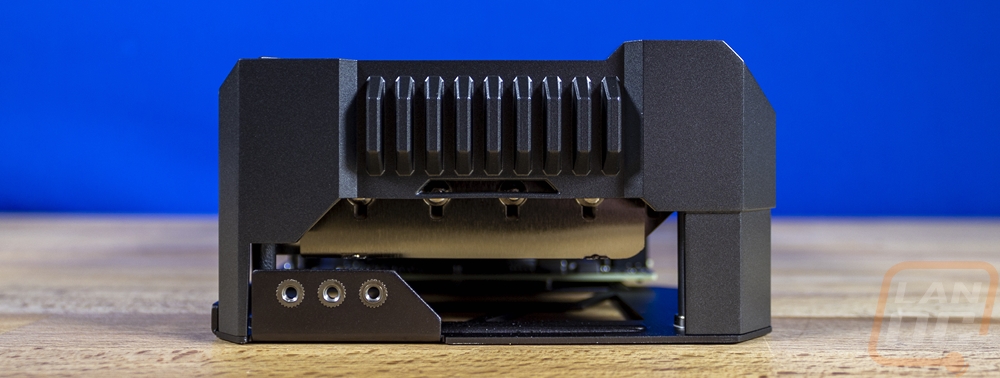
The bottom edge of the card has C.G.0008 printed on it but I can’t figure out if that has any hidden meaning behind it. The bottom view gives us a better look at the heatsink layout which has a horizontal layout blowing air from the fans up and down. You can also see heatpipes that run to the heatspreader sitting right over the GPU and memory. There are also heatplates on the left and right side of that over top of the voltage regulators. The fan shroud does wrap around some on the bottom but over half is open for ventilation. At the end of the TUF Gaming RTX 4070 Ti OC, the backplate wraps around to give a metal mounting point with three threaded holes to attach a support bracket to the card. The end is slightly open and with that, we can see the four heatpipe ends. The fan shroud also wraps around has what looks like a heatsink molded into the plastic for a little extra styling. Up on the top edge, the layout is very similar to the bottom with the heatsink very visible including its contact with the GPU, memory, and VRMs. It looks like there is room for the heatsink to be denser when near the PCB. The fan shroud is open with a lot of ventilation room for airflow out of the top of the card.
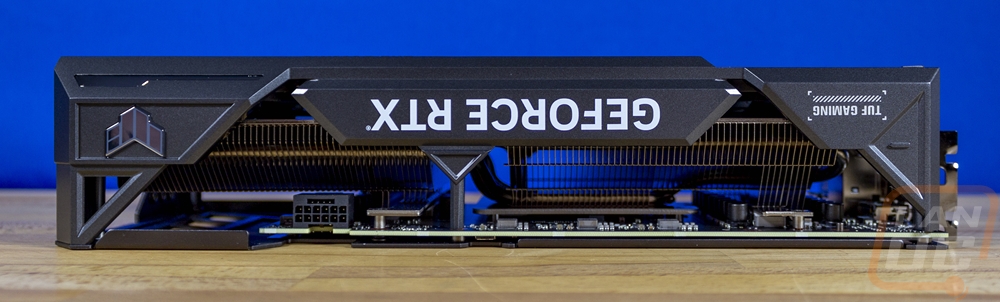
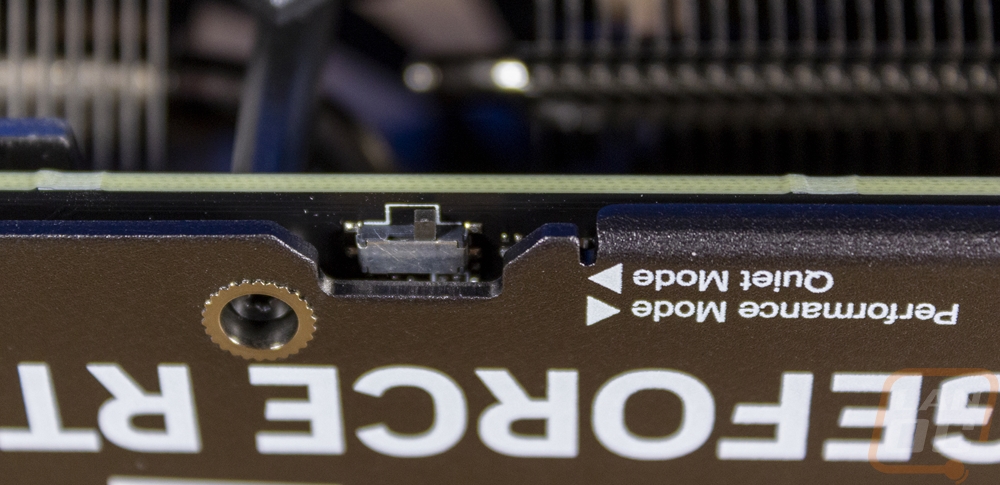
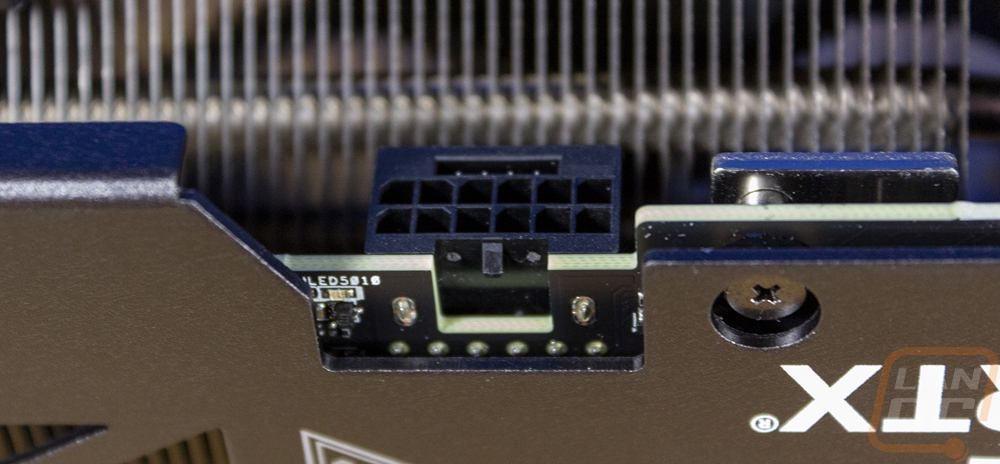
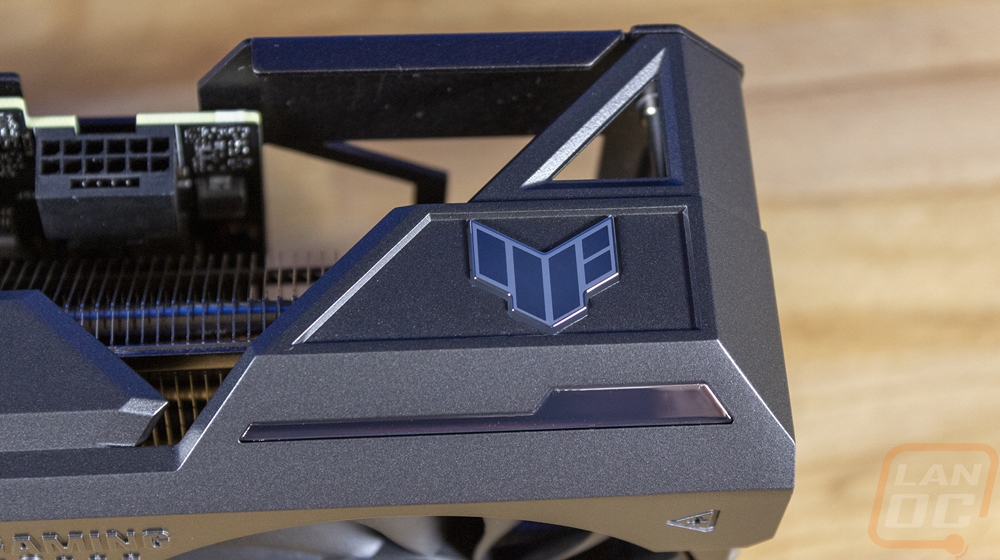
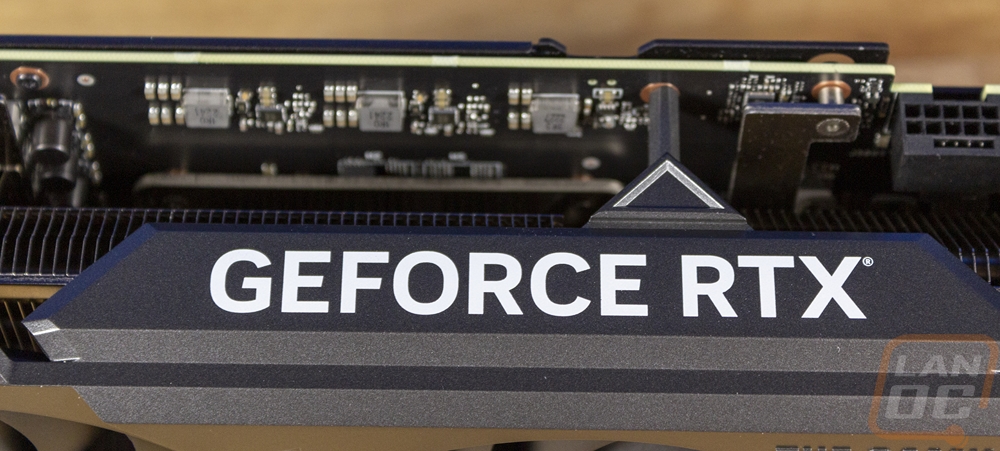
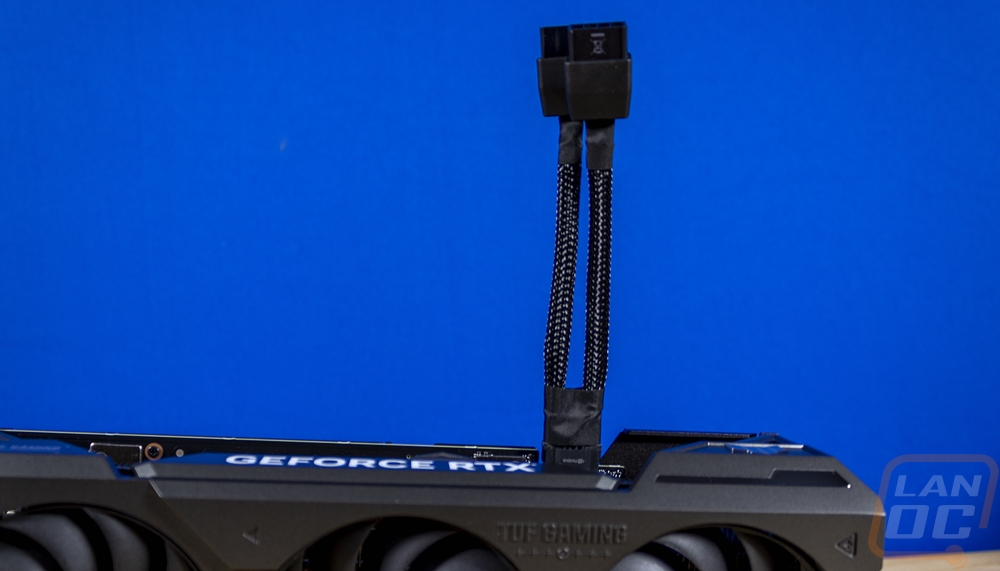
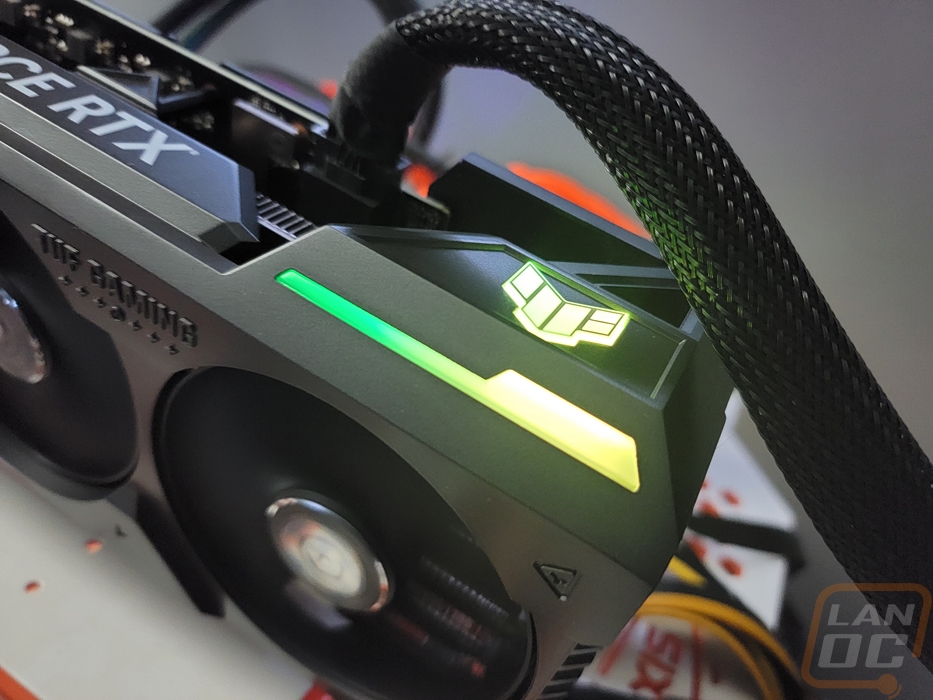
The top edge of the TUF Gaming RTX 4070 Ti OC has a few other things going on as well. Down at the end, the fan shroud has integrated the TUF logo which Asus has backlit with addressable RGB lighting as well as a short accent strip on the edged front edge there as well. They also have the GeForce RTX branding printed in white. On the PCB near the end, Asus has the power connection slightly recessed lower to help give a little more room for the power cable. For power, the TUF Gaming RTX 4070 Ti OC does use the new smaller 16-pin 12VHPWR connection and Asus has it facing directly up which I would love to see these being angled like Nvidia did last generation on their Founders Edition cards. Some angle would help prevent the connection from getting as much stress, especially when using the adapter. The top edge on the back of the PCB also has a small dip switch for switching between two BIOS. Ours came in performance mode which is what I test with but there is also quiet mode and Asus did a great job of labeling both with it printed in white on the backplate.
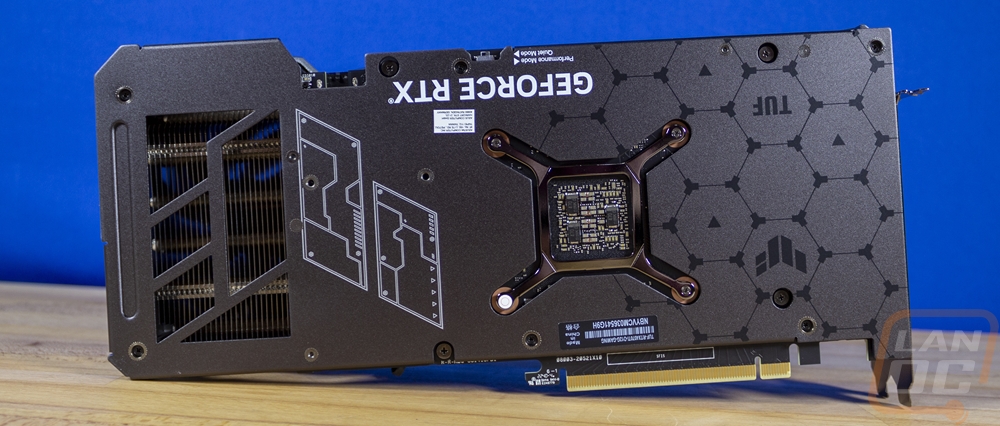
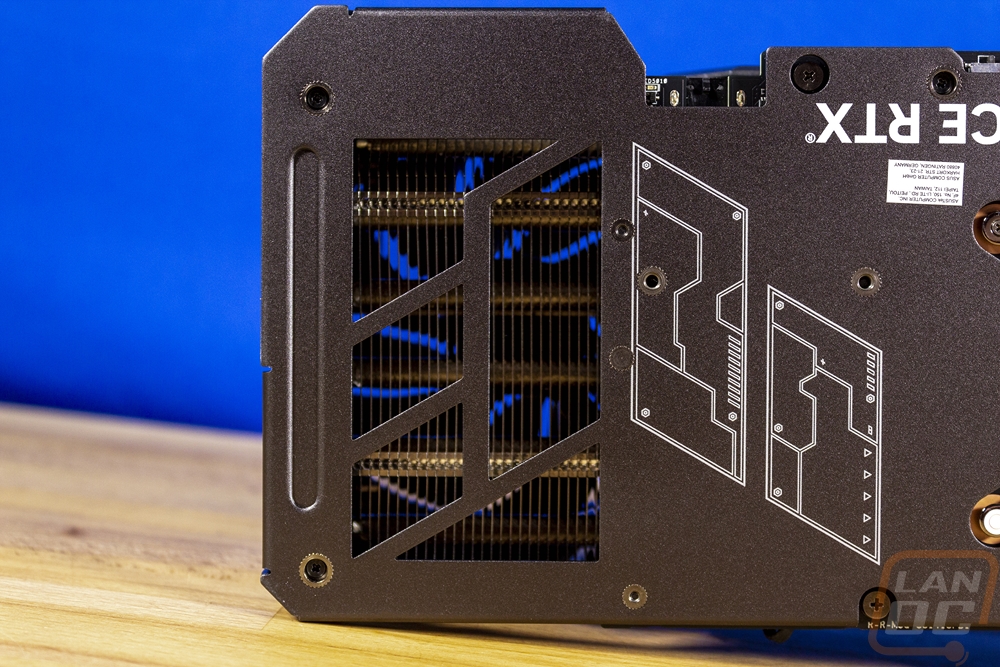
The back of the TUF Gaming RTX 4070 Ti OC is covered in a metal backplate which given the TUF branding isn’t too big of a surprise. I was surprised however that Asus went a little extra on giving the black backplate some style. They have a few white accents printed on the left near the large blow-through hole cut in it past the PCB and the GeForce RTX branding that is also in white. But then on the right side of the card starting at the cutout that goes around the mounting bracket around the GPU, they have black lines connected to make hexagons and a few have the TUF logo and branding. The back also has a small sticker down at the bottom with the model and serial numbers on it as well.
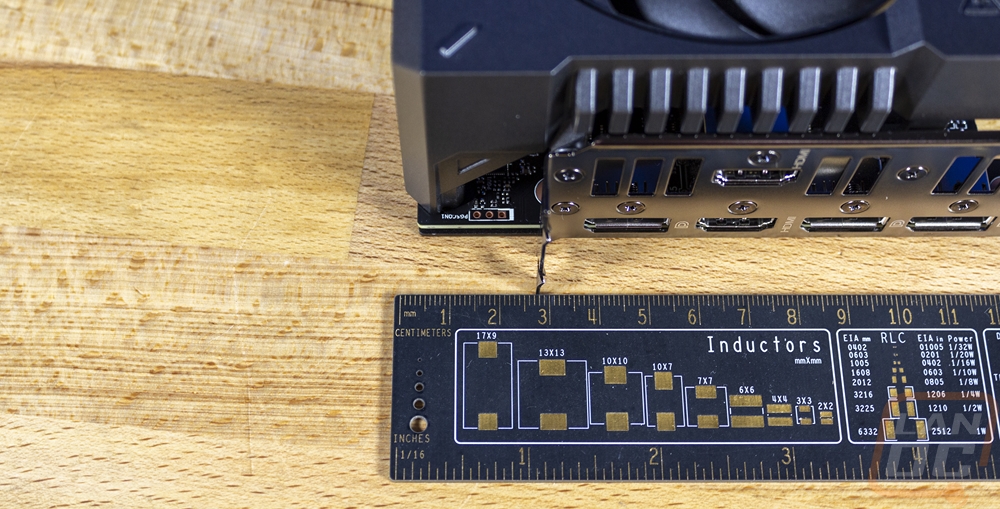
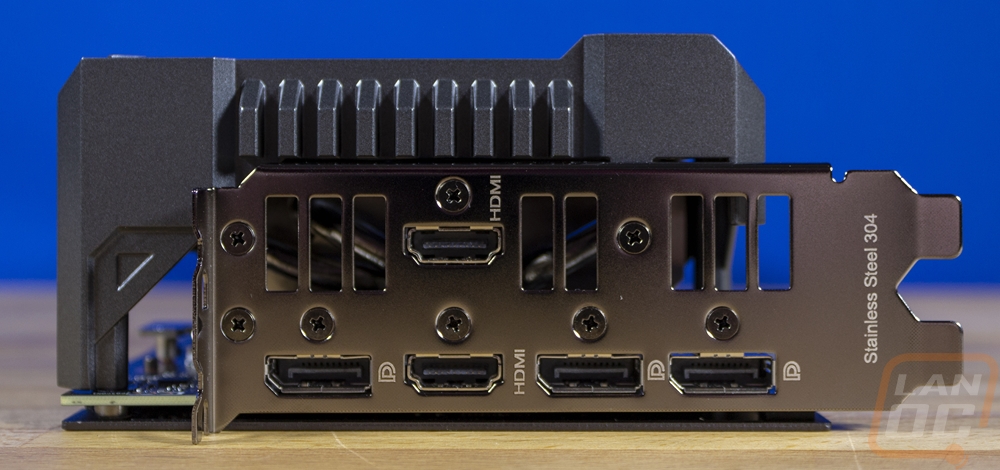
The PCI bracket end of the TUF Gaming RTX 4070 Ti OC shows an especially shiny PCI bracket which Asus even had a plastic cover on that needed to be removed. They even show off that it is 304 stainless steel with that printed down at the bottom. Each of the display connections has white legends on them as well. For connections, the TUF Gaming RTX 4070 Ti OC has three DisplayPort connections which is the standard these days but I was surprised to find two HDMI here as well when one is the standard. That extra HDMI may be very important for someone who still has a few HDMI-only monitors in the mix. It is sitting up in the second slot on the bracket but Asus still has a few vent holes there, not that they are needed given the orientation of the heatsink. Through them, we can see some of the heatpipes though.
Before getting into testing I did get the TUF Gaming RTX 4070 Ti OC on the bench and check out the lighting as well. With everything concentrated in the top right corner, there isn’t too much to take in but Asus has the TUF logo backlit and alongside that is a small accent strip as well. The individually addressable RGB lighting looks good and does tie in with Asus’s software which will make things easy if you also have an Asus motherboard. I’m never a huge fan of backlit logos, but the TUF logo isn’t text so it isn’t too bad. I do wish that they had the lighting across the top and fan side a little more rather than being concentrated in the one corner but it does go with the simple TUF styling a little bit.
Test Rig and Procedures
Test System
CPU: Intel Core-i9 12900K – Live Pricing
Motherboard: MSI MEG Z690I UNIFY Gaming Motherboard – Live Pricing
Cooling: Corsair H100i Elite LCD Display - Live Pricing
Noctua NT-H1 Thermal Paste - Live Pricing
Memory: Crucial 32GB Kit (2 x 16GB) DDR5-4800 UDIMM– Live Pricing
Storage: Sabrent Rocket Q4 2TB – Live Pricing
Power Supply: Corsair AX1200 - Live Pricing
Case: Primochill Wetbench - Live Pricing
OS: Windows 11 Pro 64-bit - Live Pricing
|
Our Testing Procedures |
|
|
3DMark |
All 3DMark-based tests are done using the most recent version. We test using all three versions of Fire Strike, Both Time Spy and Time Spy Extreme, and Speed Way. Tests to look at ray tracing performance are done with Port Royal when supported and for Nvidia cards that support DLSS, the DLSS subtest is also done at 1440p with the performance setting and DLSS 2.0 as well as a look at DLSS 1, 2, and 3 at 4K. |
|
Unigine Superposition |
1080p Extreme and 4k Optimized benchmarks along with the VR Future test are done. The VR test is done at the Oculus resolution |
|
VRMark |
Only the Blue room test is run |
|
CS:GO |
This test is done using the workshop map called CS:GO Benchmark. You can find more information at this link. https://www.gamingpcbuilder.com/how-to-install-csgo-fps-benchmark-map/ I test at 1080p, 1440p, and 4K resolutions. All auto settings are turned off and detail is set to their highest settings. shadow quality high, model texture detail high, shader detail very high, AA set to 16x, uber shaders enabled |
|
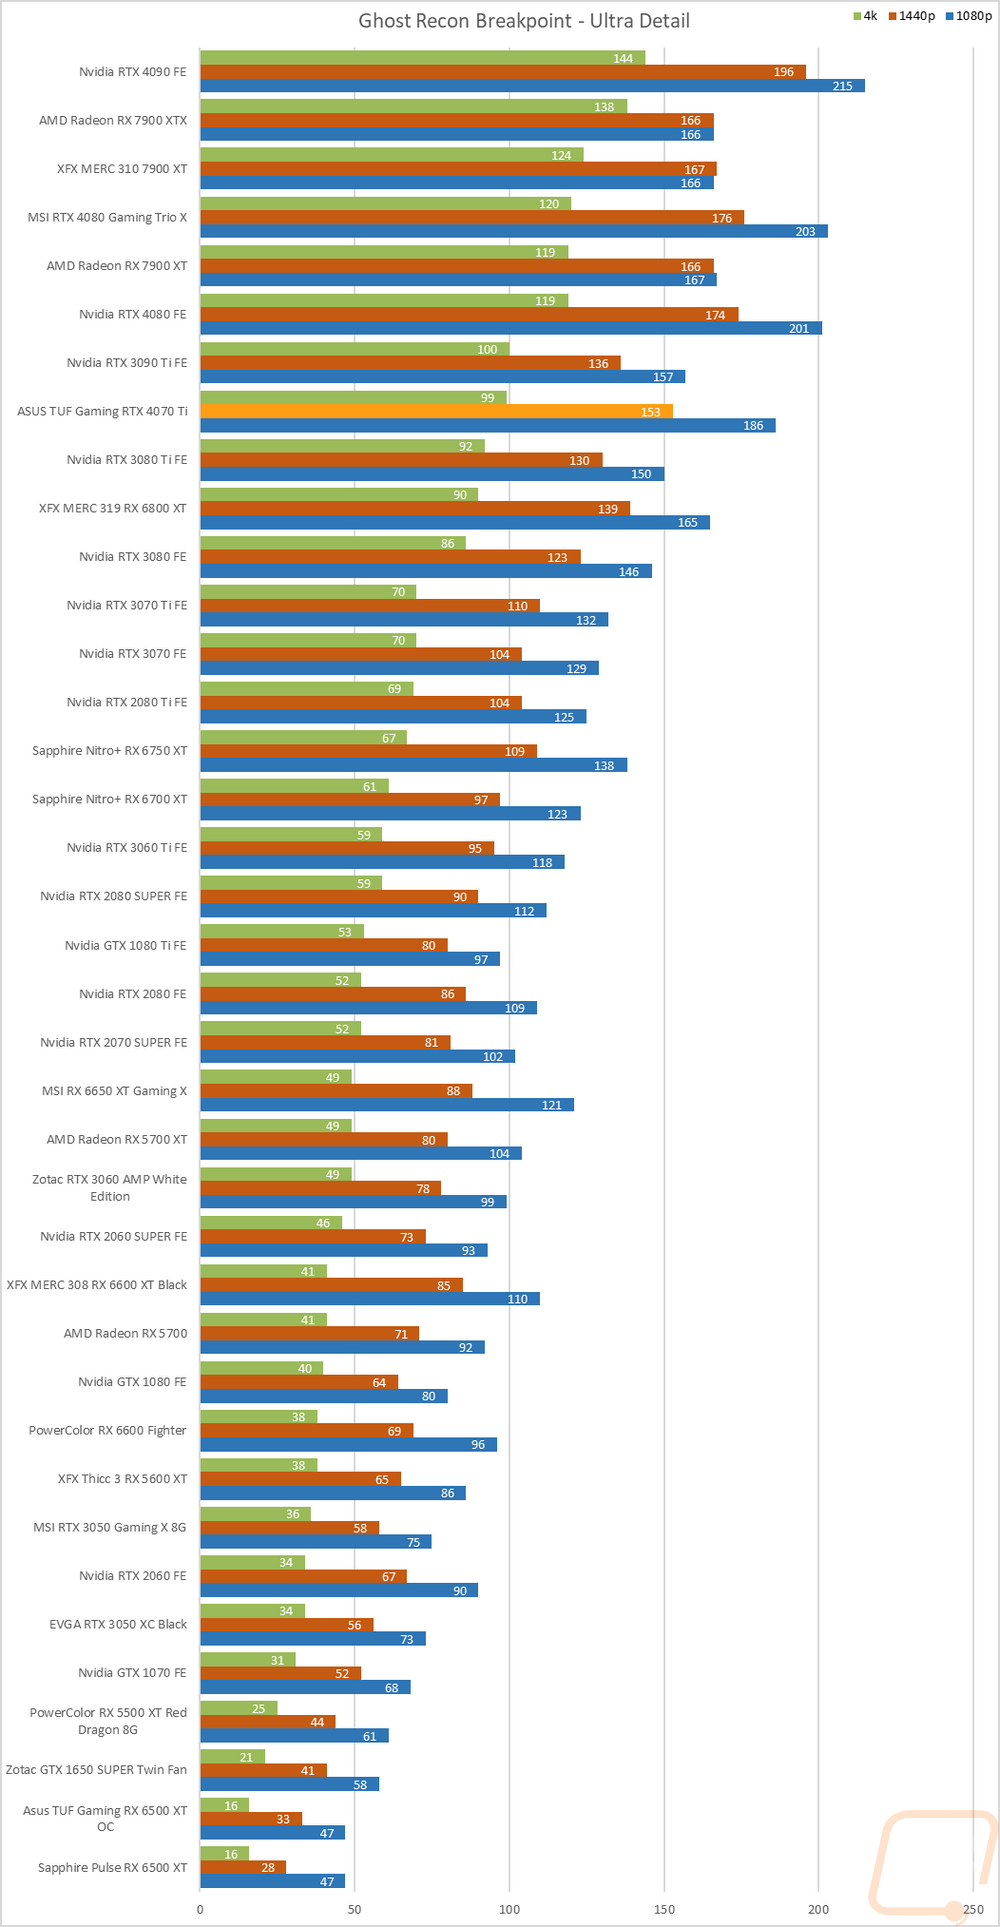
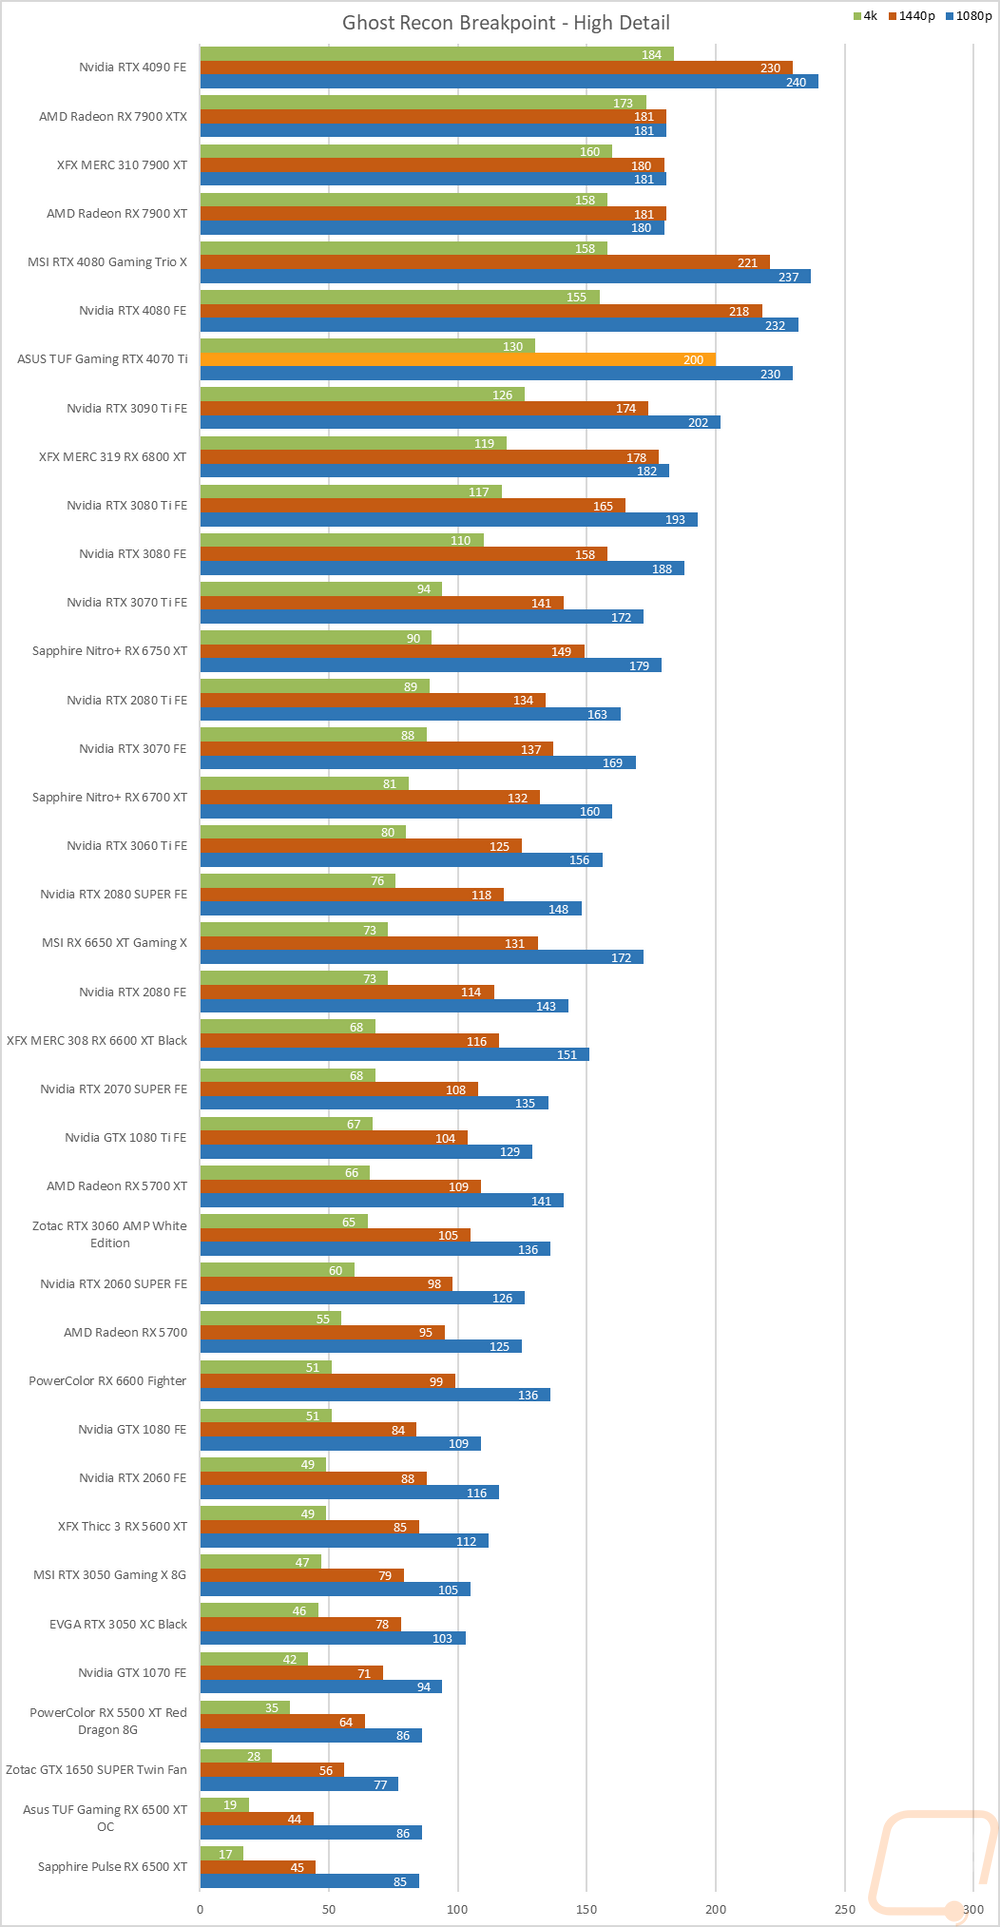
Ghost Recon Breakpoint |
Built-in benchmark tested at 1080p, 1440p, and 4k with the Ultra and Medium detail settings |
|
Watch Dogs: Legion |
Built-in benchmark testing at ultra and high details. Tested at 1080p, 1440p, and 4k. I also do RTX and DLSS testing on Nvidia cards at 4K using the Ultra detail settings as a base as well. |
|
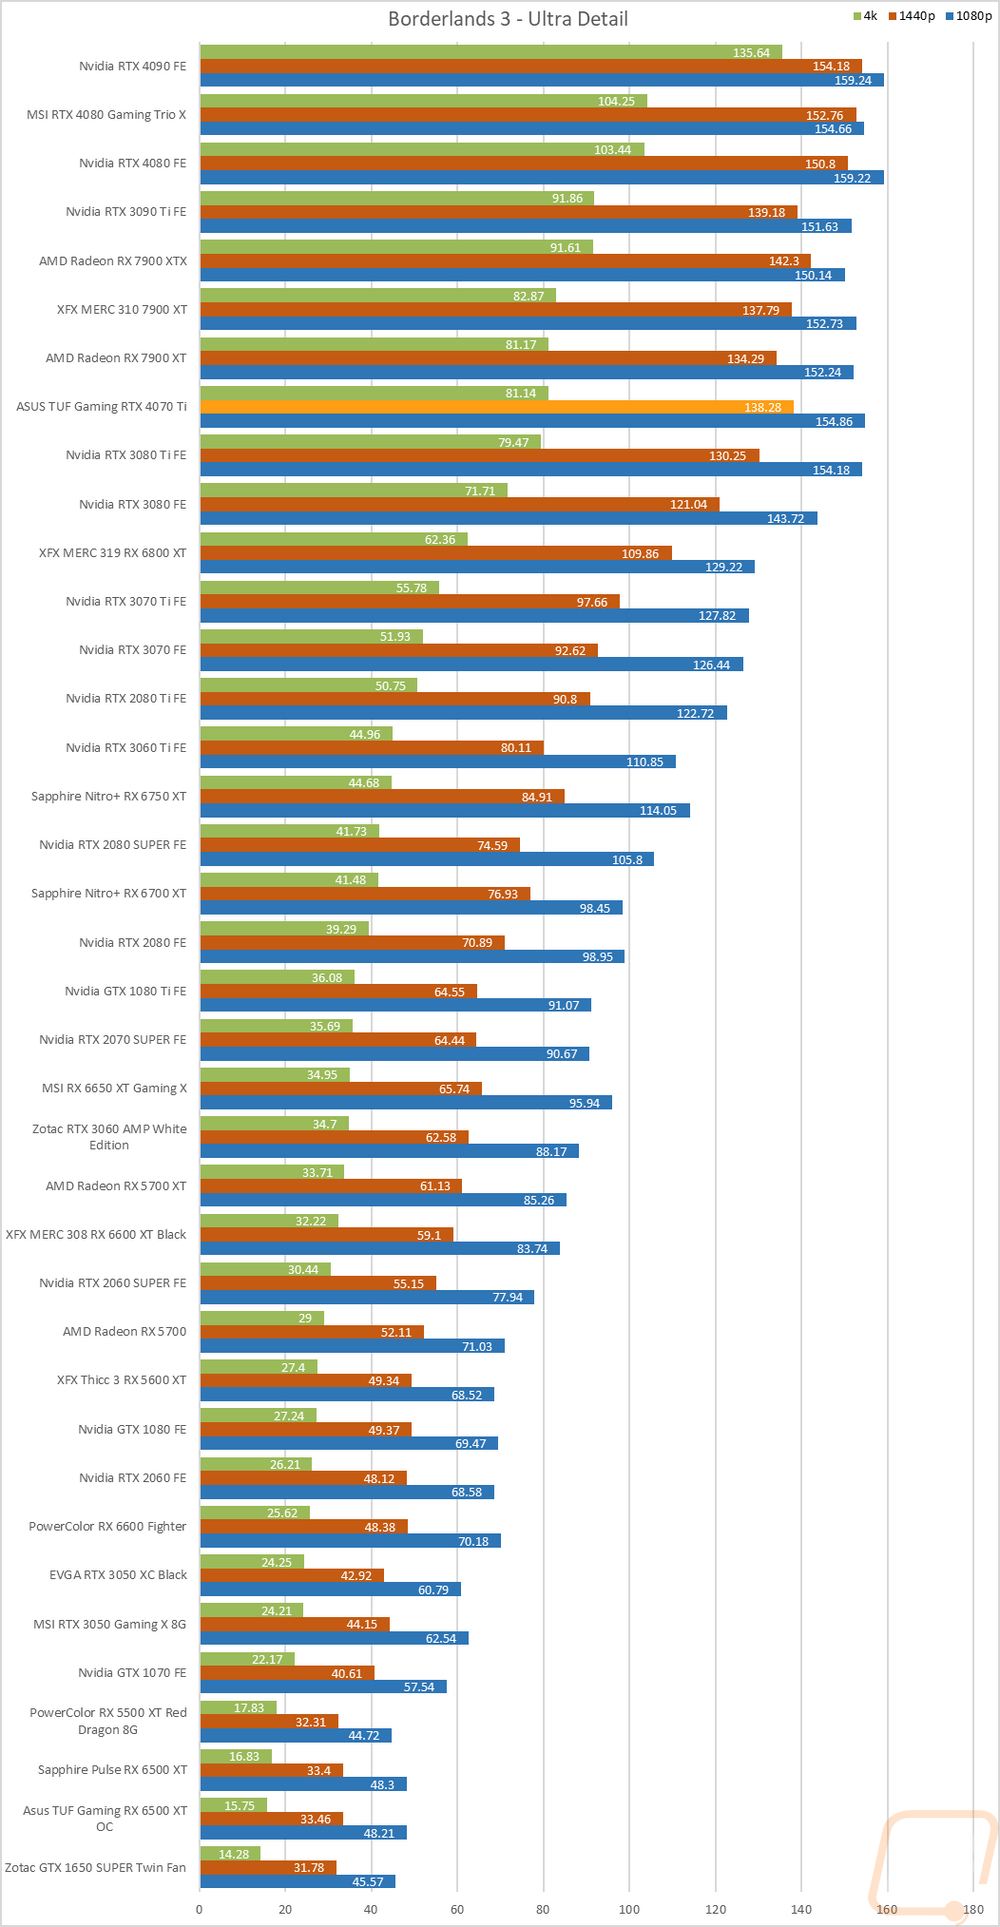
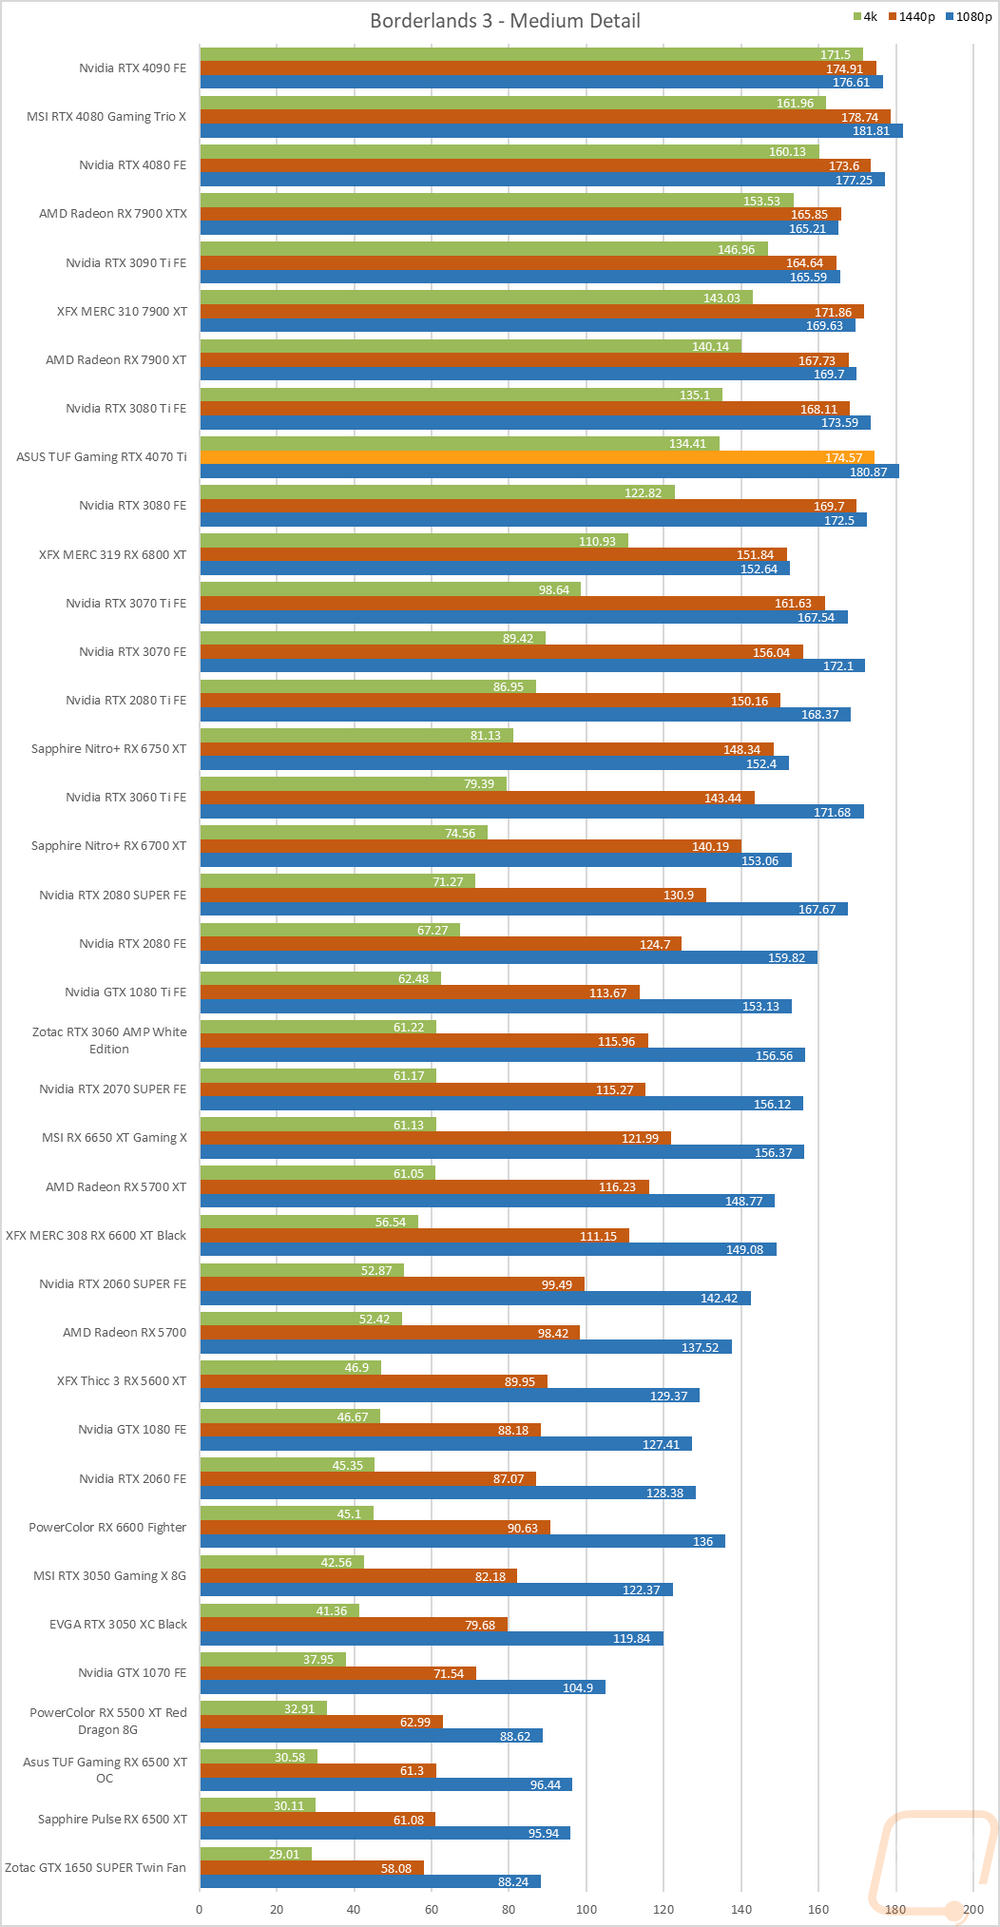
Borderlands 3 |
Built-in benchmark testing with the ultra detail setting and medium detail setting, done at full screen with default settings at 1080p, 1440p, and 4k on DX11 |
|
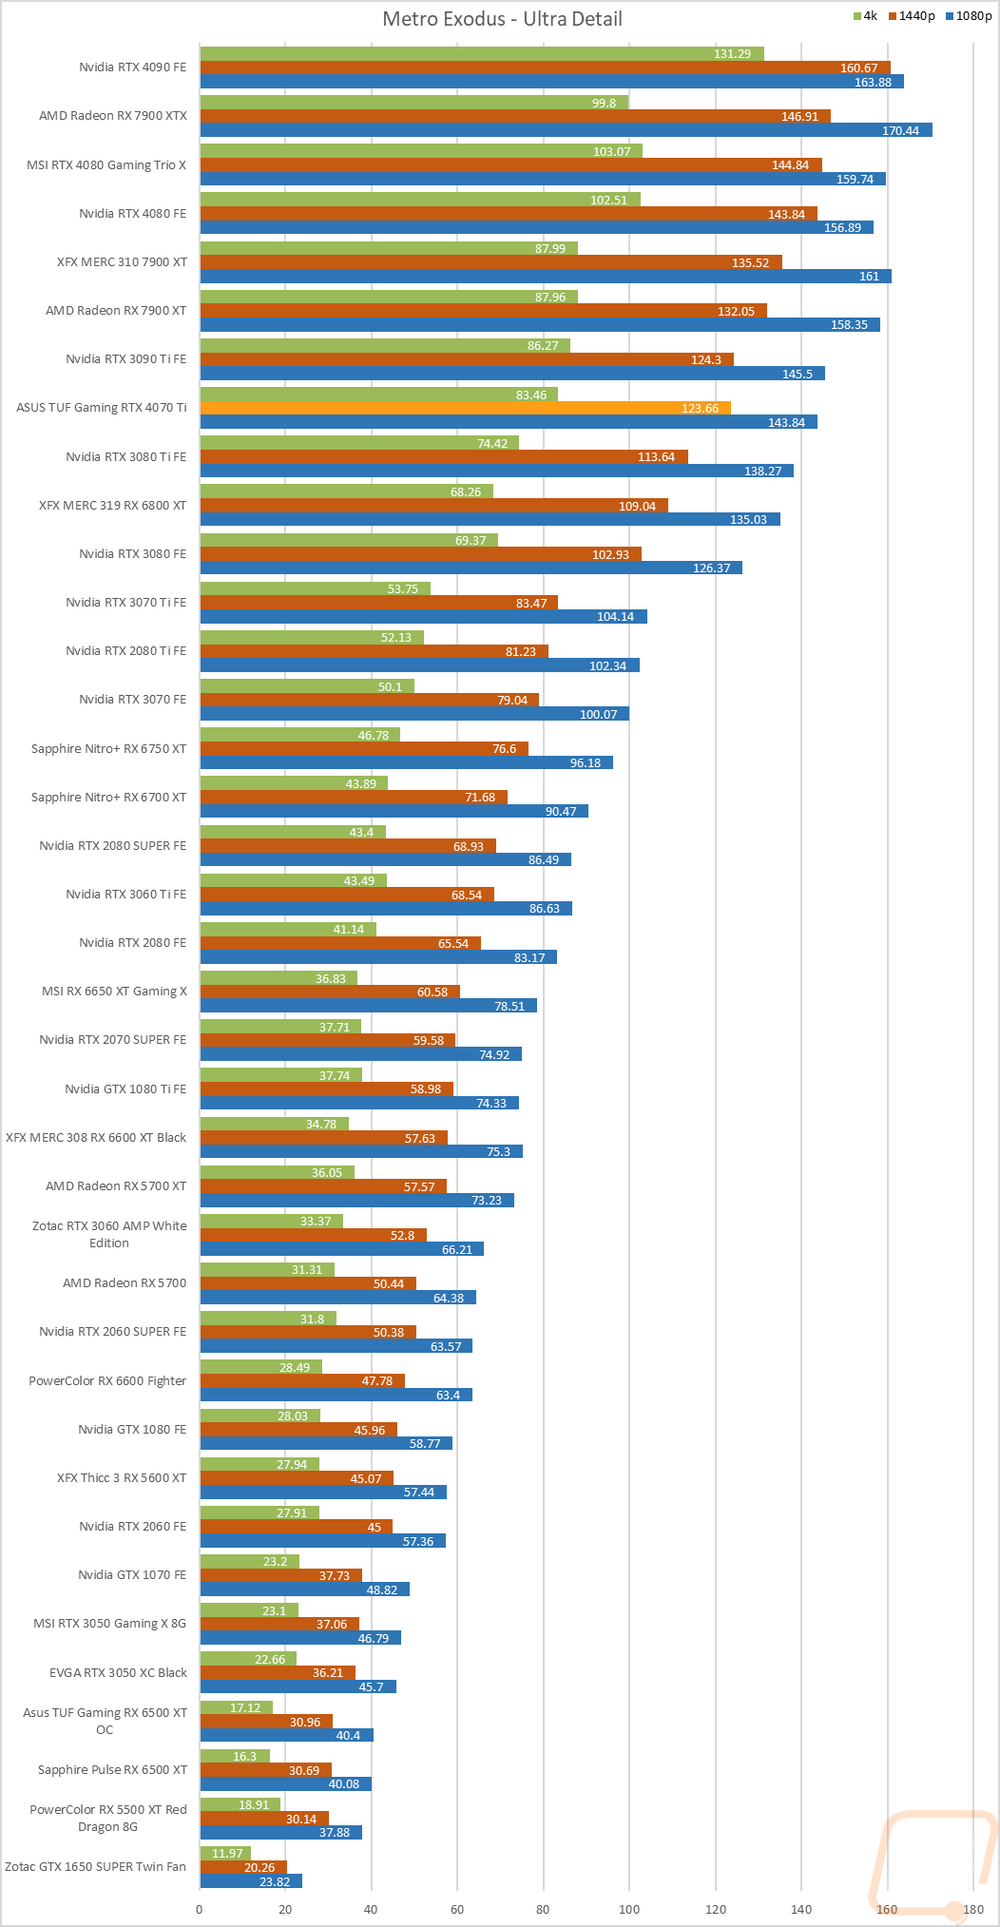
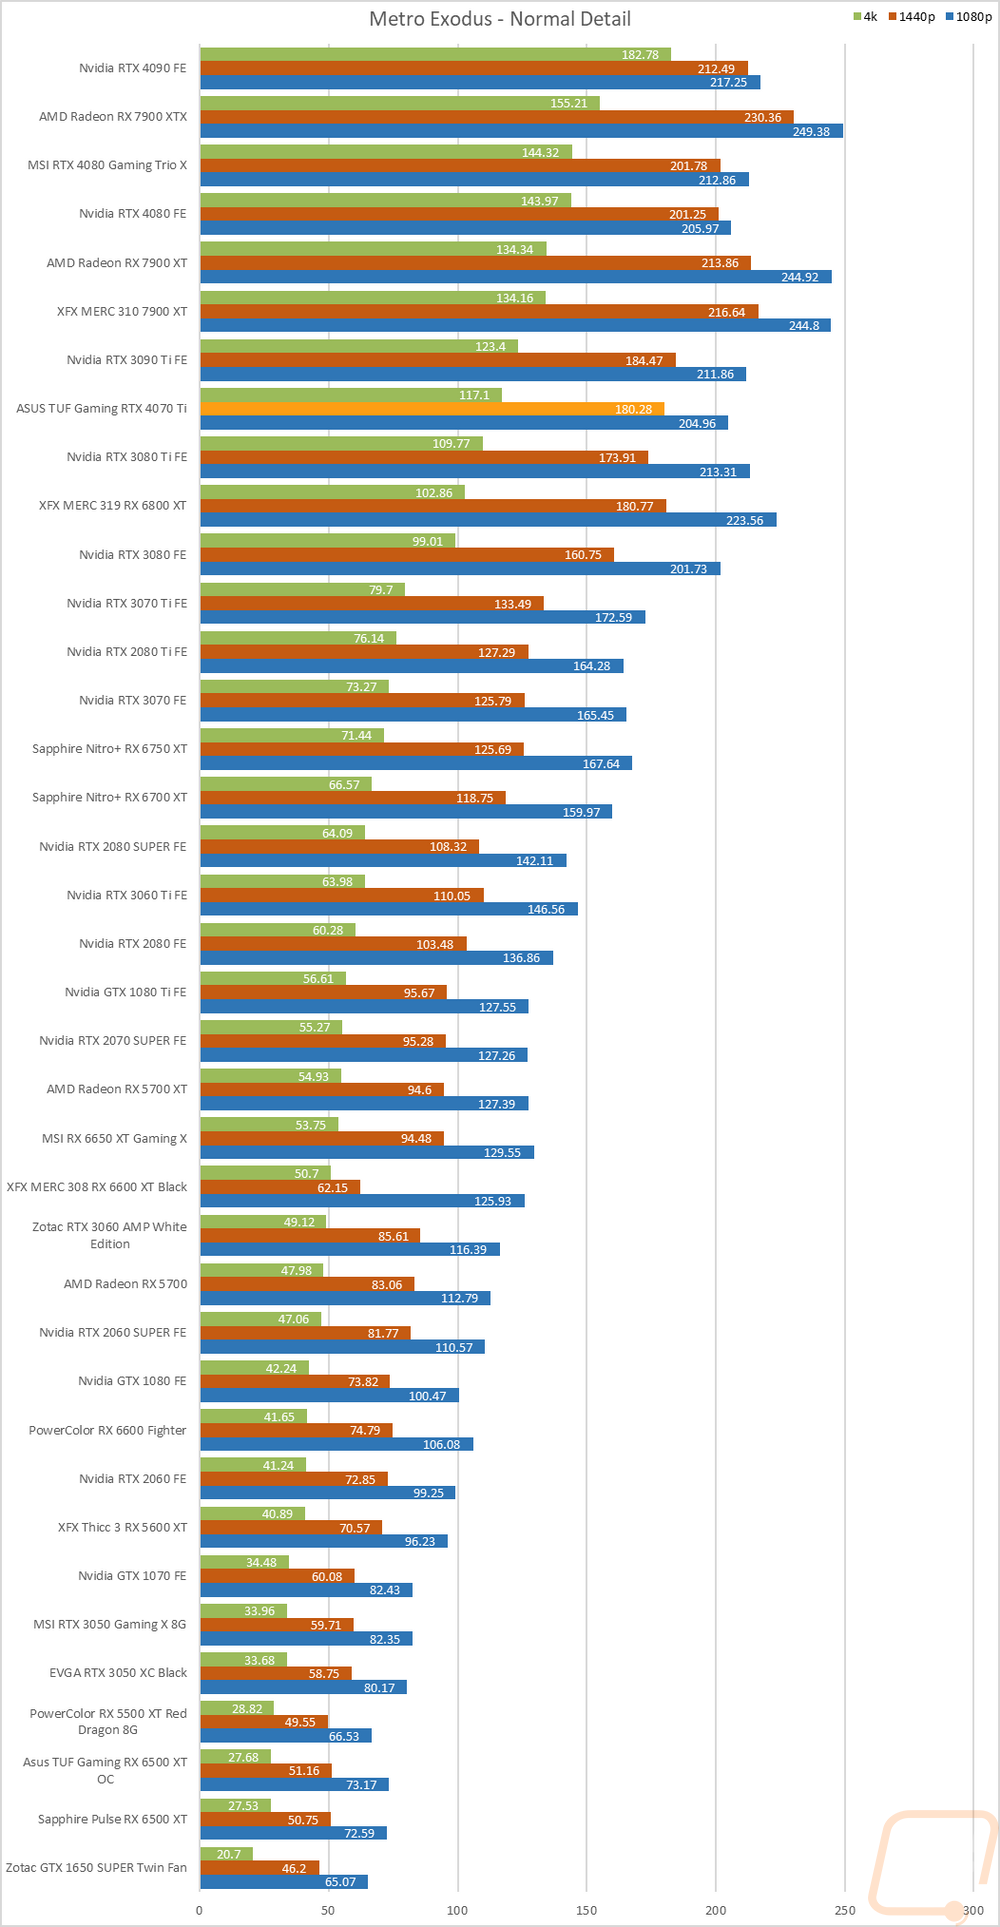
Metro Exodus |
Using built-in benchmark, testing at ultra and normal details at 1080p, 1440p, and 4k. I also do RTX and DLSS testing at 4K with the ultra-detail base settings for Nvidia cards as well. |
|
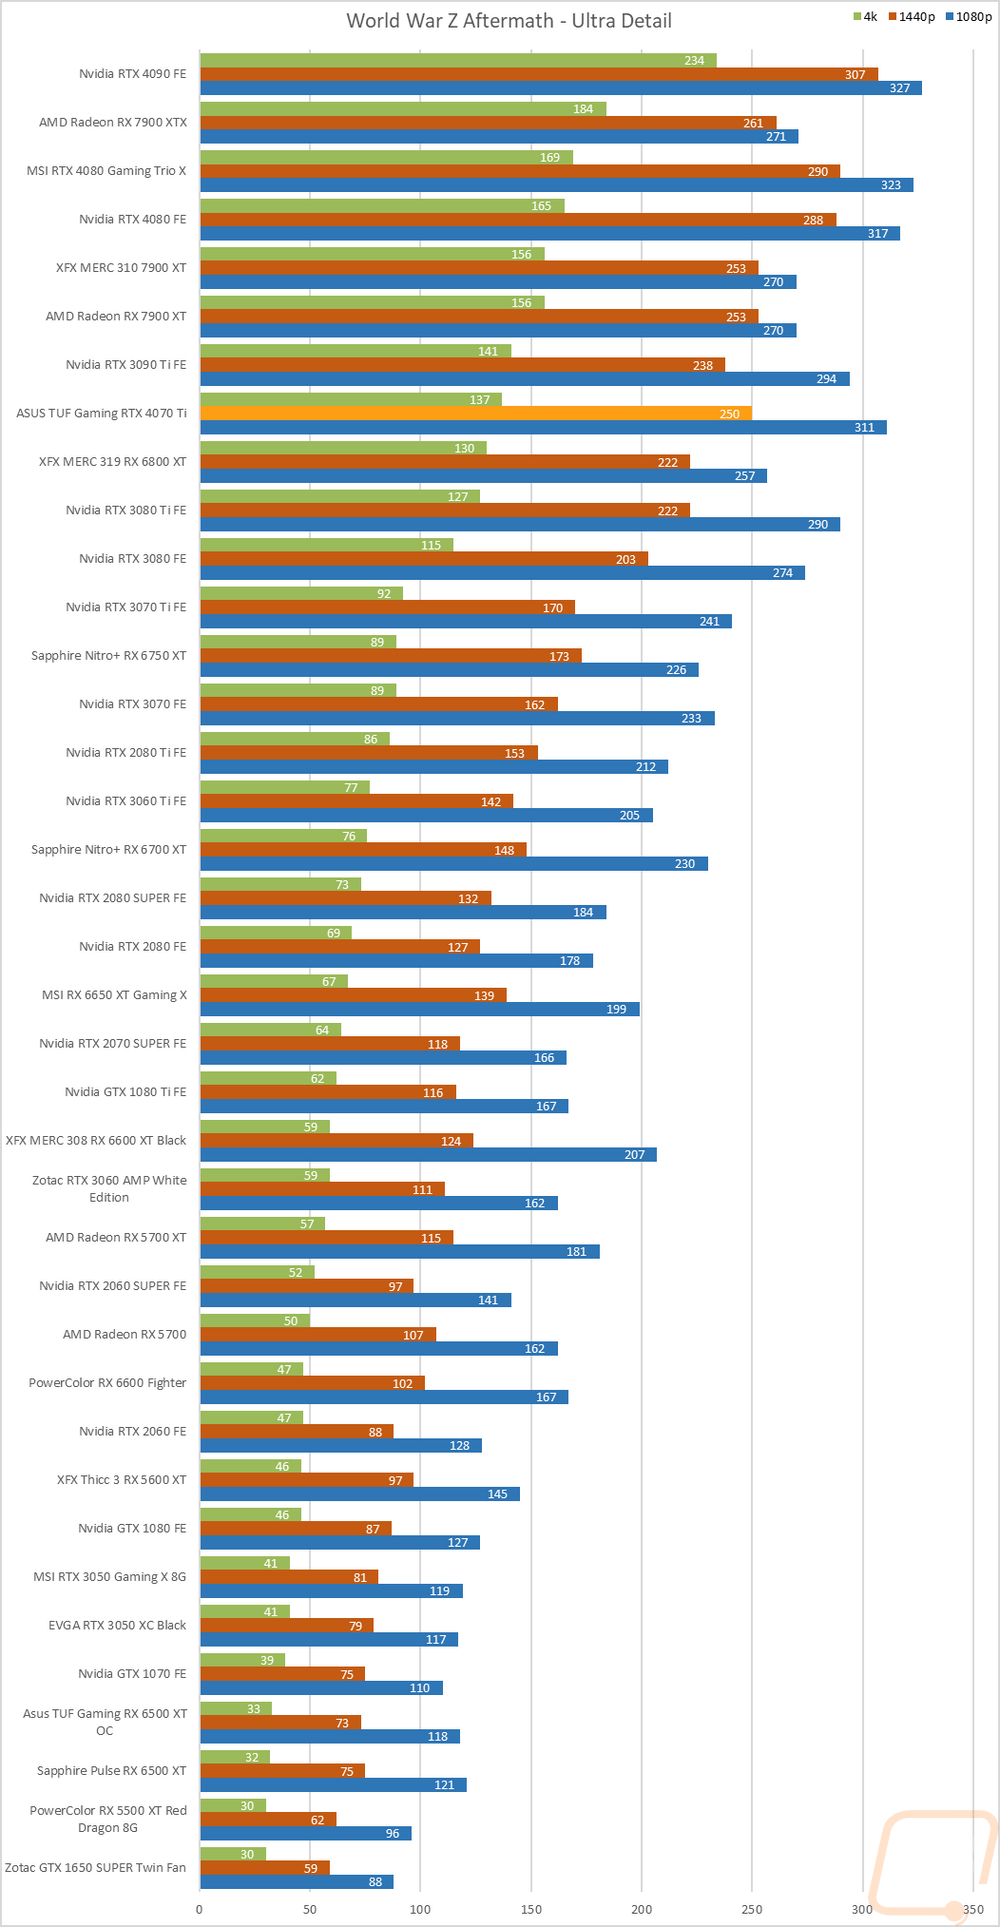
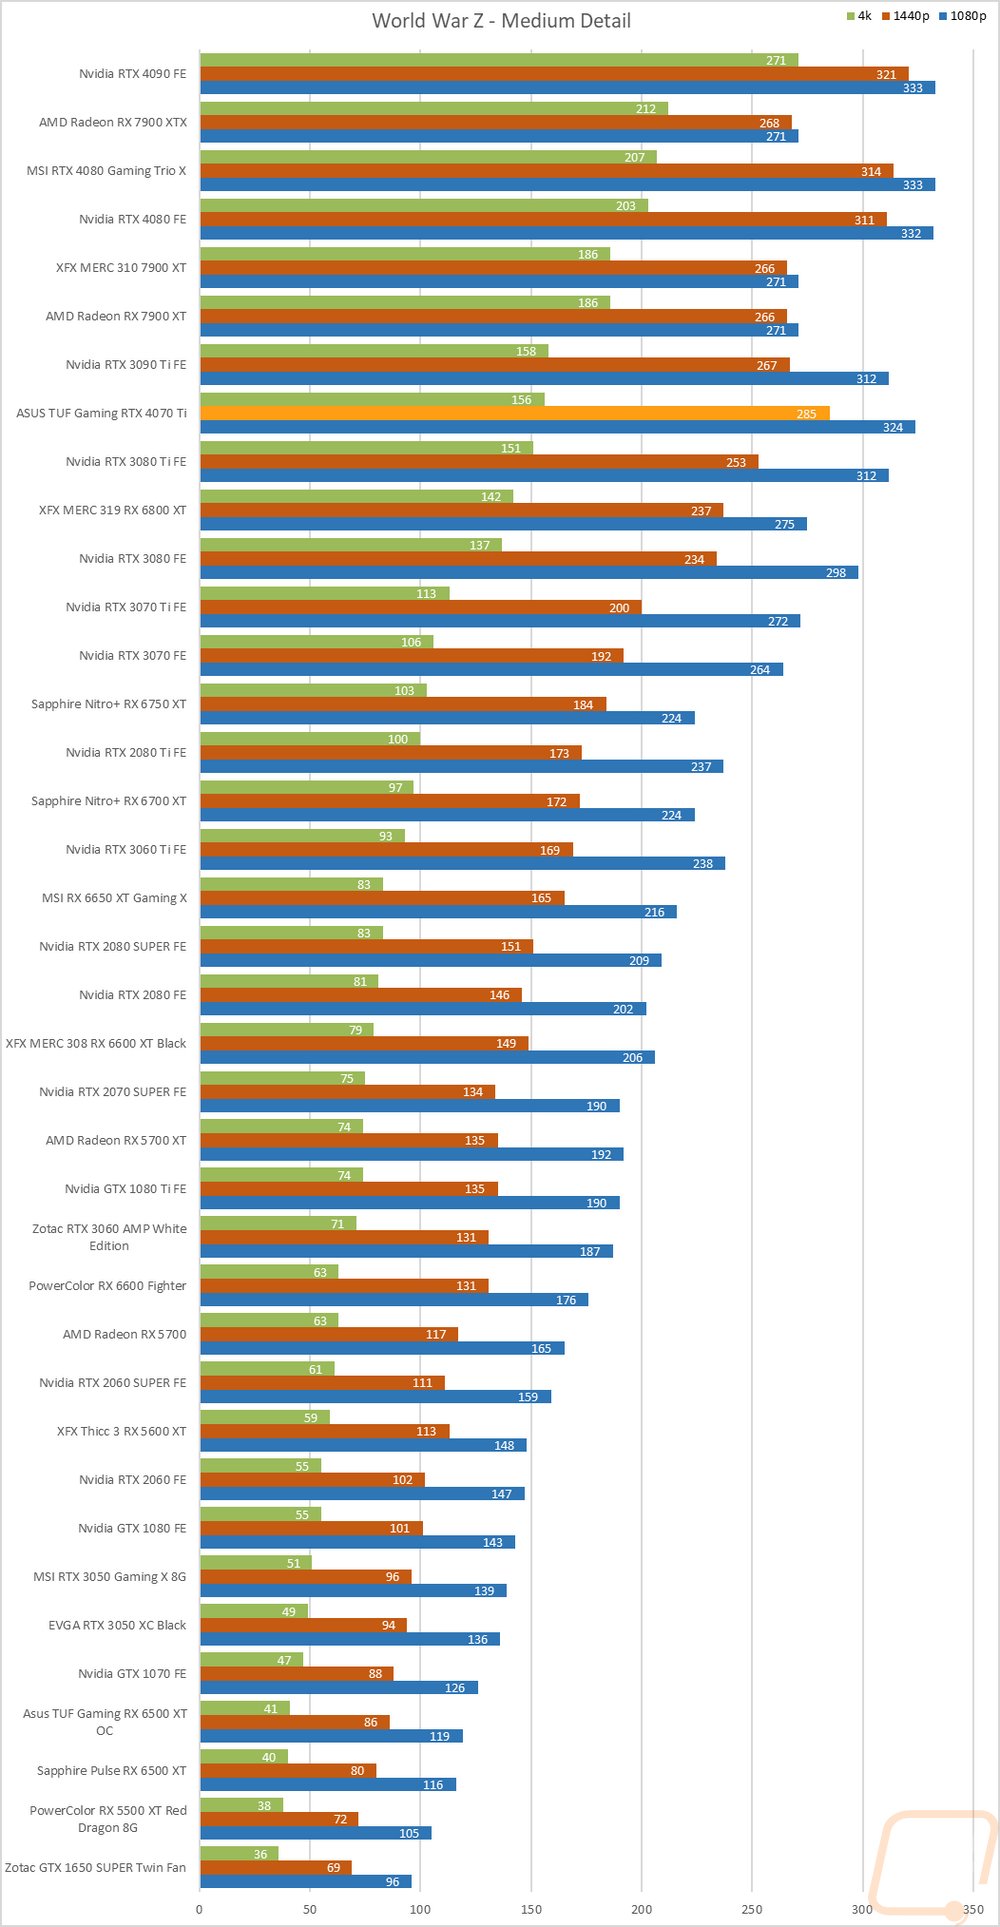
World War Z Aftermath |
Built-in benchmark in DX11 testing both the Ultra detail and Medium detail levels at 1080p, 1440p, and 4K resolutions |
|
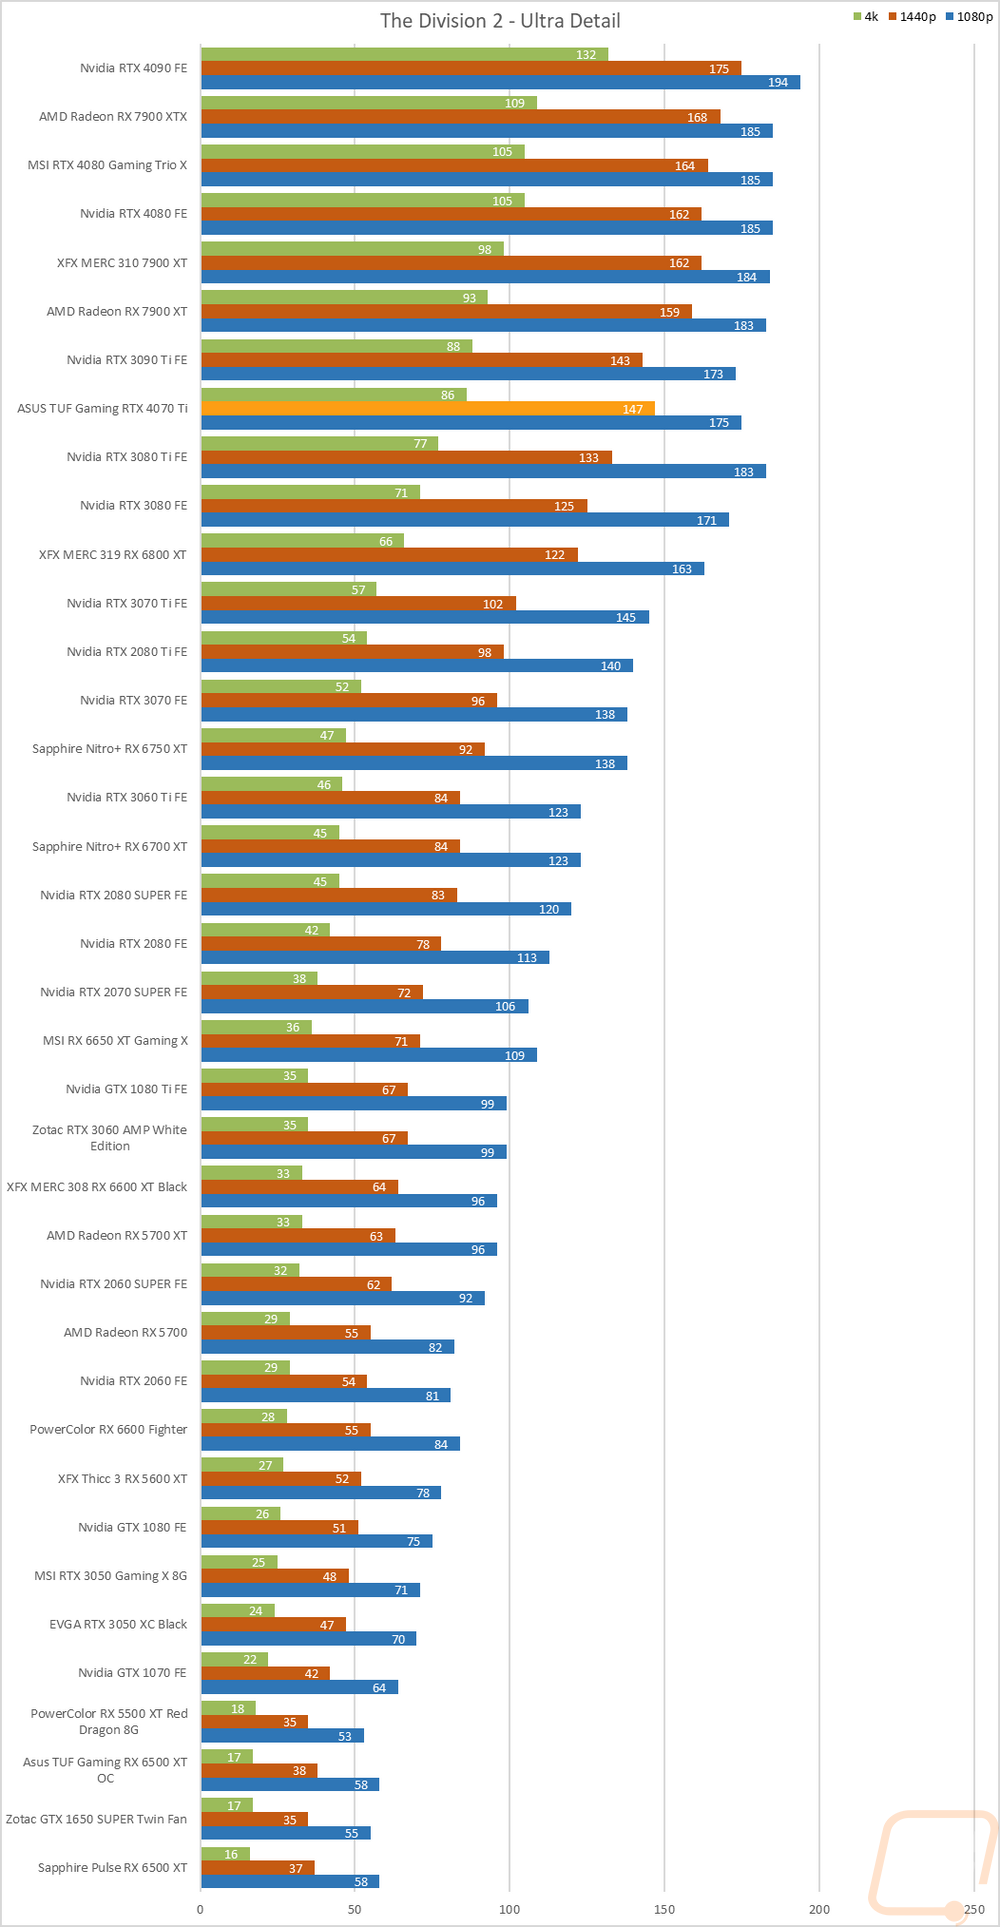
The Division 2 |
Built-in benchmark at Ultra detail with V-Sync turned off at 1080p, 1440p, and 4k resolutions. |
|
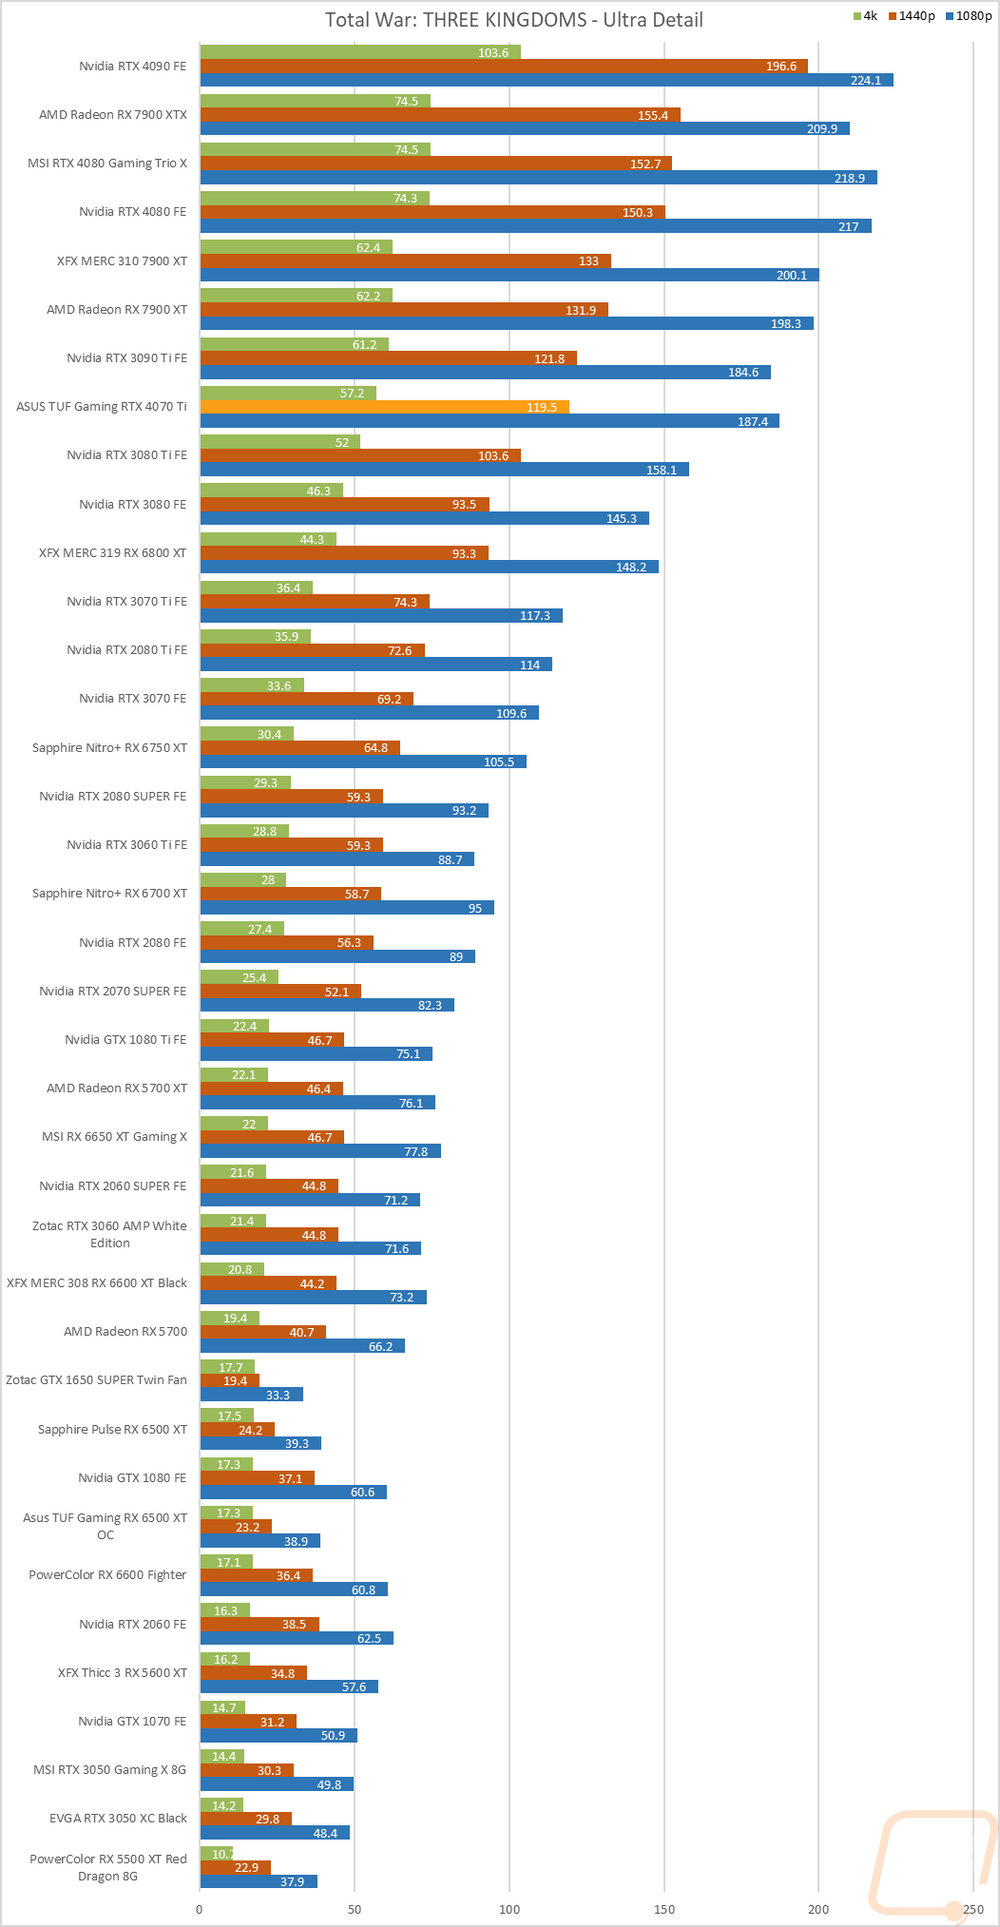
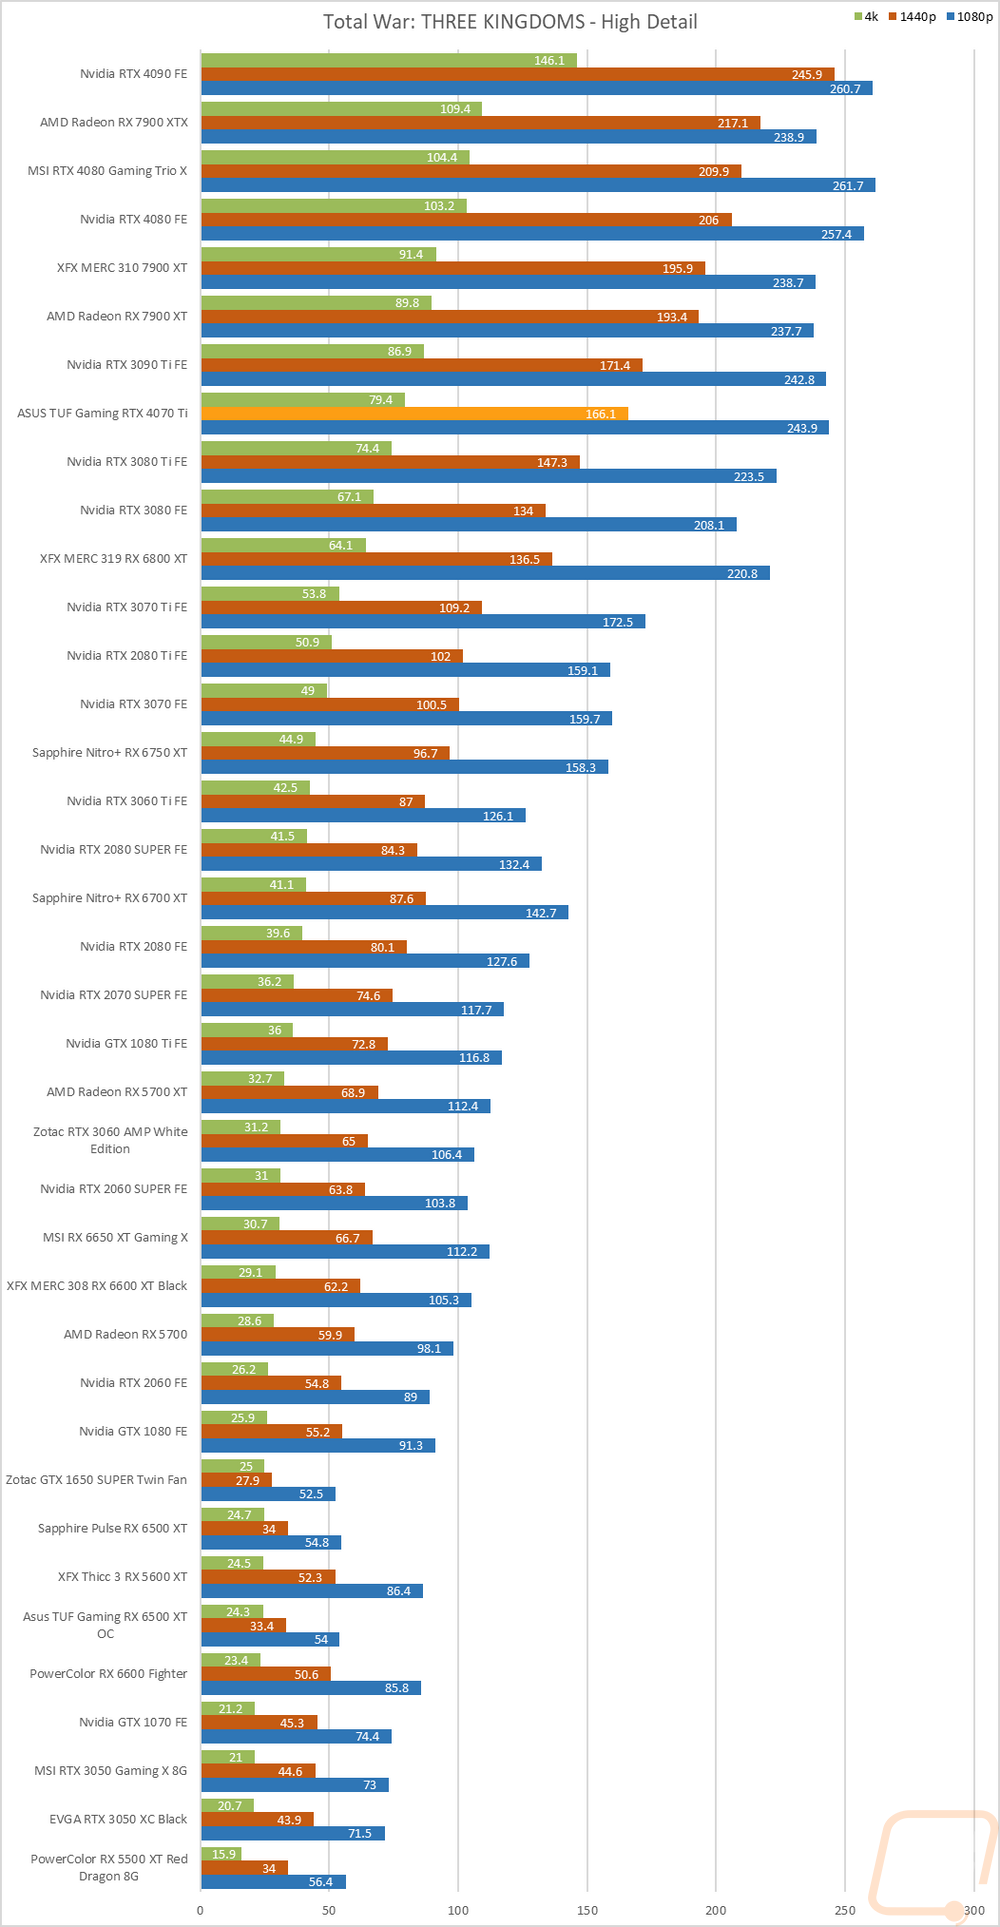
Total War: Three Kingdoms |
Built-in benchmark using the Battle Benchmark setting. Tested at 1080p, 1440p, and 4k at both high and ultra detail settings |
|
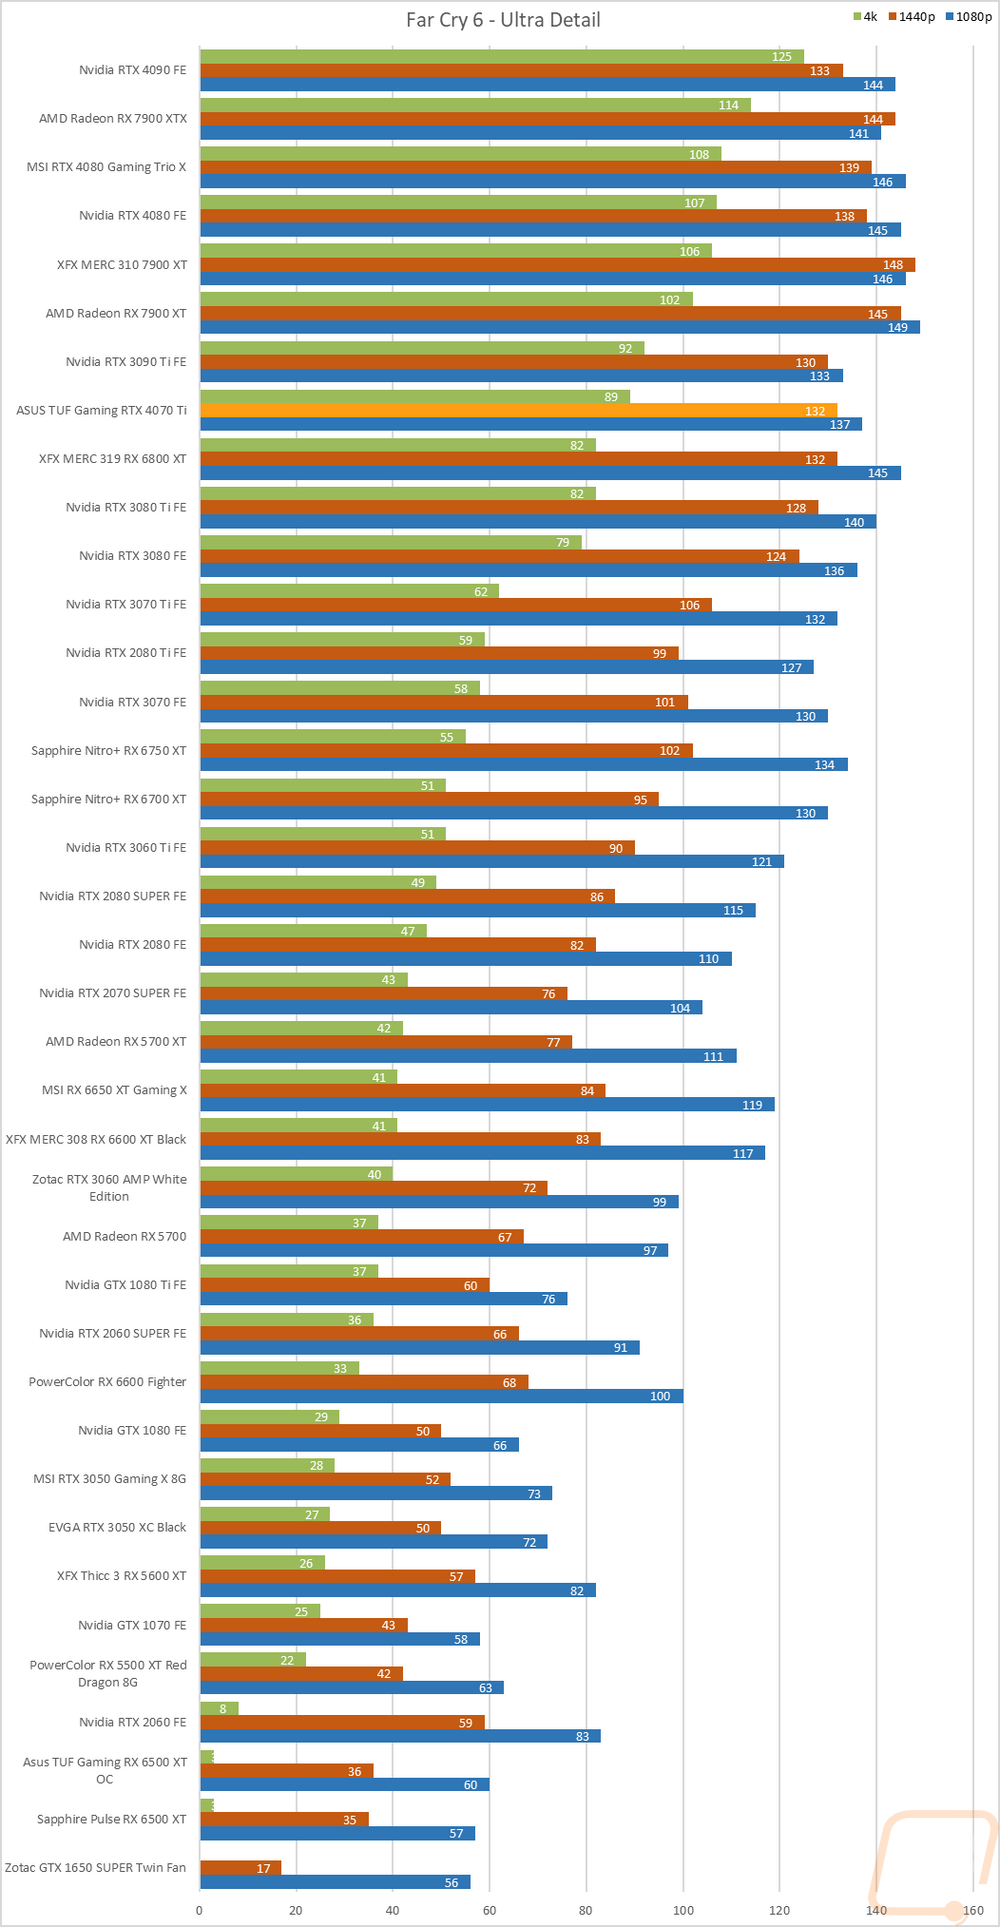
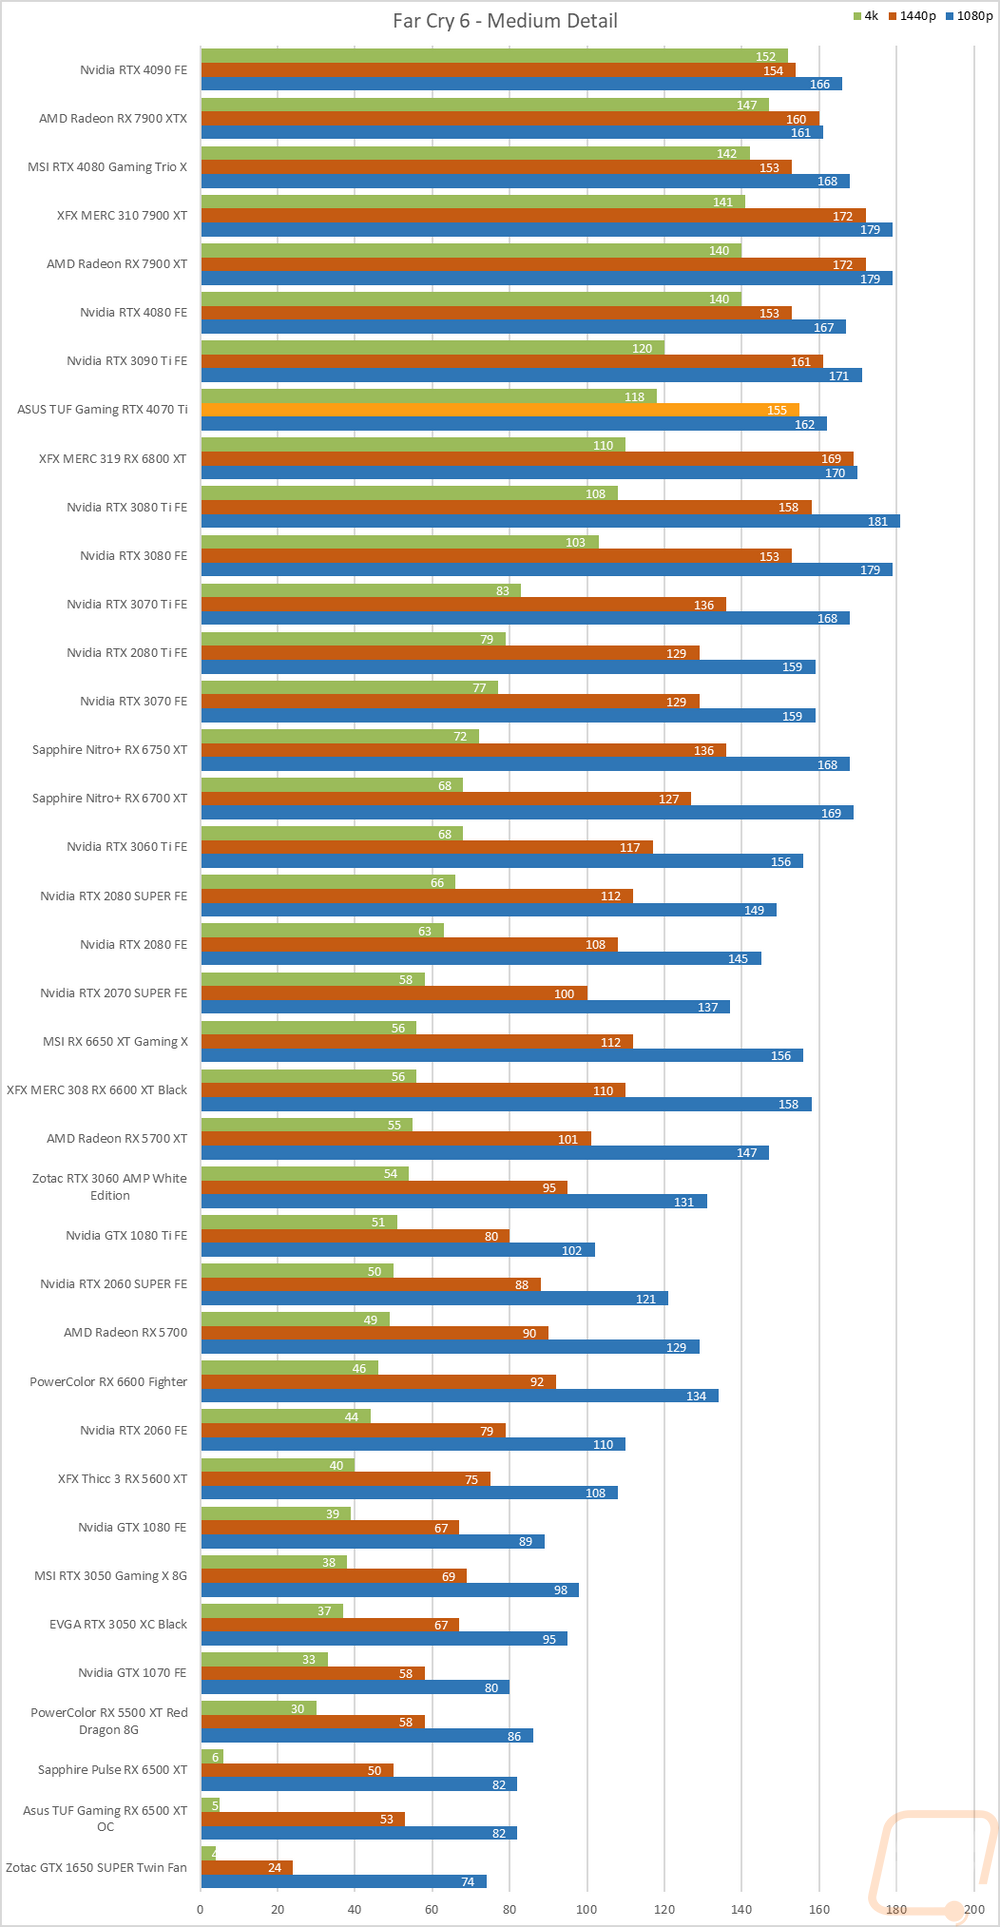
Far Cry 6 |
Built-in benchmark tested at 1080p, 1440p, and 4k with the Ultra and Medium detail settings |
|
V-Ray 5 |
V-Ray 5 benchmark us run with CUDA and RTX settings on cards that support it |
|
Boundary Benchmark |
Testing different DLSS detail levels on cards that support it. All testing is done at 4k with RTX on |
|
Bright Memory Infinite RTX Benchmark |
Benchmark all of the different RTX detail levels. Resolution at 4k and DLSS on balanced for each test |
|
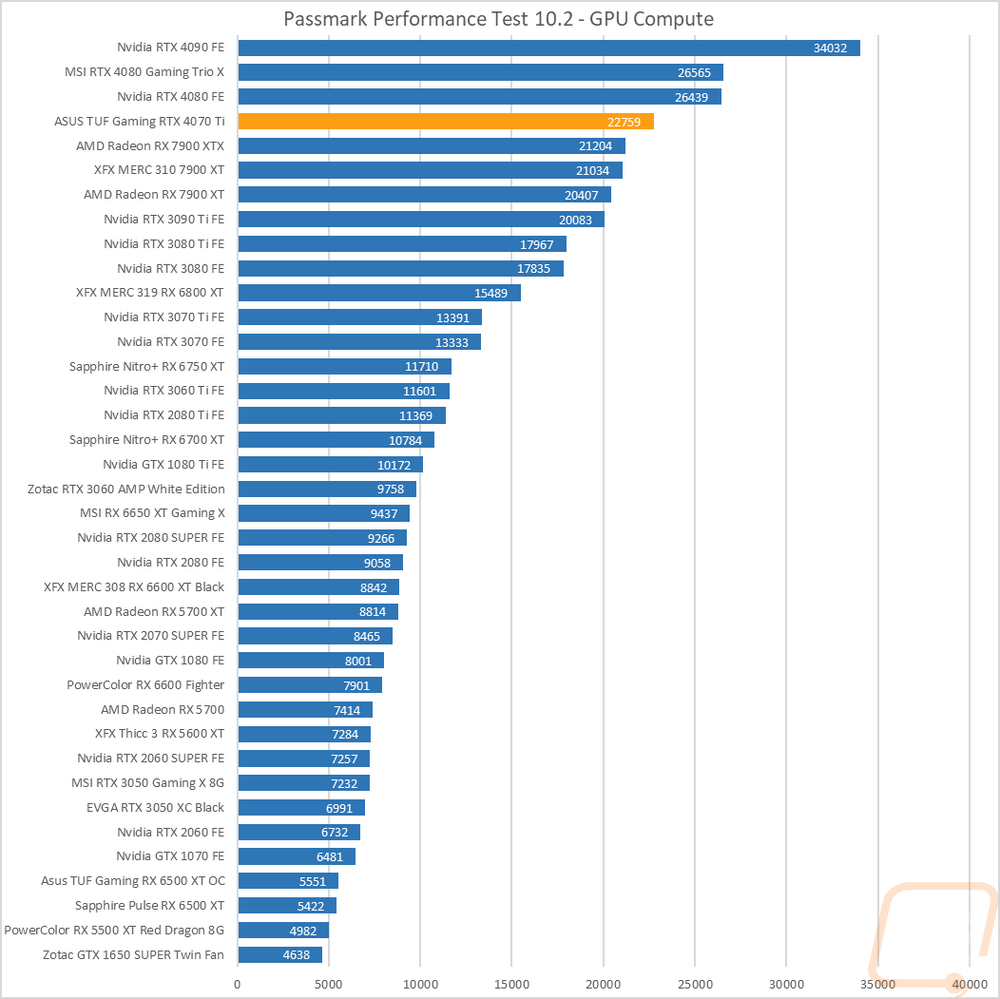
Passmark Performance Test 10.2 |
Test using the GPU Compute Score inside of Passmark’s Performance Test 10.2 |
|
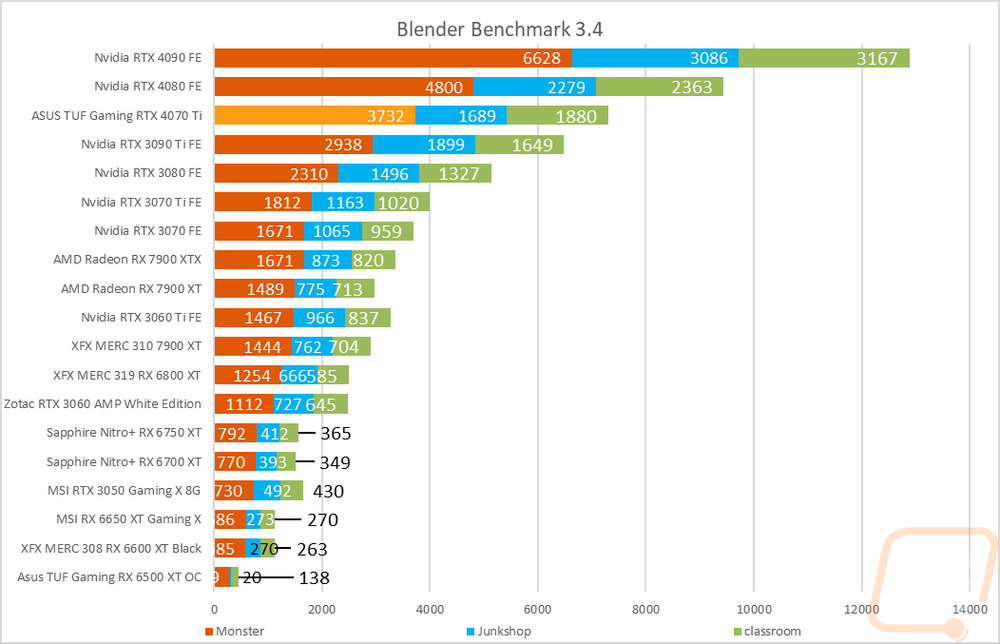
Blender |
Using the standard Blender Benchmark I run the test using the Blender 3.4 setting which tests using the Monster, Junkshop, and Classroom tests. |
|
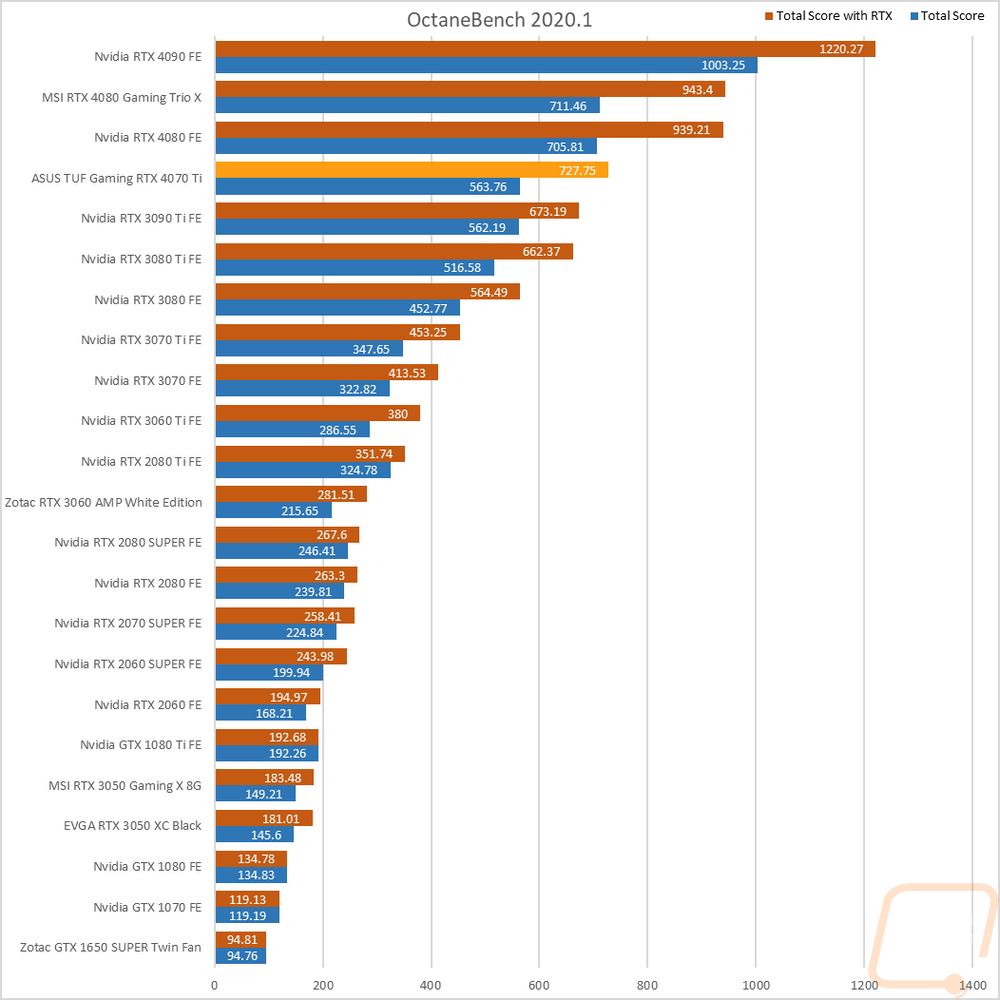
OctaneBench 2020.1 |
OctaneBench is designed to test rendering in OctaneRender. RTX and non-RTX are both ran. This is a CUDA-only test so only Nvidia cards are tested |
|
Power Testing |
Using a PCat v2 to monitor power between the PCIe slot and the card as well as power through the power cables I test the peak power when running ADIA64, 3DMark Speed Way, 3DMark Time Spy Extreme, FarCry 6 at 4k and Ultra Detail, Watch Dogs Legion at 4K and Ultra detail, and Blender 3.4.0. The results are then averaged as well as the highest result. |
|
Noise Testing |
Our Noise testing is done using a decibel meter 18 inches away from the video card on the bottom/fan side of the card. We test at 50% and 100% fan speeds as well as a third test while under load using AIDA64's stress test. This is done using a Protmex PT02 Sound Meter that is rated IEC651 type 2 and ANSI S1.4 type 2. Tests are done set weighted to A and set to a slow response using the max function. The ambient noise level in the testing area is 33.3 decibels. |
|
Temperature Testing |
Using AIDA64, the GPU stress test is run for 30 minutes or until the result has leveled off. The test is run twice, once with the stock fan profile and a second time with 100% fan speed. During this, I also document the 100% fan speed RPM and document the delta between the fan profile and 100% fan speed as well as get thermal images. |
Synthetic Benchmarks
As always I like to start my testing with a few synthetic benchmarks. 3DMark especially is one of my favorites because it is very optimized in both Nvidia and AMD drivers. It's nice to not have to worry about it being favored too much either way and the repeatability of the results makes it a nice chance to compare from card to card, especially when comparing with the same GPU. In this case, this is our first 4070 Ti, so my focus is mostly on how the 4070 Ti compares to the RTX 4080, the RTX 3070, and the 3070 Ti from the last generation, and AMD's recently launched RX 7900 XT.
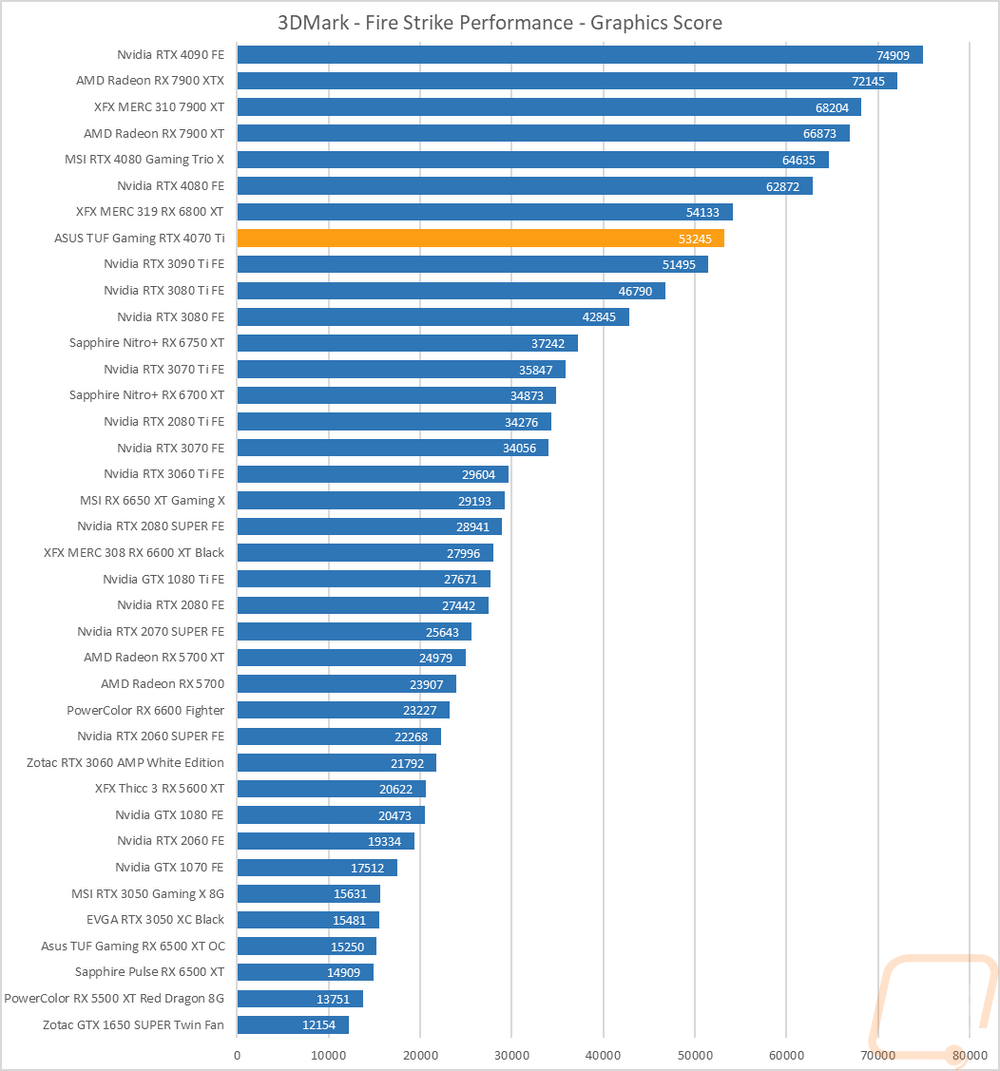
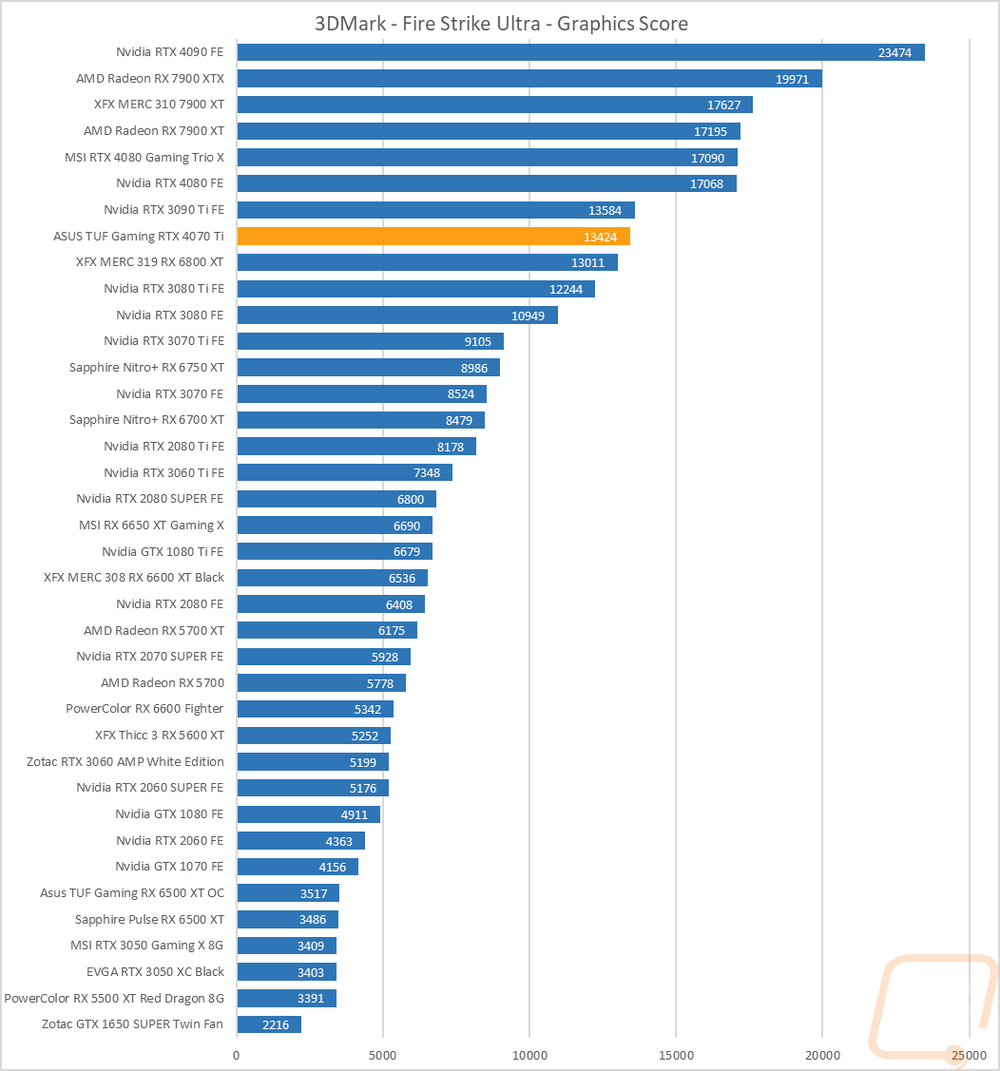
The first round of tests were done in the older Fire Strike benchmark which is a DX11 test. There are three detail levels, performance, extreme, and ultra. The TUF Gaming RTX 4070 Ti OC scored a 53245 on the base Fire Strike test which put it behind last year's overclocked RX 6800 XT but ahead of the RTX 3090 Ti. In Fire Strike Extreme it jumped ahead of the 6800 XT but in the Ultra test, the 3090 Ti improved and jumped ahead of it. Nvidia’s performance in the older DX11 Fire Strike benchmark is always lower but it is cool to see it outperforming last generation's flagship in two out of the three tests.

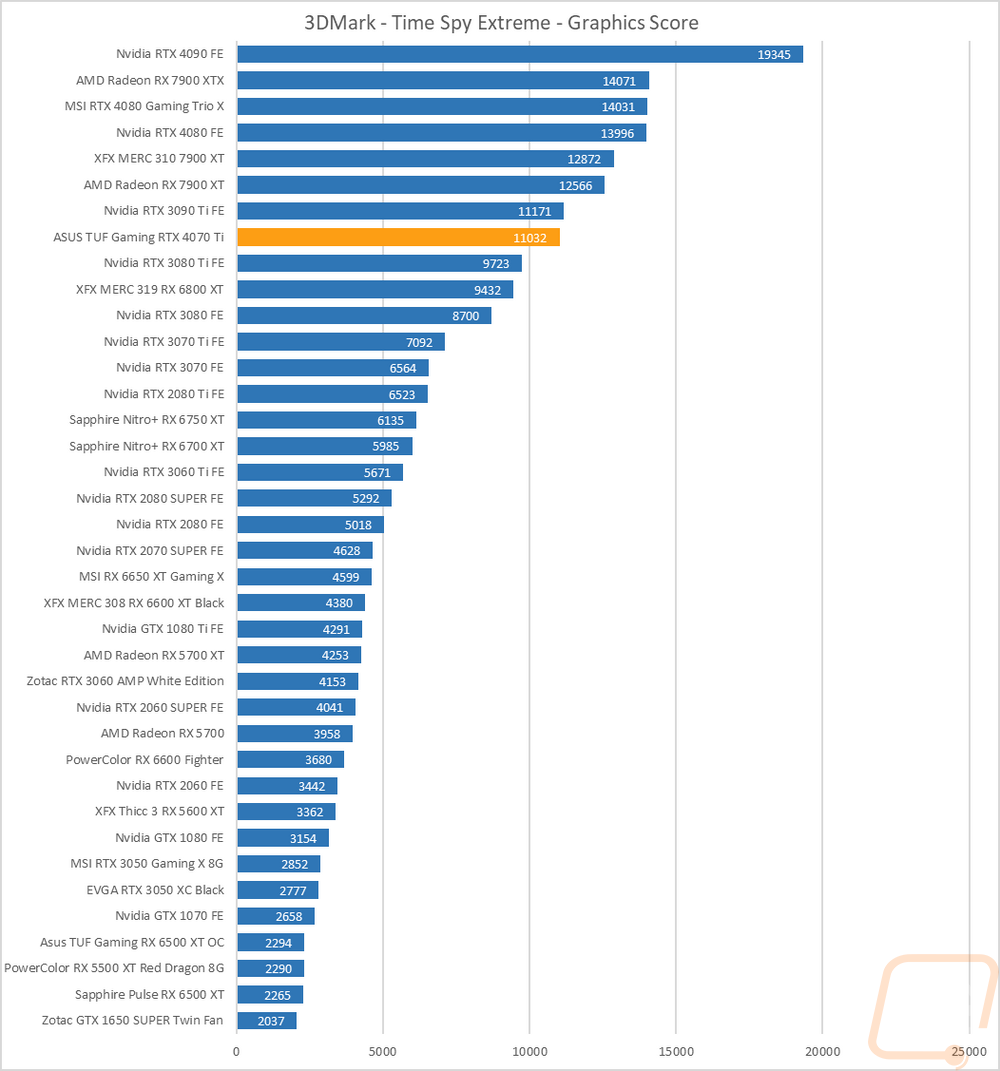
The next two were both based on the Time Spy benchmark. One is the standard test and then there is the extreme detail level. The TUF Gaming RTX 4070 Ti OC improved a lot compared to the 6800 XT here with it sitting 3000 points higher in the base Time Spy test. This was 1475 points higher than the 3090 Ti but still way behind the new 7900 XT. In the Time Spy Extreme benchmark the 3090 Ti edged it out just slightly but it is still sitting well behind the 7900 XT. Looking at the 3070 Ti to the TUF Gaming RTX 4070 Ti OC however is a 55.5% performance increase which is huge.

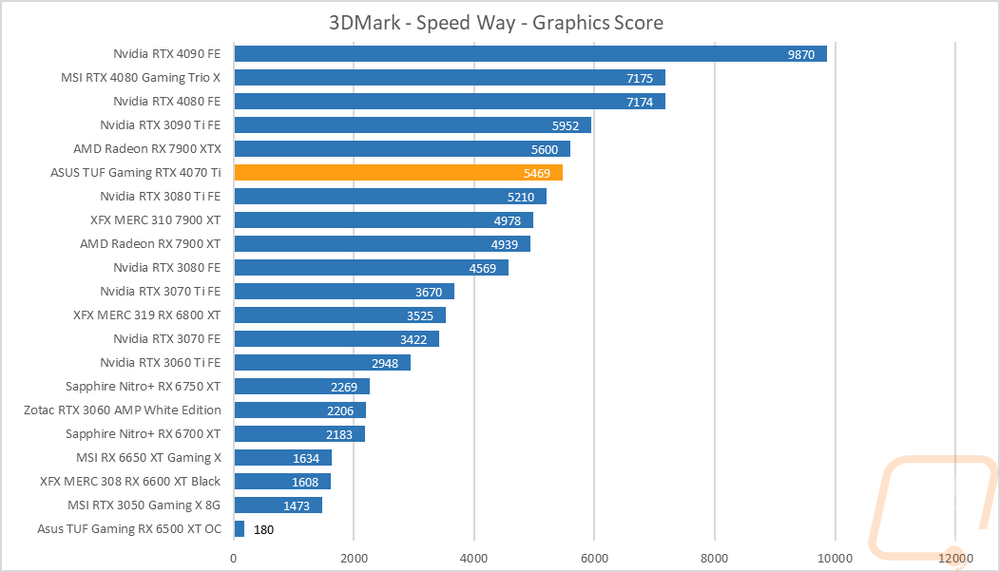
I did also test using the new 3DMark Speed Way which is their latest benchmark. Speed Way is DX12 as well but adds in more future-focused tech like Ray Tracing which up until now 3DMark has only used in feature tests. Here the TUF Gaming RTX 4070 Ti OC performed significantly better with it jumping ahead of both of the 7900 XTs that we have tested and is sitting just behind the RX 7900 XTX. It’s above the RTX 3080 Ti but below the 3090 Ti and is 1700 points behind the RTX 4080.
The last test was using the Unigine-based Superposition benchmark and I tested at 1080p with the extreme detail setting as well as the 4K optimized setting. In the 4k setting, the TUF Gaming RTX 4070 Ti OC scored a 12519 putting it behind the RTX 3090 Ti and ahead of the 3080 Ti which is great company but the 7900 XT is well ahead of it up at 14104 for its score. The extreme detail 1080p results are similar as well.

VR Benchmarks
As for Virtual Reality, I love it but it is more demanding than traditional gaming. This is partially because of the resolutions needed to render for two eyes and because they render more than what is immediately visible. But also because of post effects to get the proper “fisheye” effect for it to look proper in your eyes with the HMD. You also have to have much higher expectations for frame rates in VR, skipping frames or lower FPS can cause motion sickness in VR. Because of that, I ran a few tests.
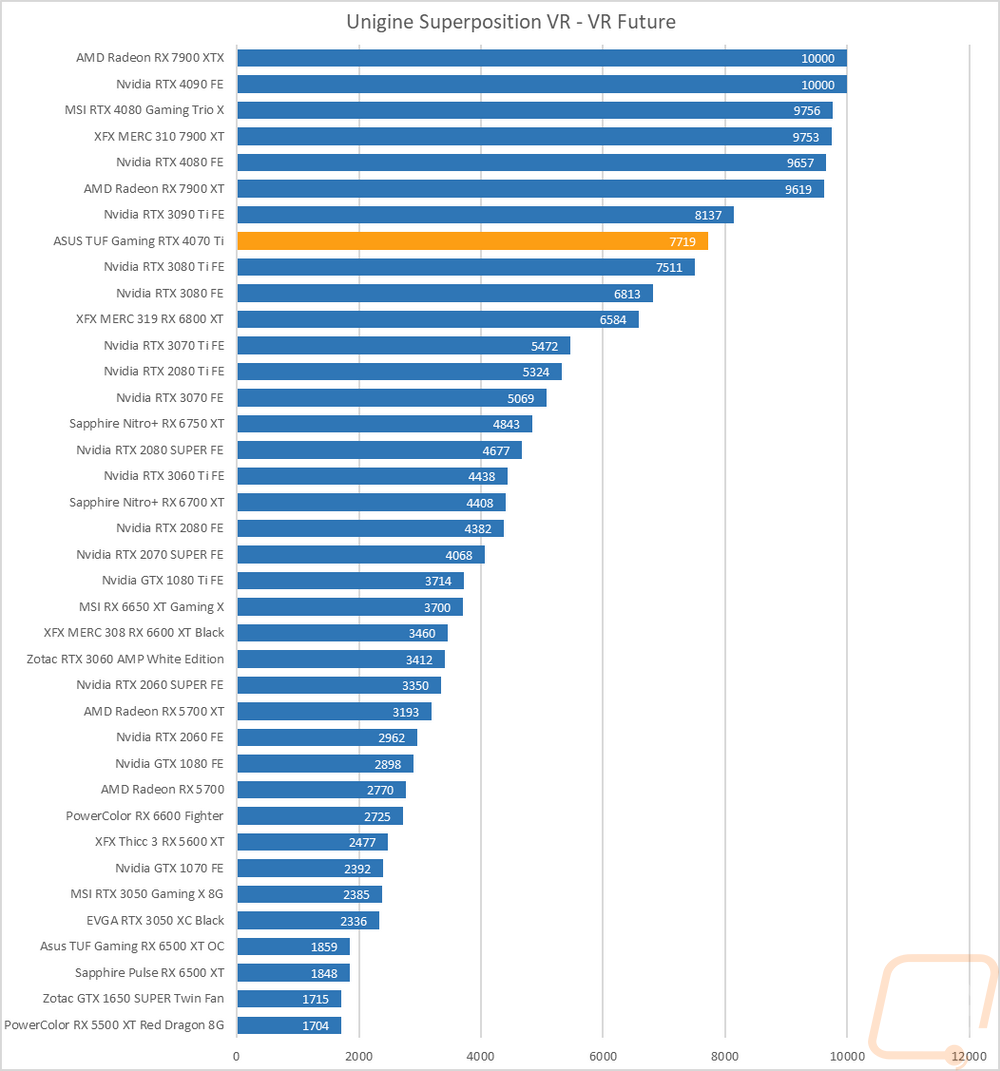
My first test was again in Superposition. This time I tested the VR Future test using the Oculus resolution. Here the TUF Gaming RTX 4070 Ti OC came in sitting between the RTX 3090 Ti and the RTX 3080 Ti. This was well below the 7900 XT which scored a 9619 but still good when compared to past Nvidia cards.
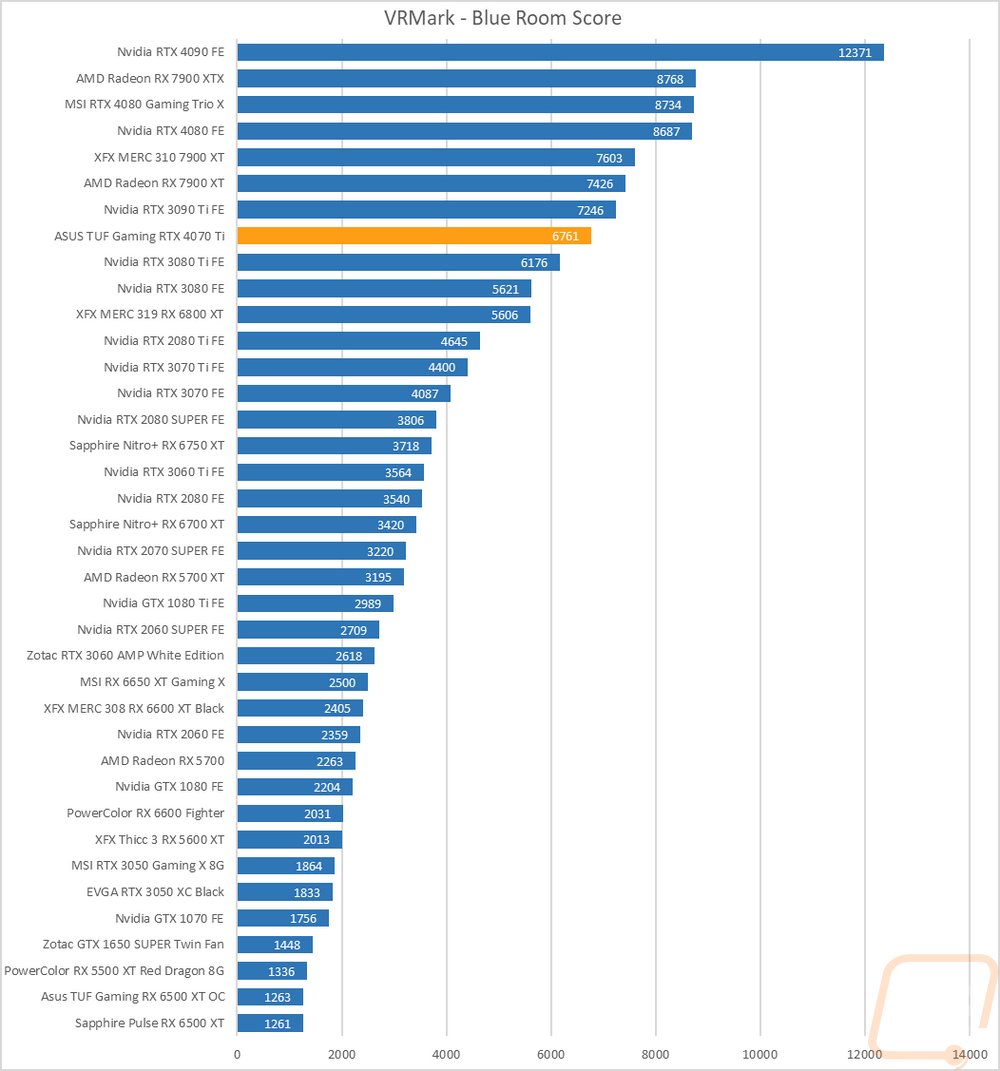
My second round of VR testing was in VRMark which has three tests that are similar to the VR tests in Superposition. I only focused on just the most demanding test called Blue Room which is looking more at future VR performance. The TUF Gaming RTX 4070 Ti OC performed here just like it did in the Superposition test sitting again between the 3080 Ti and the 3090 Ti.
In-Game Benchmarks
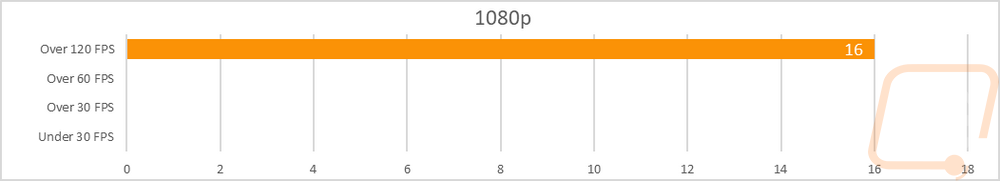
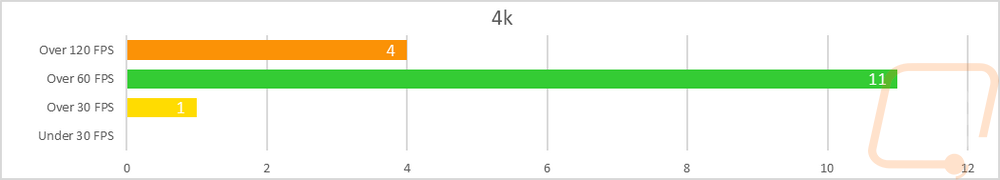
Now we finally get into the in game performance and that is the main reason people pick up a new video card. To test things out I ran through our new benchmark suite that tests 10 games at three different resolutions (1080p, 1440p, and 4k). Most of the games tested have been run at the highest detail setting and a mid-range detail setting to get a look at how turning things up hurts performance and to give an idea of if turning detail down from max will be beneficial for frame rates. In total, each video card is tested 54 times and that makes for a huge mess of results when you put them all together. To help with that I like to start with these overall playability graphs that take all of the results and give an easier-to-read result. I have one for each of the three resolutions and each is broken up into four FPS ranges. Under 30 FPS is considered unplayable, over 30 is playable but not ideal, over 60 is the sweet spot, and then over 120 FPS is for high refresh rate monitors.
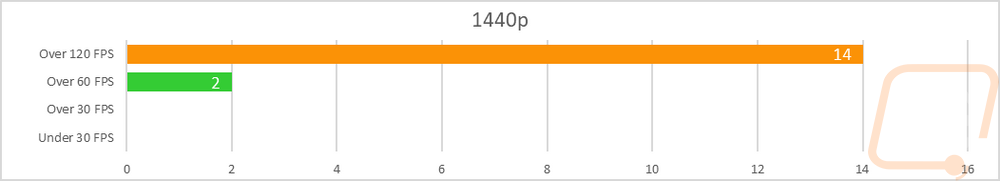
So how did the TUF Gaming RTX 4070 Ti OC do? Well like with the 4080 and 4090, the TUF Gaming RTX 4070 Ti OC dominated all of our 1080p tests. But unlike those other cards, the TUF Gaming RTX 4070 Ti OC is the first of the newest generation of Nvidia cards to not also have every 1440p result at 120 FPS or higher. This time around there were two results in the 60-119 range which is still extremely impressive but not completely dominant. Then at 4K which is a resolution Nvidia isn’t targeting with the 4070 Ti, the TUF Gaming RTX 4070 Ti OC still did well with only one result under 60 FPS. With 11 results in the 60-119 range, a majority are still in the green and there were 4 results still up over 120 FPS as well.
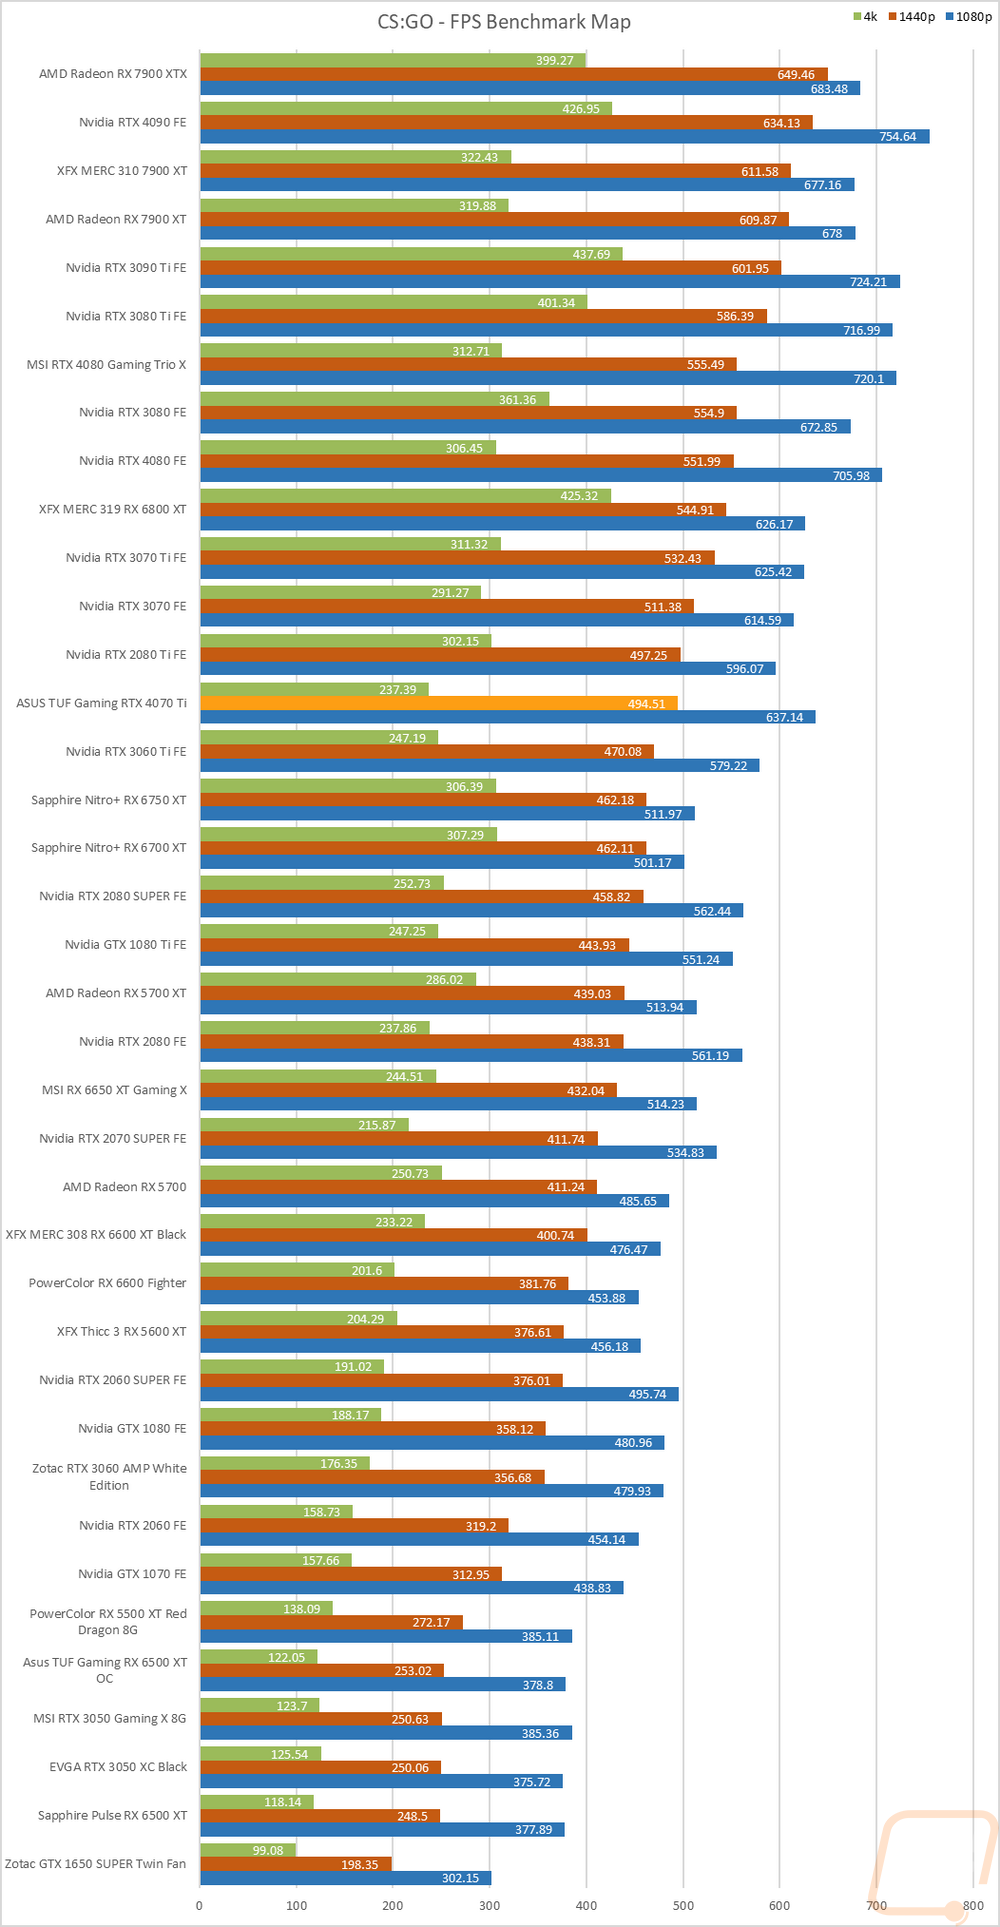
Of course, I have all of the actual in game results as well for anyone who wants to sort through the wall of graphs below. As I mentioned before, with the RTX 4070 Ti I am curious to see how it compares with the RTX 4080, AMD’s 7900 XT, and Nvidia’s last generation of cards. In our synthetic tests with DX12 tests the TUF Gaming RTX 4070 Ti OC traded blows with the RTX 3090 Ti which was a nice surprise but wasn’t in the range of the 7900 XT which was up with the 4080. I averaged out our results across the four cards at all three resolutions below and you can see the same result while in game. The 1080p results are a wash because of being CPU limited in some games, but it is interesting to see how well the 4070 Ti did there. At 1440p which was Nvidia’s focus the TUF Gaming RTX 4070 Ti OC outperformed the 3090 Ti by 5 FPS but isn’t up to the 7900 XT’s or 4080’s performance. Then at 4K the limitations with the memory bus on the 4070 Ti show up and the performance drops below the 3090 Ti.
|
|
TUF Gaming RTX 4070 Ti OC |
Nvidia 3090 Ti FE |
AMD RX 7900 XT |
Nvidia 4080 FE |
|
1080p |
193 |
188 |
189 |
201 |
|
1440p |
165 |
160 |
173 |
182 |
|
4K |
103 |
106 |
117 |
126 |
Compute Benchmarks
Now some people don’t need a video card for gaming, they need the processing power for rendering or 2D/3D production, or in some cases people who game also do work on the side. So it is also important to check out the compute performance on all of the video cards that come in. That includes doing a few different tests. My first test was a simple GPU Compute benchmark using Passmark’s Performance Test 10 and the TUF Gaming RTX 4070 Ti OC scored 22759 which put it up ahead of the RX 7900 XT and 7900 XTX as well as all of Nvidia’s cards from the last generation including the RTX 3090 Ti.
Blender is always my favorite compute benchmark because the open-source 3D rendering software is very popular and it isn’t a synthetic benchmark. With the latest version of Blender, they redid the benchmark so we now have a new test that runs three different renderings and gives each a score. I have all three stacked together so we can see the overall performance. The TUF Gaming RTX 4070 Ti OC did well here as well outperforming the RTX 3090 Ti and AMD's new cards aren’t even in the same zip code due to the performance improvement that Blender sees with Nvidia’s Optix.
For CUDA-based cards, I also check out OctaneRender performance using their OctaneBench 2060.1 benchmark which allows me to check out both RTX and non-RTX rendering performance. Here was more of the same with the TUF Gaming RTX 4070 Ti OC sitting behind the RTX 4080 by a good margin but out in front of the RTX 3090 Ti when testing with RTX and almost tied with the 3090 Ti when not using RTX.
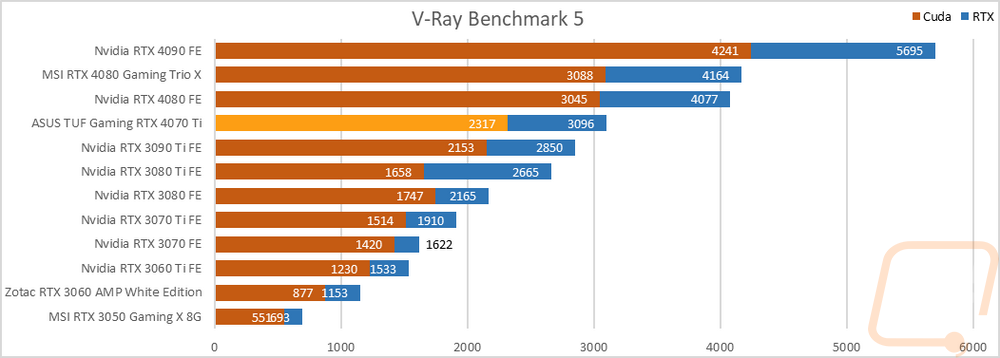
For an additional CUDA-based test I also ran V-Ray Benchmark 5 to check out CUDA and RTX performance in the 3D rendering and simulation software. The TUF Gaming RTX 4070 Ti OC scored 2317 with CUDA and with RTX which improved things up to 3096. This put it ahead of the RTX 3090 Ti on both tests but there is a big gap between it and the RTX 4080.
RTX and DLSS
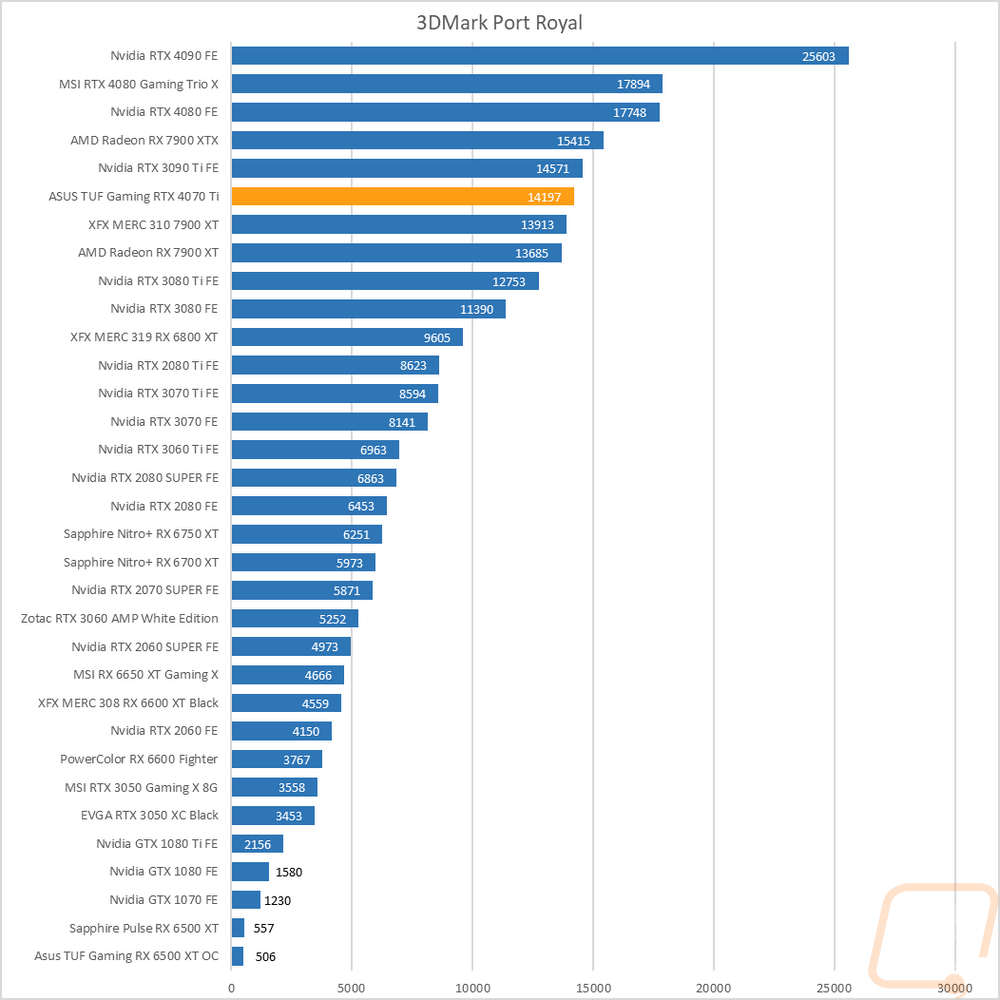
Being an RTX card I also like checking out the performance of some of Nvidia’s features. Namely the ray tracing performance and the performance improvements you can see by using DLSS combined with the tensor cores. My first test goes back to our synthetic benchmarks with 3DMark where I check out their Port Royal benchmark. This is the one test that does also have AMD Ray Tracing support which is great to get a look at how different cards including older non-RTX cards perform. The TUF Gaming RTX 4070 Ti OC sits above both of AMD’s new 7900 cards but behind the RTX 3090 Ti in this test.
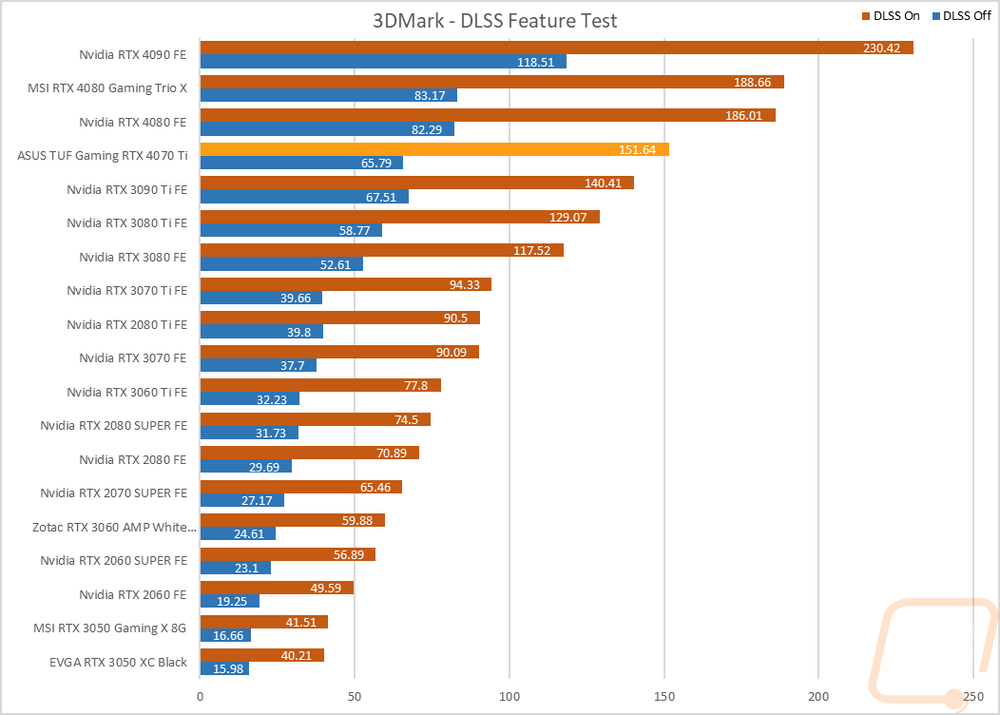
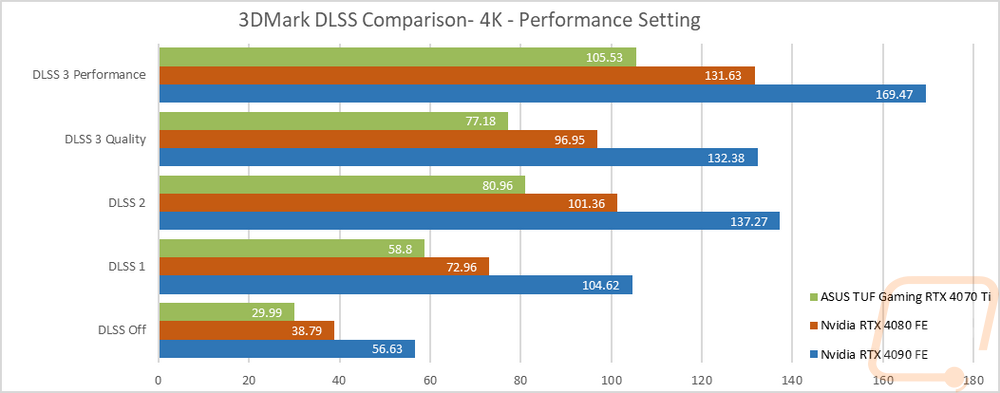
3DMark also has added in a few feature tests, one being a look at DLSS performance. For this one, I have the resolution set to 1440p and DLSS 2.0 turned on. I then have run the test on every card supported to get a comparison of how their test performs with and without DLSS. With DLSS 3 on, and with this being 1440p the TUF Gaming RTX 4070 Ti OC is once again ahead of the 3090 Ti at least with DLSS on, but with it off the 3090 Ti was a little faster. I did a second set of tests at 4K across all three versions of DLSS and twice with the new DLSS 3 to test the performance and quality settings. The idea with this test was to check out the performance difference between the different DLSS versions, but I did also include performance numbers from a few cards for comparison as well. No matter the card it is impressive that DLSS 3 can match DLSS 2’s performance when running on the quality setting and the performance gap going from 2 to 3 is big as well. With the TUF Gaming RTX 4070 Ti OC, it improved performance from 80.96 FPS to 105.53 FPS which is an improvement of 30%.
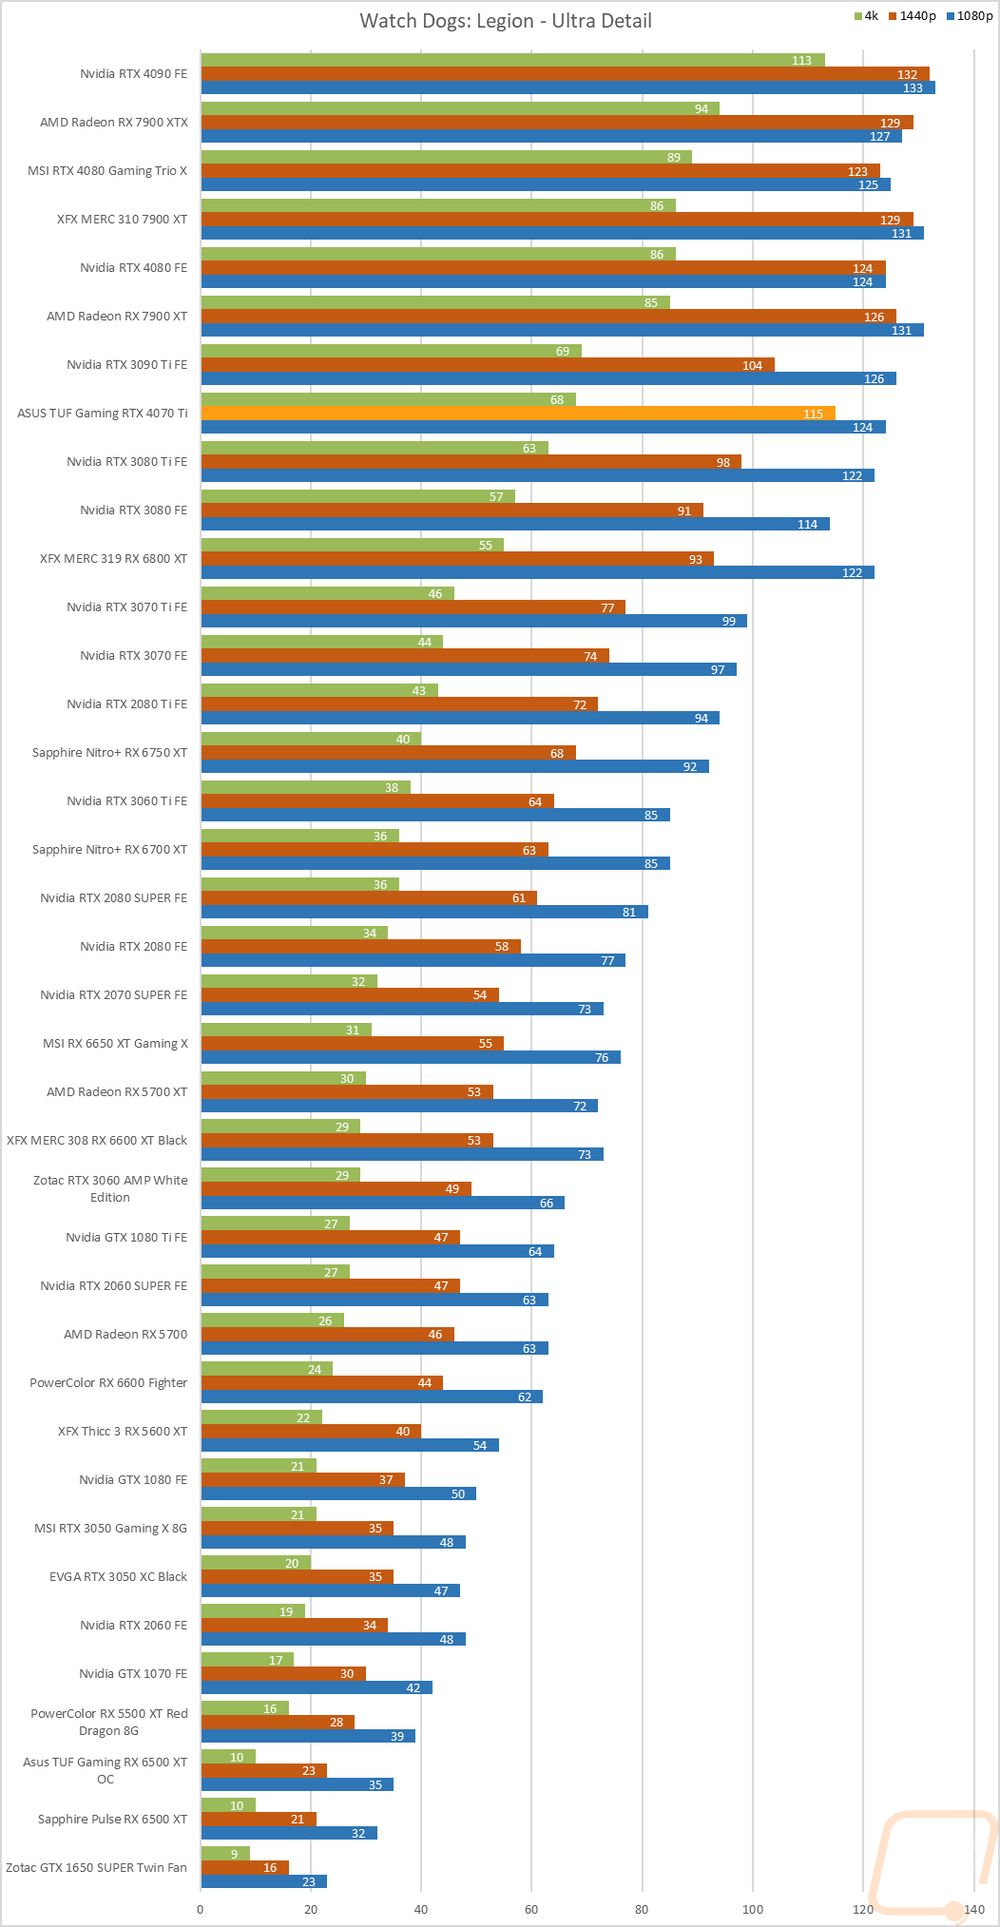
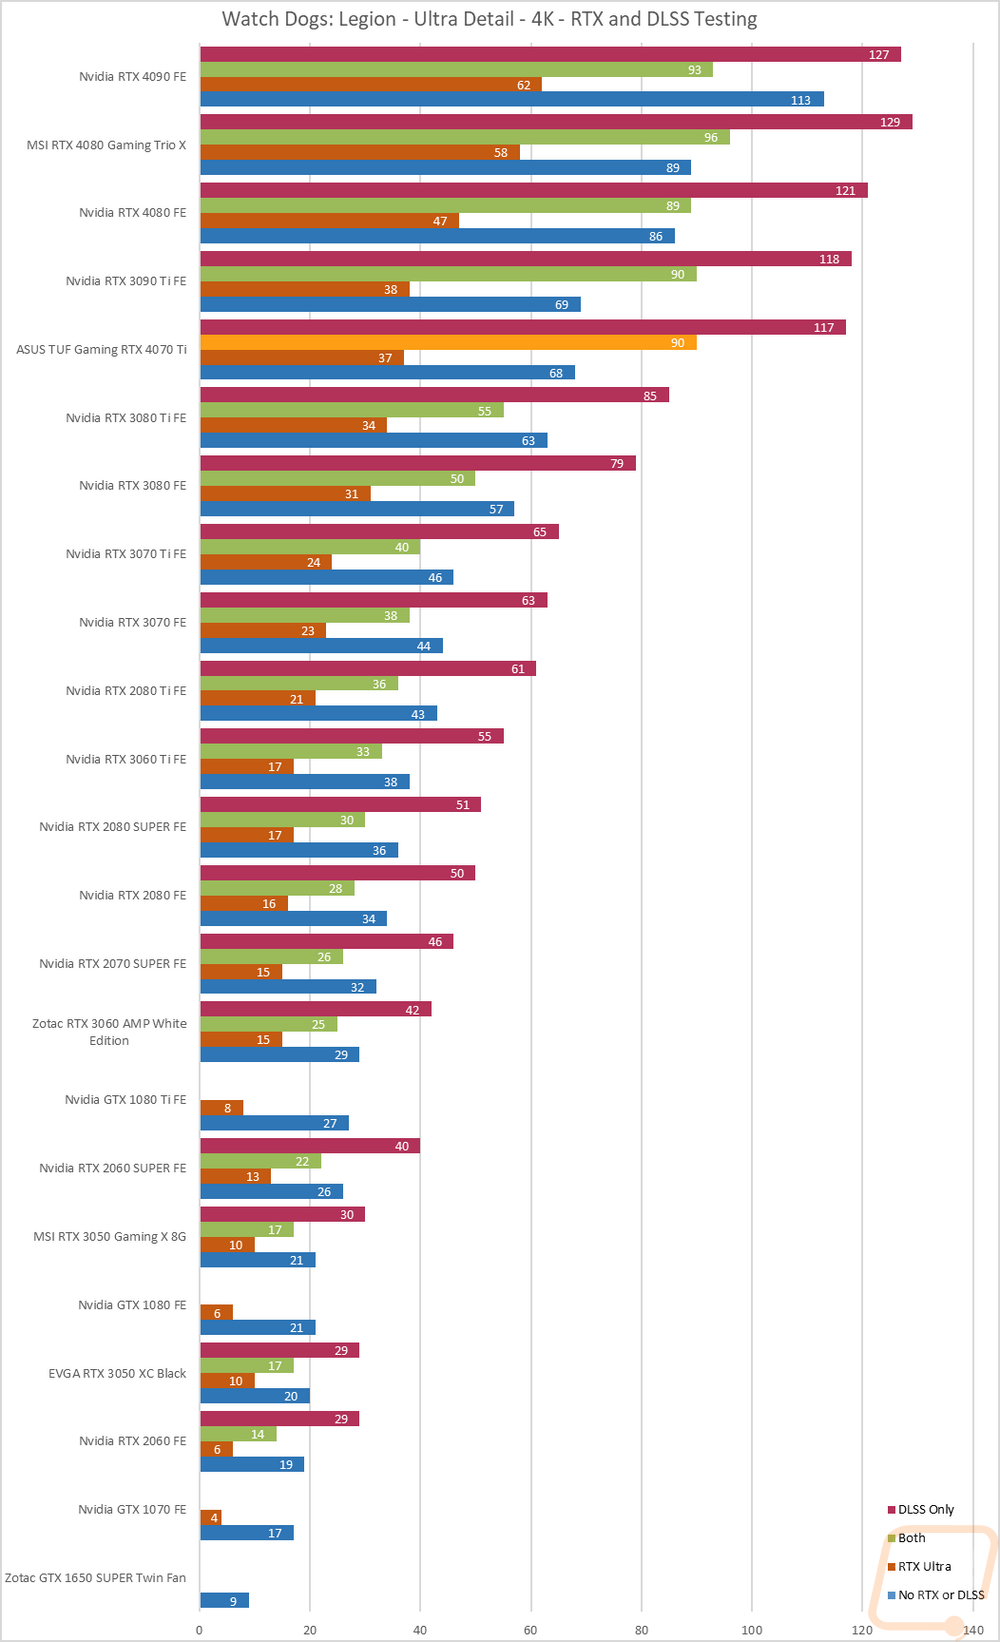
I then jumped into game tests, this time with Watch Dogs: Legion. For this one, I wanted to get an idea of the performance you will see when taking advantage of Nvidia’s RTX and DLSS features. I tested at 4k with the ultra detail setting and with ultra being the setting for DLSS and RTX when they are on as well. I then test with no RTX or DLSS on and then with RTX DLSS on and off and on together. Here the TUF Gaming RTX 4070 Ti OC comes in just behind the 3090 Ti but more importantly it shows that turning RTX dropped performance from 68 FPS down to 37 but pairing it with LSS put it at 90 FPS which is faster while also getting ray-traced graphics. Or if you want, running only DLSS nearly puts the average FPS up over the 120 high refresh rate range with it averaging 117 FPS.
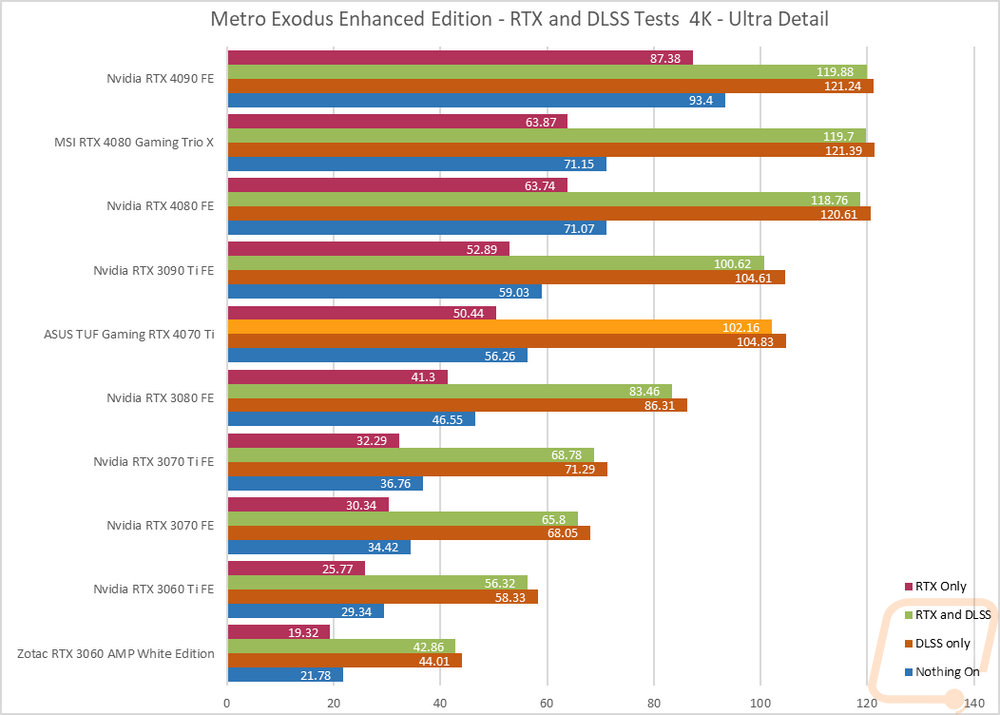
Next, I wanted to check out the performance in Metro Exodus which we have used for testing for a long time now. This test is similar as well with it set to 4K and Ultra detail, I use the included benchmark to test DLSS and RTX individually and then with them both on and both off to give us a look at overall frame rates depending on which direction you go. I should point out that this is using the Enhanced Edition where our normal benchmark uses the standard version for testing with AMD but that version DLSS no longer works. That said you can see how big of an improvement running DLSS goes with it nearly doubling the performance.
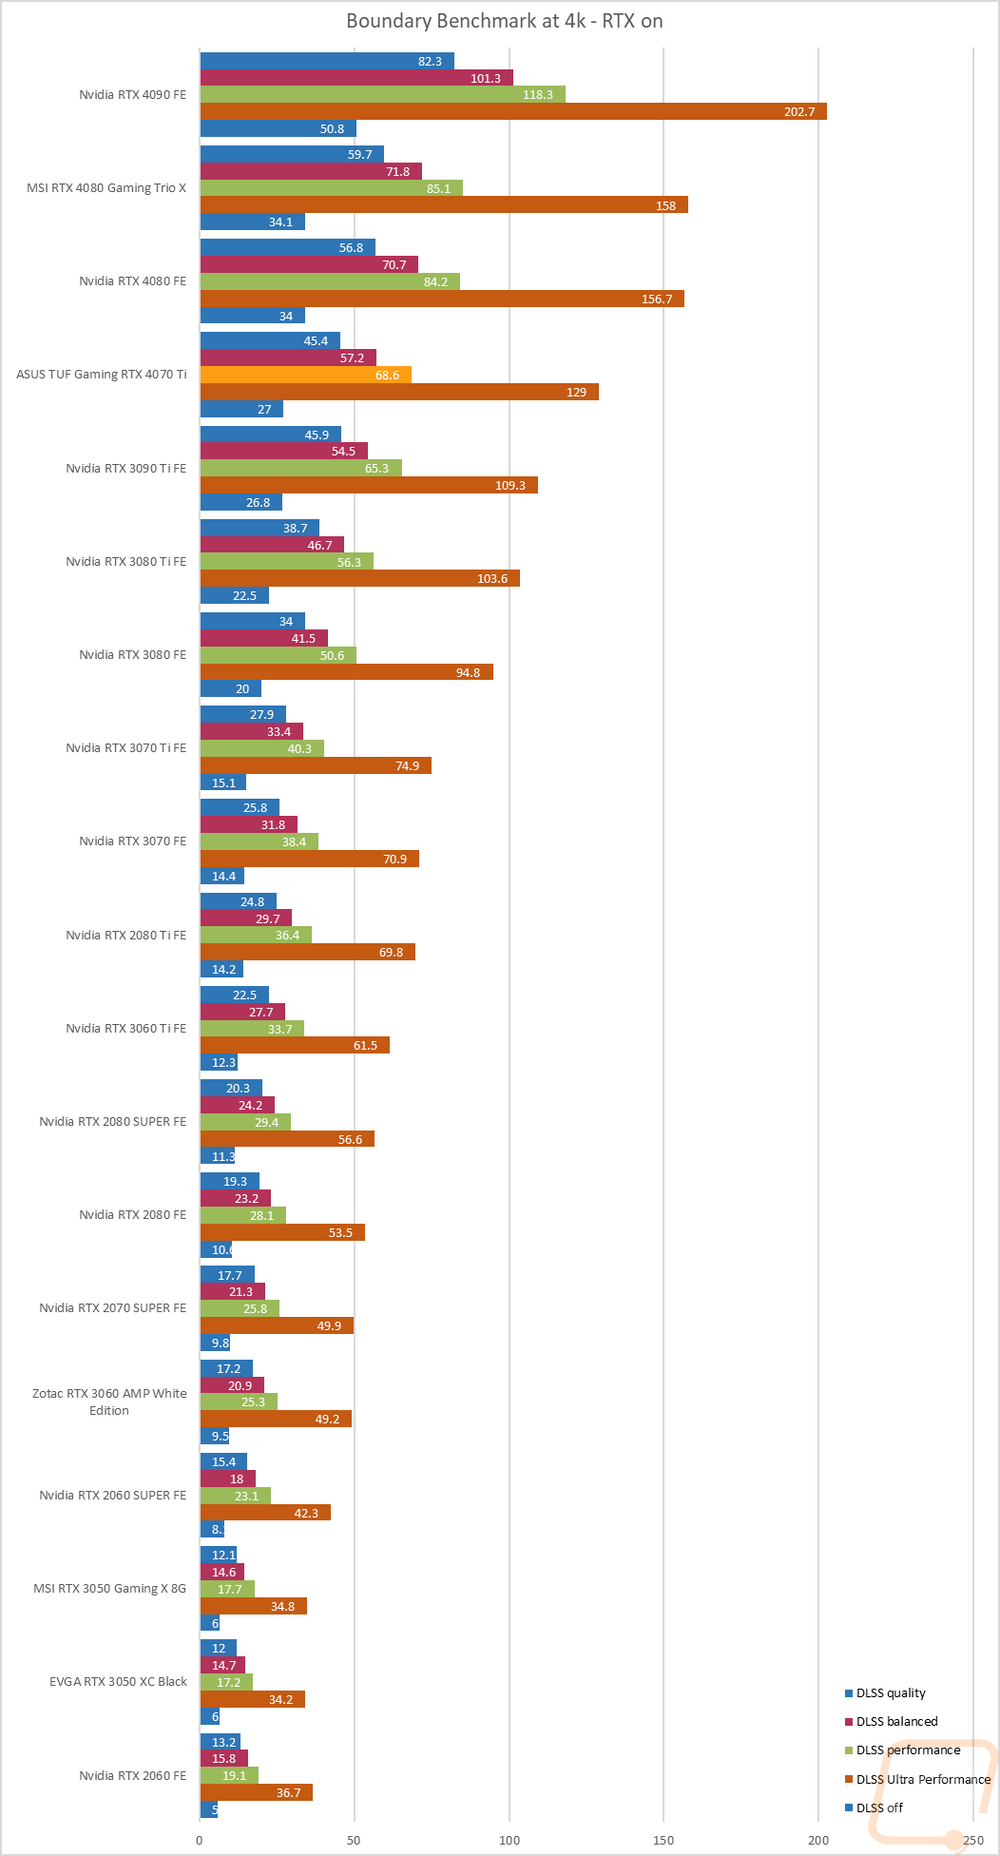
Next, I tested using a benchmark based on the game Boundary. For this one, I wanted to see how all of the different DLSS settings would perform, including turning it off completely. This is run using the free benchmark and with the resolution set to 4k and RTX on. The TUF Gaming RTX 4070 Ti OC outperformed the RTX 3090 Ti here except when turning the RTX up to the quality setting. This does a good job of showing the range of performance you can see depending on what settings you run. The TUF Gaming RTX 4070 Ti OC runs as low as 27 FPS and as high as 129 FPS.
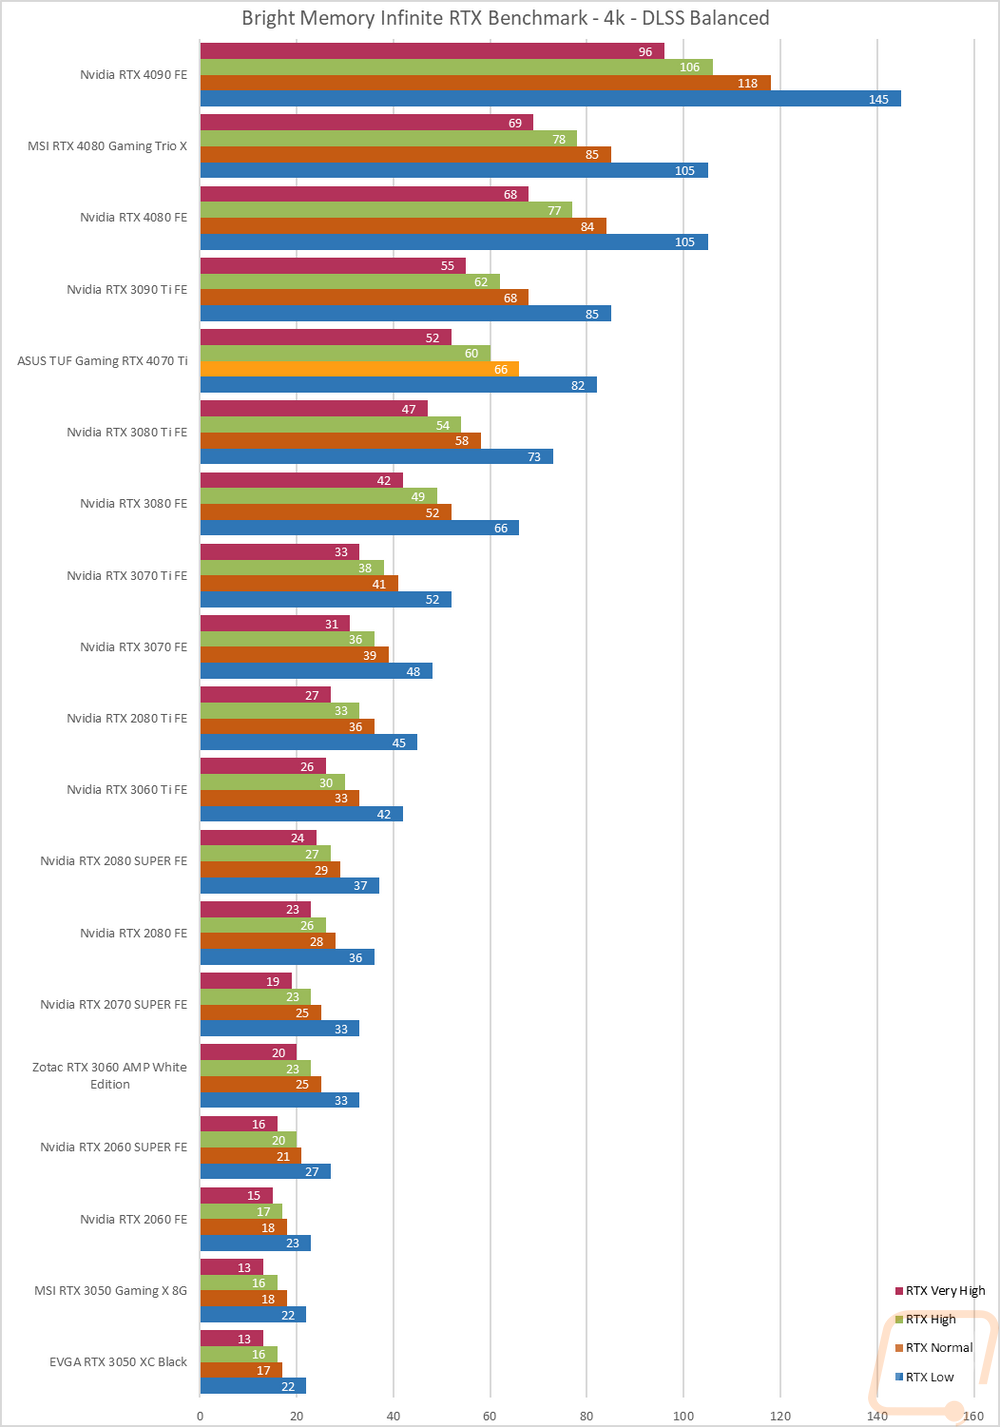
I also tested using the game Bright Memory with their free steam benchmark. This is similar to the previous Boundary test only it is looking at RTX settings individually with the resolution set to 4K and DLSS is set to the balanced setting. Here the TUF Gaming RTX 4070 Ti OC came in below the RTX 3090 Ti but ahead of the 3080 Ti. This test shows the range that DLSS detail settings can range in performance and that is before you even start to mix in things like frame generation. The TUF Gaming RTX 4070 Ti OC ranges from 52 FPS up to 82 depending on what you run.
I also wanted to take a look at DLSS 3 performance as well a little more than my initial look at it with 3DMark’s benchmark. For this, I put Nvidias Frameview to the test to run a few benchmarks using the games that currently support DLSS 3. For games with a built-in benchmark, I ran the benchmark but used frameview so we could get the FPS and 1% lows and because some of the game's frame generation is messing up their in game FPS readouts. V-Sync was turned off on all of the tests because it currently causes problems with frame generation and all of the tests were done at 4K with the highest detail settings including the highest RTX settings. DLSS 3 when there is an option was set to performance which is the setting Nvidia suggests when using it at 4K.
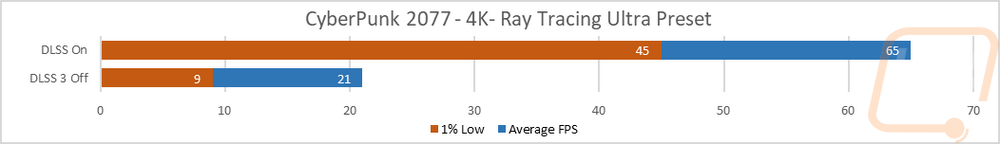
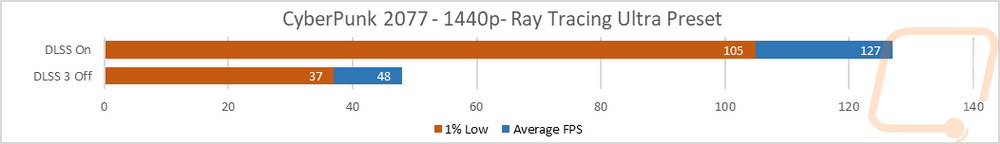
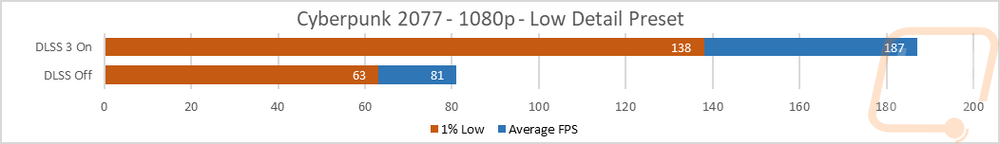
The first game tested was Cyberpunk 2077 and for this and all of these tests Nvidia suggested testing the RTX 4070 Ti at 1440p but with the previous 4080 and 4090, they suggested 4k. Rather than change things up completely I just tested at both resolutions in all of the tests. I did this because while they may want to focus the 4070 Ti on that 1440p resolution, I’m most interested in seeing if DLSS 3 can offer the performance improvement to make 4k possible on a 1440p focused card. The Cyberpunk result showed that was possible right out of the hole, at 4k with DLSS 3 off the performance was horrible at 21 FPS but when running it we were up over 60 FPS at 65 FPS which is smooth and playable. 1% lows were a little lower but still much better than the 9 FPS on the DLSS-off results. At 1440p the performance jump was similar going from 48 FPS up to 127 making high refresh rates possible as well. For Cyberpunk I included a third test where I took a look at 1080p with low detail to push the game to be CPU limited which is an area that frame generation helps a lot and we did still see a big improvement of 130% even with the game being CPU limited.
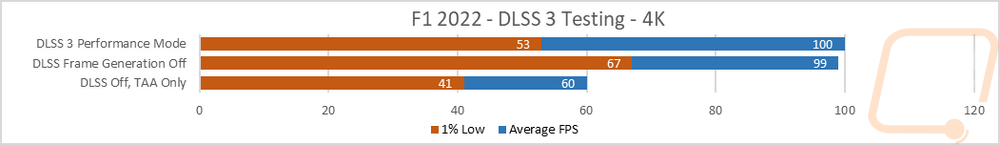
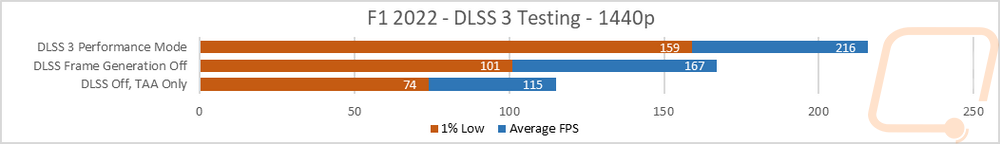
In F1 2022 I ran three tests. I tested with full DLSS, I did it again but turned off frame generation, and then tested with DLSS off and TAA on. Frame generation here was a big help when testing at 1440p, taking the frame rate up to 216 FPS which is a little crazy but more importantly had the 1% lows way up into the high refresh rate sweet spot as well. Interestingly though at 4K it didn’t help at all but DLSS 3 as a whole did take the 4k performance from 60 FPS up to 99 and the 1% lows up over 60 FPS as well.
In A Plague Tale turning frame generation showed how much it can help a lot more with DLSS 3 while the 1440p performance was impressive when running DLSS with frame generation. It is the 4K result that I am most interested in again because without DLSS at all the 4070 Ti struggled at 47 FPS but with DLSS it was at nearly 100 FPS and then with frame generation it was up to 120 FPS with its 1% lows even doing well at 98 FPS. This is a great example of Nvidia’s tech allowing great performance at a resolution that the card isn’t designed for.


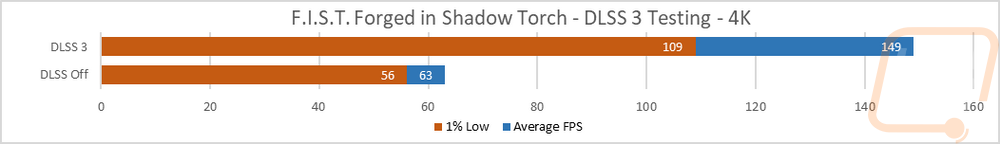
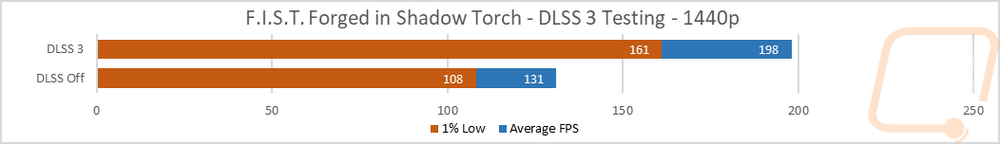
In the side scroller Forged in Shadow Torch DLSS 3 once again, the 1440p results were good without DLSS 3 at all but turning it on pushed it nearly to 200 FPS. The 4K results on the other hand took solid performance at 63 FPS up into the smooth 144 Hz refresh rate range with the 149 FPS average. The 1% lows however didn’t improve as much in that situation but were still twice the frame rate of the 1% lows without DLSS 3.
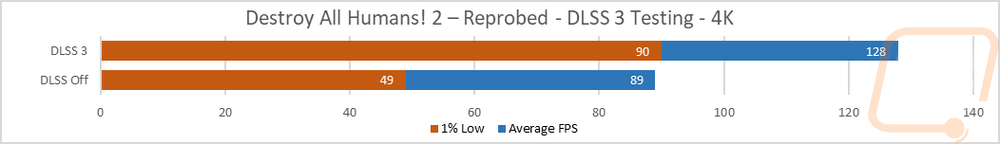
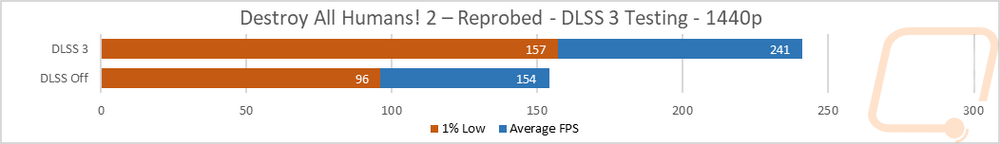
Next up was Destroy All Humans! 2 – Reprobed. The TUF Gaming RTX 4070 Ti OC handled the game even with DLSS off on both resolutions but in both situations turning DLSS 3 on made for big improvements. At 4k it went from 89 FPS up to 128 FPS a 43% improvement and at 1440p it went from 154 FPS up to 241 FPS a 56% improvement.
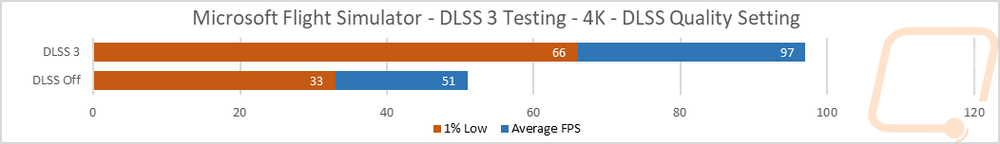
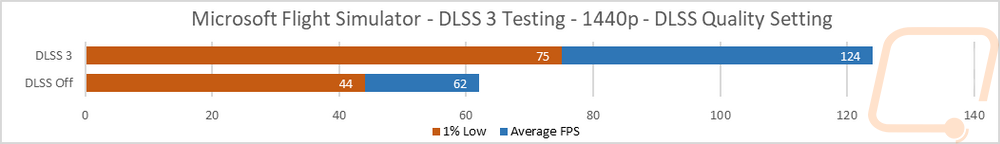
Last I took a look at Microsoft Flight Simulator and this is an interesting case because this is a well-known CPU-limited game. To keep things consistent the test used the landing test run over Sydney With DLSS off the TUF Gaming RTX 4070 Ti OC came in at 51 FPS at 4K and 62 FPS at 1440p which isn’t a big difference due to being CPU limited even with our 12900K. Turning DLSS 3 on with frame generation performance jumped from 62 FPU up to 124 at 1440p and 51 to 97 at 4K. This was a 90 percent improvement at 4K and exactly 100% at 1440p.
Cooling Noise and Power
For my last few tests, rather than focusing on in game performance, I like to check out other aspects of video card performance. These are also the most important ways to differentiate the performance between cards that have the same GPU. To start things off I took a look at power usage.
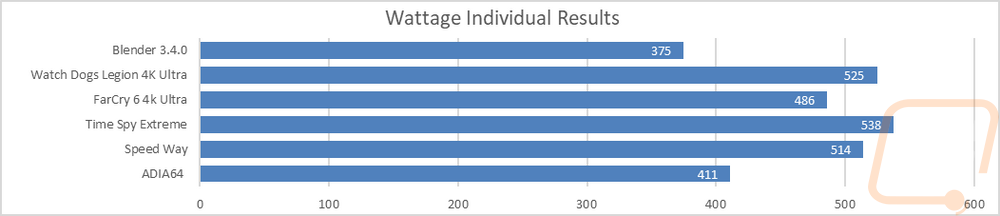
For this, our new test setup utilizes the Nvidia-designed PCat v2 along with cables to handle both traditional 6 or 8-pin connections as well as the new 12VHPWR. The PCat also utilizes a PCIe adapter to measure any power going to the card through the PCIe slot so we can measure the video card wattage exclusively, not the entire system as we have done in the past. I test with a mix of applications to get both in game, synthetic benchmarks, and other workloads like Blender and AIDA64. Then everything is averaged together for our result. I also have the individual results for this specific card and I document the peak wattage result as well which is almost always Time Spy Extreme. The TUF Gaming RTX 4070 Ti OC is an overclocked card so it isn’t a direct look at stock RTX 4070 Ti performance but it averaged 290 watts in our tests with a peak of 346 watts. This put it below the RTX 3070 Ti by 18 watts but above the old RTX 3070, even with this being an overclocked card it is surprisingly power efficient.
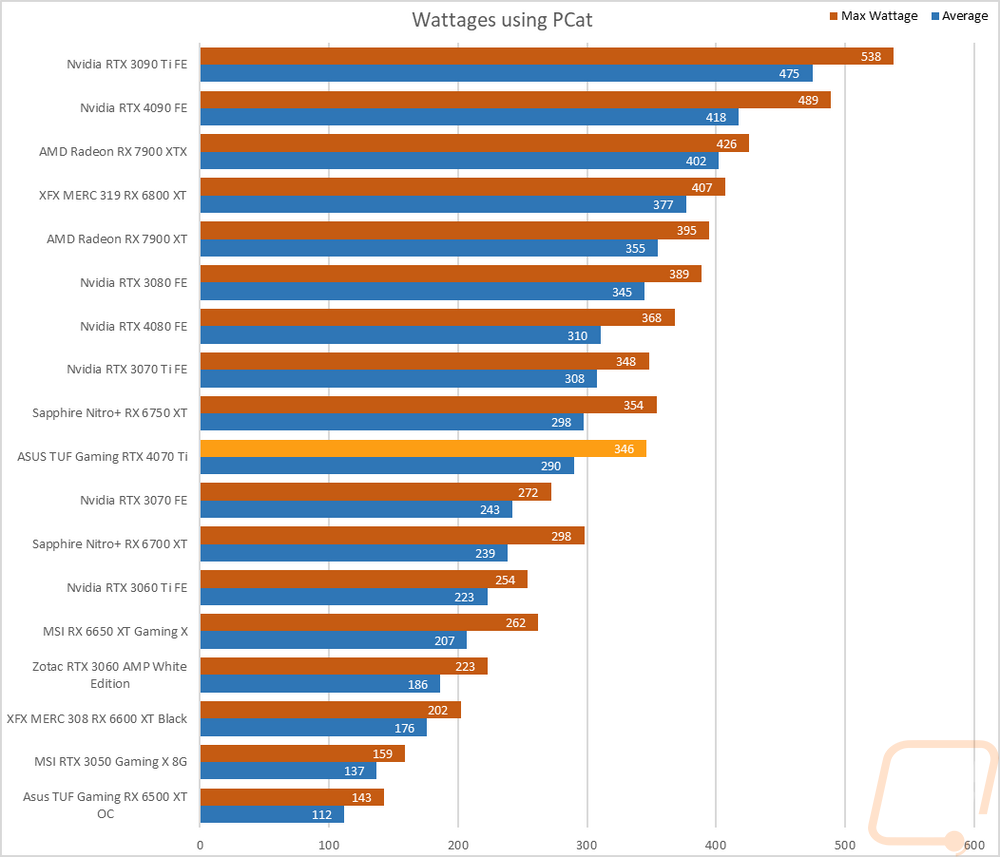
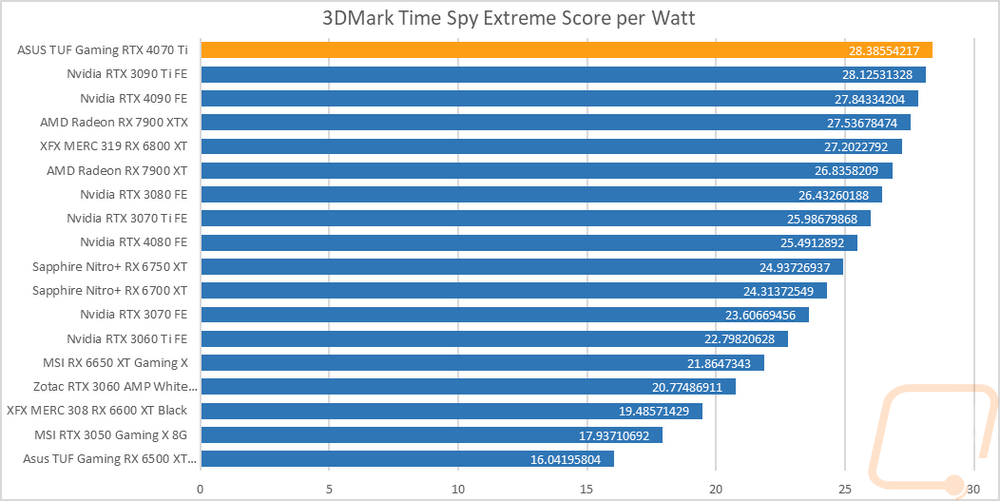
With having exact peak wattage numbers when running Time Spy Extreme I was also able to put together a graph showing the total score for each watt that a card draws which gives us an interesting look at overall power efficiency in the popular and demanding benchmark. Even with this being an overclocked card, the RTX 4070 Ti topped the chart.
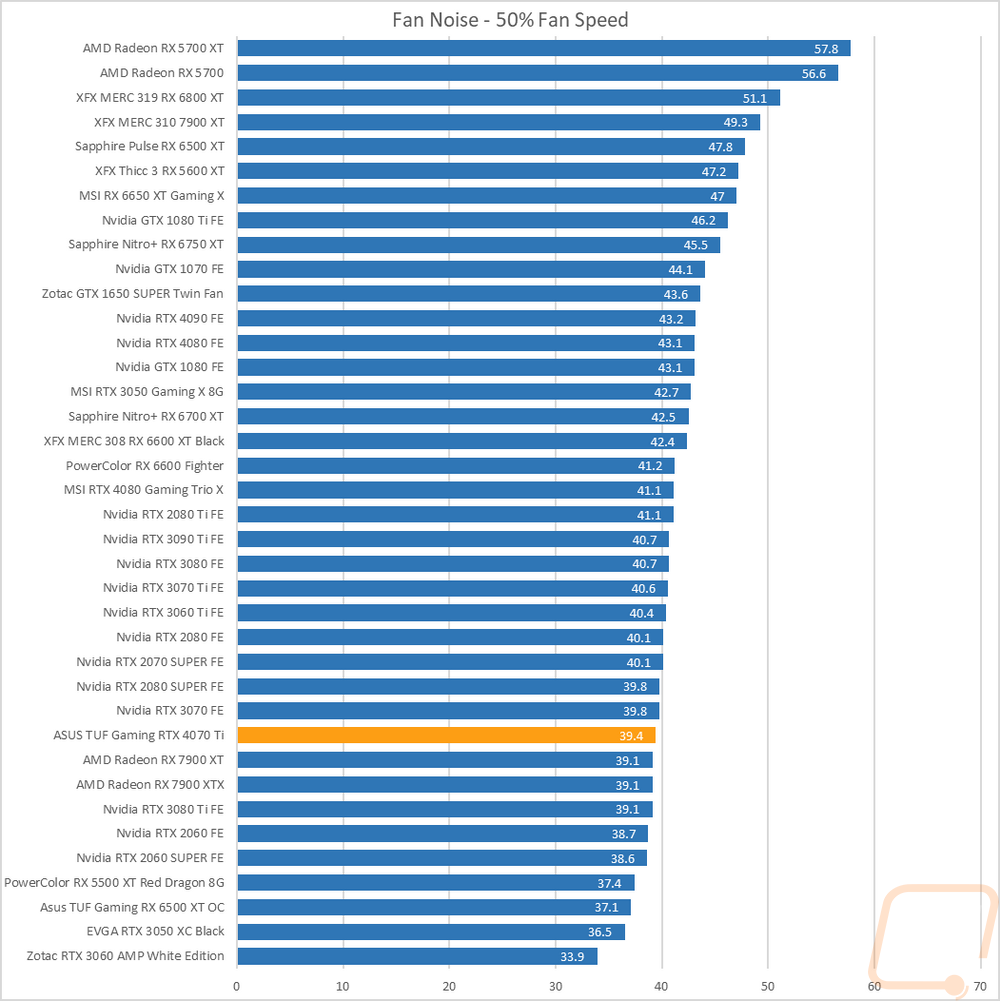
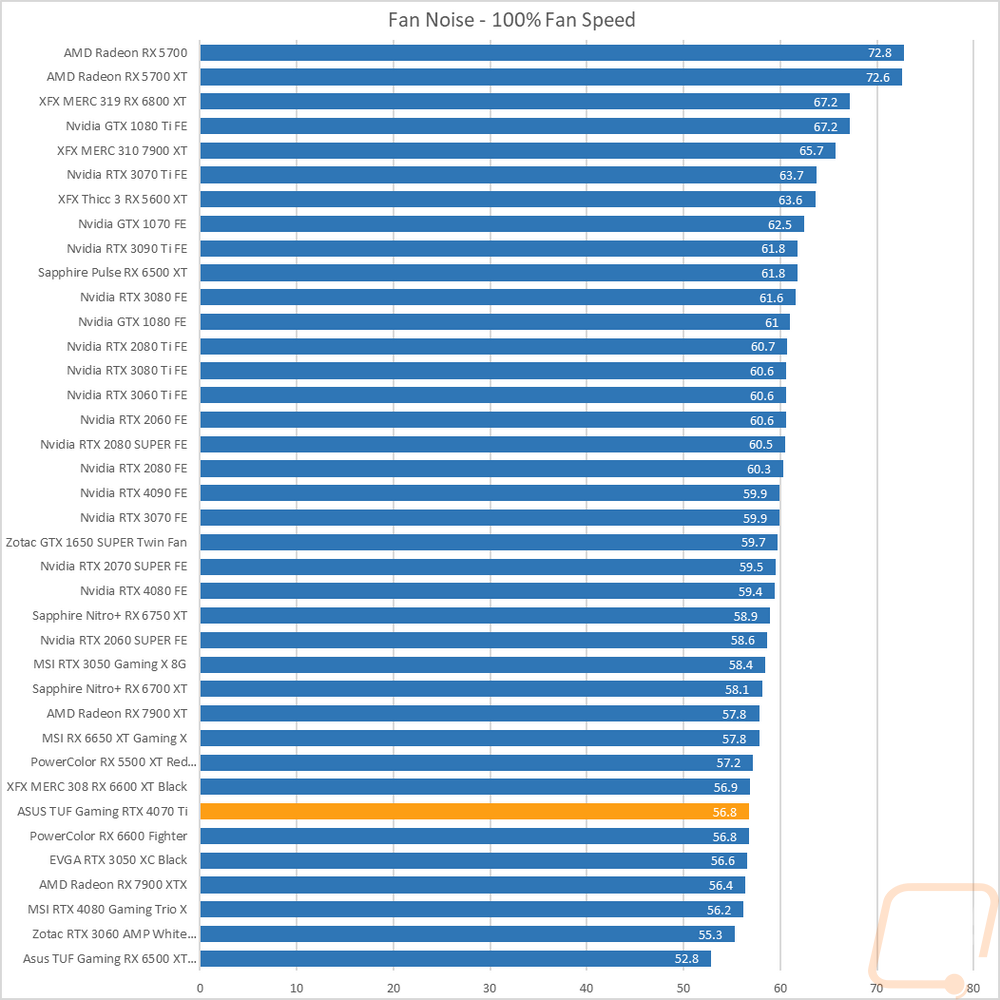
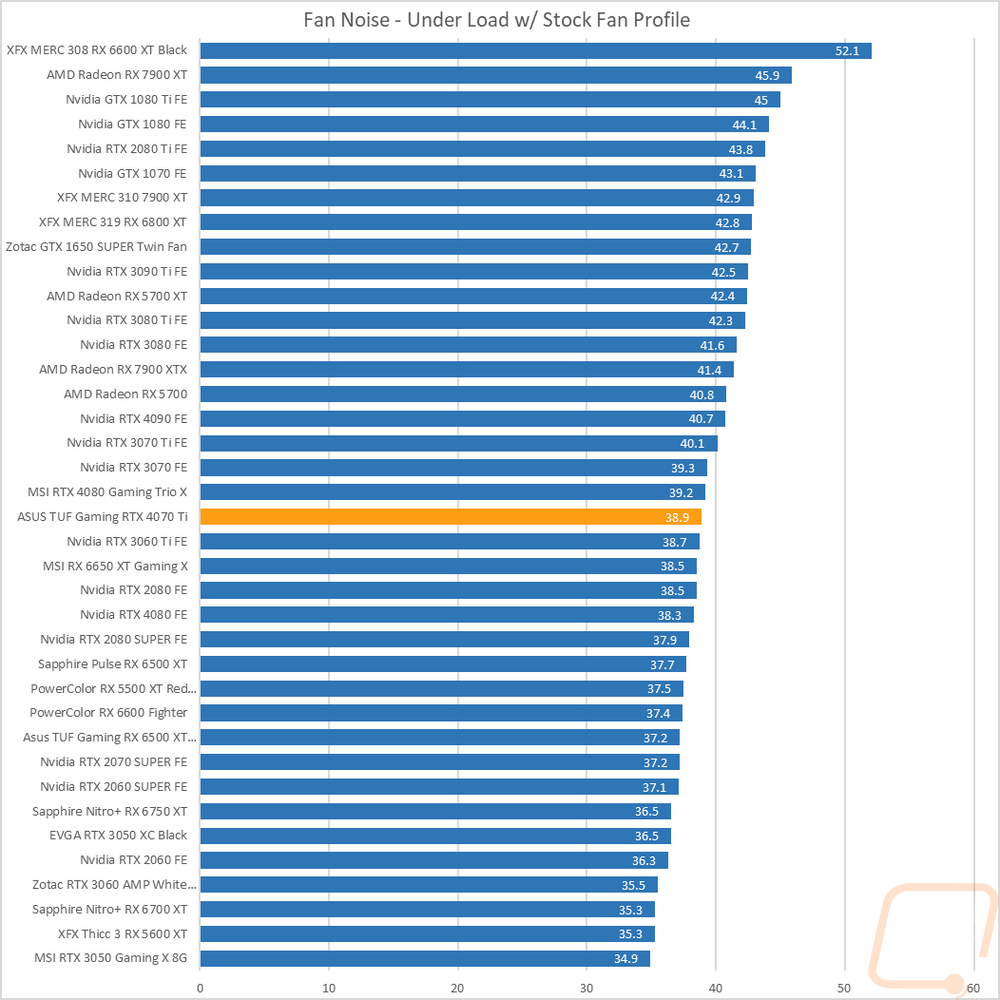
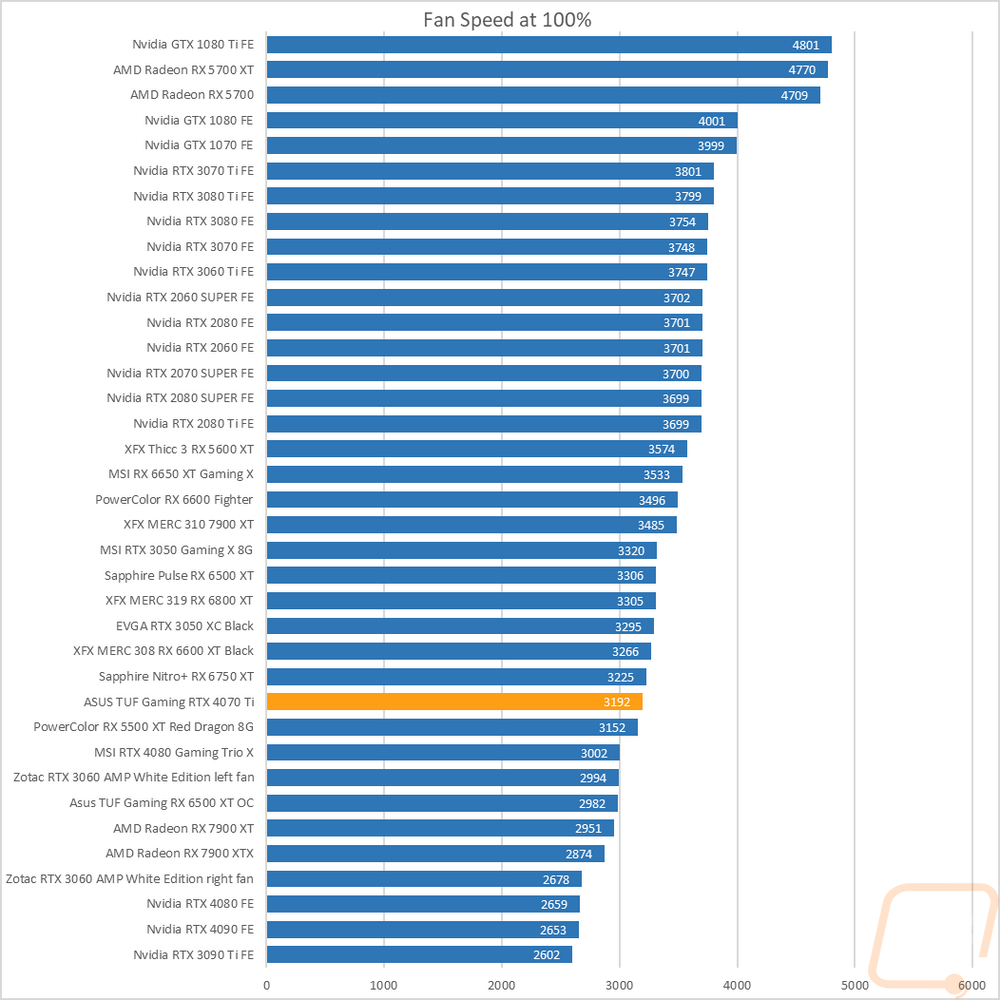
My next round of tests was looking at noise levels. These are especially important to me because I can’t stand to listen to my PC whirling. Especially when I’m not in game and other applications are using the GPU. For my testing, though I first tested with the fan cranked up to 100% to get an idea of how loud it can get, then again at 50% to get an idea of its range. Here the TUF Gaming RTX 4070 Ti OC ran quiet at 39.4 decibels at 50% fan speed and even at 100% fan speed was down near the bottom of our charts at 56.8 decibels. In the load test, it was even quieter than the 50% fan speed test at 38.9 db but this put it higher up in the chart near the halfway point whereas, on the other two tests, it was down at the bottom. The triple fan setup on the TUF Gaming RTX 4070 Ti OC does offer control of the fans split up by two controls, the two outer fans are tied together and then the middle fan is on its own. But when cranked up all three ran at the same 3192 RPM which is lower than most cards run and explains the quieter performance in most of the tests.
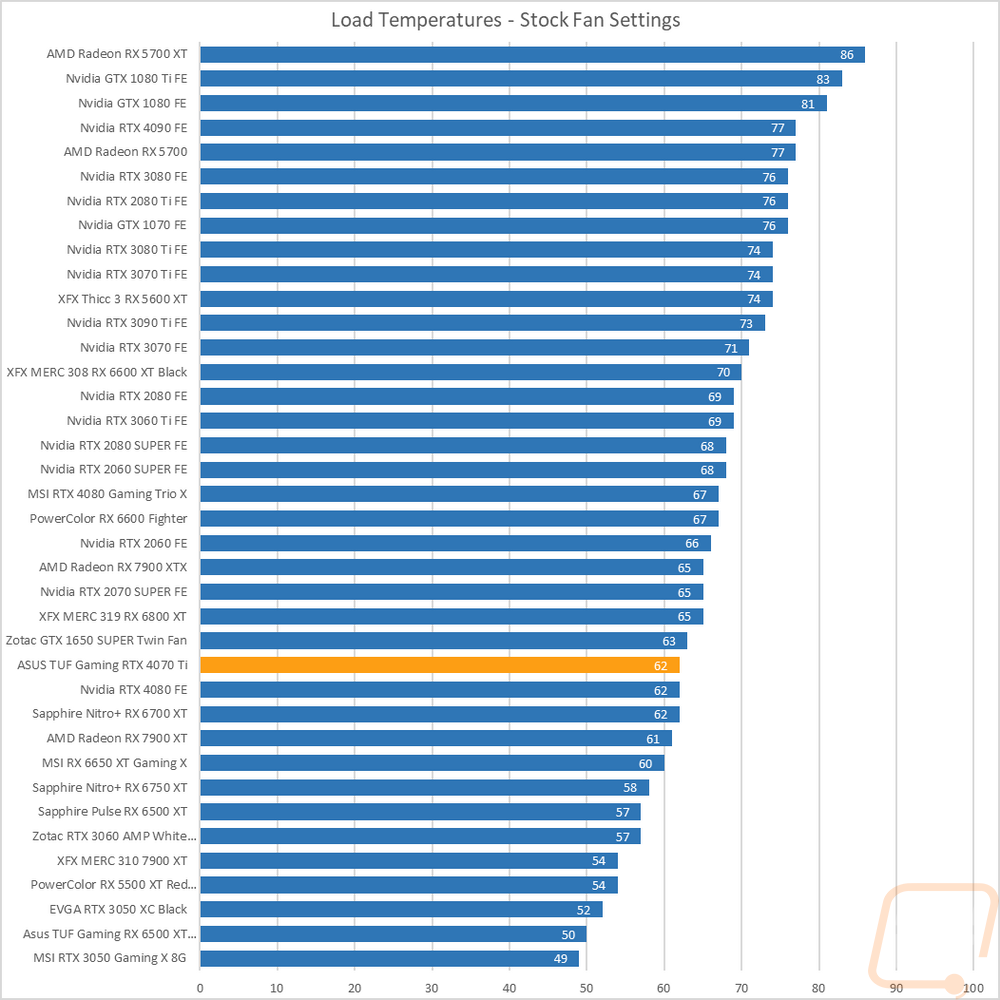
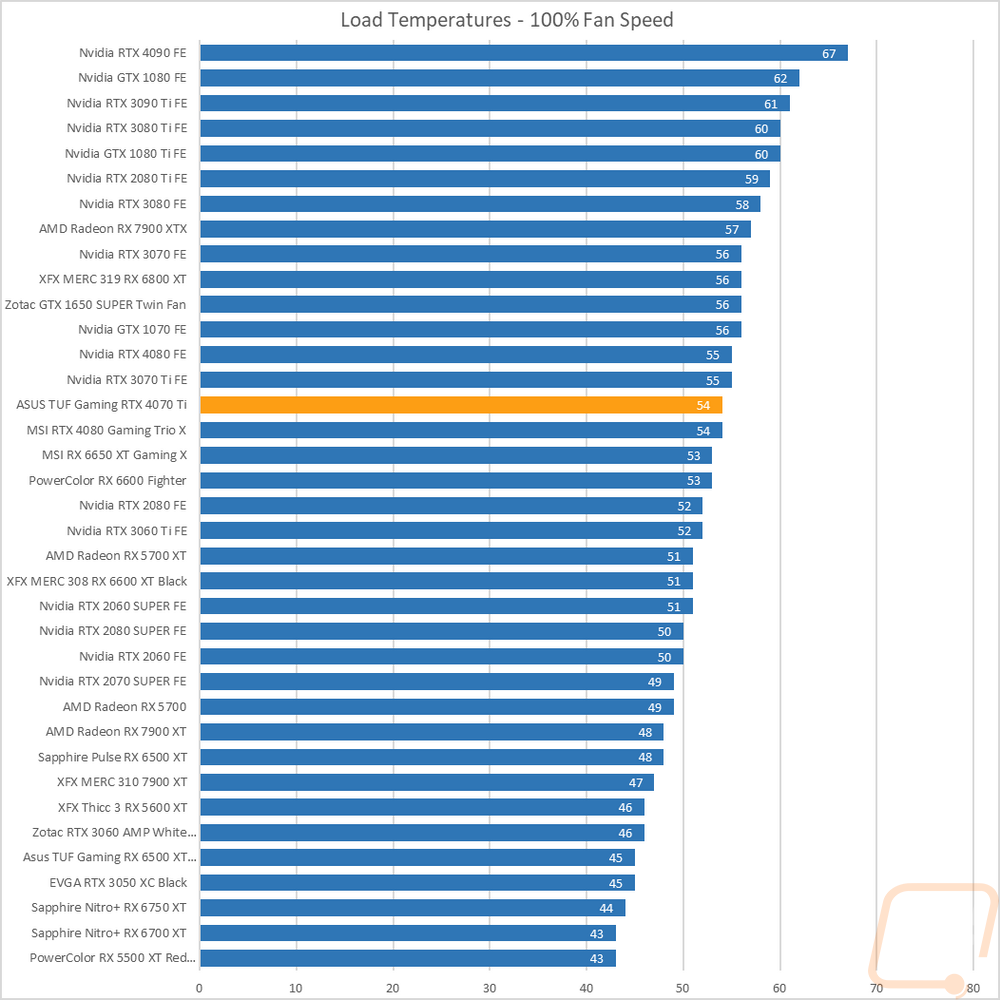
To finish up my testing I of course had to check out the cooling performance. To do this I ran two different tests. I used AIDA64’s Stress Test run for a half-hour each to warm things up. Then I documented what temperature the GPU leveled out at with the stock fan profile and then again with the fans cranked up to 100%. With the stock profile, the TUF Gaming RTX 4070 Ti OC leveled off at 62c and had a GPU hotspot of 76c. I should also point out that the fans were running at 42% when at this temperature. This put the TUF Gaming RTX 4070 Ti OC in the bottom 1/3 of our charts and right with the RTX 4080 Founders Edition and one degree above the stock-clocked RX 7900 XT. Then with the fans cranked up, the TUF Gaming RTX 4070 Ti OC leveled off at 54c which is higher up in our charts, and right with the overclocked RTX 4080 Gaming Trio X. The delta between the two tests was just 8c which is on the low end and shows that the cooler on the TUF Gaming RTX 4070 Ti OC doesn’t have too much extra headroom even though at the stock fan profile it was at under half fan speed. At 100% fan speed the GPU hotspot was better at 67c.
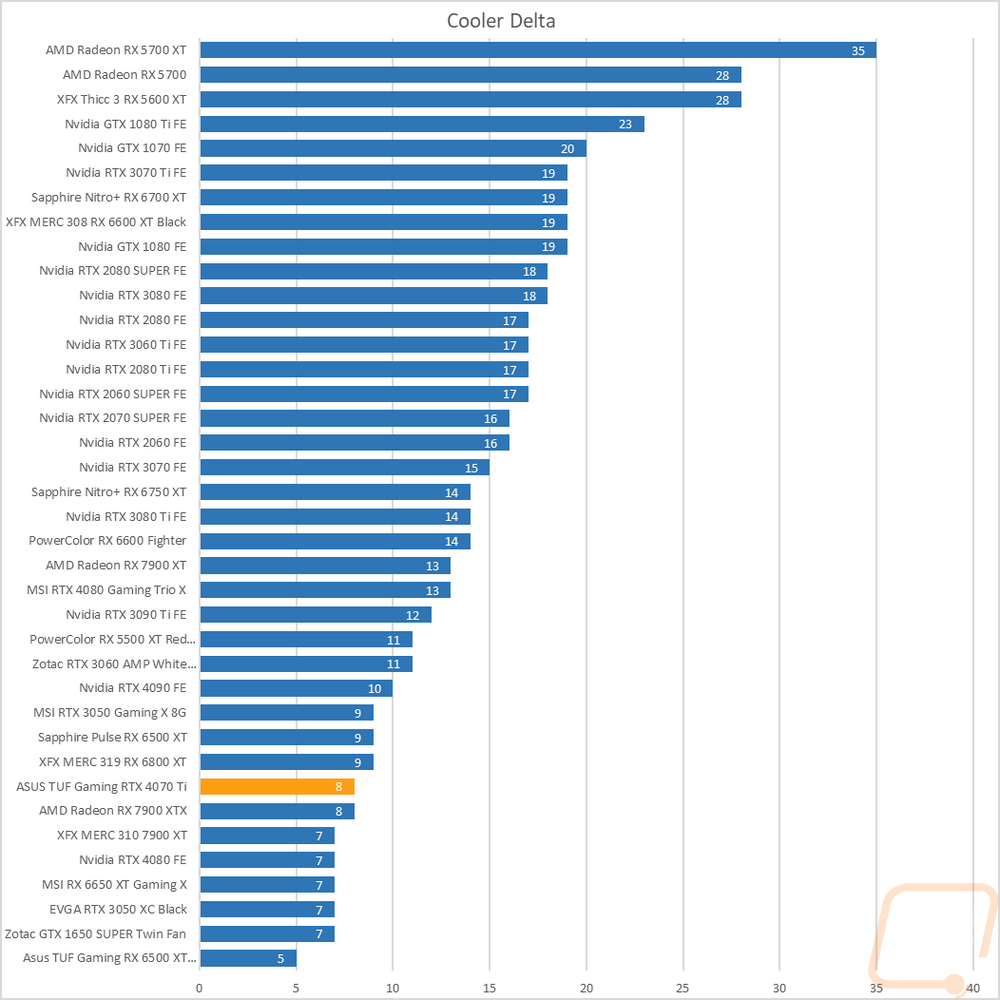
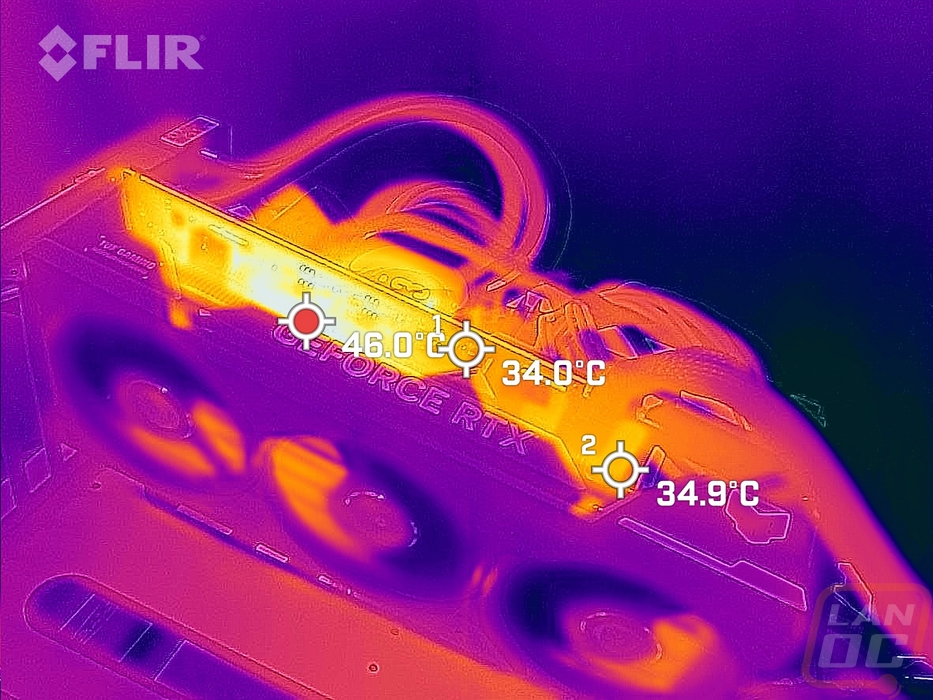
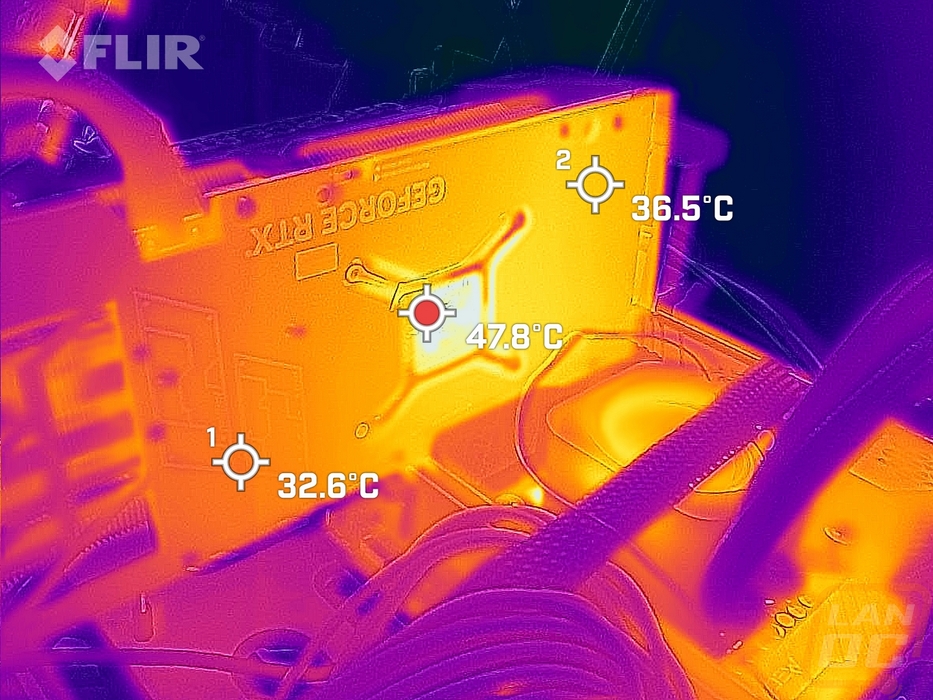
While running the stock fan profile testing I also took the time to get a few thermal images so we could see what is going on. The fan side of the TUF Gaming RTX 4070 Ti OC shows that the hotspot is up on the top edge of the card and even though the fans the heatsink that is visible is running very cool with the hottest area in the bottom left corner there. Even with the TUF Gaming RTX 4070 Ti OC venting to the bottom some, I was surprised there wasn’t more heat up under the card. Up on the top edge with so much of the PCB visible, it isn’t a surprise that is where the hotspot was, down about an inch down right above the GPU, the rest of the top edge was more than 10c less but you can see there is some heat being pushed around the power connection, that area could be a little more insulated off to keep card heat from adding to the heat there. Then on the back, no surprises here, the exposed PCB at the back of the GPU is of course the hottest spot at 47.8c which is cooler than I would have expected. The metal backplate does have some heat in it at 36.5c near the PCI bracket but you can see that gets cooler the farther to the left you go as you get to the blow-through area over there.

Overall and Final Verdict
With our testing out of the way, the RTX 4070 Ti and the Asus TUF Gaming RTX 4070 Ti that I tested both are an interesting addition to the Nvidia product stack. The 4070 Ti as a whole trades blows with last generations flagship, the RTX 3090 Ti, and especially at 1080p and 1440p it often outperforms the 3090 Ti. This fills in the gap below the RTX 4080 which AMD took advantage of with their new 7900 XT but the RTX 4070 Ti doesn’t keep up with the 7900 XT so there is still some room there. Where with the RTX 4080 and RTX 4090 Nvidia was focused on 4K performance, with the RTX 4070 Ti they finally turned their focus to 1440p and they cement that with the card's lower memory bus which at 192-bit is lower than even last generations 3070 Ti had. This didn’t affect performance at 1080p and 1440p but you can see in our testing where the 3090 Ti does much better at 4K whereas the 4070 Ti runs with it otherwise. That said 4K performance wasn’t bad, it just wasn’t as dominant as the 4070 Ti is at 1080p and 1440p. The RTX 4070 Ti has full support for DLSS 3 and interestingly enough that is enough to get high refresh frame rates at 4K or to see performance improvements in CPU-limited games like Microsoft Flight Sim.
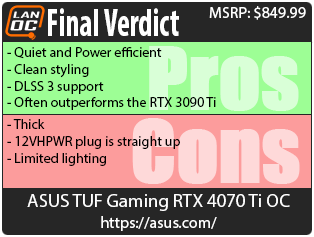
As for the Asus TUF Gaming RTX 4070 Ti OC that I tested. As the name suggests this was an overclocked card so we don’t know where the stock clocked performance will be but the overclocked Asus TUF card did well in our testing. It ran quiet and the RTX 4070 Ti as a whole was surprisingly power efficient, topping our charts in performance per watt when running 3DMark Time Spy Extreme. The TUF card does use the new 12VHPWR connection which I don’t mind, but I do wish some of these cards would angle the connection as we saw with some 3000 series cards including the Founders Edition cards which took the strain off the connection. The TUF card isn’t the largest 4070 Ti out there, in fact, it was a lot closer to standard sizes when it came to height and length but at 64mm thick it is just a hair past a 3-slot card which is surprisingly thick. I like how clean the styling is on the card and Asus hide a few cool easter eggs in the design as well but as far as RGB lighting goes I wouldn’t have minded the design having the lighting spread out a little more across the card and not just having it all in the one corner and mostly just backlit branding.
As far as pricing goes, the RTX 4070 Ti has an MSRP of $799 which is $100 less than when the original 4080 12GB was announced, and the Asus TUF Gaming RTX 4070 Ti OC that I tested today has an MSRP of $849.99, $50 more than the base 4070 Ti price. Your opinion on this pricing is going to depend a lot on what you are comparing it to. This is a big jump from the $599 that the last generation RTX 3070 Ti launched at but for comparison, it isn’t as bad when we compare it to the $1999 MSPR that the RTX 3090 Ti launched at which the 4070 Ti runs with. More importantly, compared to AMD's RX 7900 XT which recently launched at $899 Nvidia did at least beat that price which is important given the 7900 XT outperformed it in traditional raster performance. The 4070 Ti does have the edge when it comes to ray tracing and DLSS of course. Overall I would say that none of the current generation cards are a value, this could be attributed to higher costs for TSMC manufacturing, higher costs for materials, the rising cost of living as a whole, or Nvidia looking for a bigger slice of the pie. But I can at least say that as of right now, while not the best value the 4070 Ti pricing is in line with the competition and it does get you a lot of performance. With this being the most efficient Ada card yet as far as power to performance I’m excited to see what comes next as we start to get into the mid-range of the product stack.
Live Pricing: HERE


