Cooling Noise and Power
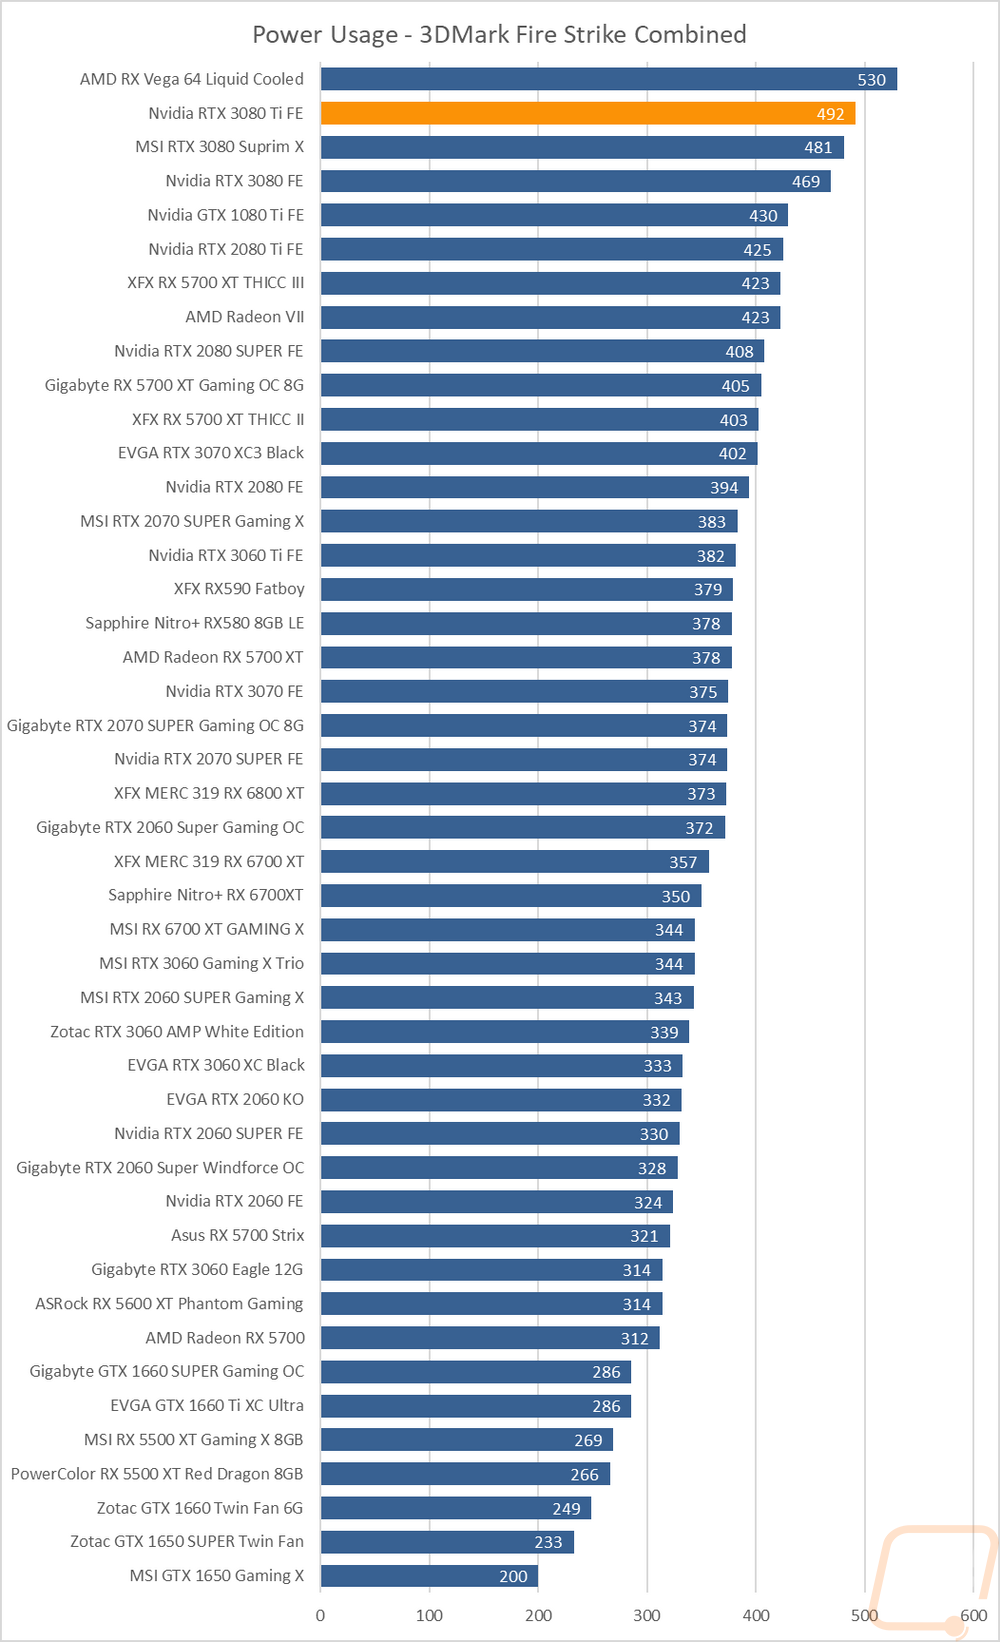
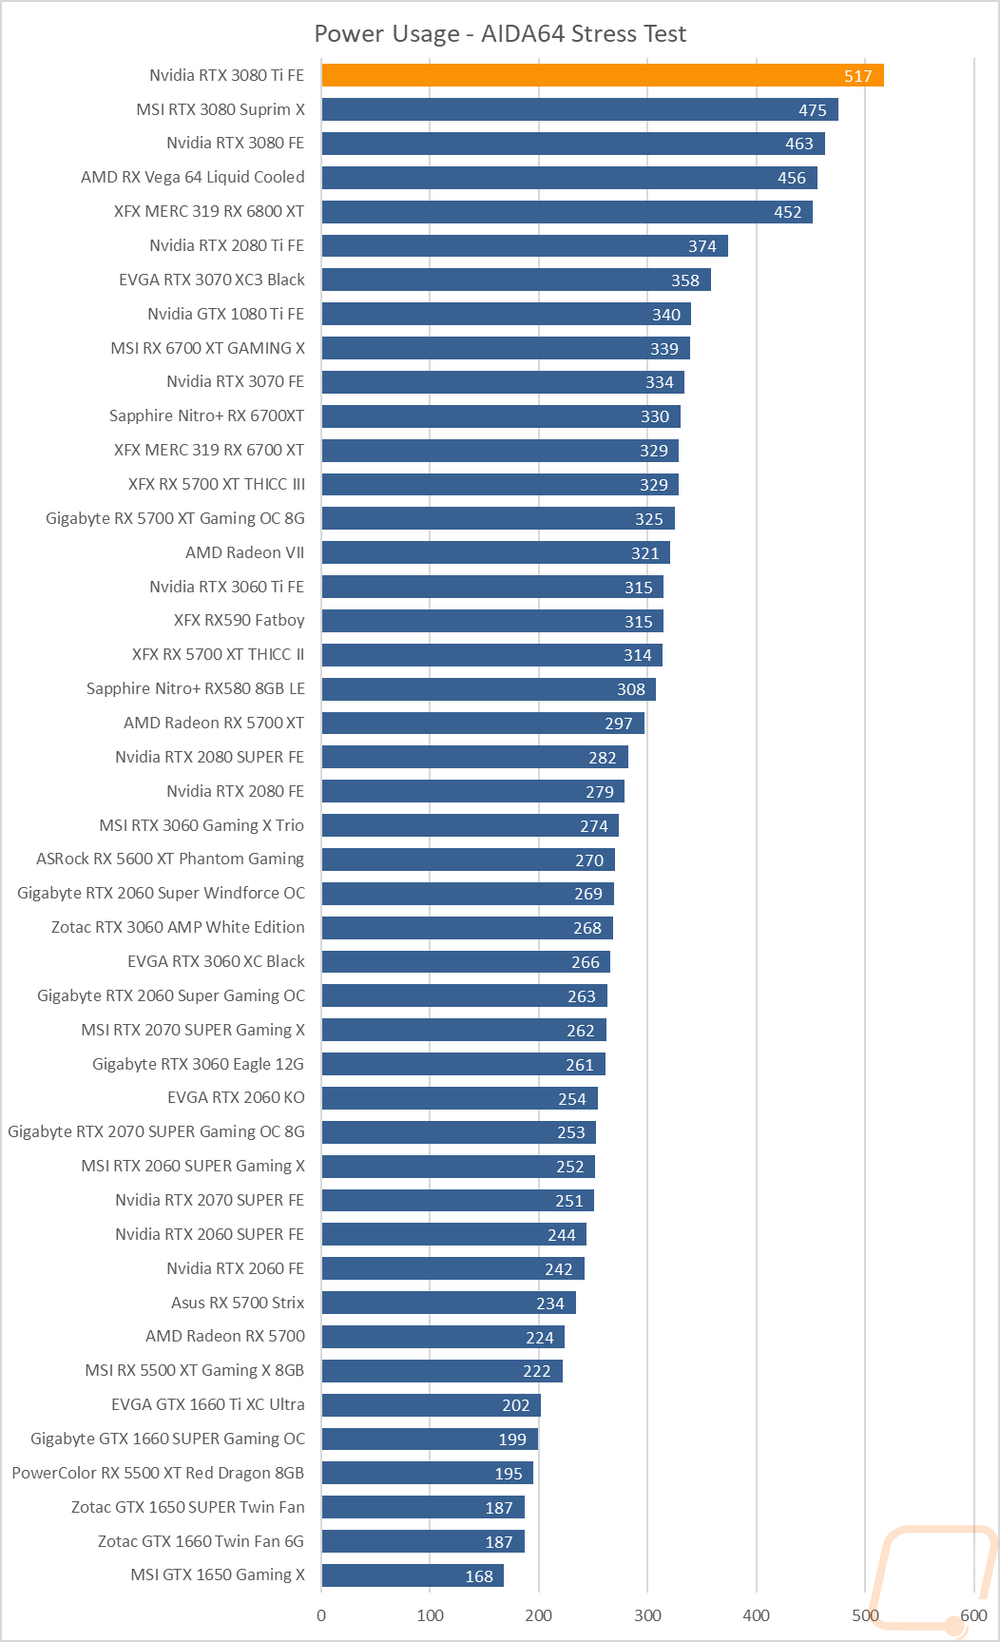
For my last few tests, rather than focusing on in game performance, I like to check out other aspects of performance. These are also the most important ways to differentiate the performance between cards that have the same GPU. To start things off I took a look at power usage. For this, I use our Kill-A-Watt hooked up to the test bench to record the total wattage of the system. I ran two tests with the first using 3DMark Fire Strike to put the system under a load similar to normal in game performance. Here our test system with the 3080 Ti Founders Edition pulled 492 watts in the 3DMark benchmark which put it only behind the Vega 64 Liquid Cooled card. In the AIDA64 stress test that number went even higher pulling 517 watts which is 54 watts more than the RTX 3080 FE.
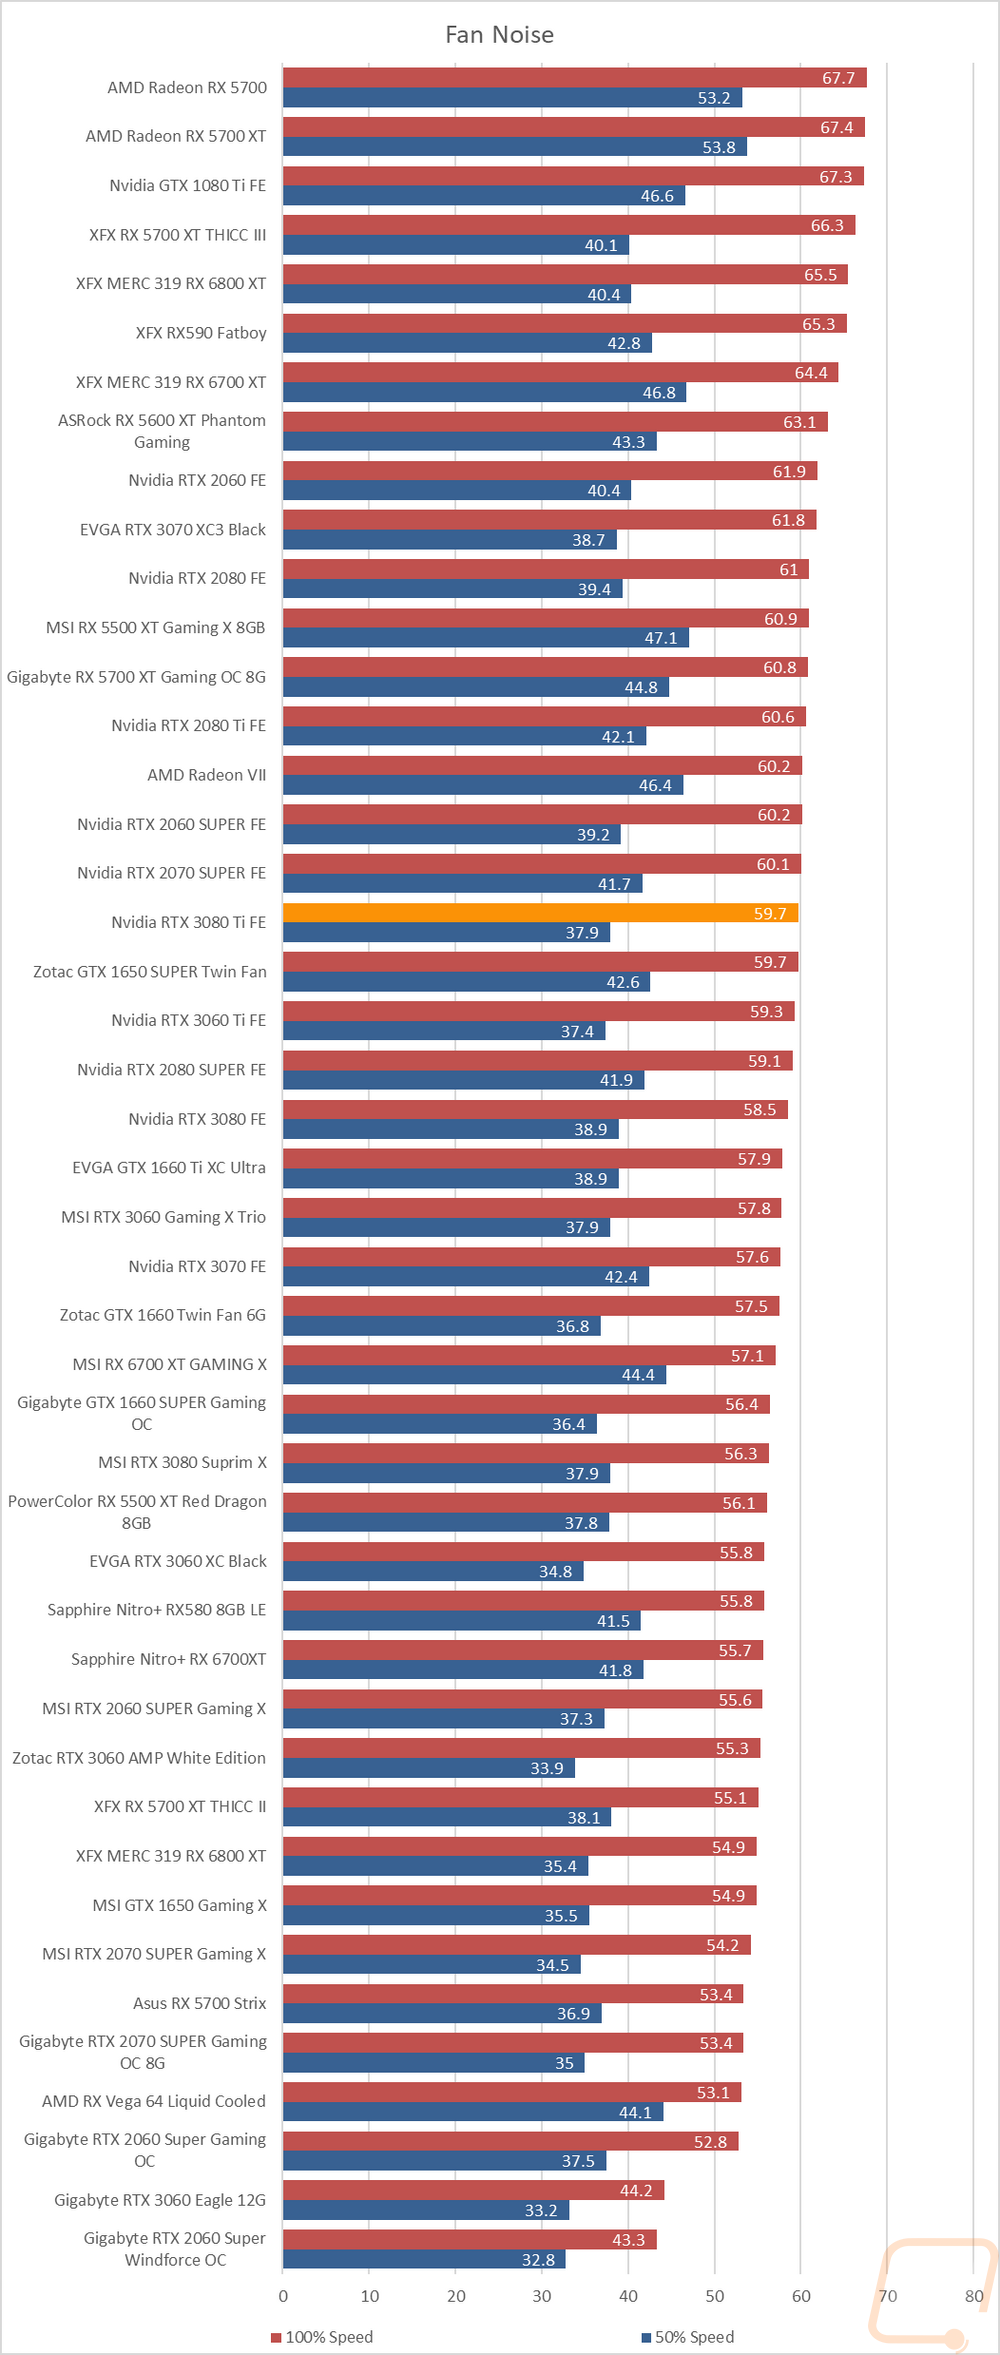
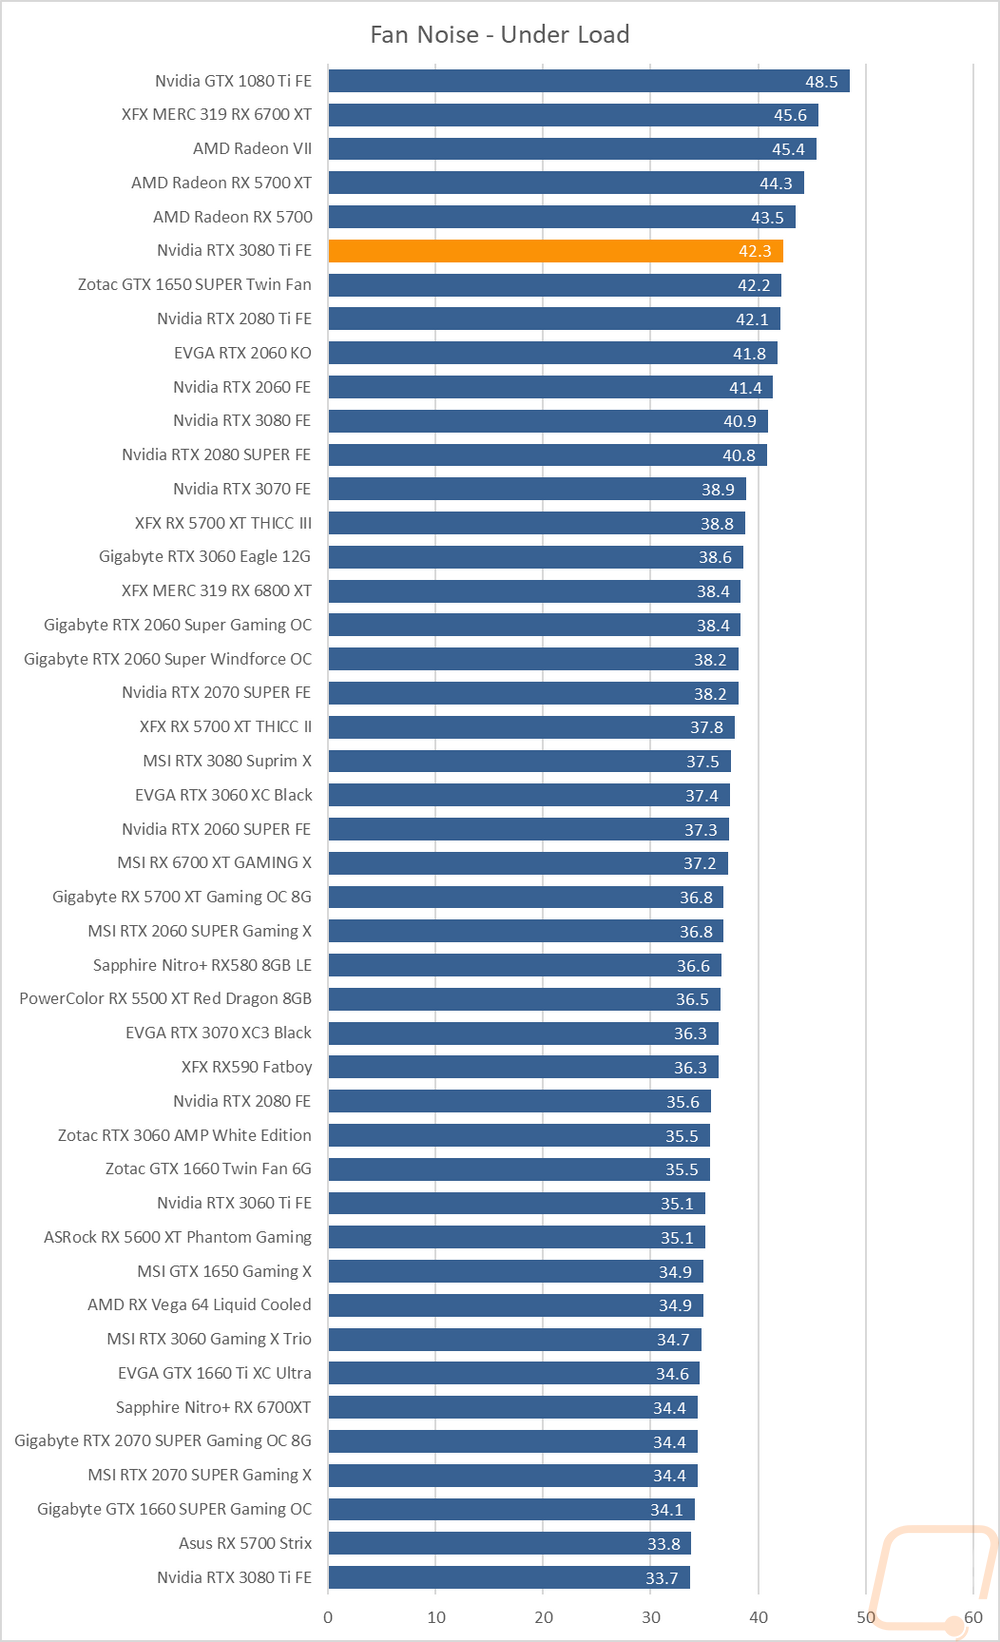
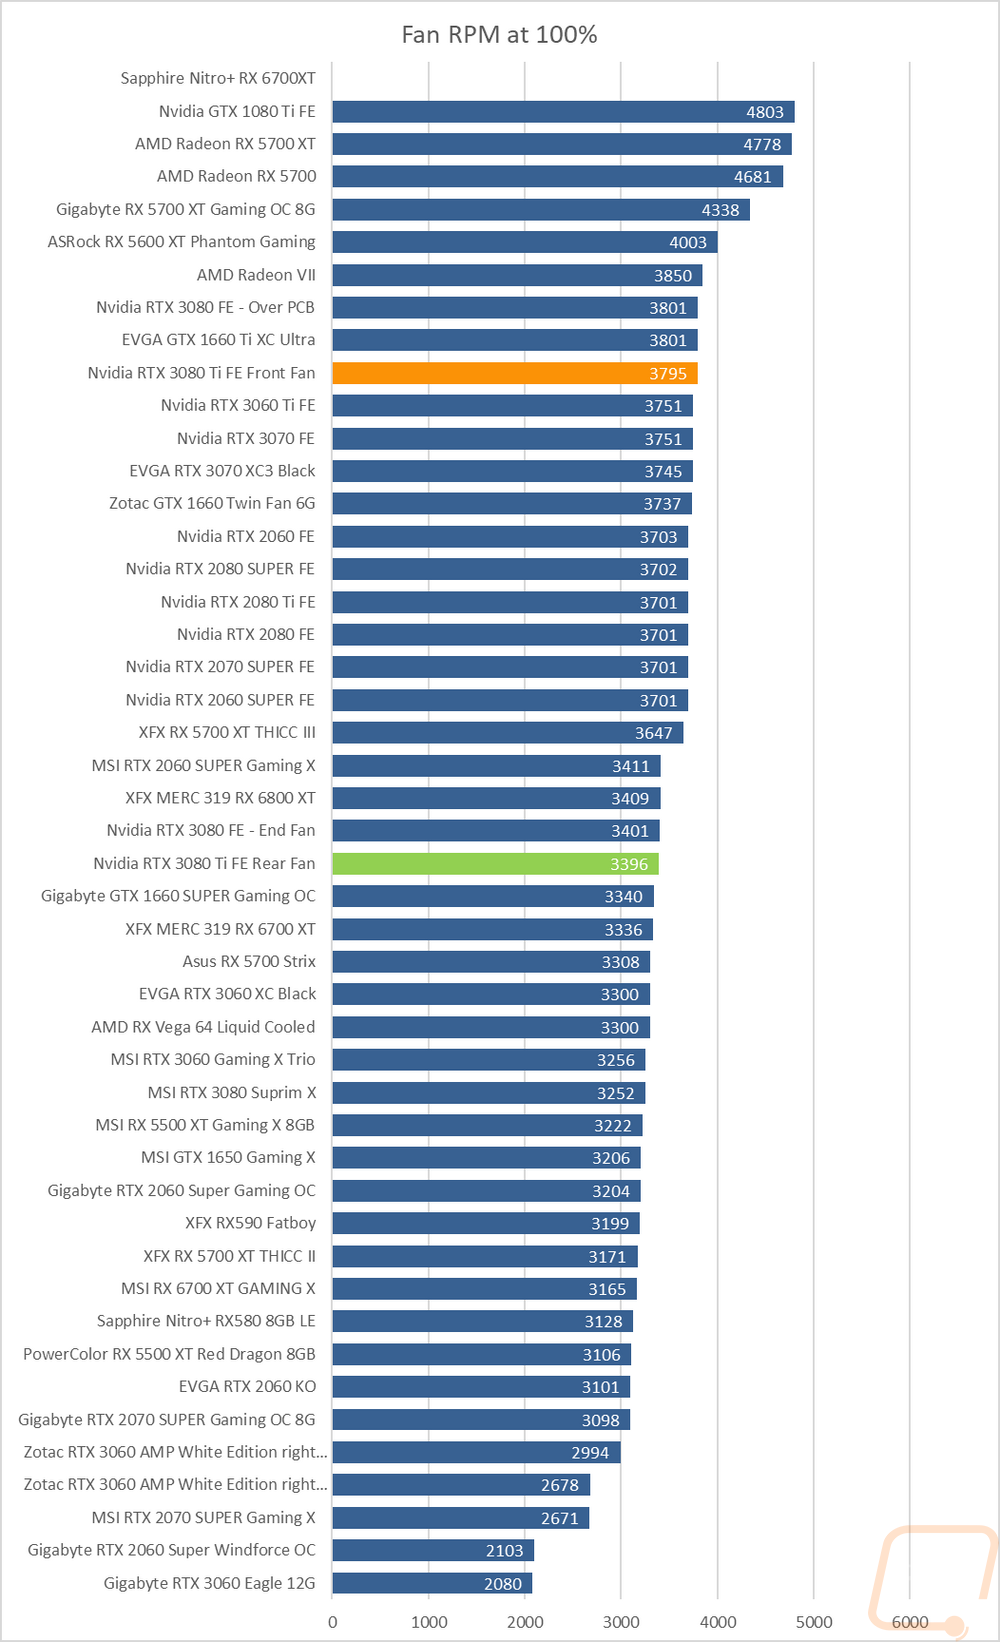
My next round of tests were looking at noise levels. These are especially important to me because I can’t stand to listen to my PC whirling. Especially when I’m not in game and other applications are using the GPU. For my testing, though I first tested with the fan cranked up to 100% to get an idea of how loud it can get, then again at 50% to get an idea of its range. The Nvidia RTX 3080 Ti FE came in the middle of the pack for its 100% fan speed at 59.7 decibels and 37.9 decibels at 50% fan speed. In the most important test with the card under load, the Nvidia RTX 3080 Ti FE ends up higher up in the charts at 42.3 dB. When we check out the fan RPMs you can see that the front fan is running at 3795 where Nvidia has the rear fan a little lower at 3396 right at the same speeds as the RTX 3080 FE so it does make sense that the 3080 Ti which is pulling more power would run a little noisier than the 3080 FE with the same cooler.
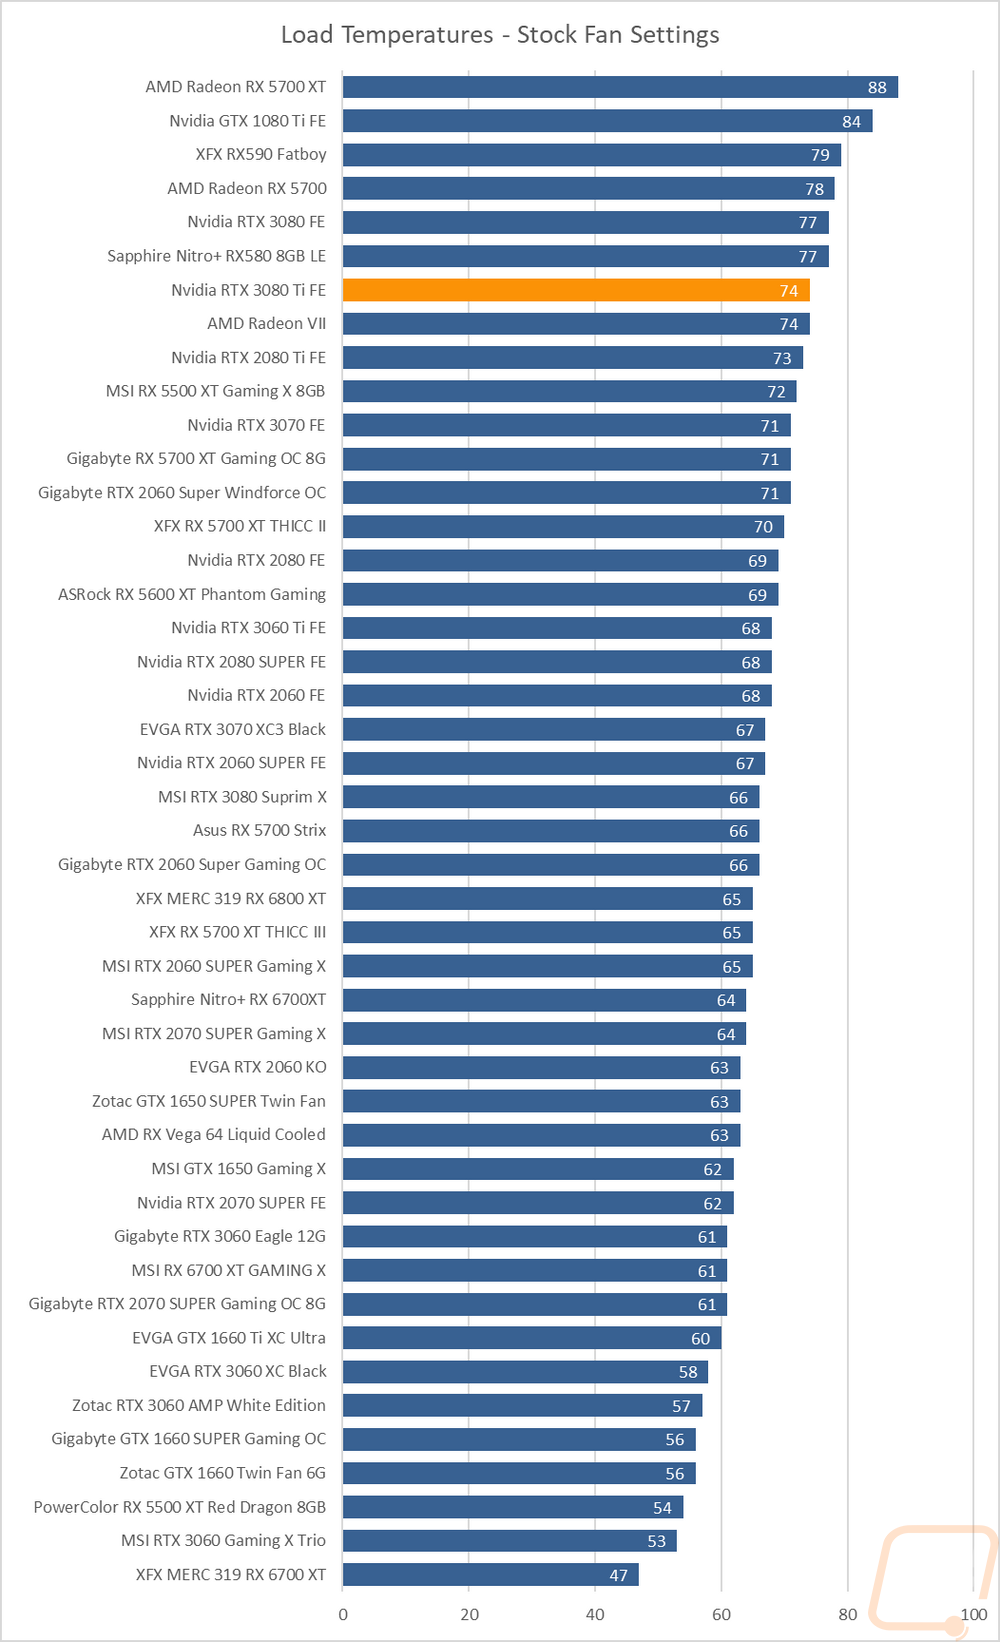
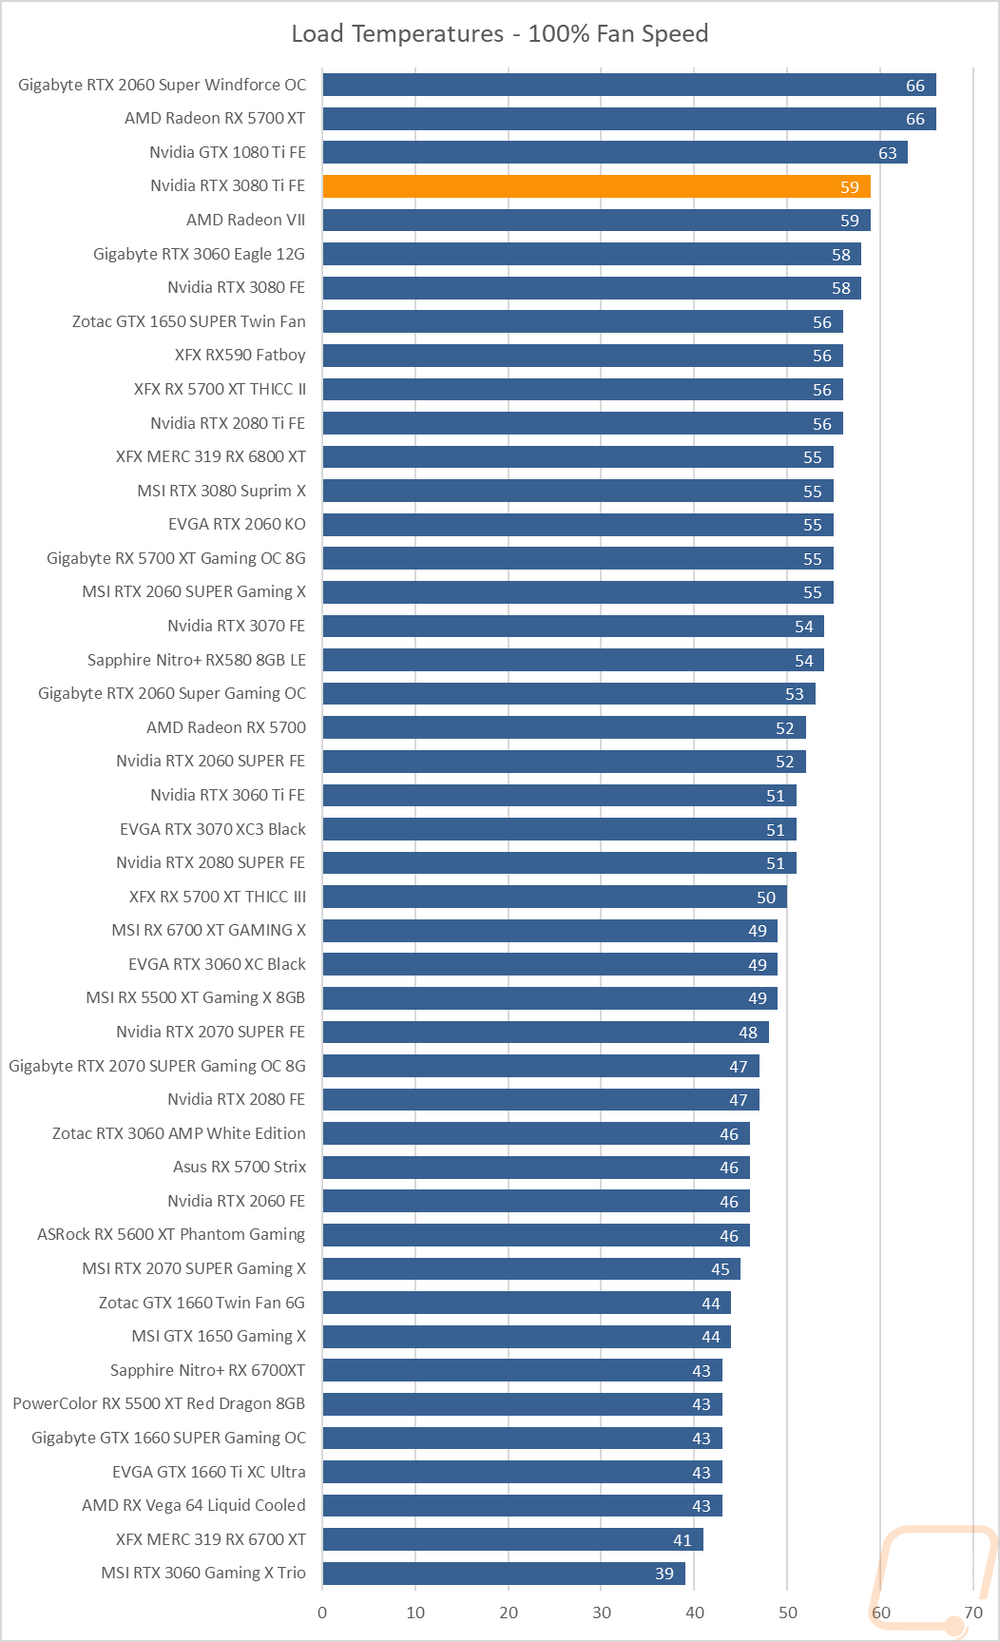
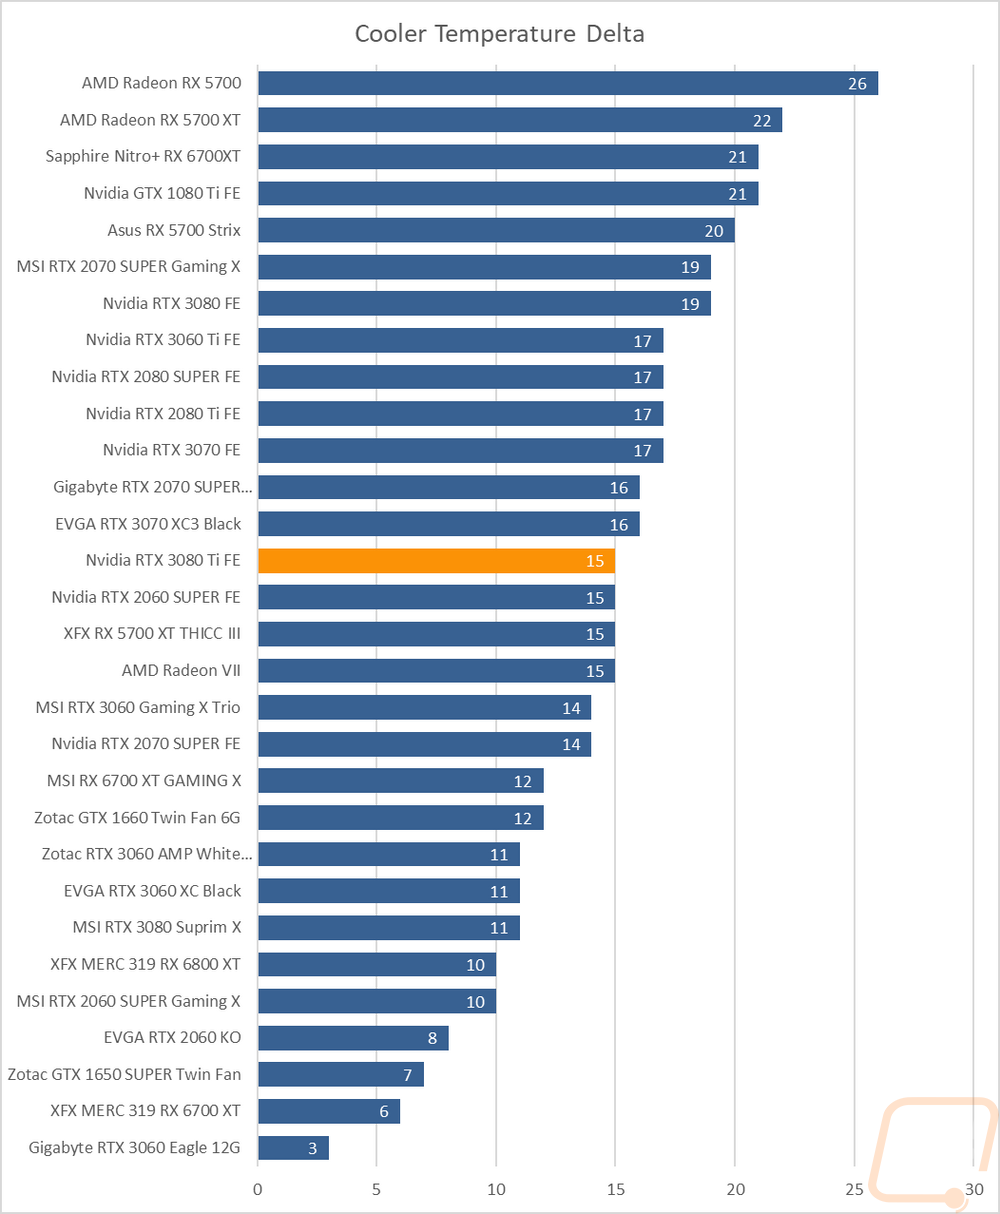
To finish up my testing I of course had to check out the cooling performance. To do this I ran two different tests. I used AIDA64’s Stress Test run for a half-hour each to warm things up. Then I documented what temperature the GPU leveled out at with the stock fan profile and then again with the fans cranked up to 100%. With the stock profile, the Nvidia RTX 3080 Ti FE runs at 74c which is warm but a few degrees lower than the RTX 3080 FE did for us with the stock fan profile. Nvidia must have a more aggressive fan profile to make up for the additional heat. Then at 100% fan speed, it is again up near the top of the charts at 59c, 1 degree warmer than the 3080 FE. The delta between the two was 15c which is about average meaning there is still a little room left in the cooling though I don’t know if I would want to make it any noisier.
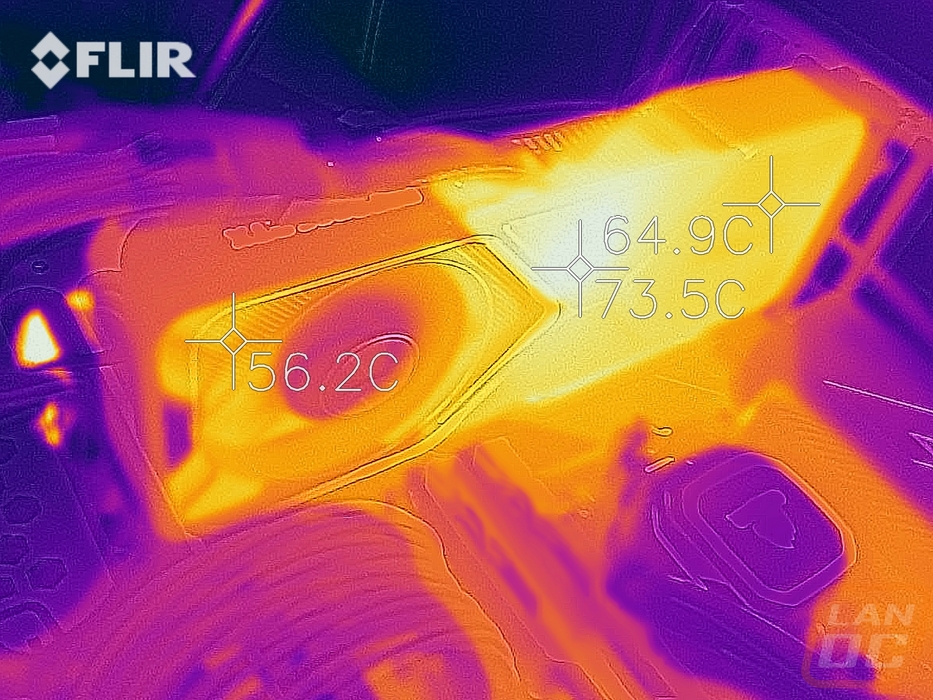
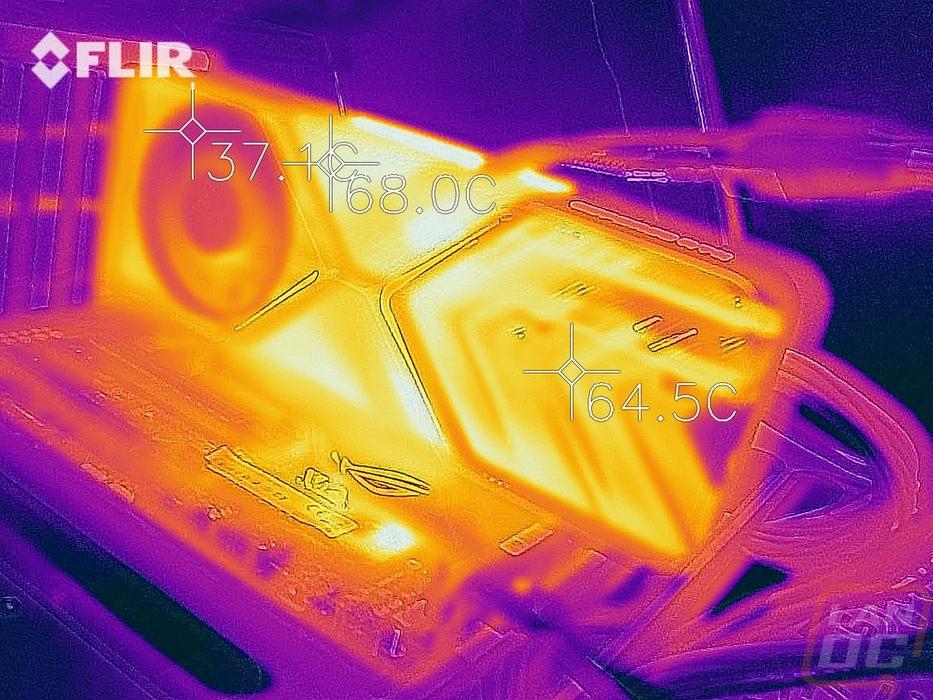
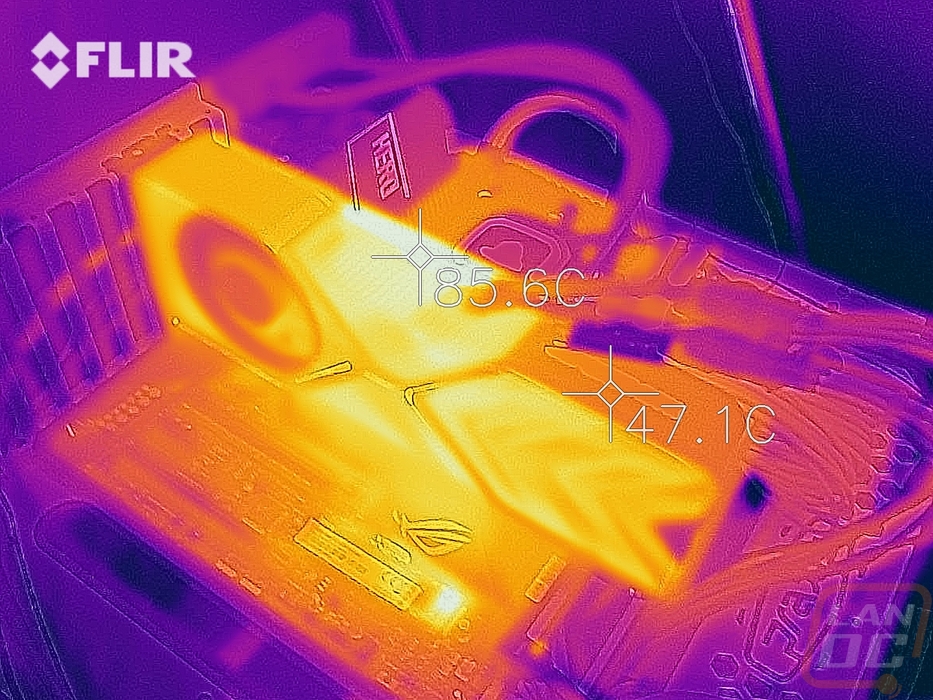
While running the stock fan profile testing I also took the time to get a few thermal images so we could see what is going on. The Nvidia RTX 3080 Ti FE with its exposed heatsinks is also a little unique to see with the thermal camera. On the back of the card, we can see that the hottest spot is in the top section in the center which on the surface is showing 73c, even on the other surfaces where you can see the warmer temps but we do have to keep in mind this is the heatsink, not the fan shroud. The front side of the card is similar as well but you can see how much cooler things are running behind the fan itself on the left. Then the top view shows how hot the PCB is getting in that hot area in the top center where the card vents.