In-Game Benchmarks
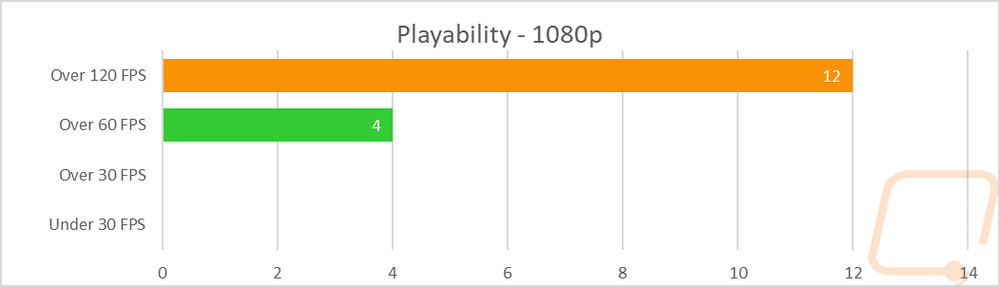
Now we finally get into the in game performance and that is the main reason people pick up a new video card. To test things out I ran through our new benchmark suite that tests 9 games at three different resolutions (1080p, 1440p, and 4k). Most of the games tested have been run at the highest detail setting and a mid-range detail setting to get a look at how turning things up hurts performance and to give an idea of if turning detail down from max will be beneficial for frame rates. In total, each video card is tested 48 times and that makes for a huge mess of results when you put them all together. To help with that I like to start with these overall playability graphs that take all of the results and give an easier to read result. I have one for each of the three resolutions and each is broken up into four FPS ranges. Under 30 FPS is considered unplayable, over 30 is playable but not ideal, over 60 is the sweet spot, and then over 120 FPS is for high refresh rate monitors.
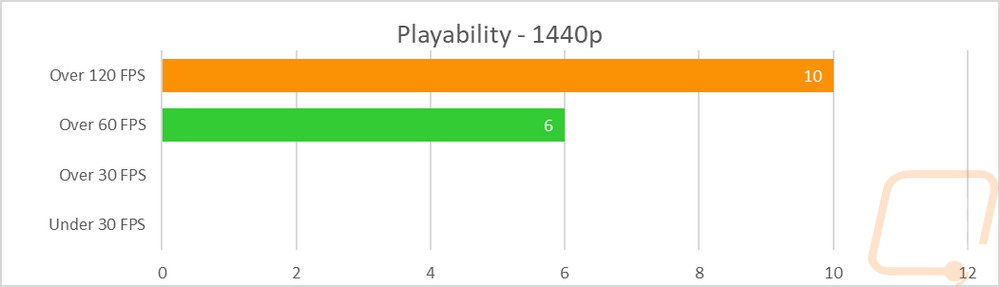
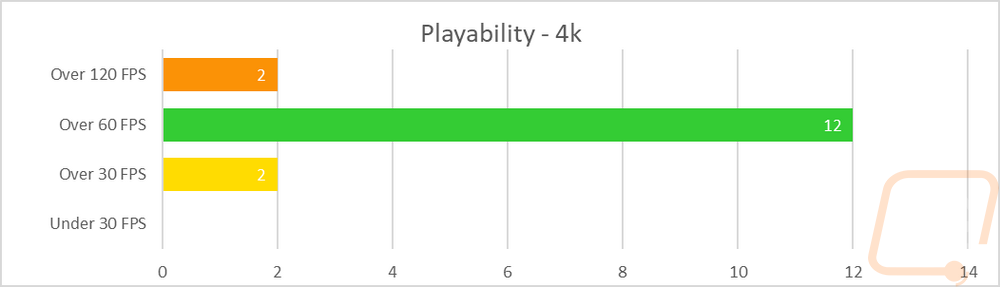
So how did the 3080 Ti Founders Edition do when we get a look at the overall numbers? Well, there weren’t any big surprises at 1080p where it just whipped through everything. 12 out of the 16 tests were up over 120 FPS and of course, the other 4 were all up over 60 FPS as well. The same goes for 1440p really where 10 results were over 120 FPS and 6 were over 60 FPS. It isn’t until we hit 4k that the 3080 Ti Founders Edition really saw any resistance at all and even there everything went smoothly. Everything was playable, only 2 were in the 30-59 FPS range with 12 over 60 and 2 over 120 FPS.
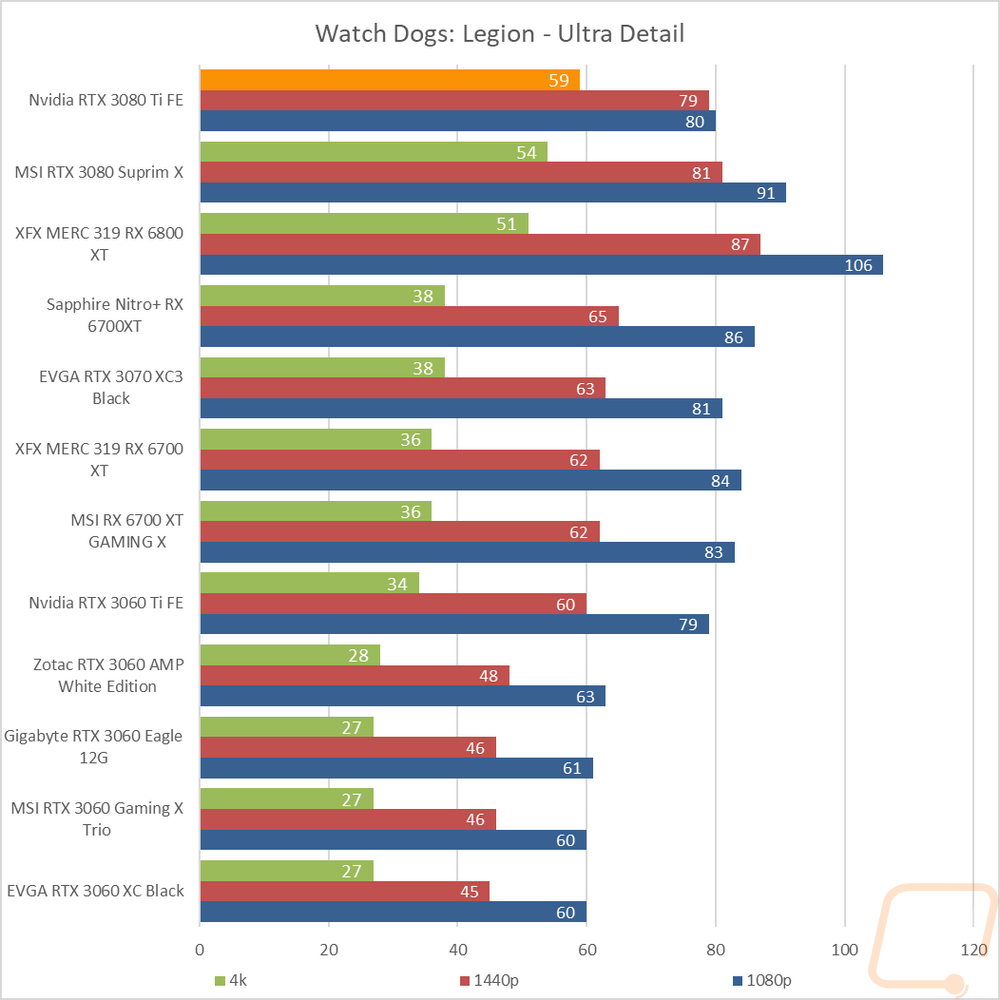
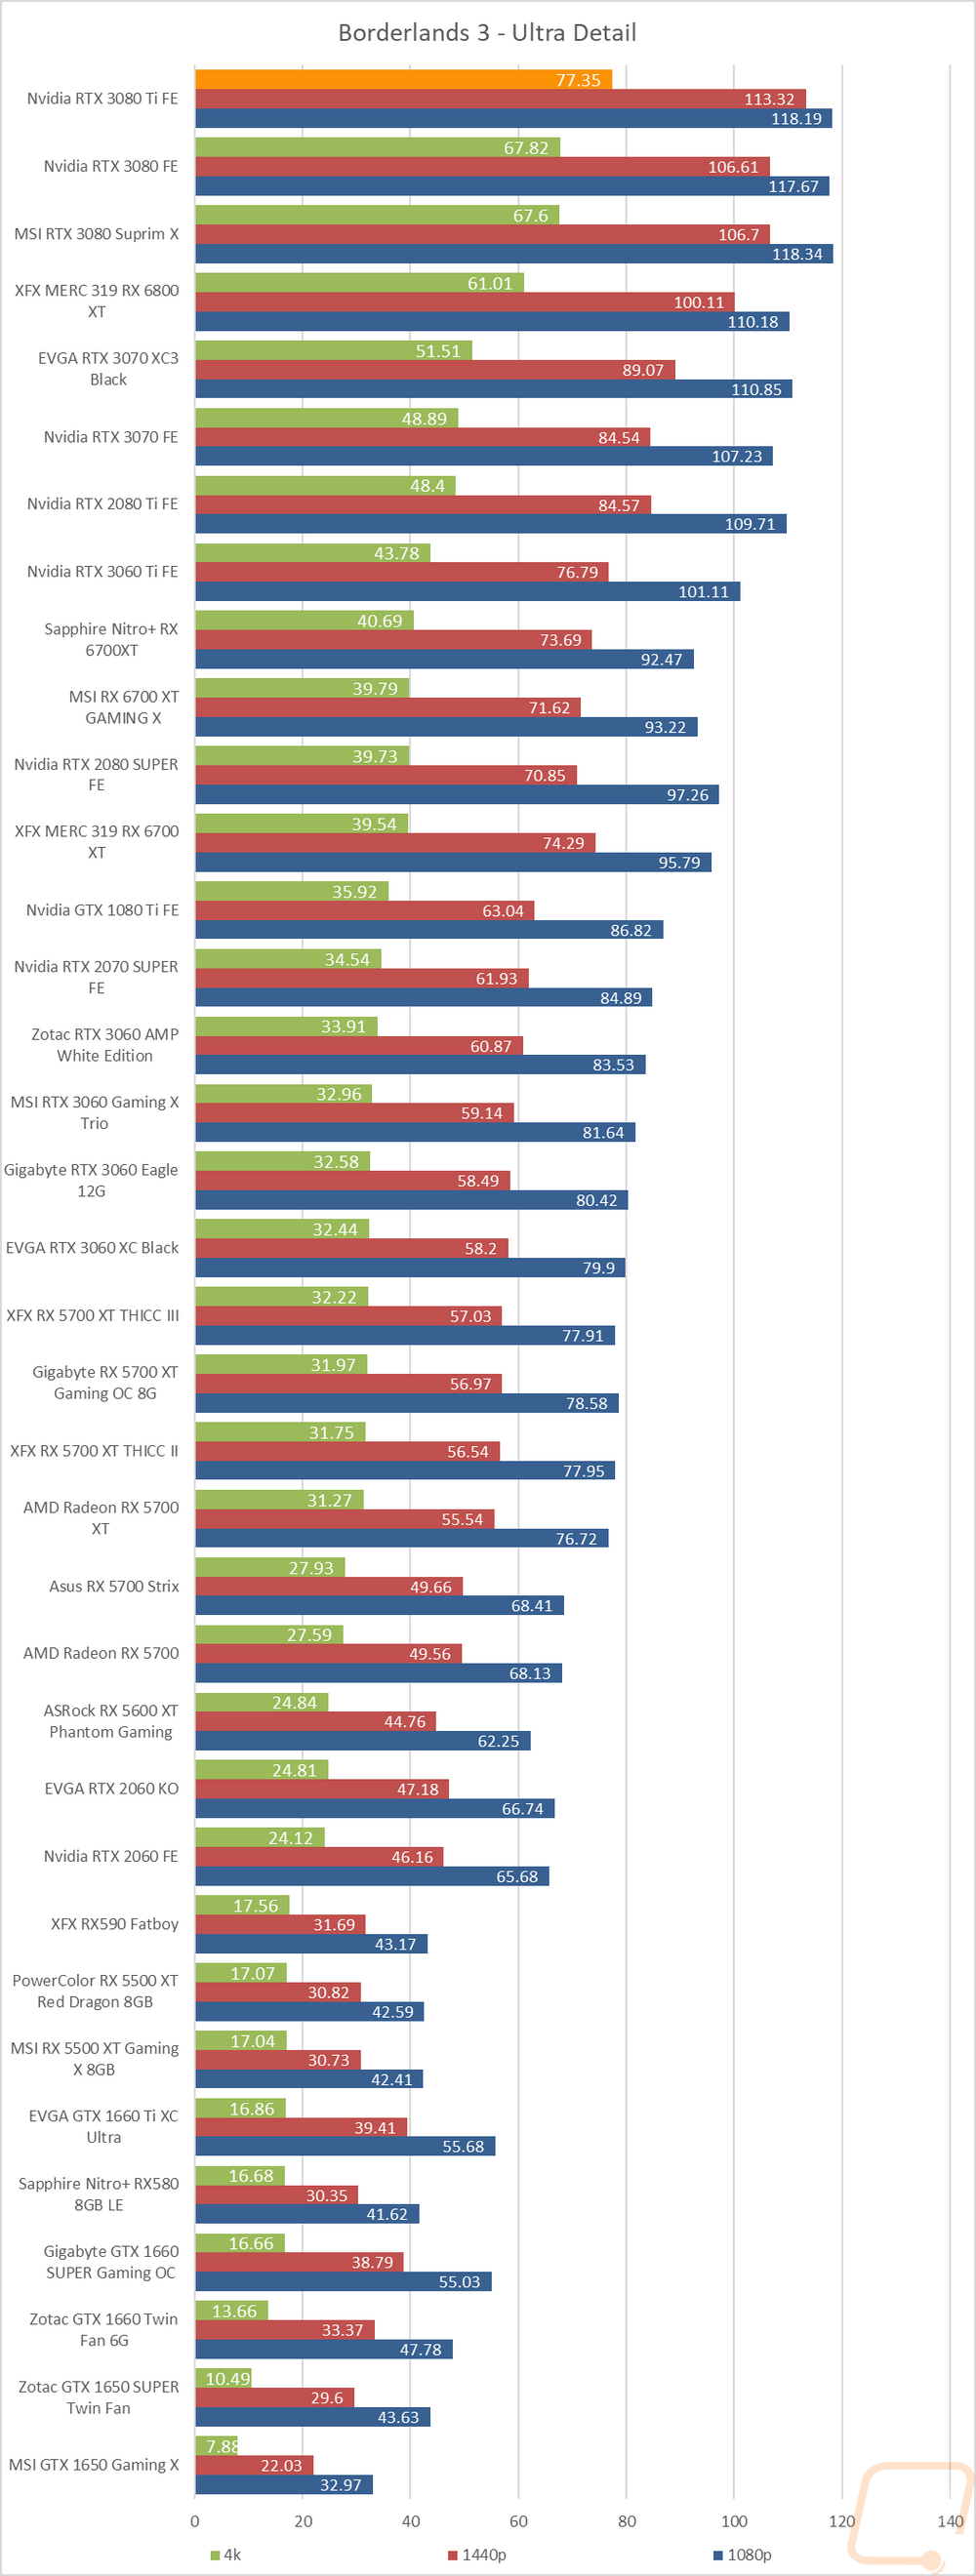
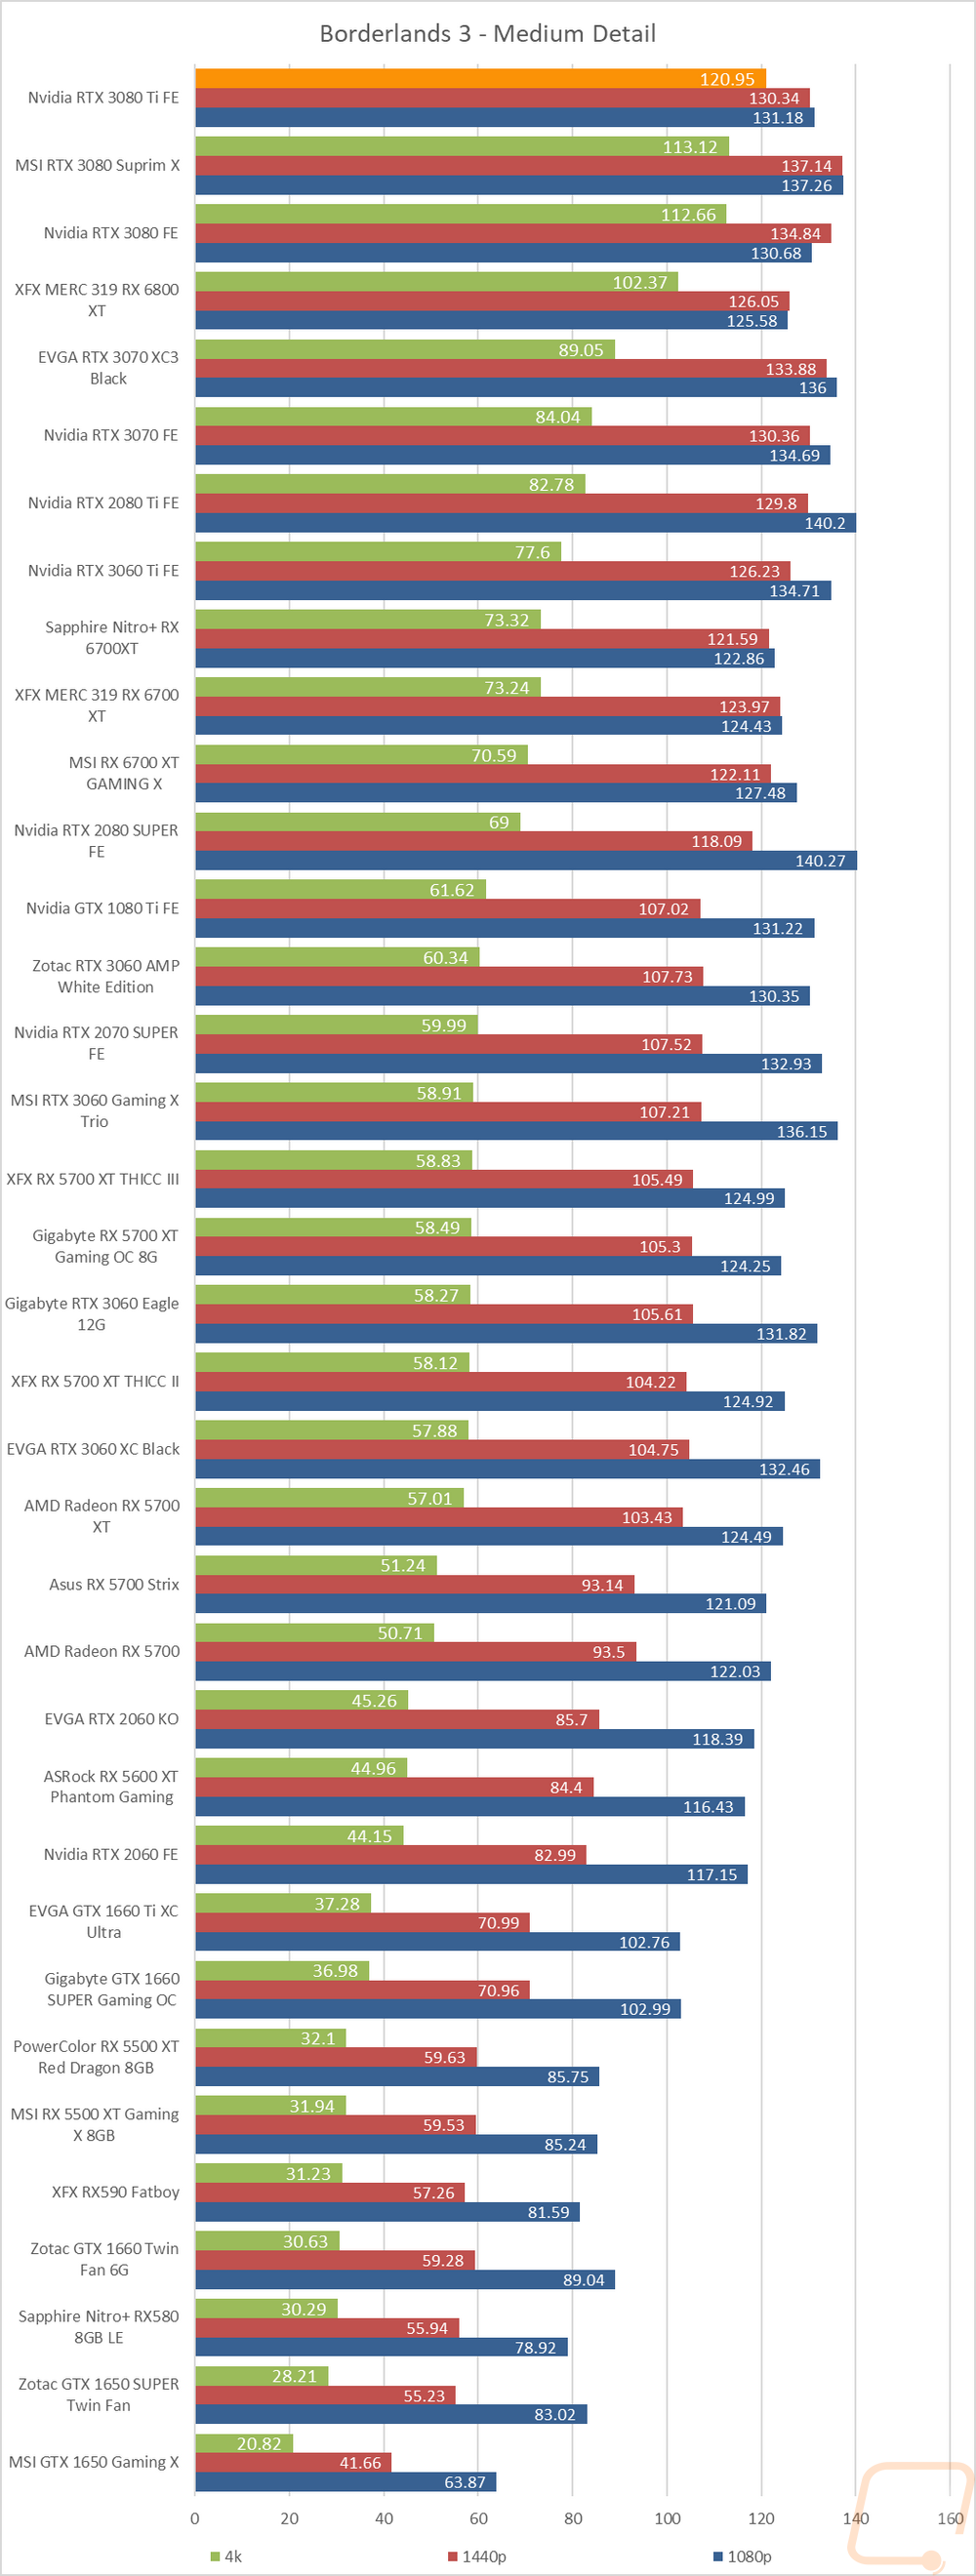
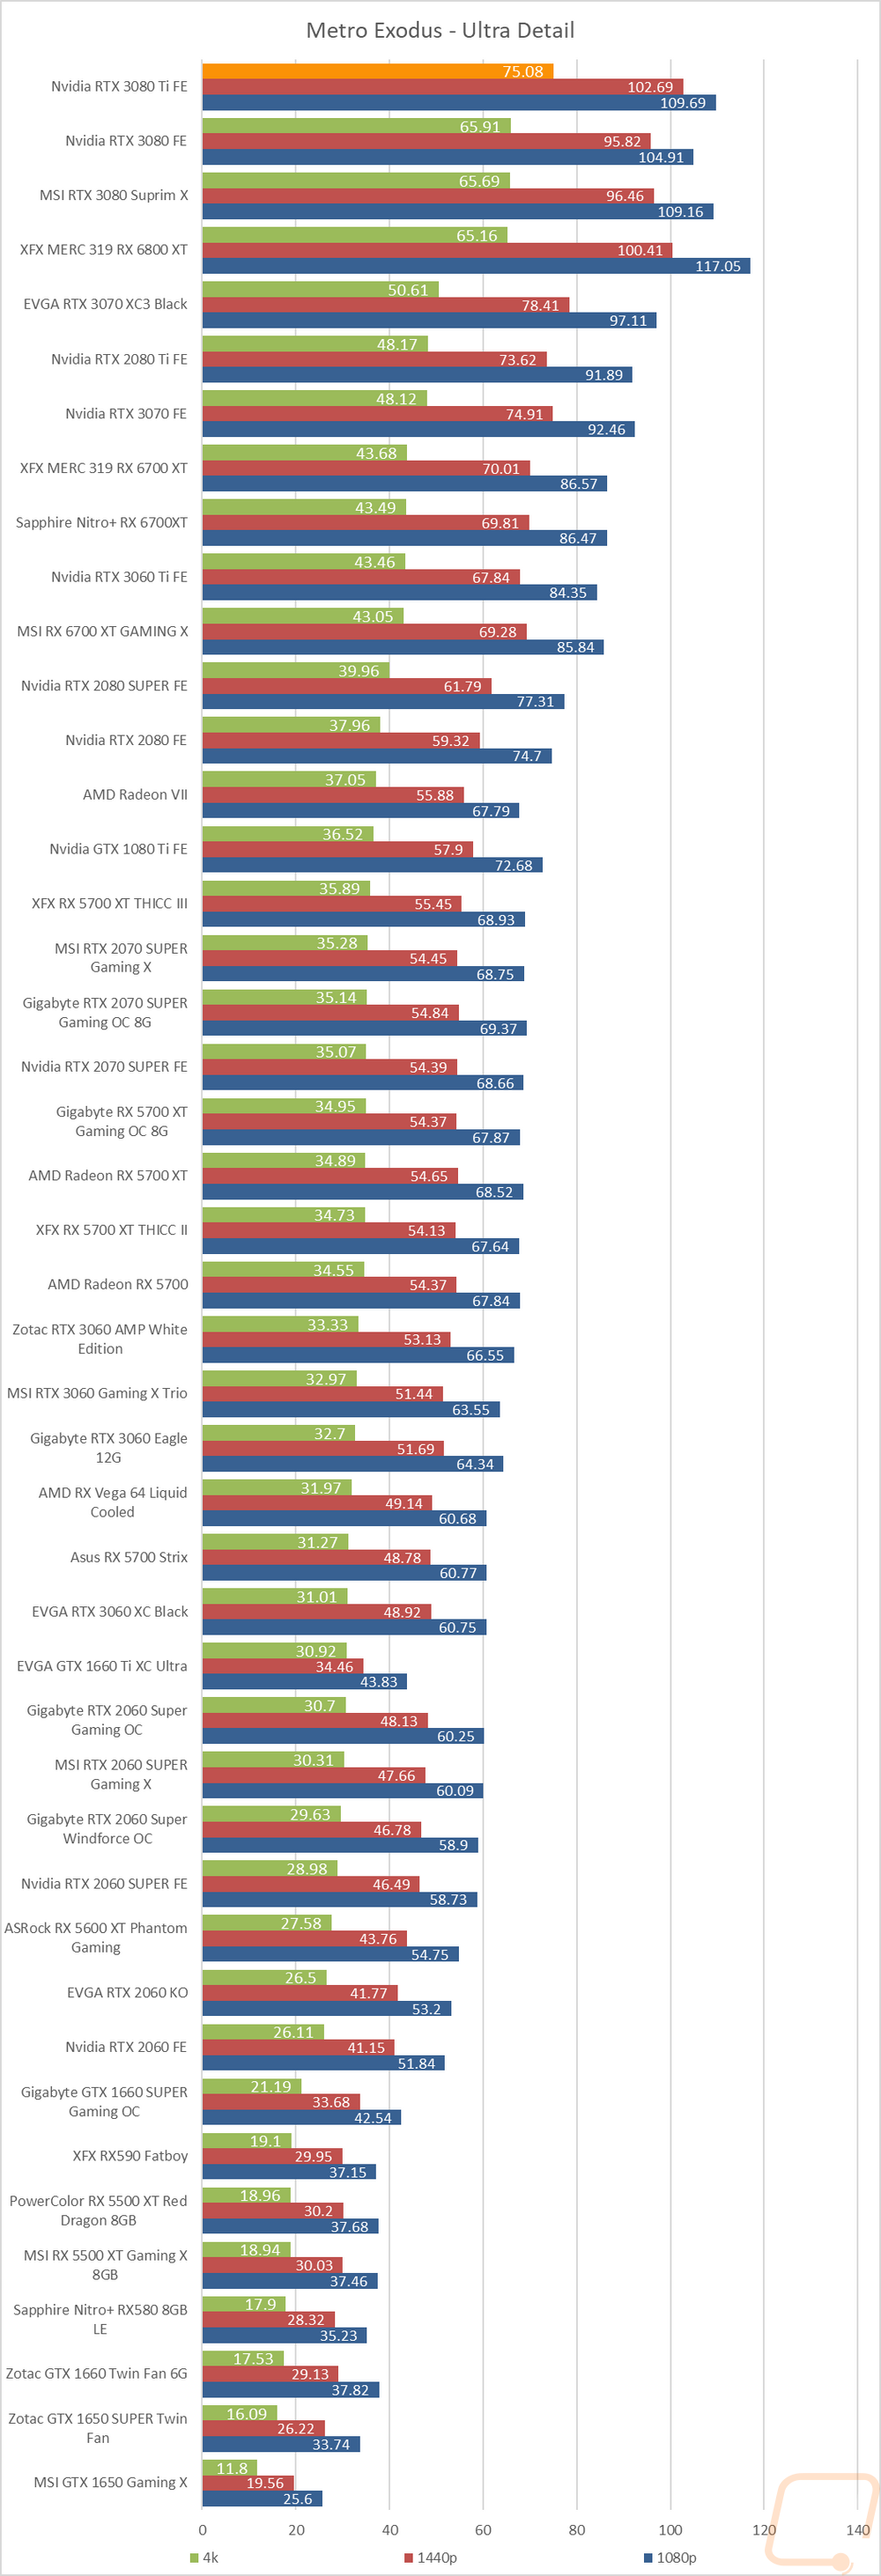
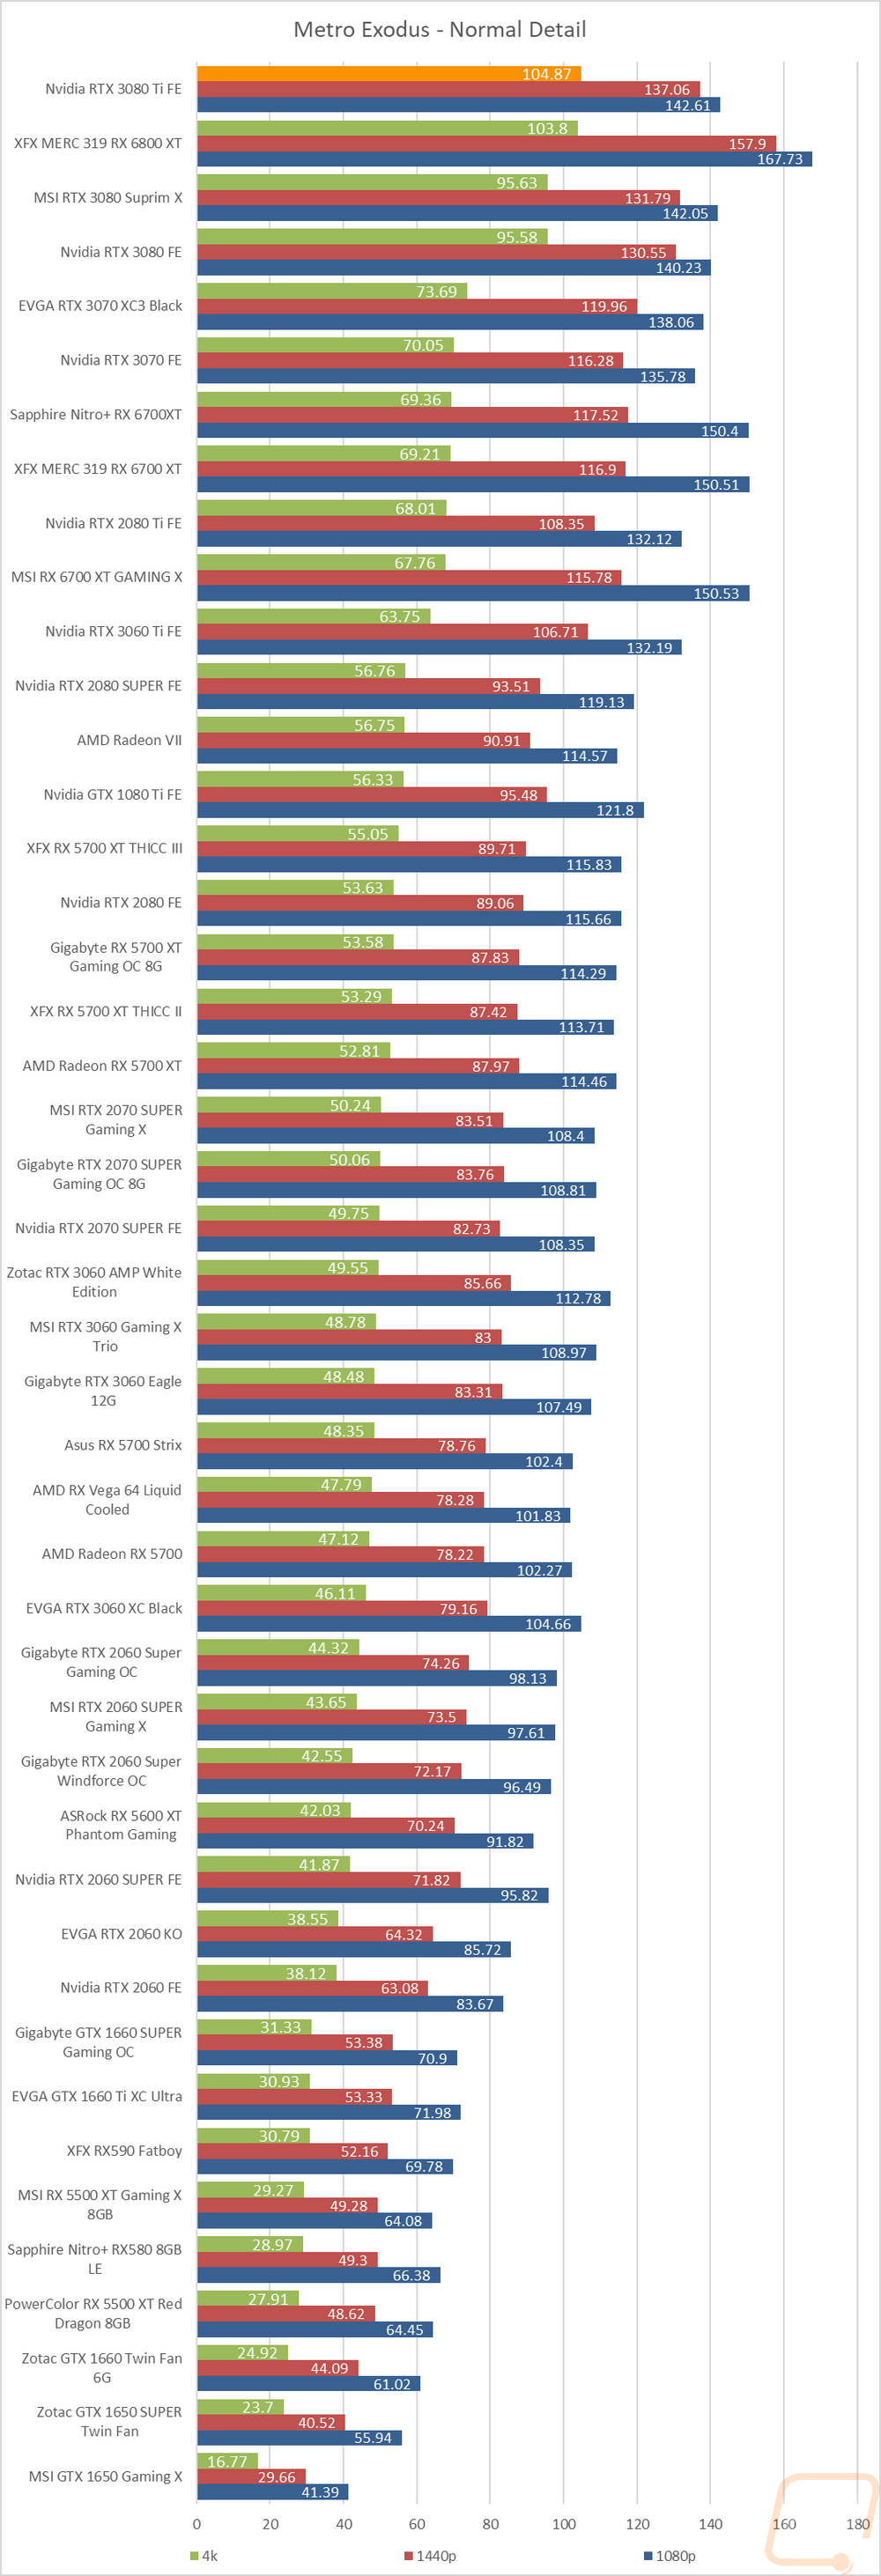
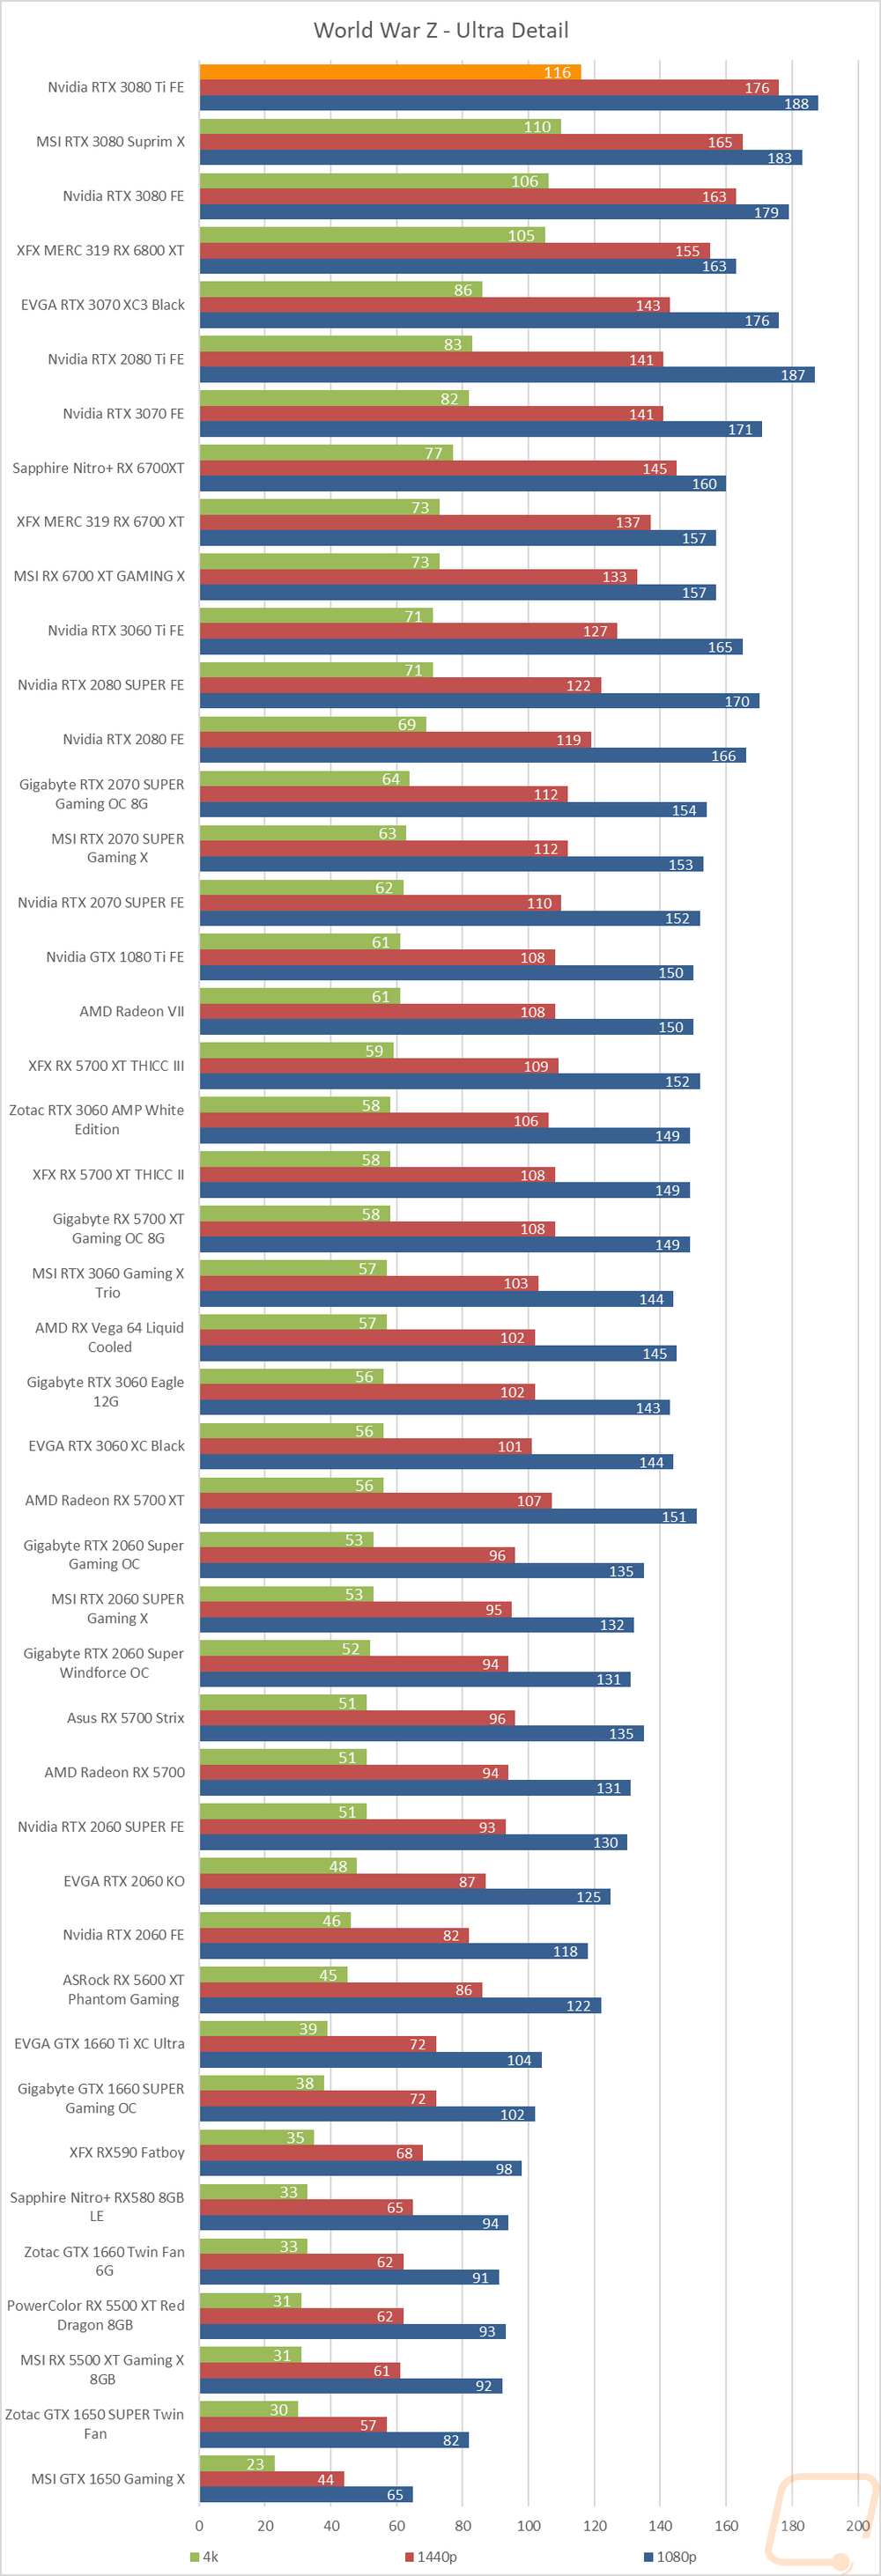
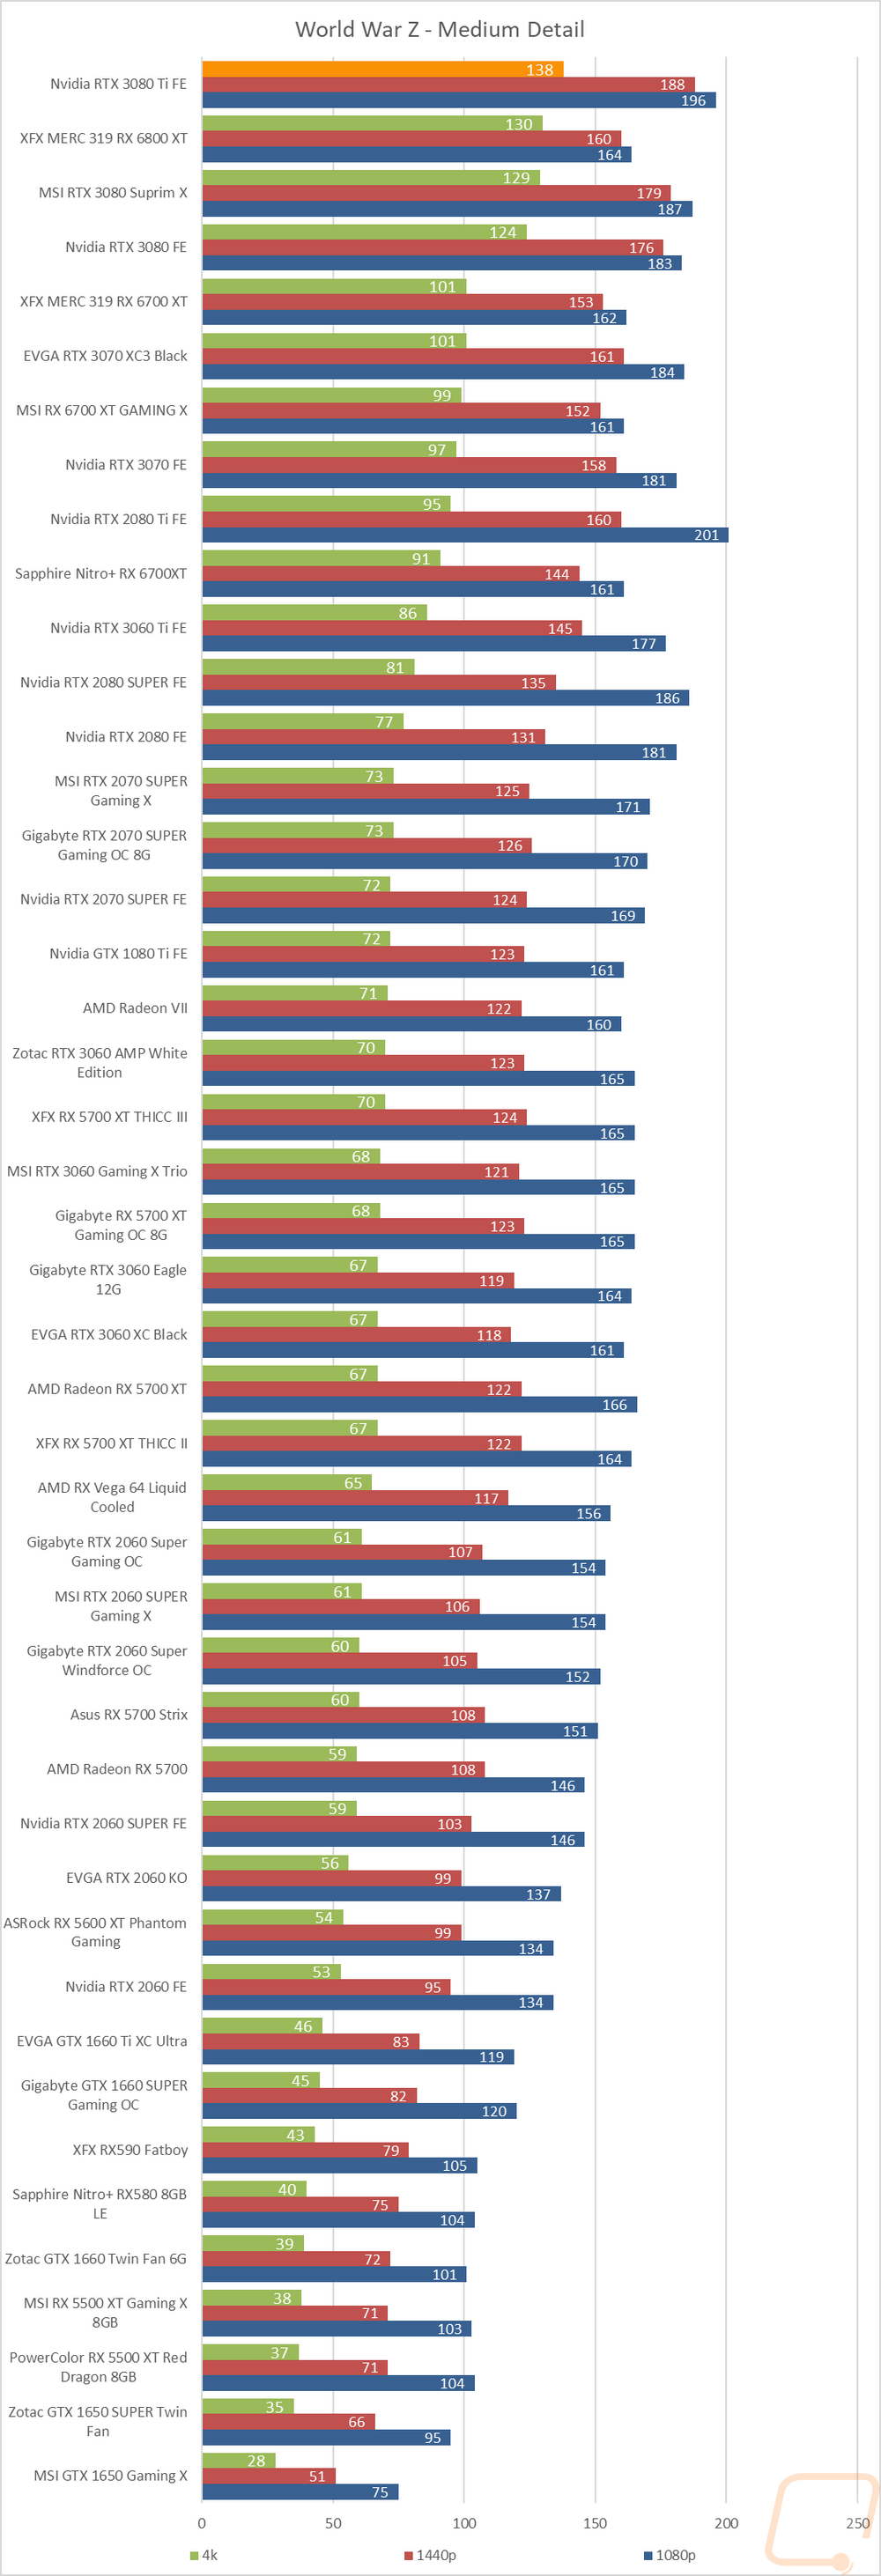
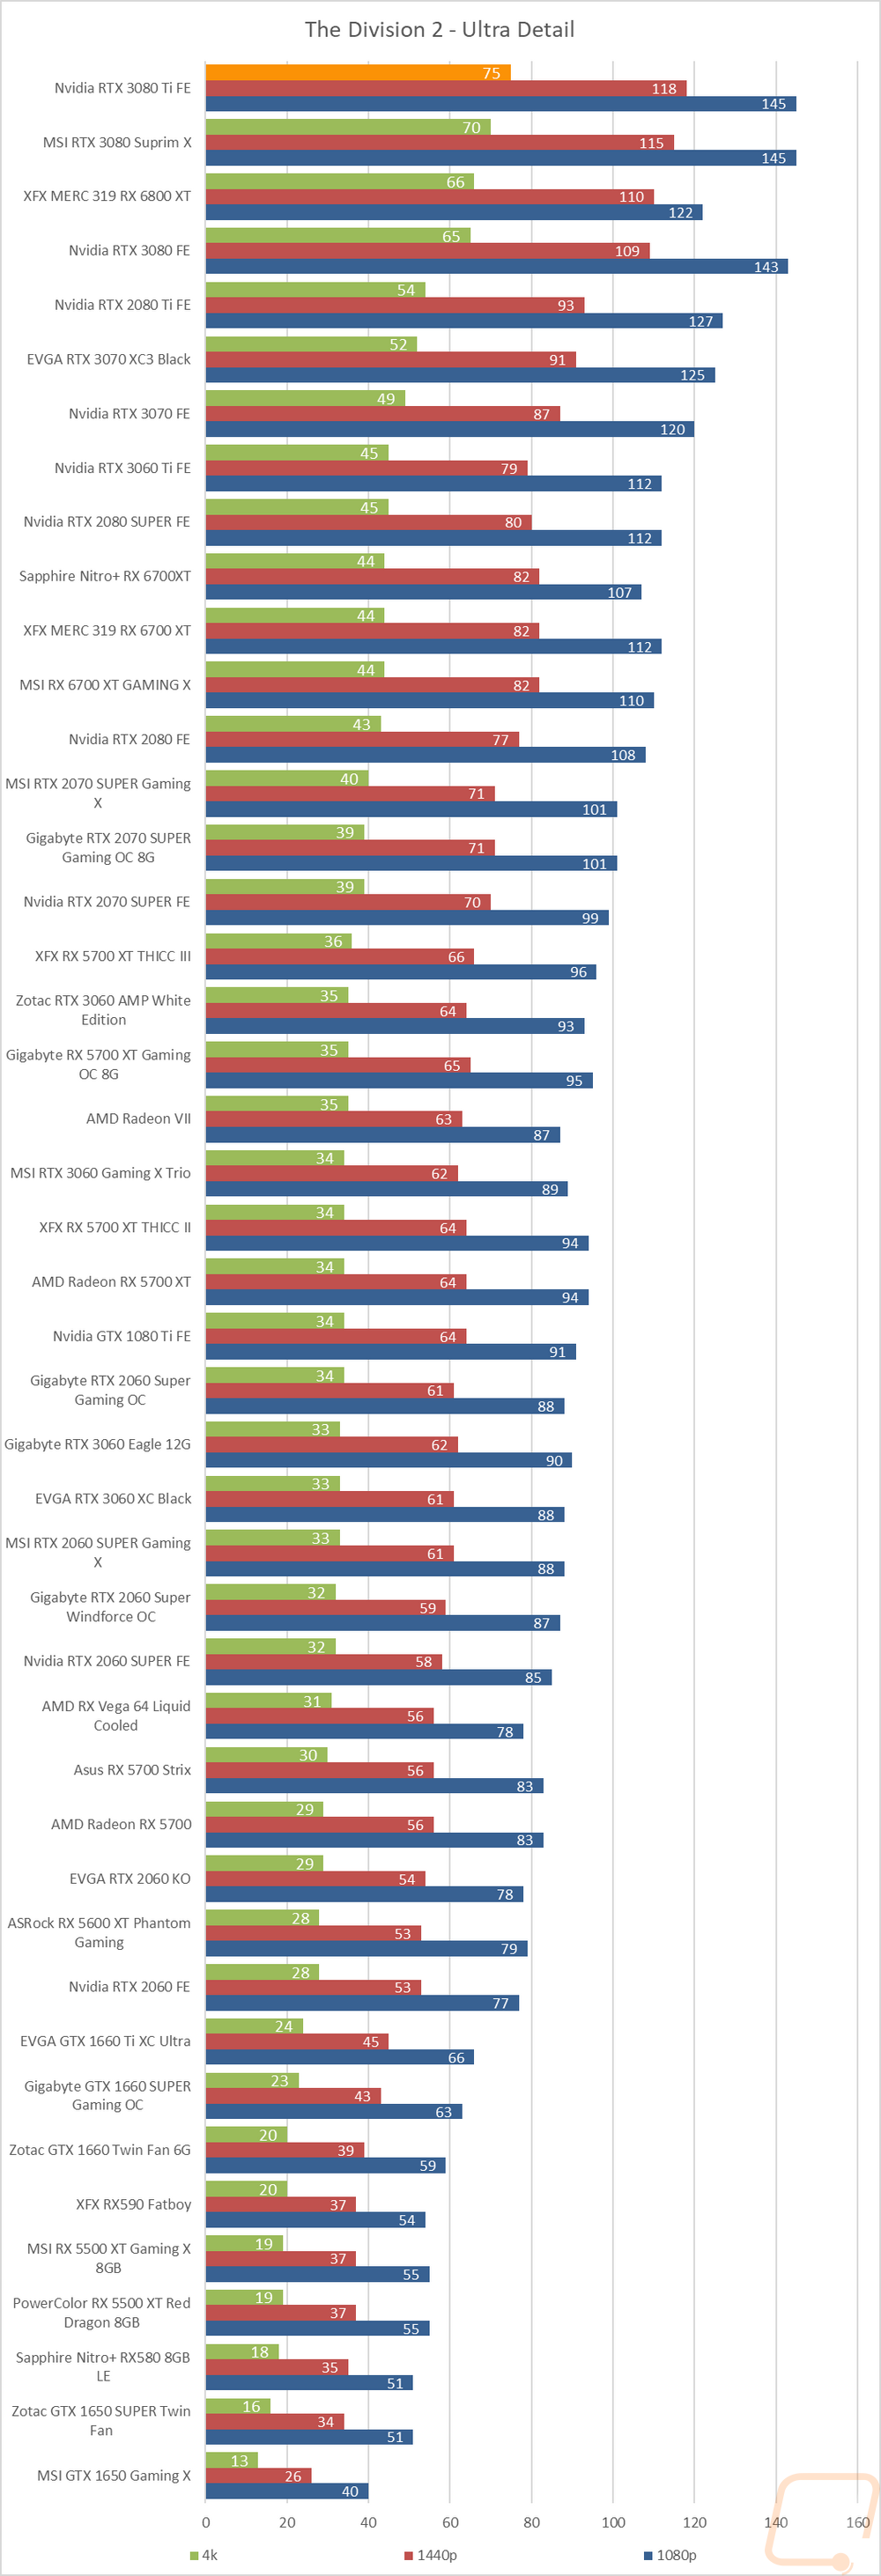
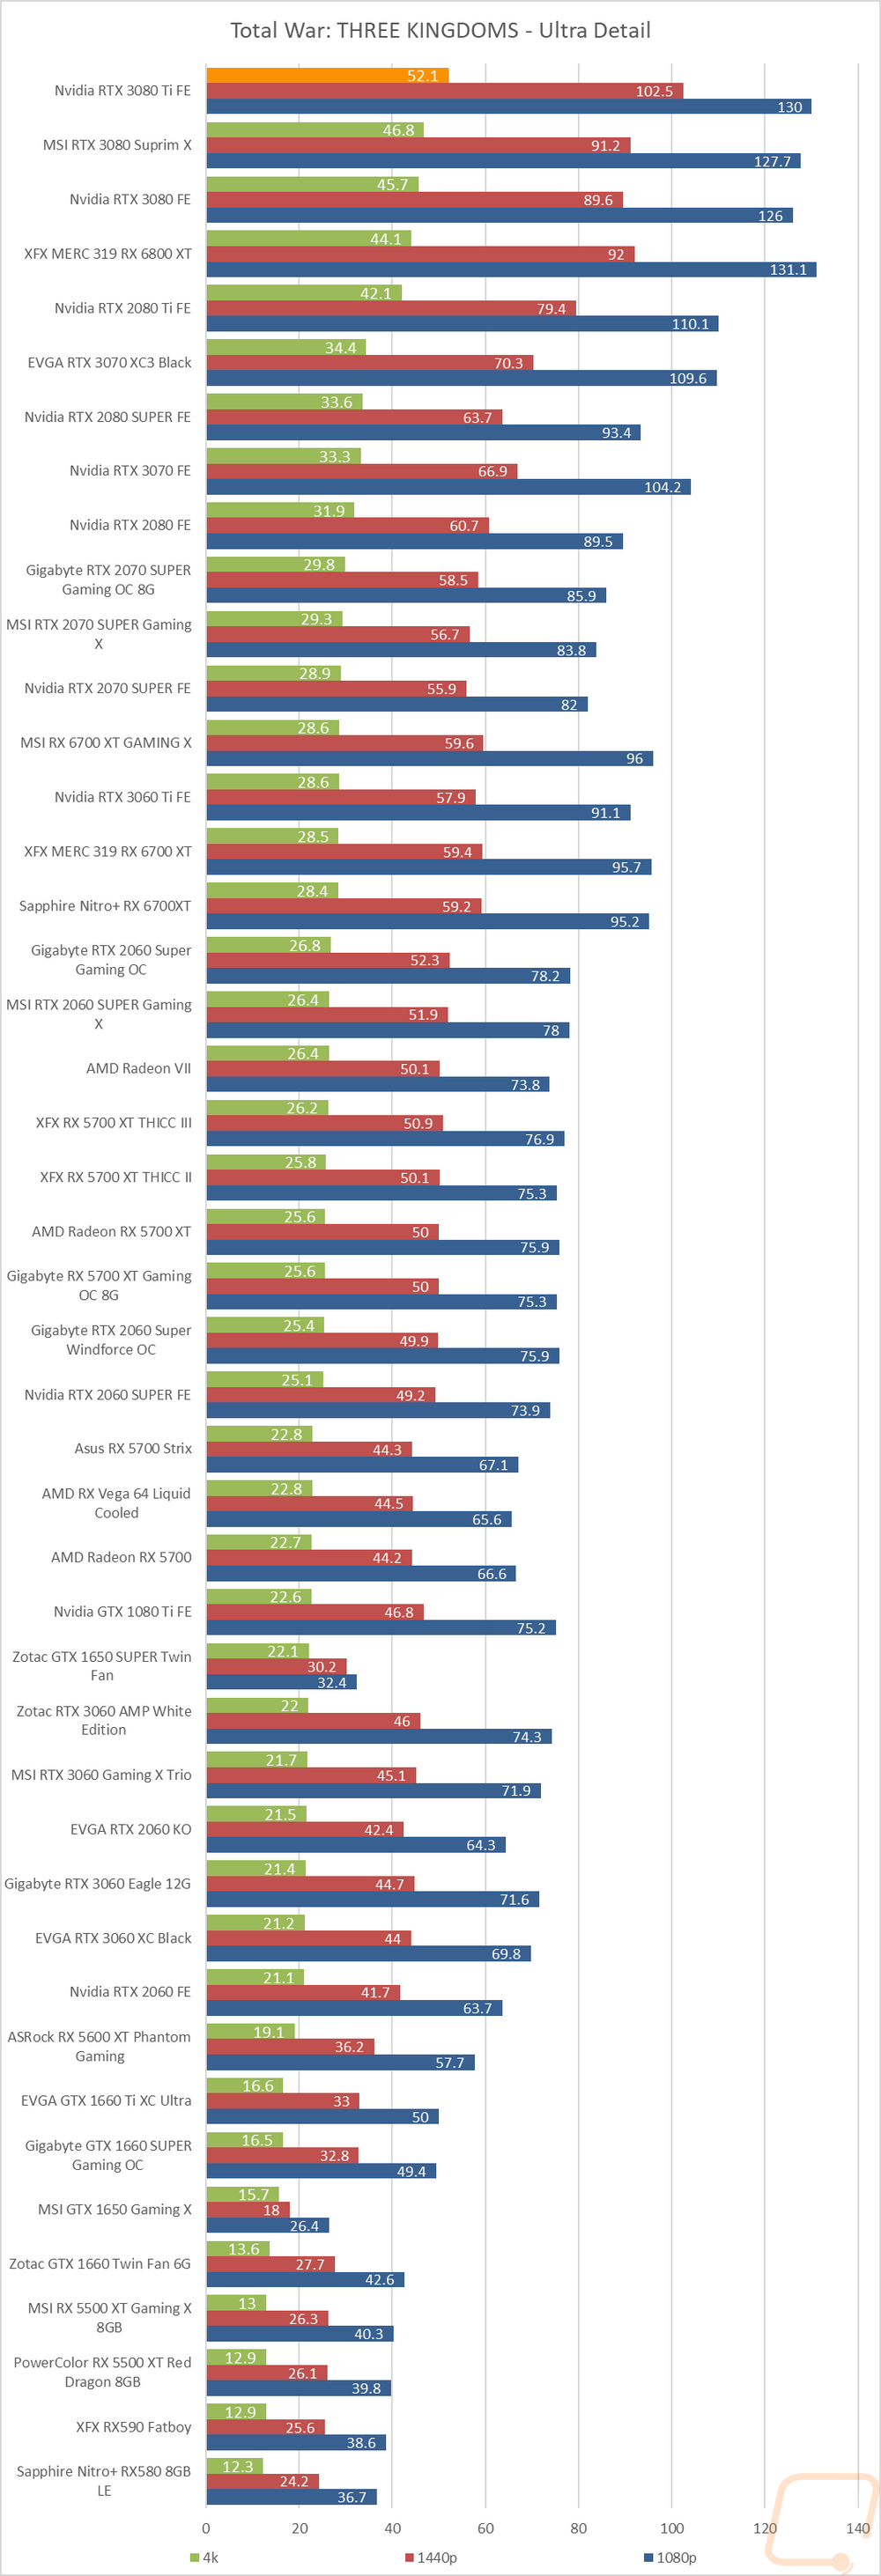
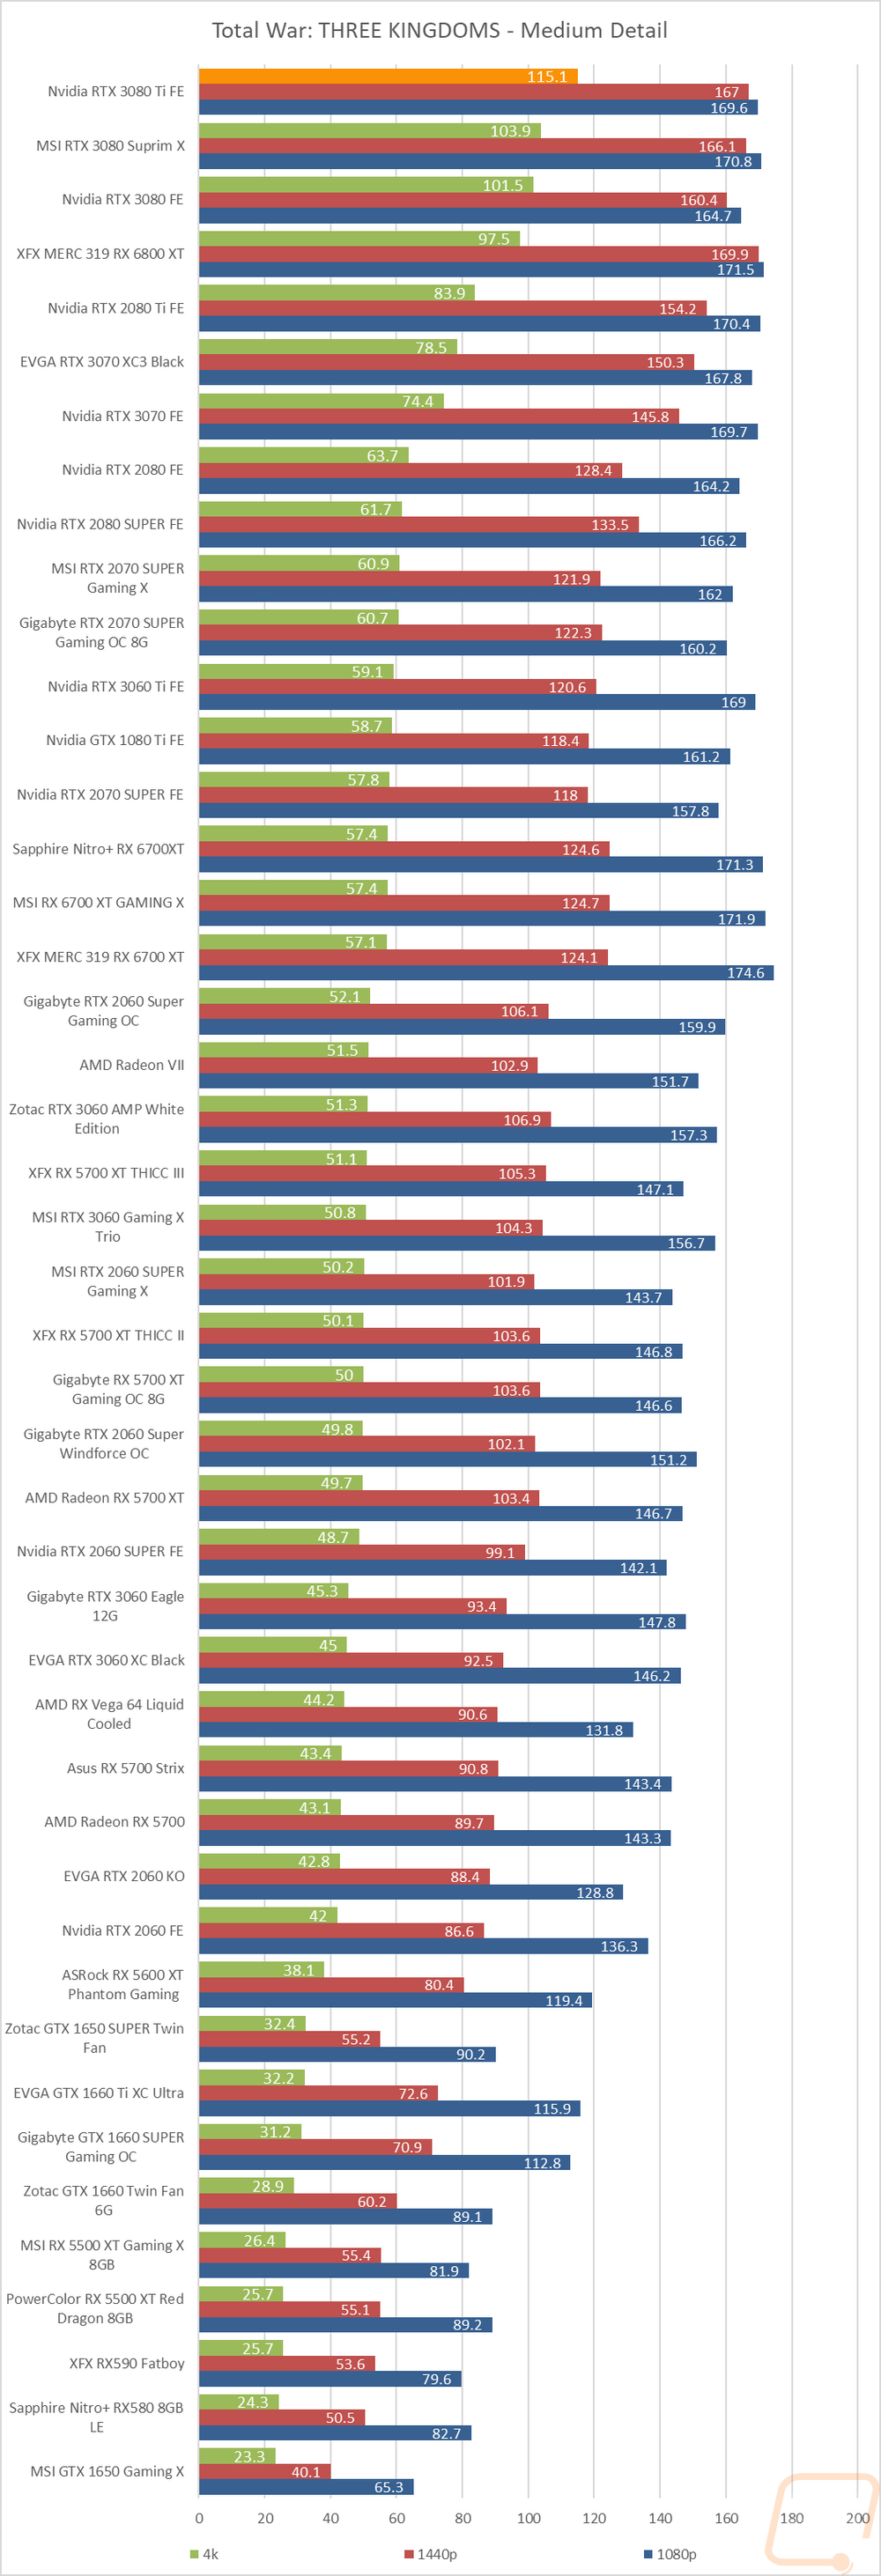
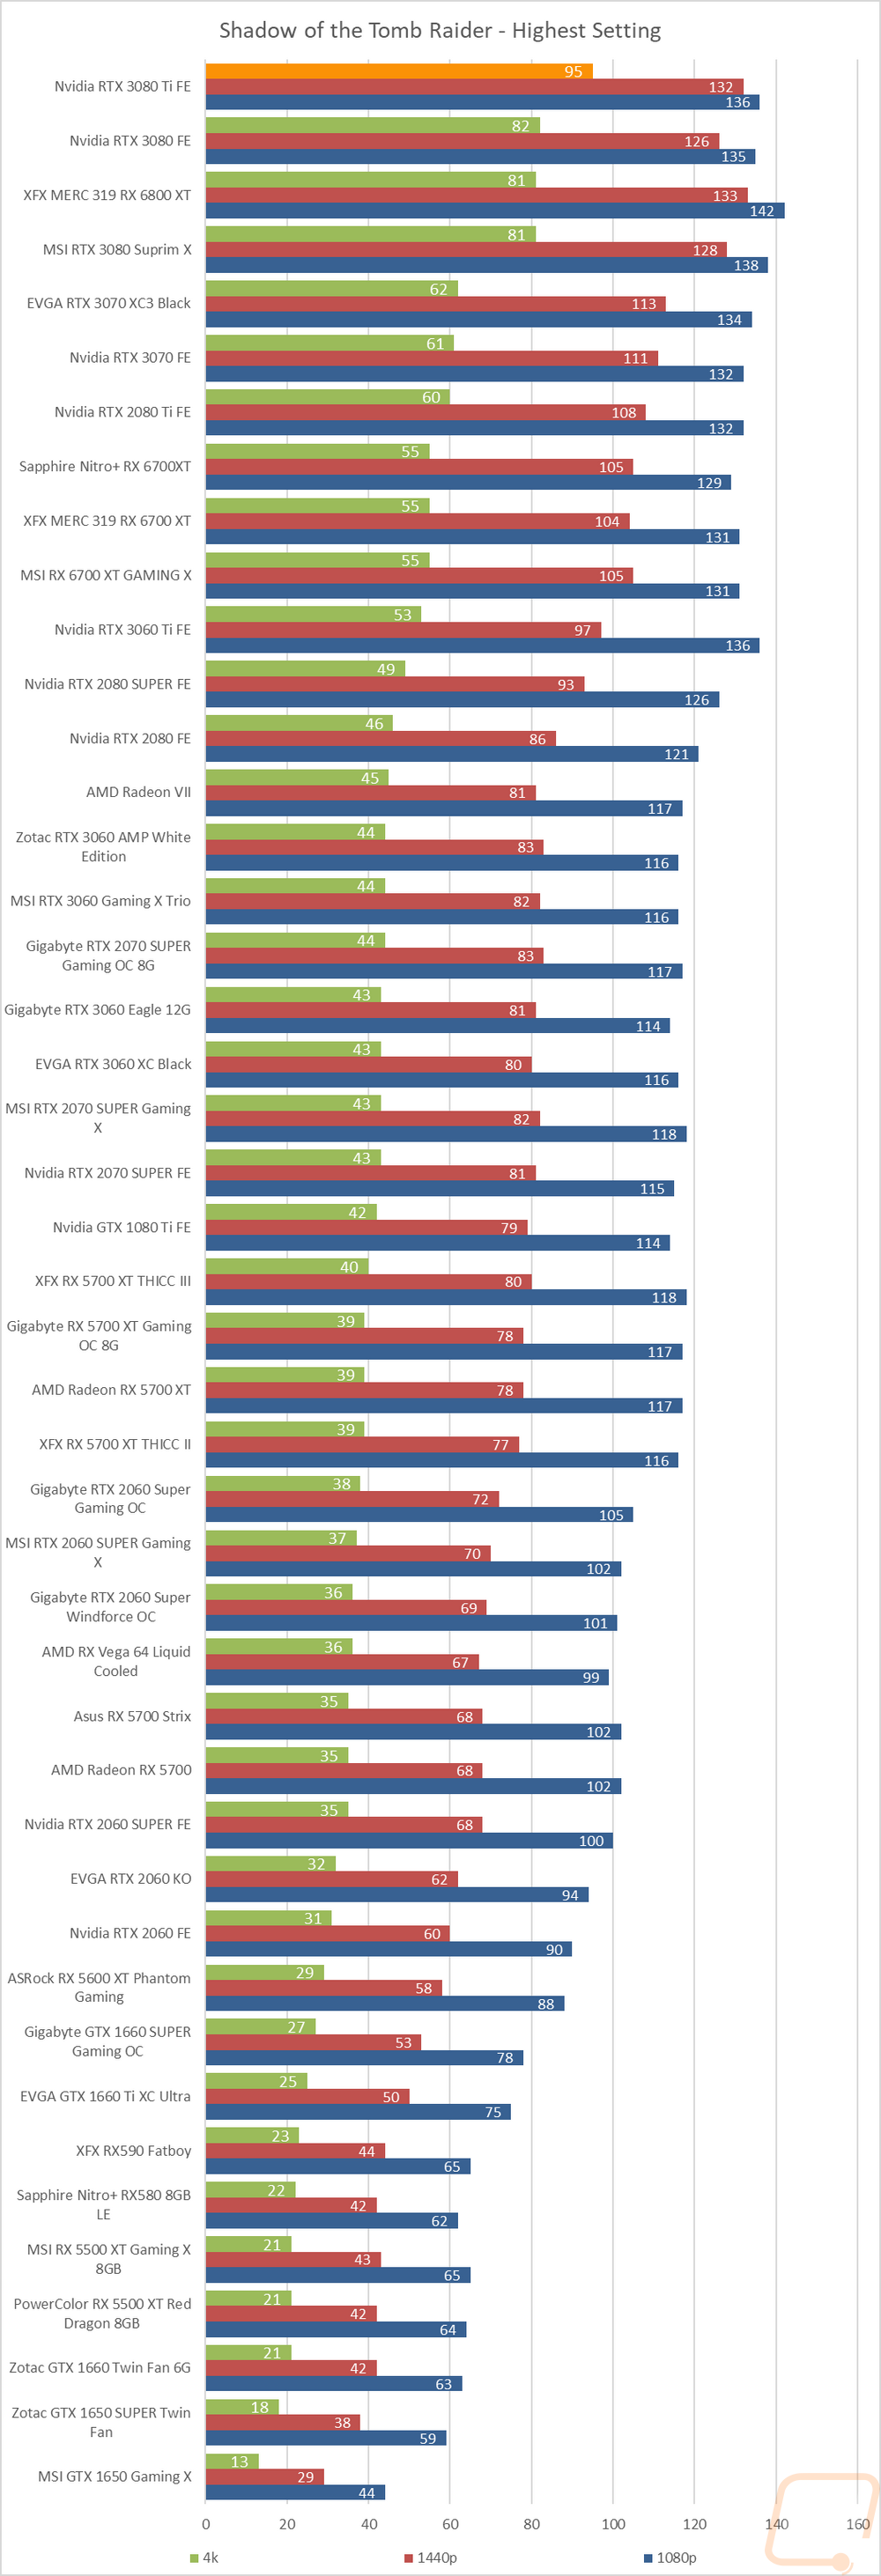
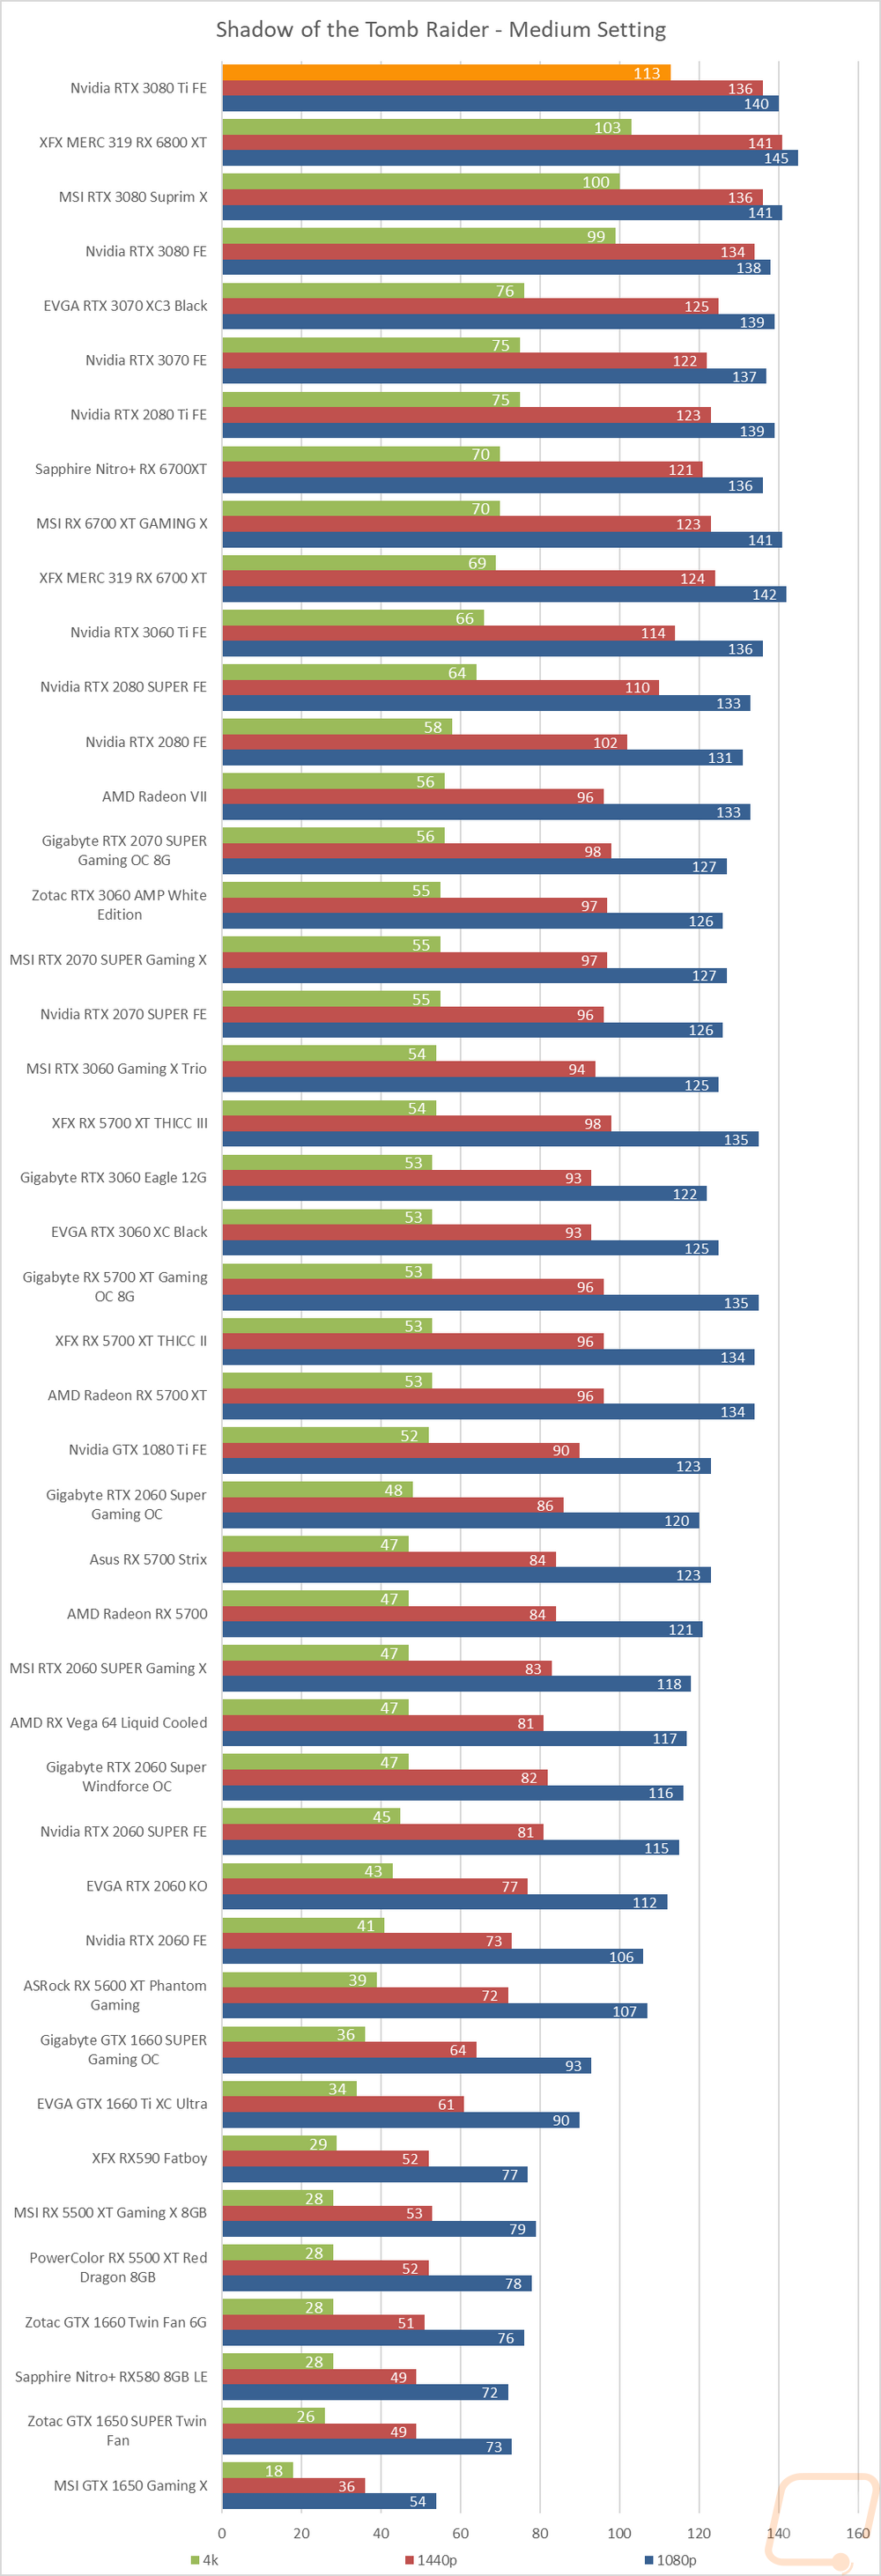
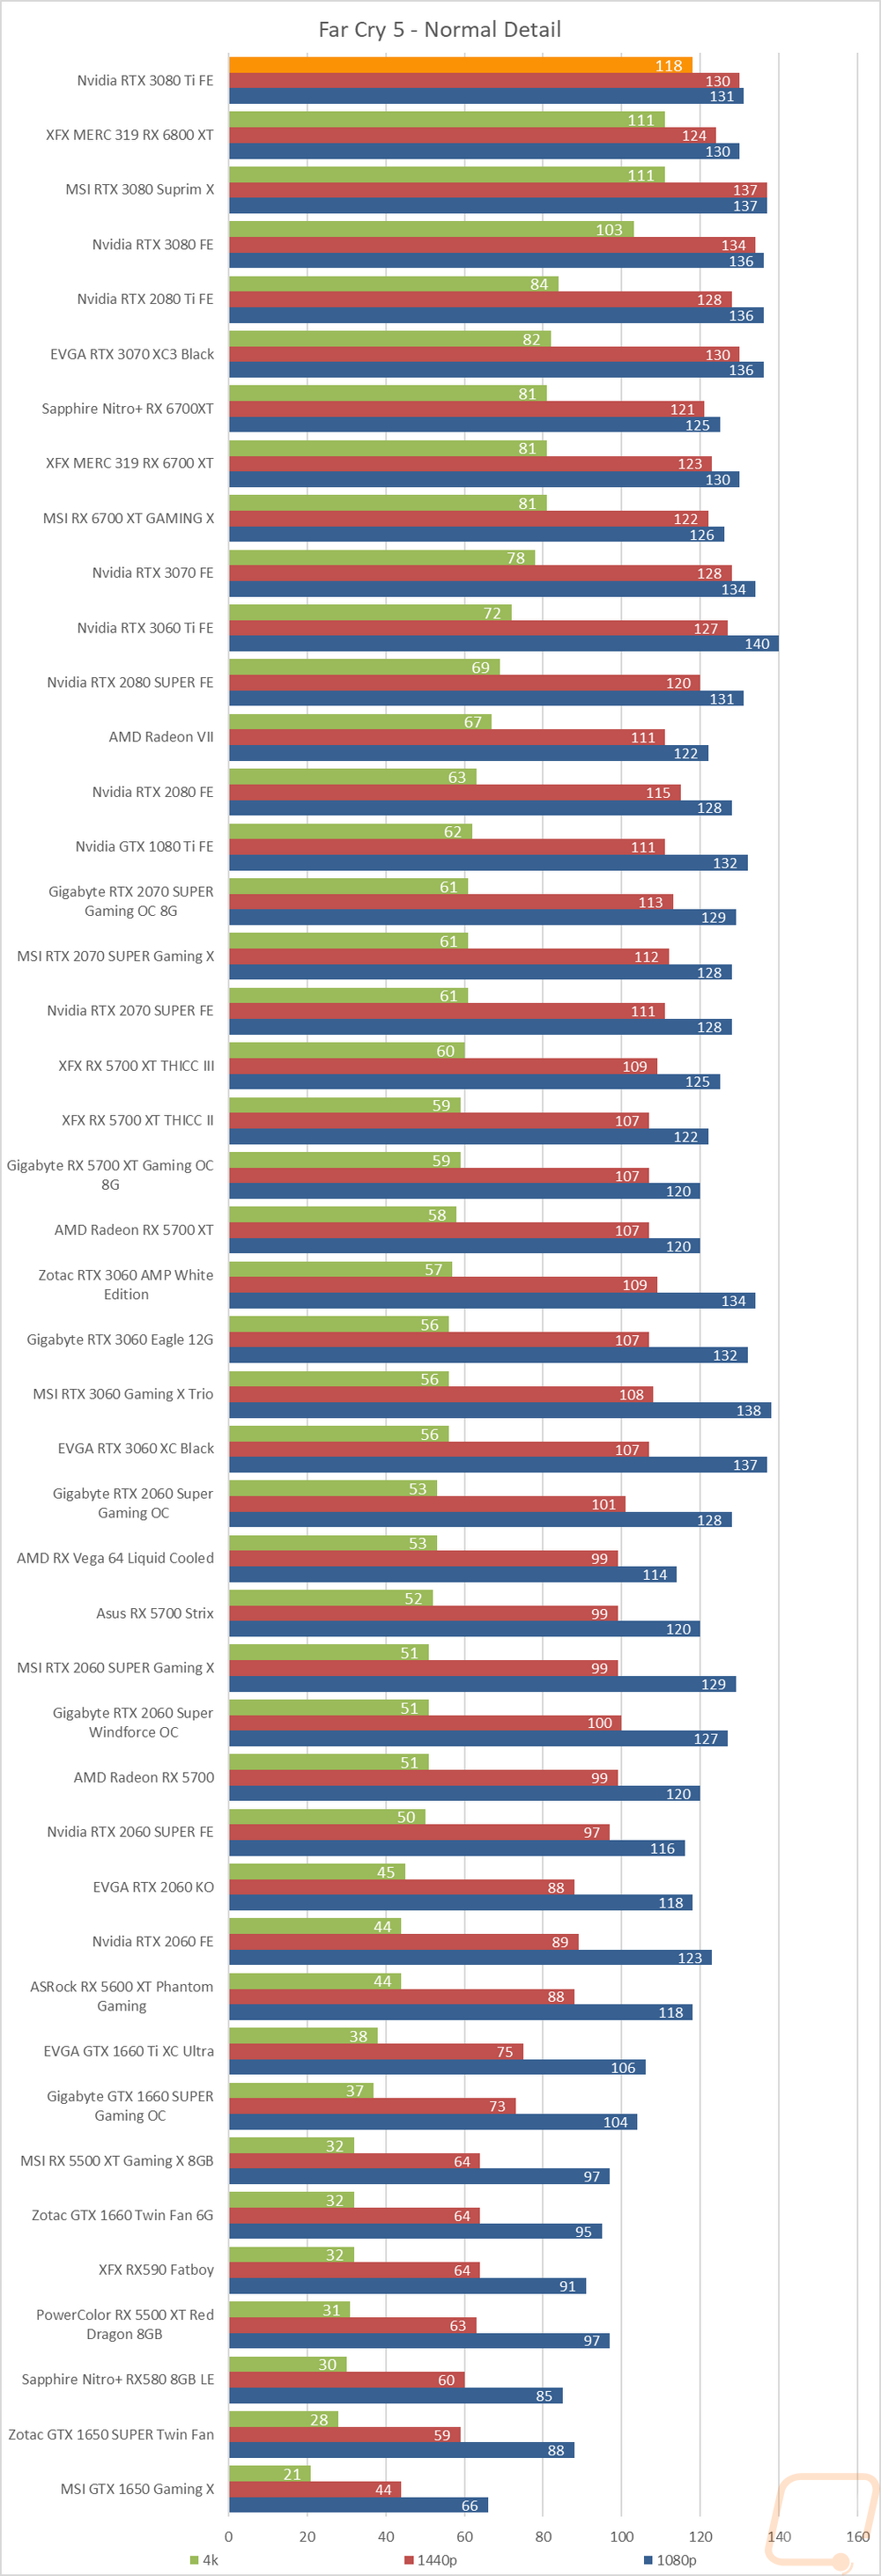
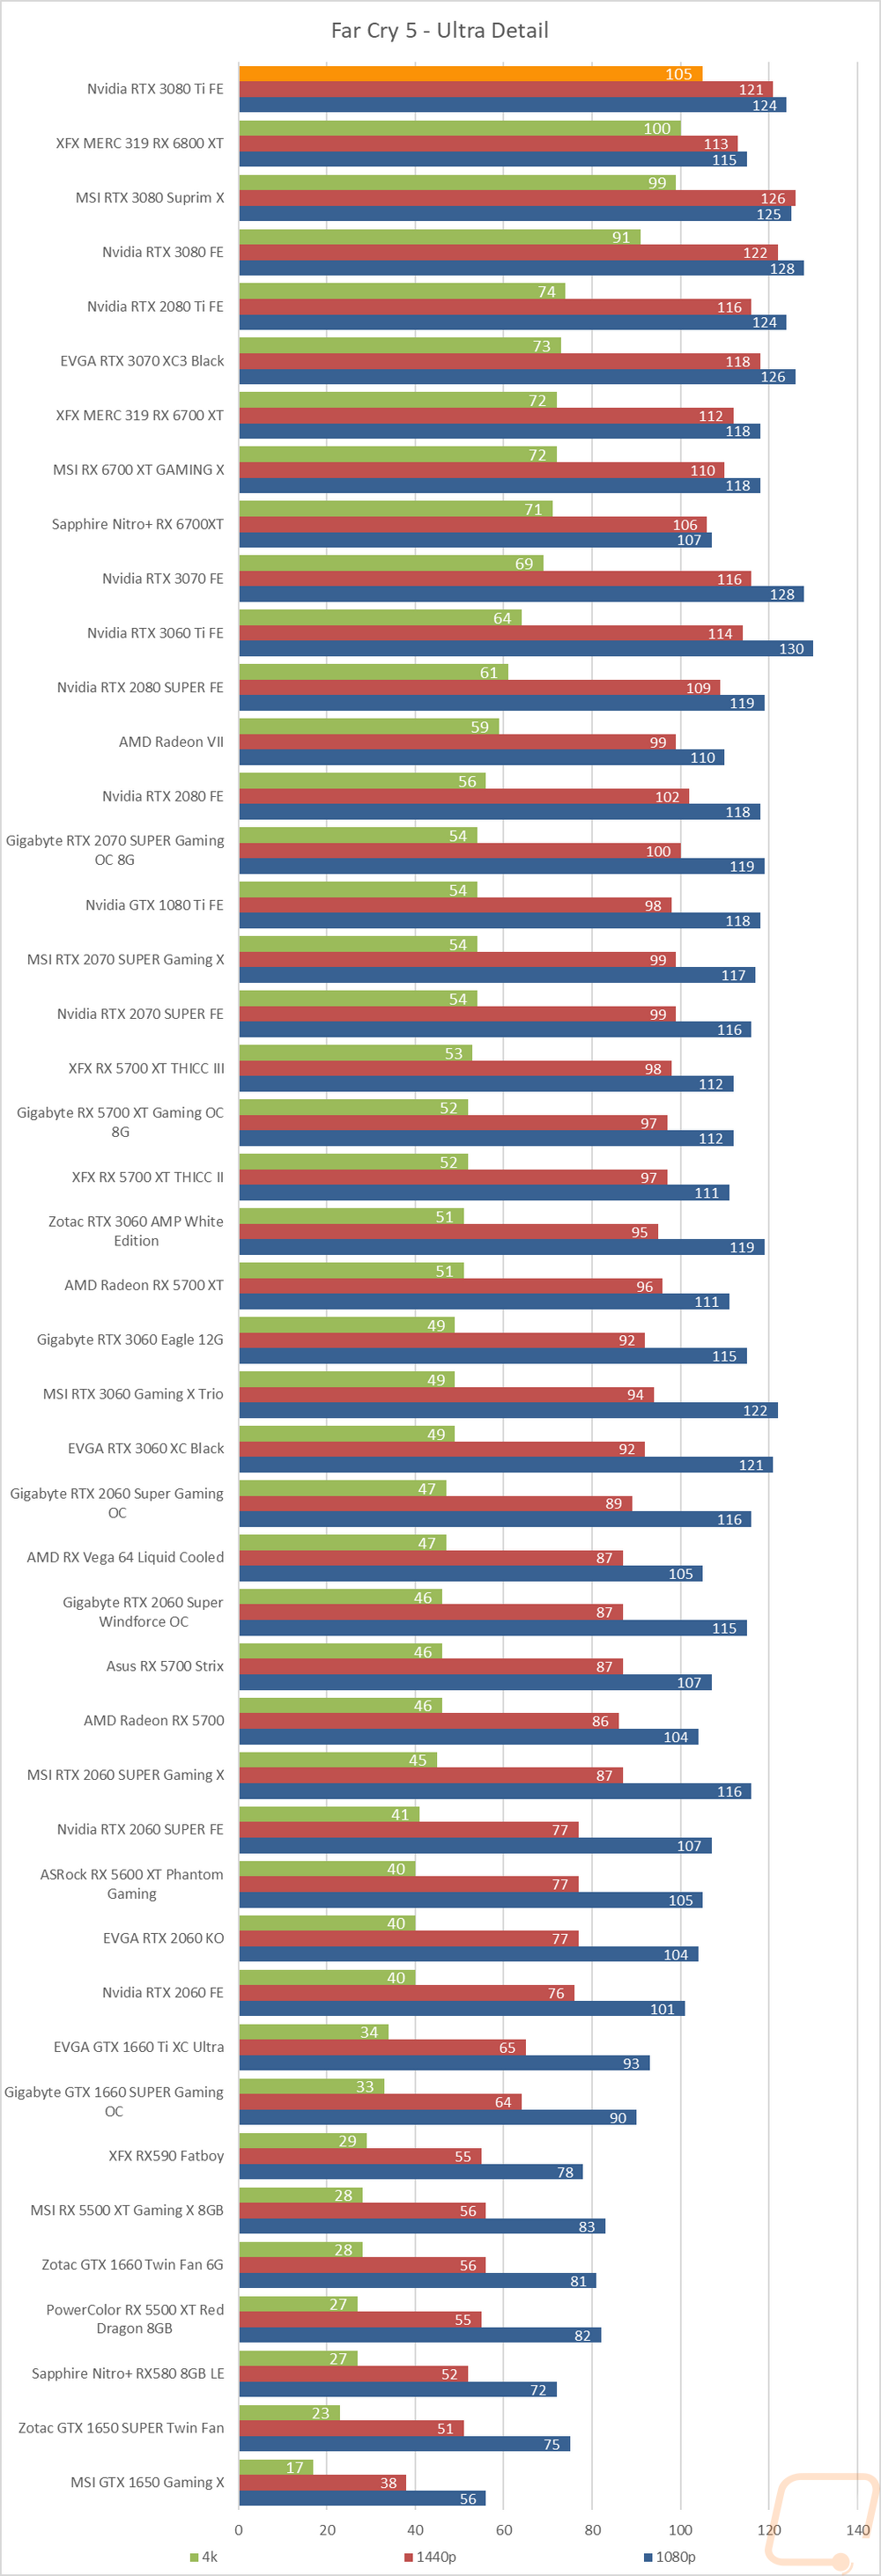
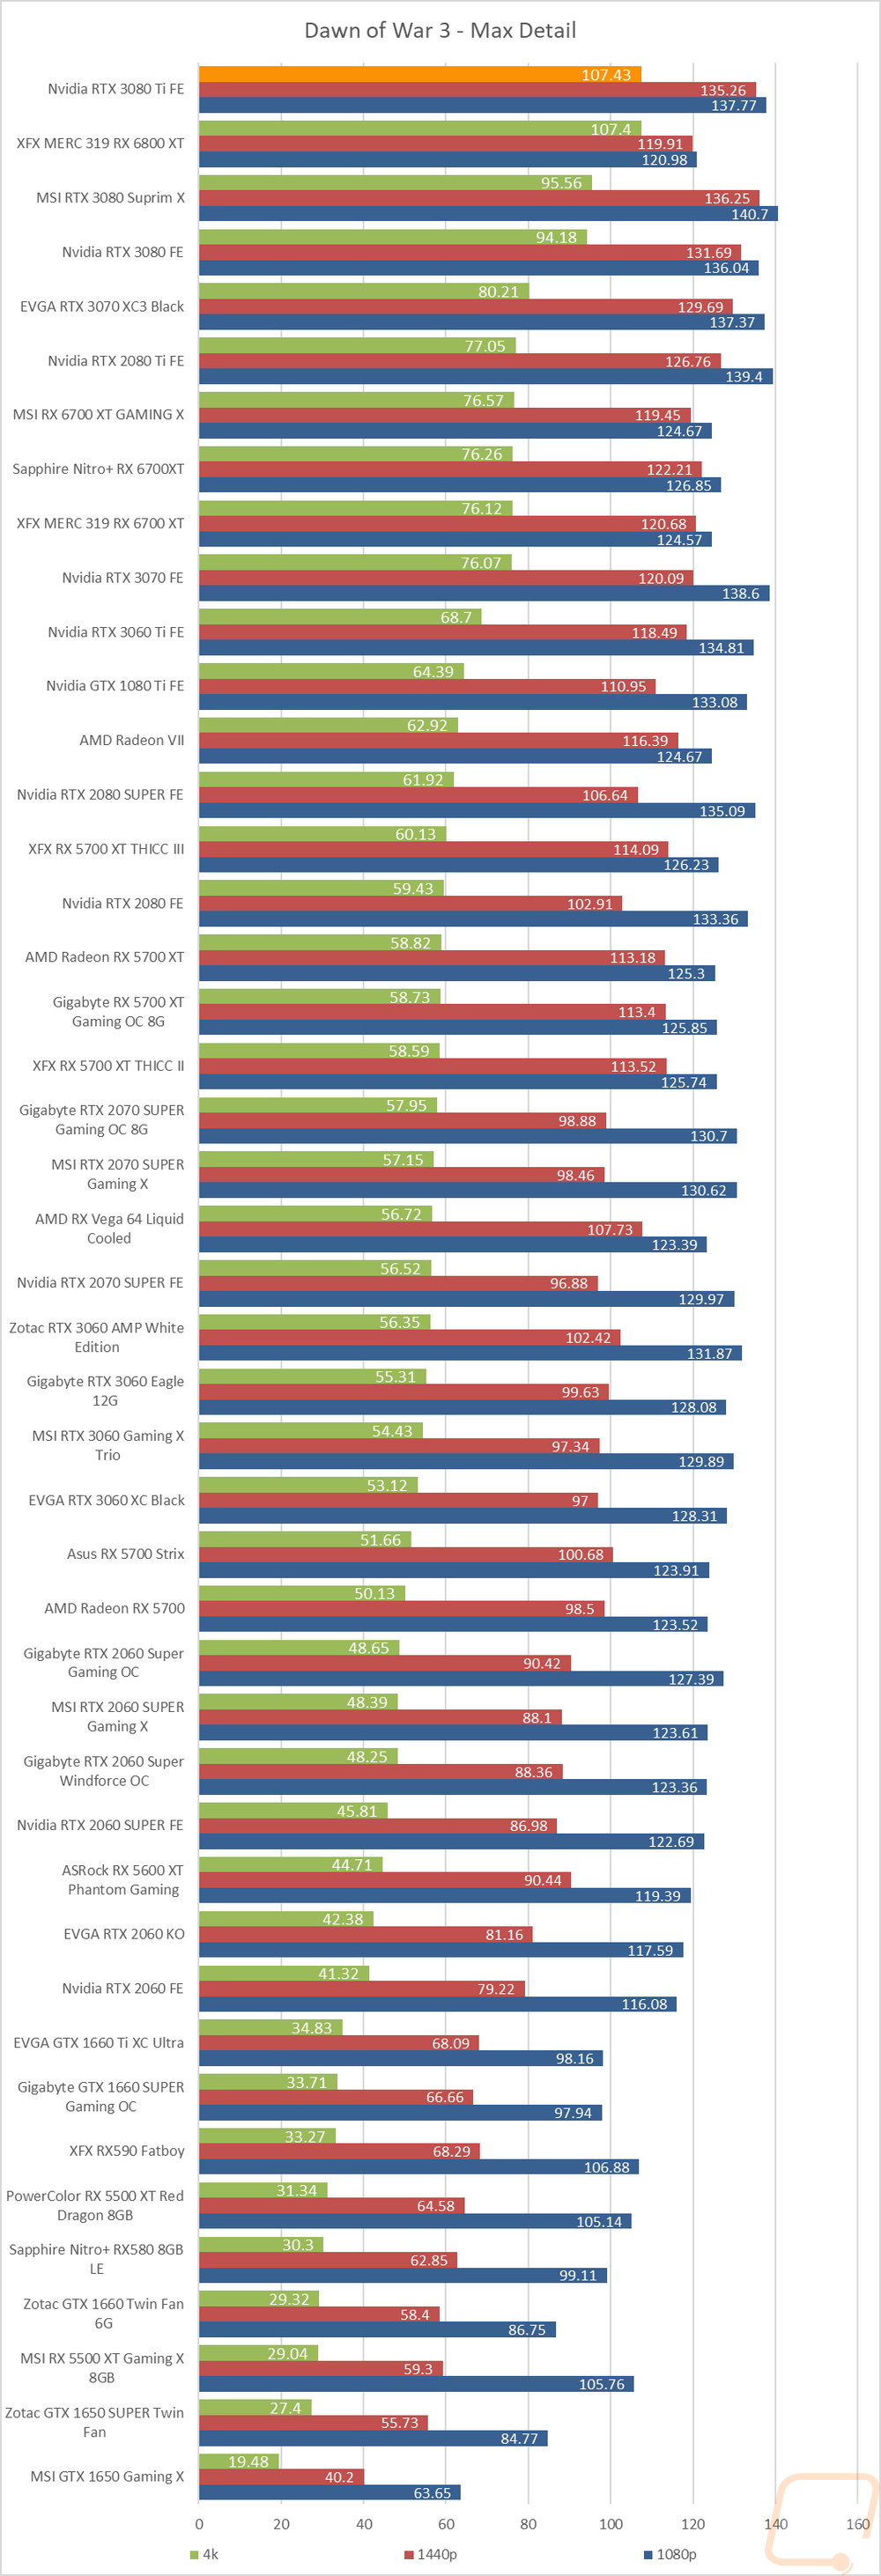
Of course, I have all of the actual in game results as well for anyone who wants to sort through the wall of graphs below. Let's get the biggest part out of the way right at the start, the 3080 Ti Founders Edition came in at the top of our chart in every single game tested. That isn’t a huge surprise without the RTX 3090 in the mix but it is consistently fast at 4k. There are a few games where we are starting to hit a wall at the lower resolutions where we don’t see it setting ahead of the other cards like it should but those are almost all related to CPU limitation. I did also run into issues with Watch Dog Legion at those resolutions as well that weren’t an issue in the past. I will be following up on those after this launch as they require more testing or potentially retesting all of the cards. To get a look at the overall performance of the 3080 Ti Founders Edition I did also average out its numbers as well as the 6800XT and the overclocked 3080 Suprim and as you can see below, even when comparing it with the overclocked 3080 it is a big step up in performance giving 8 FPS each game on average at 4k.
|
Average FPS |
4K |
1440P |
1080P |
|
3080 Ti Founders Edition |
97.1 |
128.6 |
135.5 |
|
MSI 3080 Suprim X |
88.8 |
127.0 |
137.1 |
|
XFX MERC 319 6800 XT |
87.9 |
125.3 |
134.1 |