In-Game Benchmarks
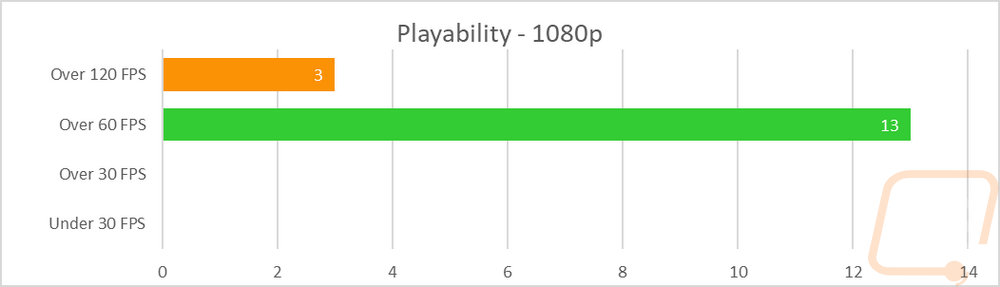
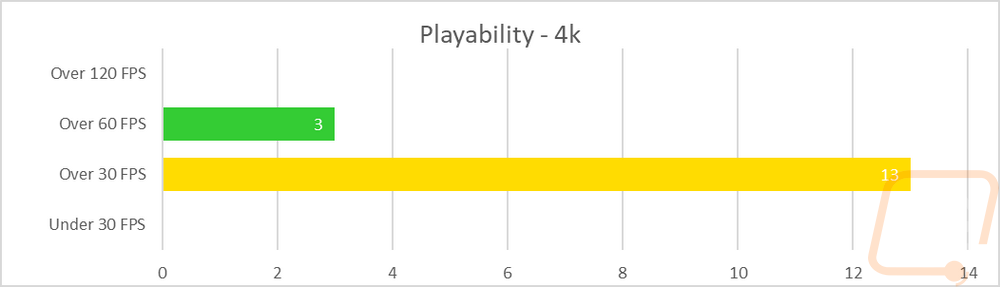
Now we finally get into the in game performance and that is the main reason people pick up a new video card. To test things out I ran through our new benchmark suite that tests 11 games at three different resolutions (1080p, 1440p, and 4k). I also slipped in a few variations on the same games for comparisons like DX11 to DX12, OpenGL to Vulkan, and a couple of games are just tested at their highest setting and lower but still high detail options to show the performance difference when things are turned down slightly. In total, each video card is tested 51 times and that makes for a huge mess of graphs when you put them all together. To help with that I like to start off with these overall playability graphs that take all of the results and give an easier to read the result. I have one for each of the three resolutions and each is broken up into four FPS ranges. Under 30 FPS is considered unplayable, over 30 is playable but not ideal, over 60 is the sweet spot, and then over 120 FPS is for high refresh rate monitors. This covers all of the games tested except Final Fantasy XV that we have a score rather than an FPS because they like to be different.
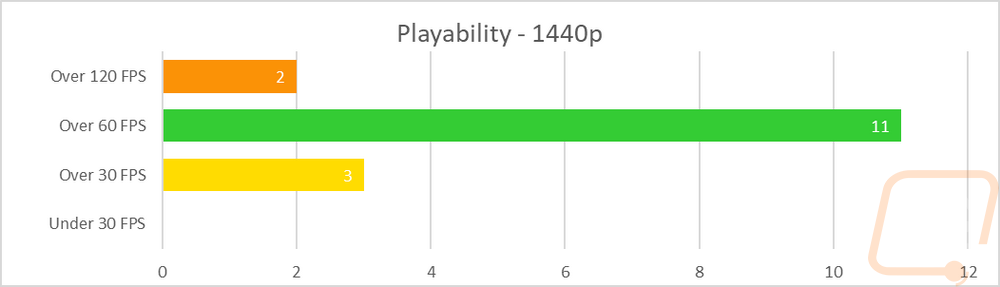
So how did the Gigabyte Windforce RTX 2070 perform? Well no big shocker here, it handles 1080p without a problem and 1440p is solid with just three games that you might have to make some adjustments on. 4K, on the other hand, the Windforce struggled, just like the Founders Edition 2070 did. What was interesting though is when I compared the results between the Founders Edition and this stock clocked card. At 4k two of the 60+ games dropped down into the 30-60 FPS range. At 1440p one of the 120+ games dropped into the 60-120 range. Then at 1080p things were the same. Of course, these results don’t really show how big of a performance change there was, but I honestly thought that even with the lower clocks the roundup results would still be the same. The difference wasn’t much, but it was interesting at least.
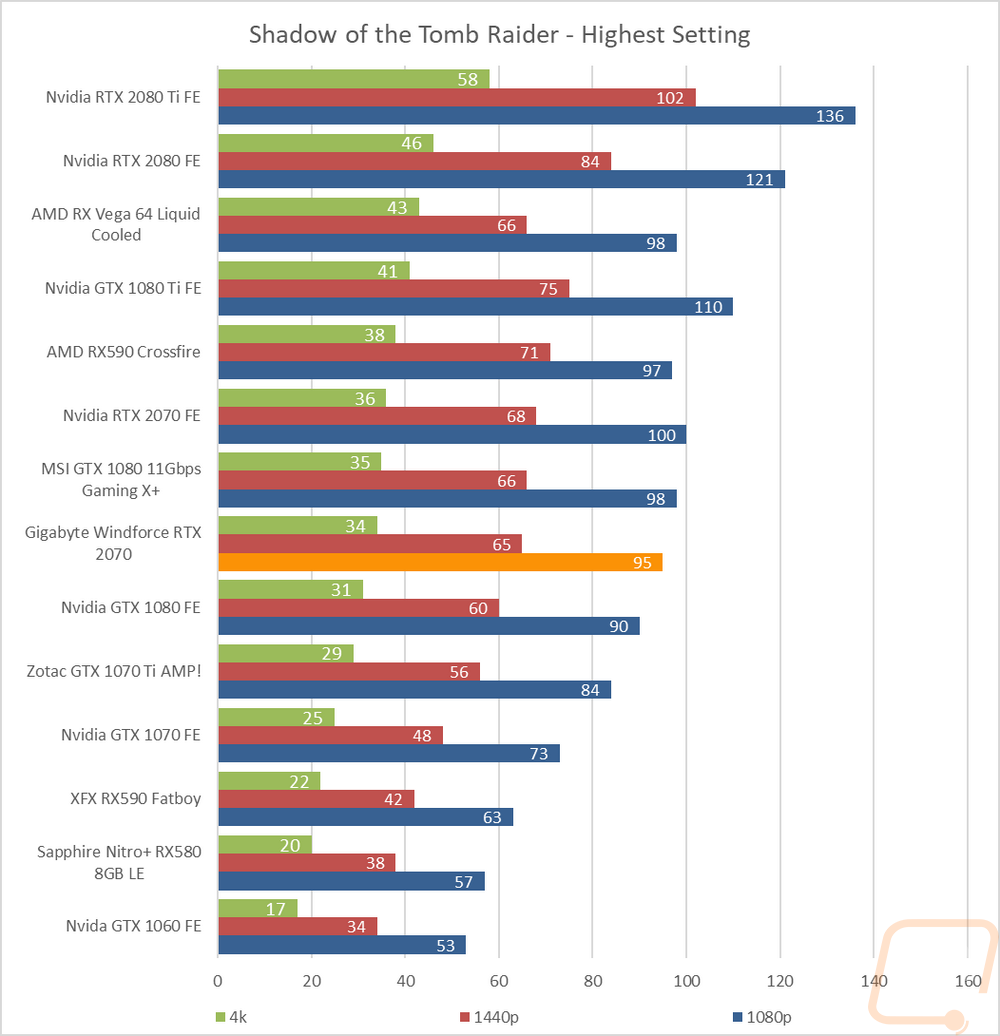
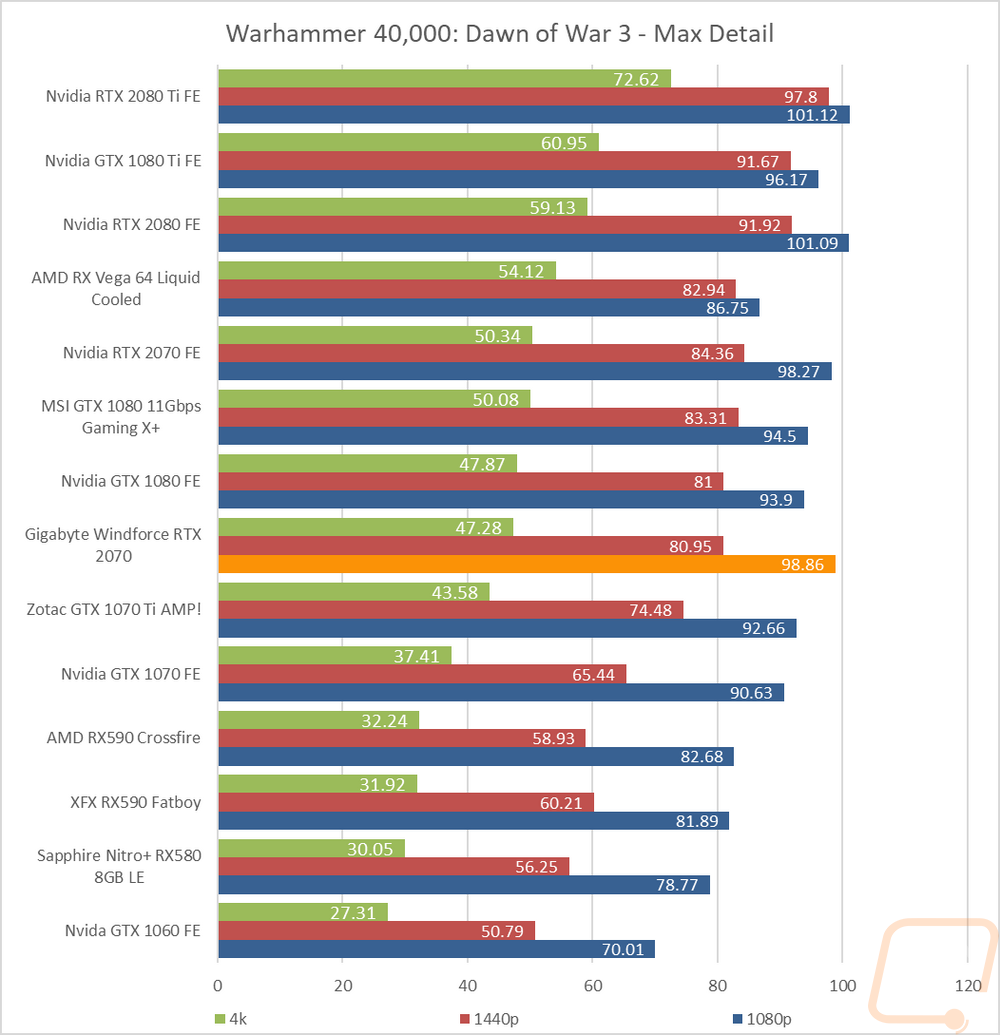
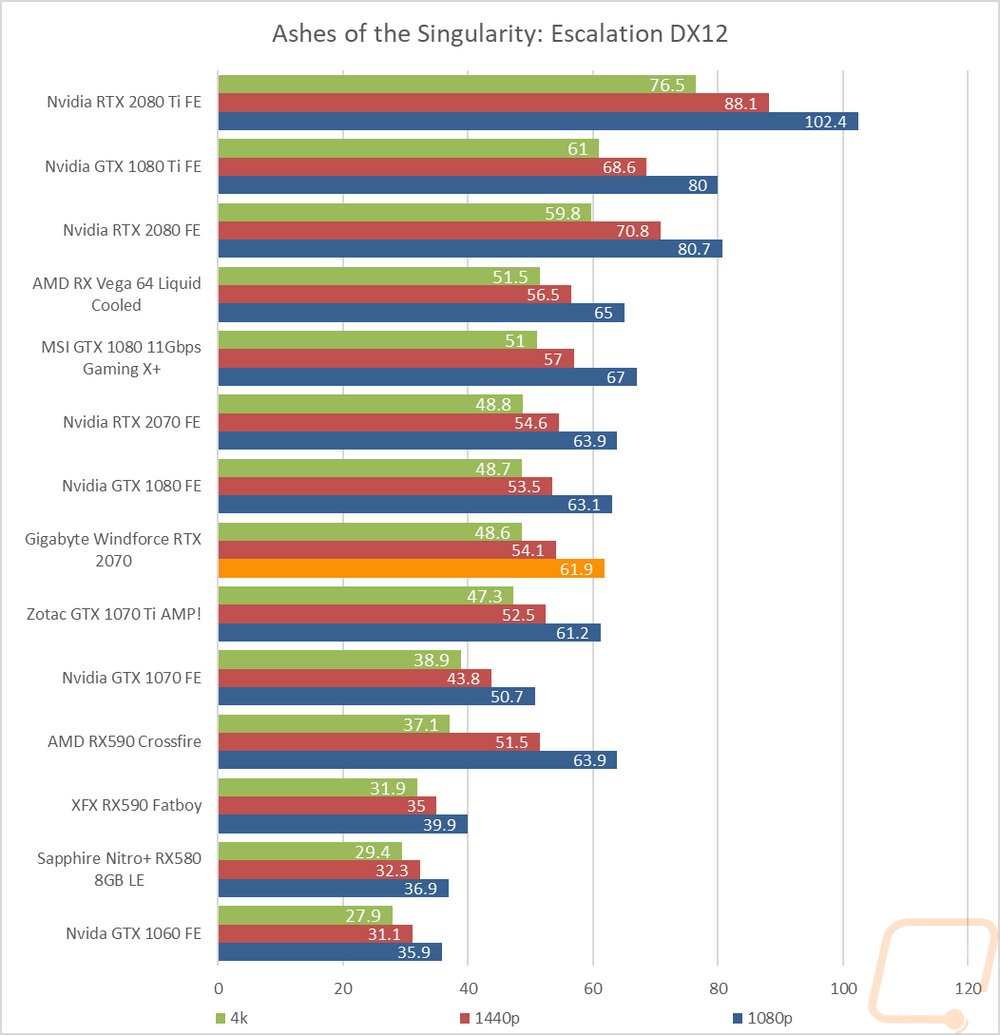
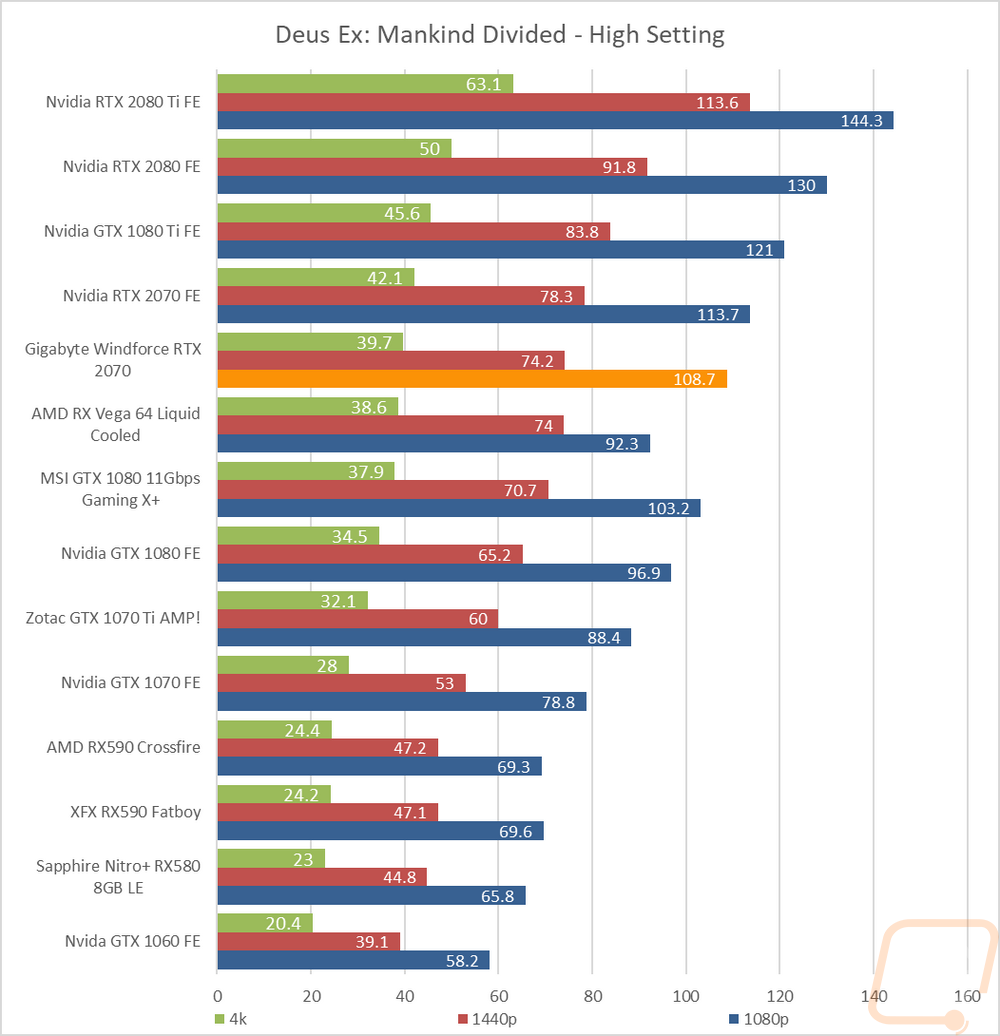
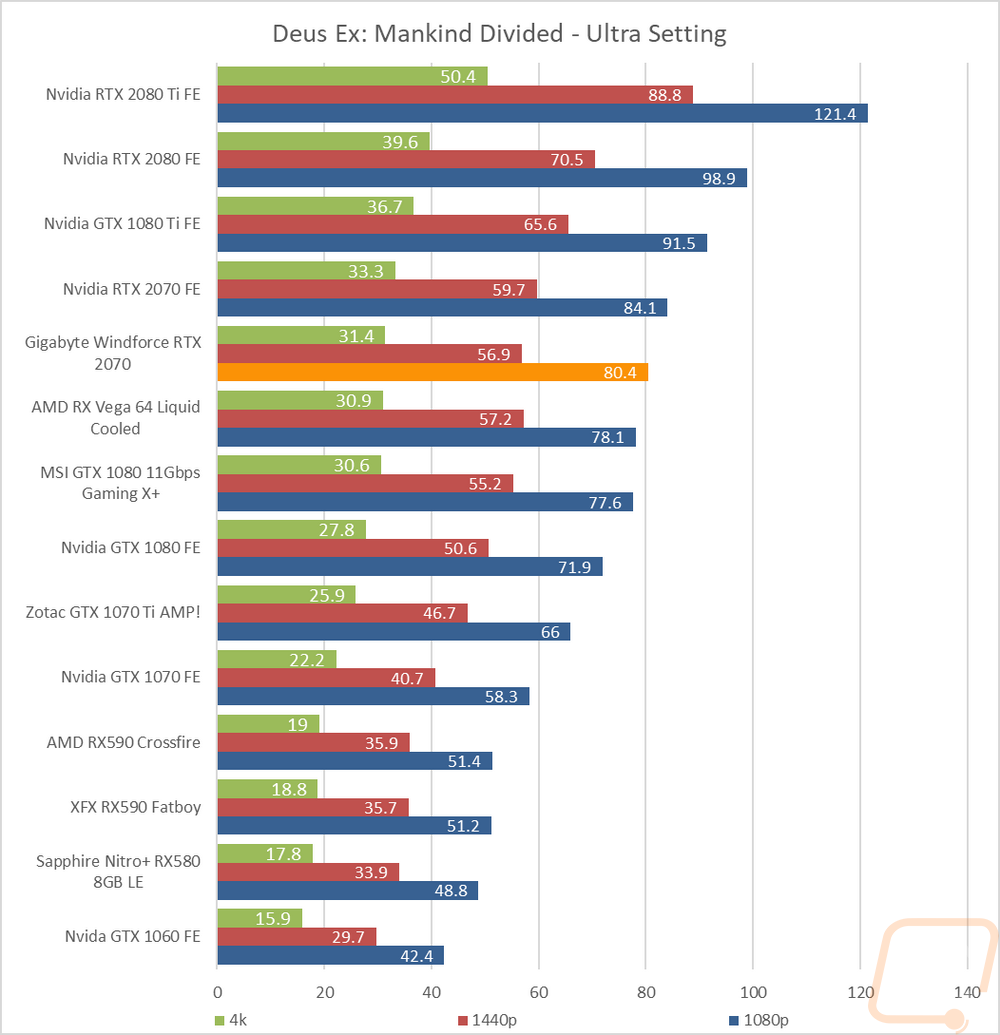
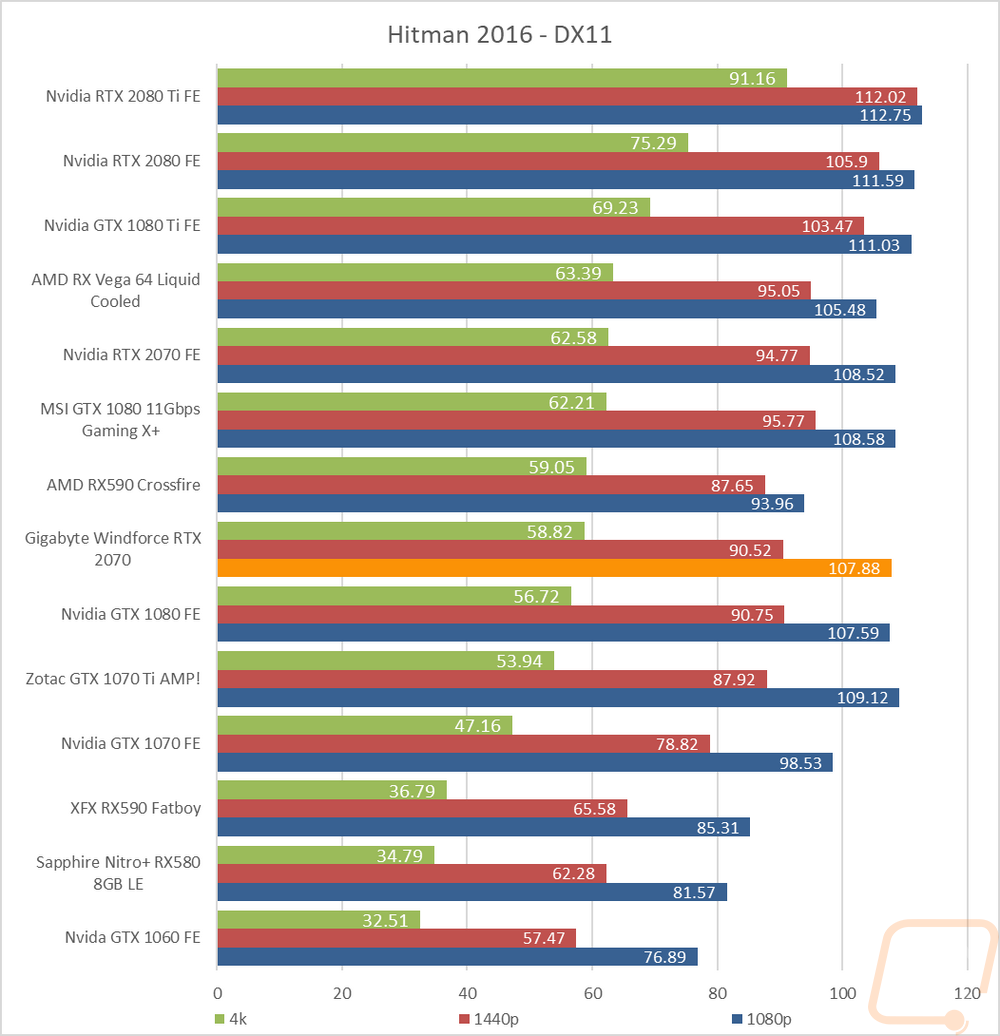
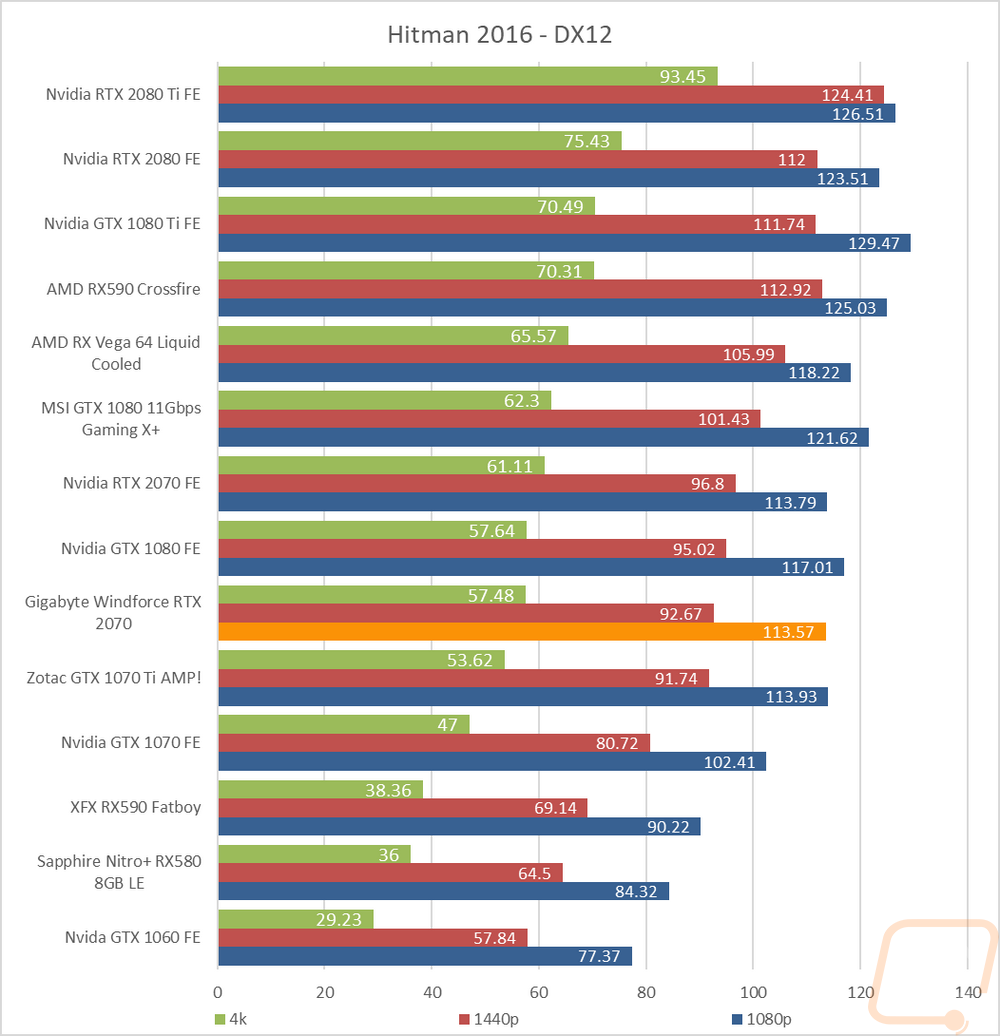
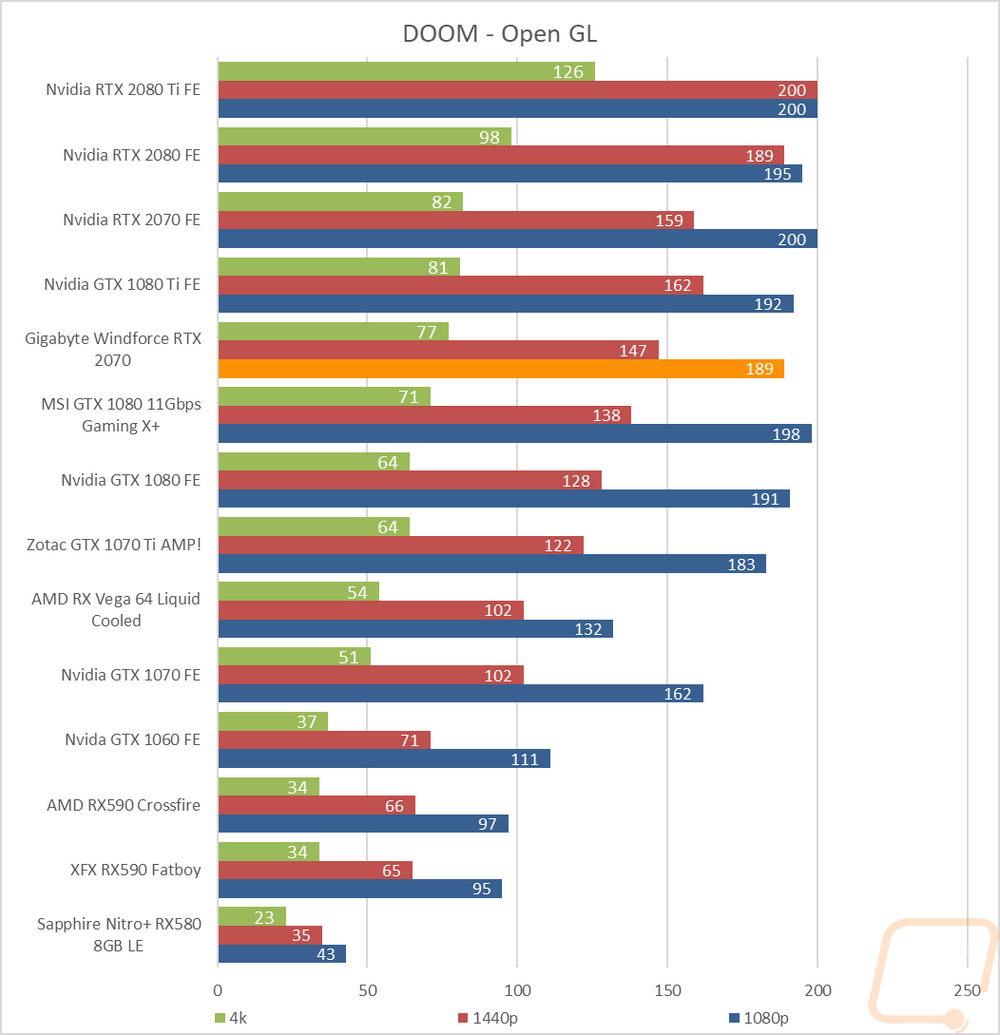
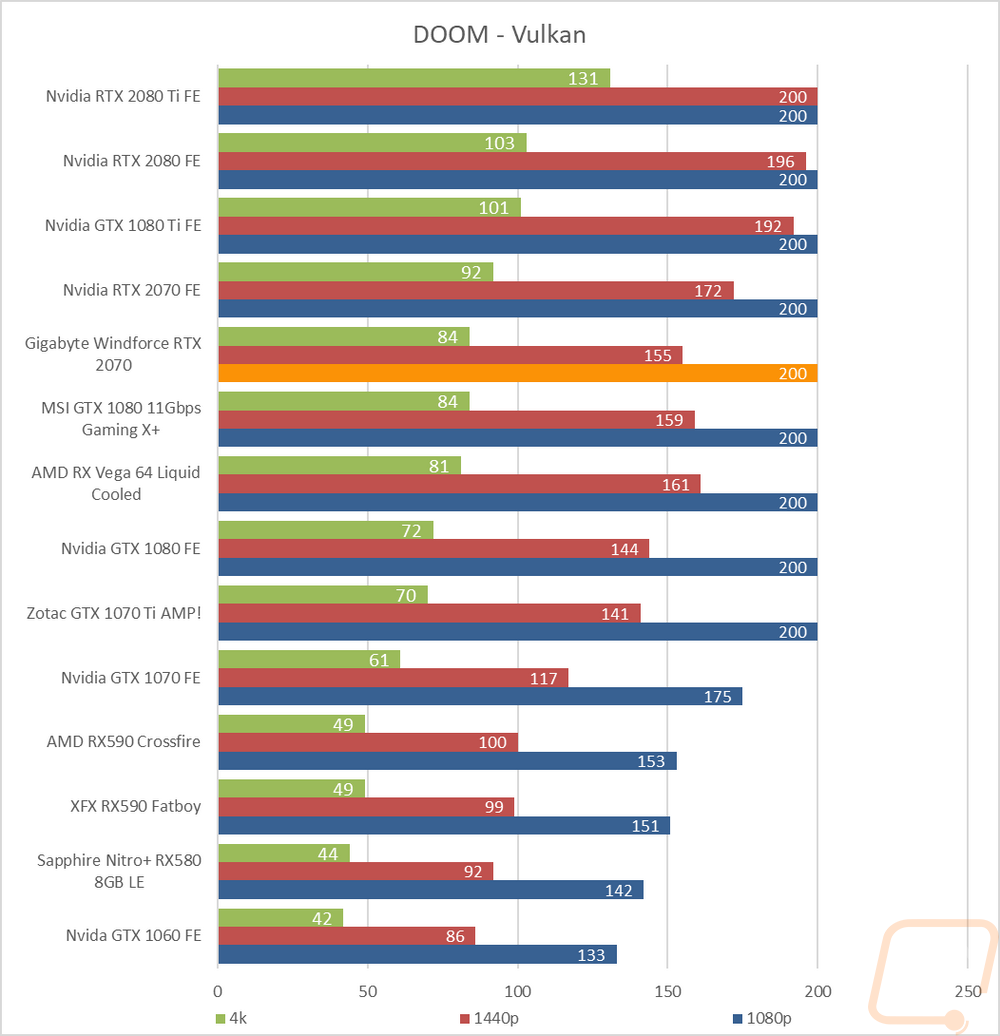
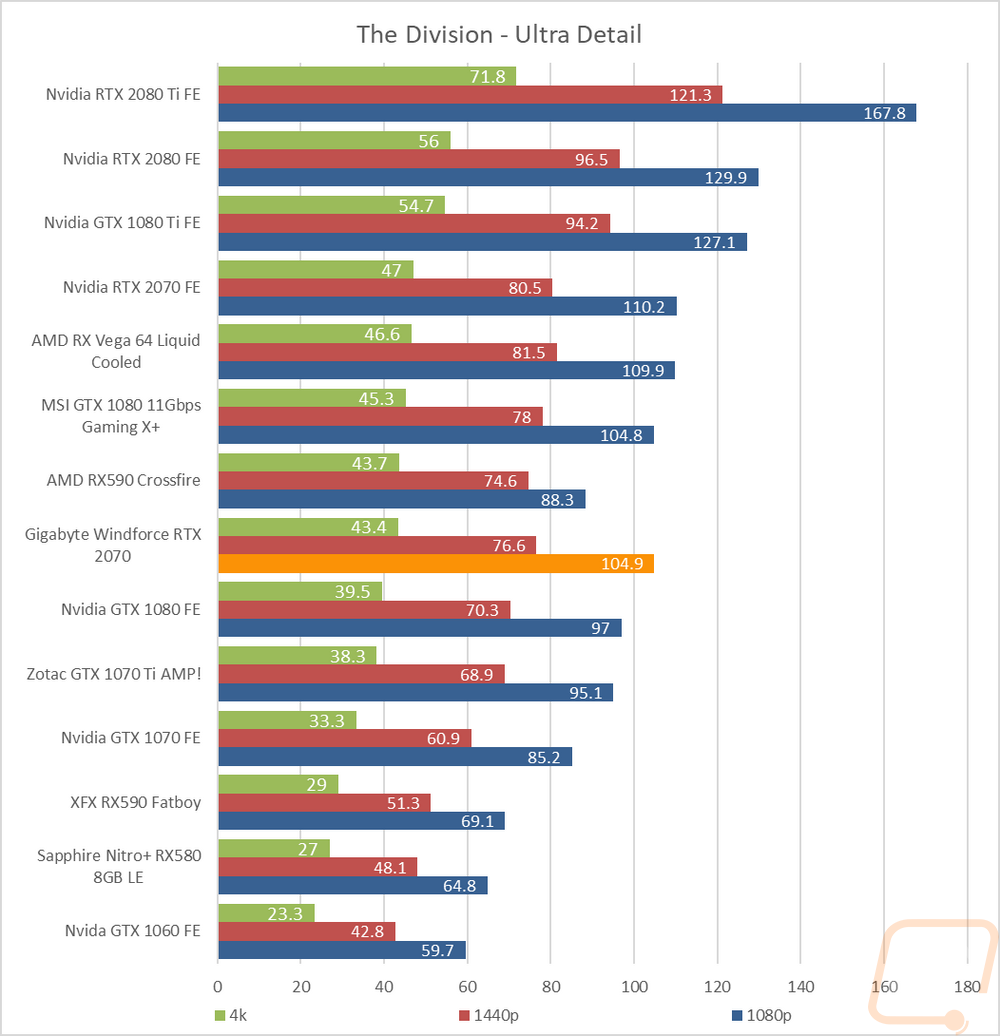
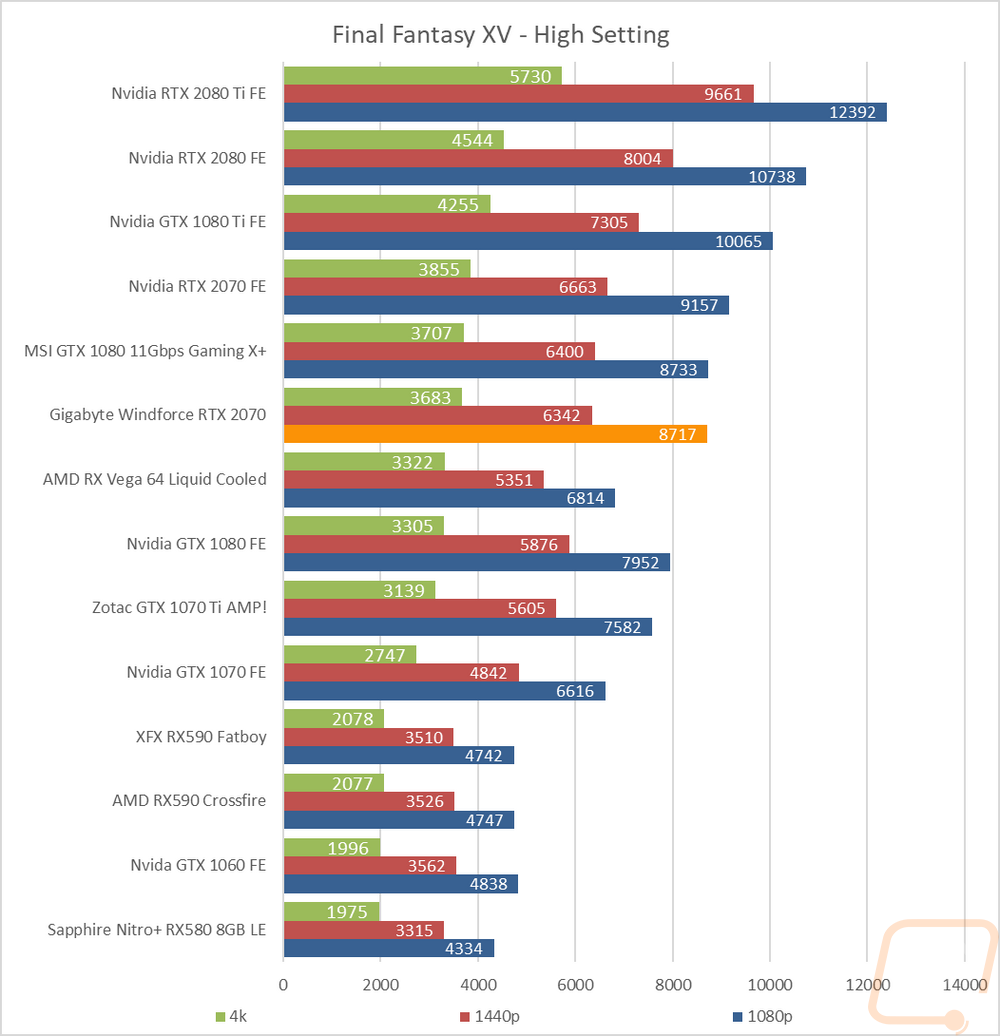
I of course also have the actual graphs for all of our testing as well, not just the roundup from above. It’s just there are so many results to read through you might have to be as crazy as me to get through them all. Anyhow, what did I find? Well in nearly ever test the stock clocked Windforce RTX 2070 outperformed the GTX 1080 and went back and forth with the overclocked GTX 1080 with 11 Gbps memory. In fact, to double check I averaged out the results and the RTX 2070 came in with an average of 86.92 FPS, the Windforce RTX 2070 was behind that with 83.21 FPS. Then for the GTX 1080’s the Founders Edition averaged 76.68 FPS and the overclocked model was a fraction of an FPS faster than the stock clocked 2070 with 83.82 FPS. That was across all resolutions.