Performance
When it comes to performance testing, typically motherboard to motherboard we aren’t going to see any big performance difference when running the same components and clock speeds. The exception to that is when boards are auto overclocking of course and there are a few areas where components can make a difference like with ethernet and USB controllers. For testing the B760I Edge WiFi I have compared it against the Z790 Edge WiFi DDR4 that I previously tested. It isn’t the same chipset and this is a DDR5 board where the other was DRR4 so there will be some performance differences but we can get an idea of what to expect. I did also have to redo a few of our previous tests as the numbers had changed from when I tested before and now. Overall though most of the results are similar but you can see the performance benefit of the faster DDR5 memory in a few tests like Passmark.
The one area where motherboard testing does sometimes vary would be in the network testing and for that, I check out both wired and wireless performance on the B760I Edge WiFi. The Intel I225V NIC on the B760I Edge WiFi is the same as on the Z790 Edge WiFi DDR4 so its performance being nearly the same when testing on the 10G network and 1G network isn’t a surprise. What was a surprise though was the wireless performance on the B760I Edge WiFi which only had the two basic antennas, not an antenna that can be repositioned. The 620 Mbps average speed is far from the max it is capable of, but is better than I see normally on our cluttered wireless network and with dense/thick plaster walls.
|
3DMark – Speed Way – Overall Score |
|||||||||
|
MSI MPG Z790 Edge WiFi DDR4 |
9967 |
||||||||
|
MSI MPG B760I EDGE WIFI |
9986 |
||||||||
|
Motherboard |
Overall Score |
Graphics Score |
CPU Score |
||||||
|
MSI MPG Z790 Edge WiFi DDR4 |
30742 |
35808 |
17063 |
||||||
|
MSI MPG B760I EDGE WIFI |
31521 |
35863 |
18695 |
||||||
|
3DMark – Time Spy Extreme |
|||||||||
|
Motherboard |
Overall Score |
Graphics Score |
CPU Score |
||||||
|
MSI MPG Z790 Edge WiFi DDR4 |
17335 |
19394 |
10825 |
||||||
|
MSI MPG B760I EDGE WIFI |
17296 |
19463 |
10607 |
||||||
|
PCMark 10 Score |
|||||||||
|
Motherboard |
Overall Score |
Essentials |
Productivity |
Content Creation |
|||||
|
MSI MPG Z790 Edge WiFi DDR4 |
9947 |
11943 |
11902 |
18788 |
|||||
|
MSI MPG B760I EDGE WIFI |
9820 |
11955 |
11967 |
17962 |
|||||
|
Passmark PerformanceTest 10.2 - |
|||||||||
|
Motherboard |
Overall |
CPU Mark |
2D Graphics Mark |
3d Graphics Mark |
Memory Mark |
||||
|
MSI MPG Z790 Edge WiFi DDR4 |
9001.2 |
54403.4 |
1374.4 |
37857.4 |
3912.5 |
||||
|
MSI MPG B760I EDGE WIFI |
9422.6 |
58573.0 |
1497.3 |
45672.9 |
2666.0 |
||||
|
World War Z: Aftermath – 4K Ultra Detail – Average FPS |
|||||||||
|
MSI MPG Z790 Edge WiFi DDR4 |
232 FPS |
||||||||
|
MSI MPG B760I EDGE WIFI |
238 FPS |
||||||||
|
Tom Clancy’s Ghost Recon: Wildlands Breakpoint – 4K Ultra Detail Preset - Average FPS |
|||||||||
|
MSI MPG Z790 Edge WiFi DDR4 |
144 FPS |
||||||||
|
MSI MPG B760I EDGE WIFI |
146 FPS |
||||||||
|
The Callisto Protocol – Detail - Average FPS |
|||||||||
|
MSI MPG Z790 Edge WiFi DDR4 |
112.7 FPS |
||||||||
|
MSI MPG B760I EDGE WIFI |
112.3 FPS |
||||||||
|
Far Cry 6 – 4K Ultra Detail - Average FPS |
|||||||||
|
MSI MPG Z790 Edge WiFi DDR4 |
135 FPS |
||||||||
|
MSI MPG B760I EDGE WIFI |
137 FPS |
||||||||
|
Average Network Speed- Wired on a 1G Network - Mbits/Sec |
|||||||||
|
MSI MPG Z790 Edge WiFi DDR4 - Intel I225V 2.5G NIC |
947.8 Mbits/sec |
||||||||
|
MSI MPG B760I EDGE WIFI - Intel I225V 2.5G NIC |
945.0 Mbits/sec |
||||||||
|
Average Network Speed – WiFi 6E - Mbits/Sec |
|||||||||
|
MSI MPG Z790 Edge WiFi DDR4 – Intel WiFi 6E Module |
608.4 Mbits/sec |
||||||||
|
MSI MPG B760I EDGE WIFI - Intel I225V 2.5G NIC |
620.3 Mbits/sec |
||||||||
|
Average Network Speed – wired on 10G Network - Mbits/Sec |
|||||||||
|
MSI MPG Z790 Edge WiFi DDR4 – Intel I225V 2.5G NIC |
2359 Mbits/sec |
||||||||
|
MSI MPG B760I EDGE WIFI - Intel I225V 2.5G NIC |
2360 Mbits/sec |
||||||||
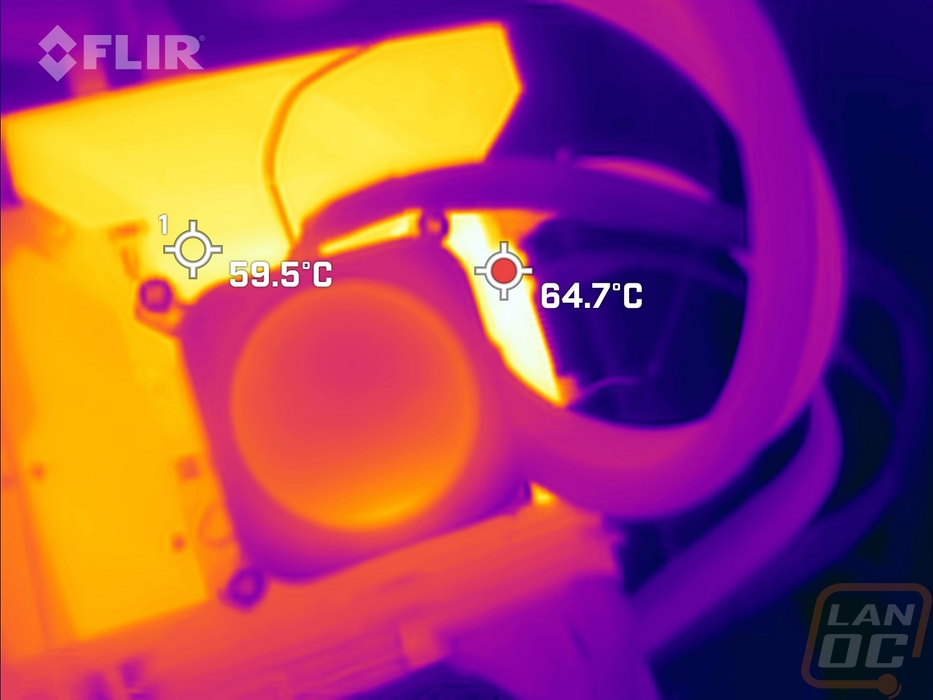
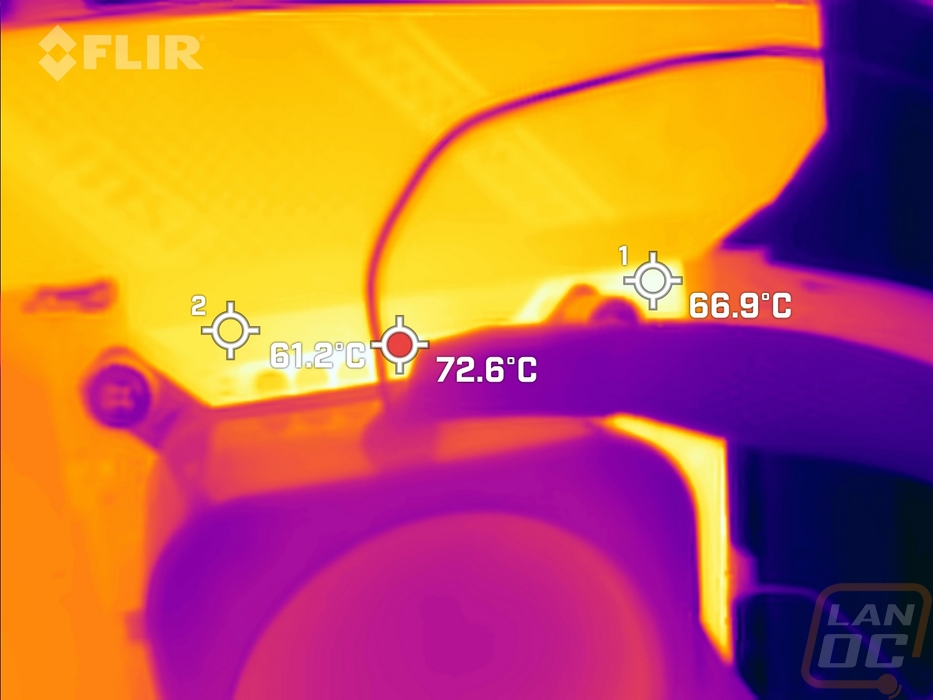
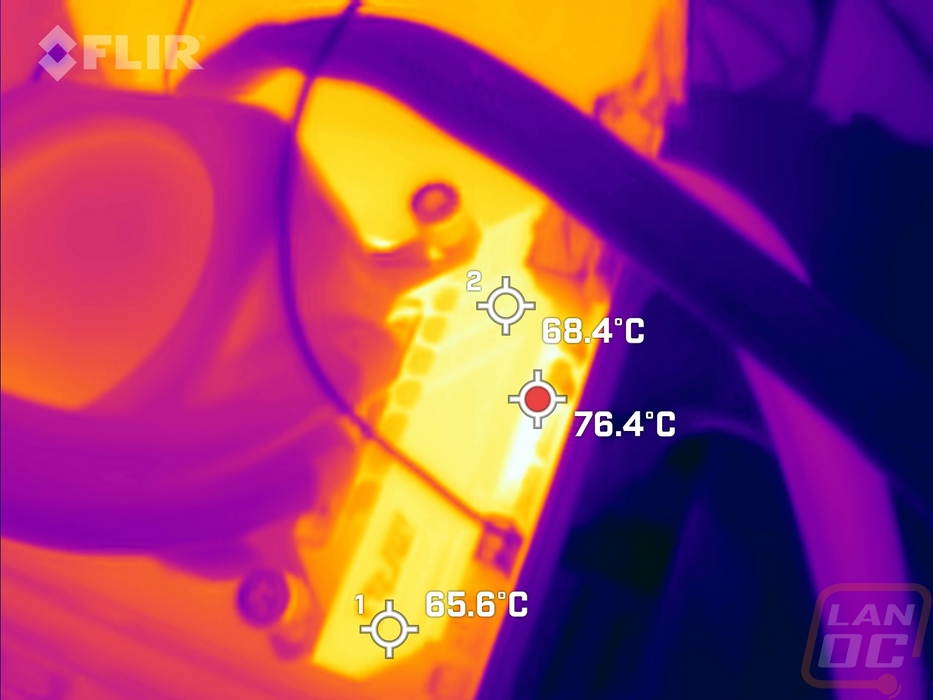
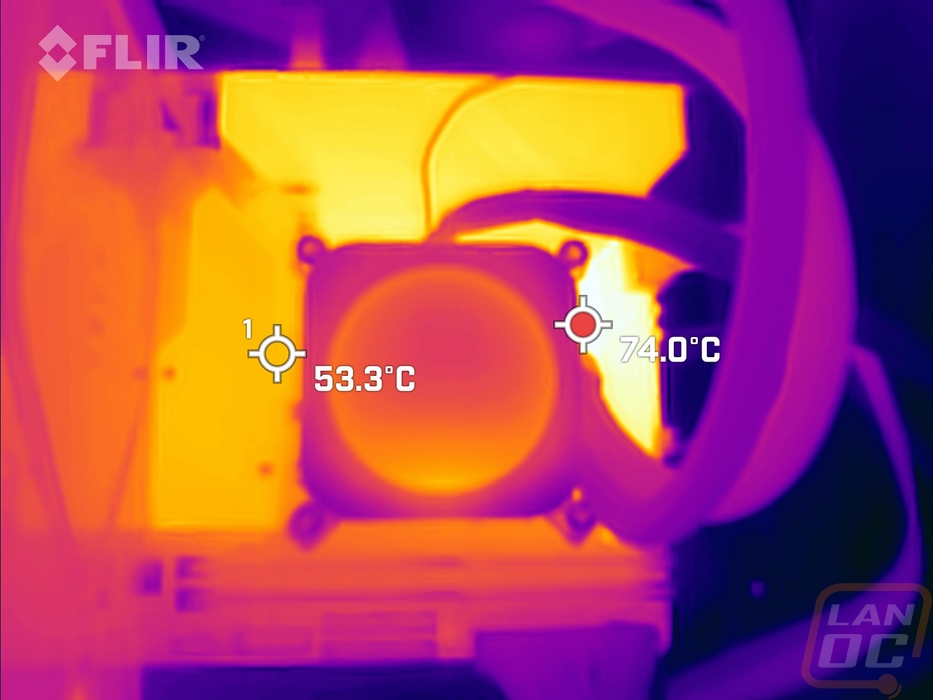
While testing I did also want to check out how the B760I Edge Wifi handles heat as well. For this, I ran AIDA64’s FPU stress test to put a heavy load on the 13900K and let that run for over a half hour. After that, I took a look at things with a thermal camera to see how hot the VRMs were getting. At the hottest spot, I saw 74c which was in between the CPU socket and the top VRMs which have the smaller heatsink, and 76.4 on the PCB just above those top VRMs. This is on our open-air test bench which doesn’t have additional case fans to move air over the VRMs. For comparison with the same setup the MSI Z790 Edge full-sized board ran about 10c cooler with its larger heatsinks so the smaller coolers that are a tradeoff for a compact ITX board like this do make a difference but it wasn’t enough to cause any damage or change performance.