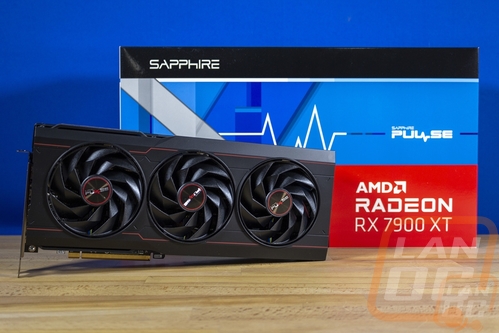
The AMD RX 7900 XT and RX 7900 XTX launches this past December were exciting. AMDs latest generation of cards showed that the giant cards that Nvidia had recently launched weren’t the only option with the upcoming generation and they had impressive performance as well. Sadly I didn’t get to see Sapphire's take on the new generation of cards but that changes today. They sent over the Sapphire RX 7900 XT Pulse and today I’m going to dive in and see what it has going on and then put it through our test suite to see how it performs. I’m especially curious to see how it compares to AMDs reference design as well as the RTX 4070 Ti and we can take a second look now and see how the 7900 XT fits in the market now that things have had time to settle down post-launch. So let’s dive in!
Product Name: Sapphire RX 7900 XT Pulse
Review Sample Provided by: Sapphire
Written by: Wes Compton
Amazon Affiliate Link: HERE
|
Specifications |
|
|
GPU |
AMD Radeon™ RX 7900 XT Graphics Card 5nm GPU AMD RDNA™ 3 Architecture |
|
Engine Clock |
Boost Clock: Up to 2450 MHz Game Clock: Up to 2075 MHz
Boost Clock is the maximum frequency achievable on the GPU running bursty workload. Boost clock achievability, frequency, and sustainabilty will vary based on several factors, including but not limited to: thermal conditions and variation in application and workloads.
Game Clock is the expected GPU clock when running typical gaming applications, set to typical TGP(Total Graphics Power). Actual individual game clock results may vary. |
|
Stream Processors |
5376 |
|
Compute Units |
84 CU (with RT+AI Accelerators) |
|
Infinity Cache |
80MB |
|
Ray Accelerators |
84 |
|
Memory Size/Bus |
20GB/320 bit GDDR6 |
|
Memory Clock |
20 Gbps Effective |
|
Displays |
Maximum 4 Displays |
|
Resolution |
HDMI™: 7680×4320 DisplayPort 2.1: 7680×4320 |
|
Interface |
PCI-Express 4.0 x16 |
|
Output |
2x HDMI 2x DisplayPort |
|
BIOS Support |
UEFI |
|
Game Index |
4K |
|
Sapphire Features |
Premium Digital Power Design Ultra High Performance Conductive Polymer Aluminum Capacitors Fuse Protection High TG Copper PCB Optimized Composite Heatpipe Tri-X Technology Intelligent Fan Control Precision Fan Control Metal Backplate Two-Ball Bearing Fans Angular Velocity Fan Blade TriXX Supported TriXX Boost Graphics Card Supporter |
|
AMD Features |
AMD RDNA™ 3 Gaming Architecture 84 AMD RDNA™ 3 Compute Units (with RT+AI Accelerators) 80MB AMD Infinity Cache™ technology DisplayPort™ 2.1 AMD Radiance Display™ Engine AMD Radeon™ Boost technology* AMD Radeon™ Anti-Lag* technology* 20GB GDDR6 on 320-Bit Memory Bus PCI® Express 4.0 ready AMD FidelityFX™ technologies* AMD FidelityFX™ Super Resolution technology* Microsoft® DirectX® 12 Ultimate Microsoft® DirectStorage Vulkan® Optimized AMD smart technologies* AMD Software: Adrenalin Edition™ application AMD Noise Suppression* AMD Privacy View* AMD Radeon™ Super Resolution technology* AMD Link* AMD Freesync™ technology |
|
Cooling |
3 Fans |
|
Form Factor |
2.7 slot, ATX Dimension: 313(L)X 133.75(W)X 52.67 (H)mm |
|
Power Consumption |
331W Total Board Power |
|
OS |
Linux®, Windows® 10, and Windows 11. 64-bit operating system required |
|
System Requirement |
Minimum 750 Watt Power Supply 2 x 8-pin Power Connector. PCI Express® based PC is required with one X16 lane graphics slot available on the motherboard. Minimum 8GB of system memory. 16GB recommended. |
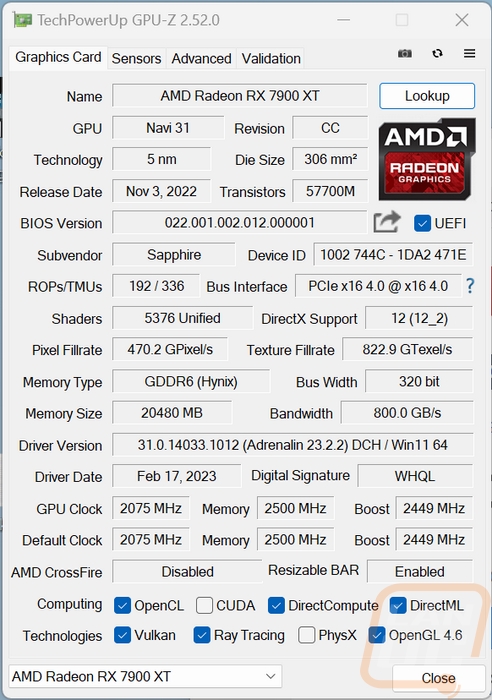
Before getting into testing I did also run GPUz to double-check that our clock speeds match up with the specifications. The Sapphire 7900 XT Pulse is listed with a boost clock of up to 2450 MHz and a game clock of up to 2075 MHz and GPUz has the game clock spot on but the boost clock was listed at 2449 MHz which is 1 MHz off, not a big deal or anything and right where it needs to be. For comparison, the reference 7900 XT had a game clock of 2000 MHz and a boost clock of up to 2400 MHz so Sapphire has given the Pulse a bump across the board but not a huge overclock by any means. Beyond that GPUz also documents the driver used for testing which is the latest AMD driver and the BIOS version for reference in the future as well.
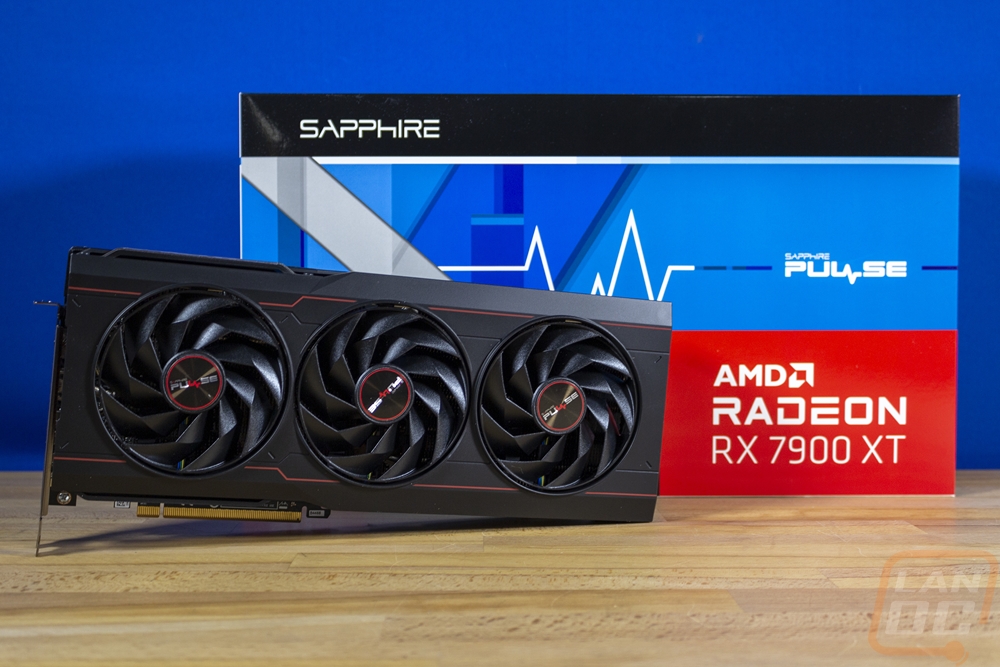
Packaging
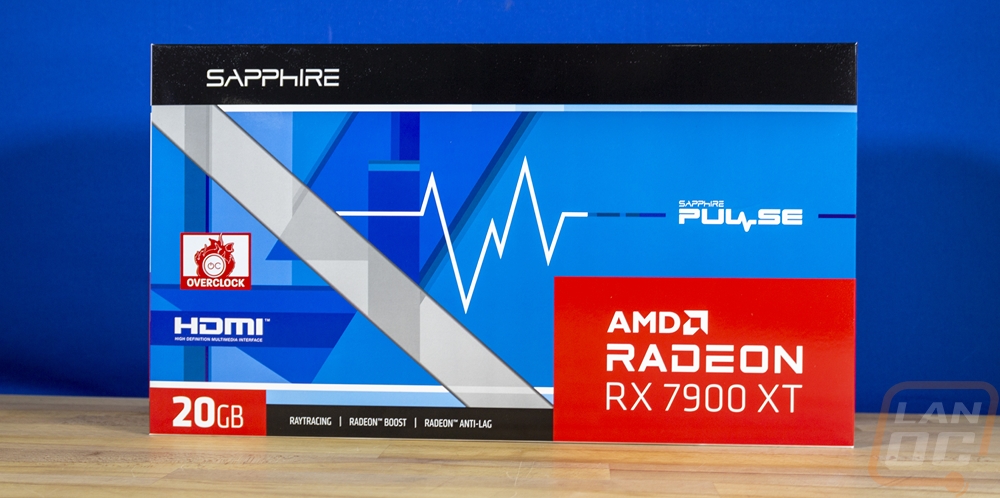
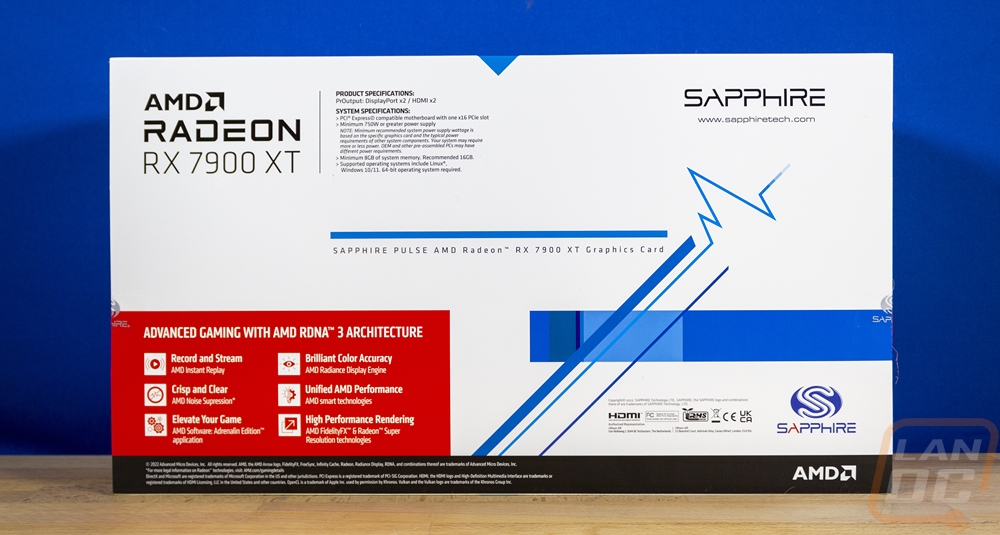
The box for the Sapphire 7900 XT Pulse is surprisingly bright and a drastic change from the standard look that most cards seem to have. The front has a bright blue background with a few additional blue designs and then a grey stripe across it. Up top is a black bar with the Sapphire branding and the bottom has the 20GB VRAM capacity in the corner along with a bar leading to the standard AMD wrap around which has the bright red background and the 7900 XT model name. Beyond that, there is a sticker letting us know that this is overclocked then a zig-zag line leading to the Sapphire Pulse branding. The only thing missing here for me would be a nice picture of the card itself which is always nice to have on the front when shopping in retail. Around back they change it up to a bright white background other than the red for the rest of the AMD wrap-around. The blue touches are there but there really isn’t anything going on back here other than a system spec listing and for the product specs they only tell you the display outputs. The box has no picture of the card, no dimensions, clock speeds, or other information. Sadly if shopping in retail you are going to have to google more information because overall the box isn’t giving you anything.
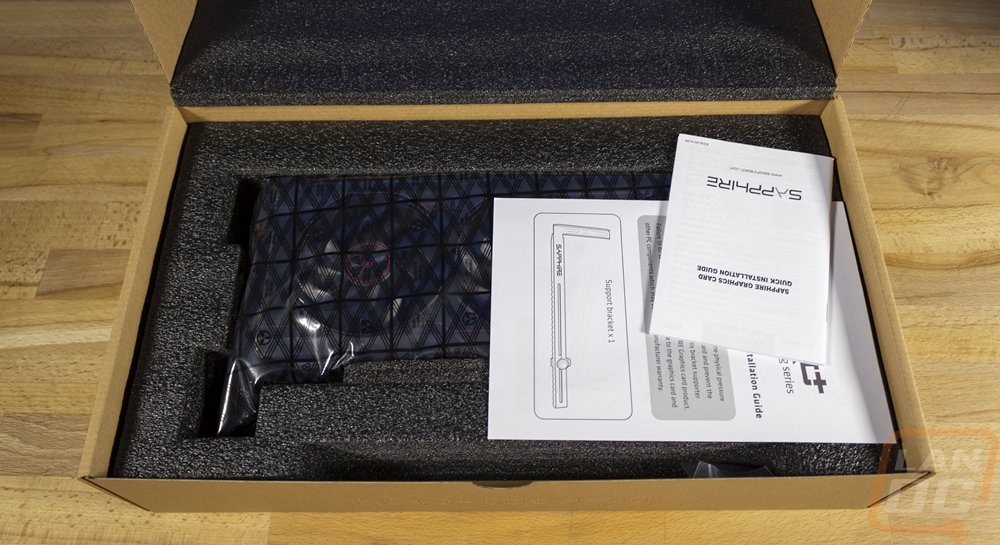
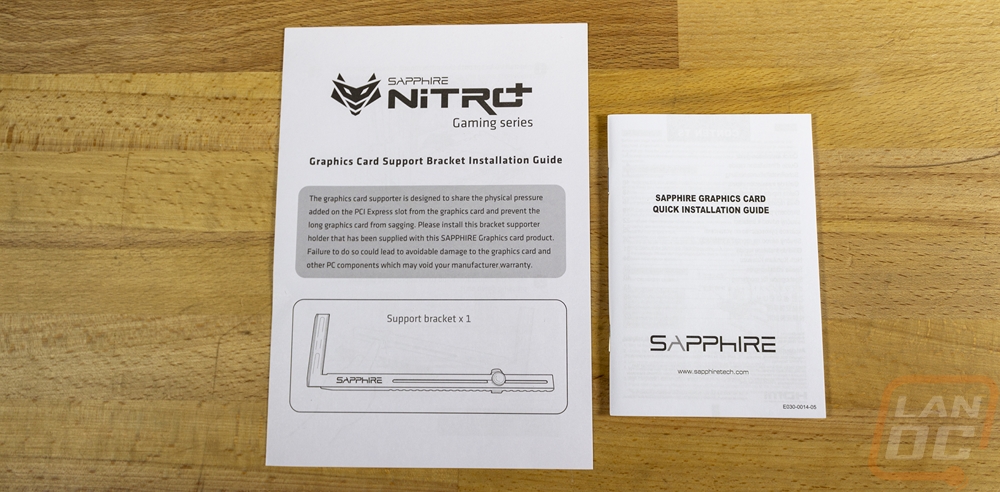
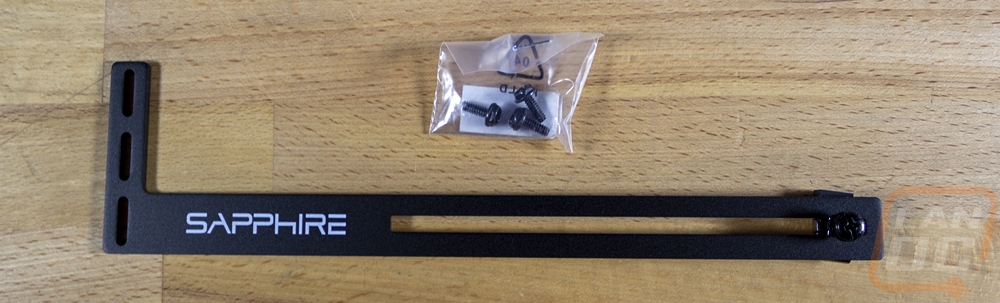
When you open things up the outside packaging has a brown box inside for the main structure. That box has a thick layer of foam up top and then up under that you will find the card in its own cutout in the bottom half of the foam. It also comes wrapped in a static protective bag as well. On top of that is the documentation which you get a quick installation guide for the card and then a paper on the installation of the included support bracket. There is then a slot in the foam down at the bottom edge this has the support bracket inside. The bracket is a simple metal plate cut to attach to the top of three PCI brackets and then an adjustable slot for the padded mount that touches the card to help keep the strain off of the PCIe slot and to prevent sagging. Sapphire also includes three longer screws for this as well.
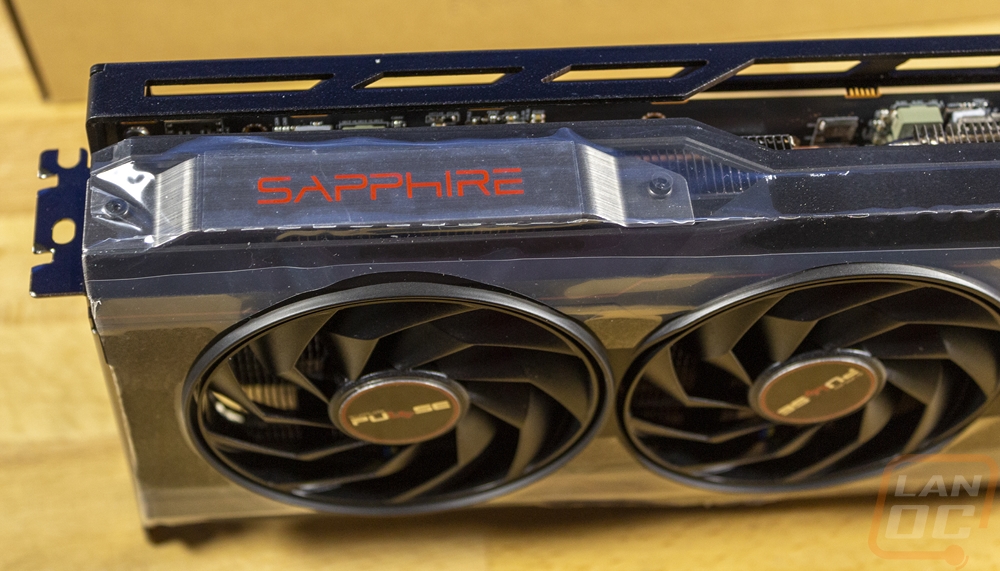
In addition to the packaging, the 7900 XT Pulse does also come wrapped up in plastic for the fan shroud at least. I was also surprised that after taking that off that there were two more layers of plastic over top of the Sapphire branding as well.
Card Layout and Photos
The styling for the Sapphire 7900 XT pulse has the same look as the last generation of Pulse cards. This includes a black plastic fan shroud which has a few groves in it for styling as well as red lines running the length of the shroud. What is missing from this design that most cards would have is RGB lighting. The Pulse design keeps things simple and relatively clean with its blacked-out look. This keeps costs down and focused on things like cooling performance and people who don’t want RGB lighting are going to love this one as well of course. I’m just happy that they didn’t slip in a backlit branding logo just to be able to say it had RGB on it.
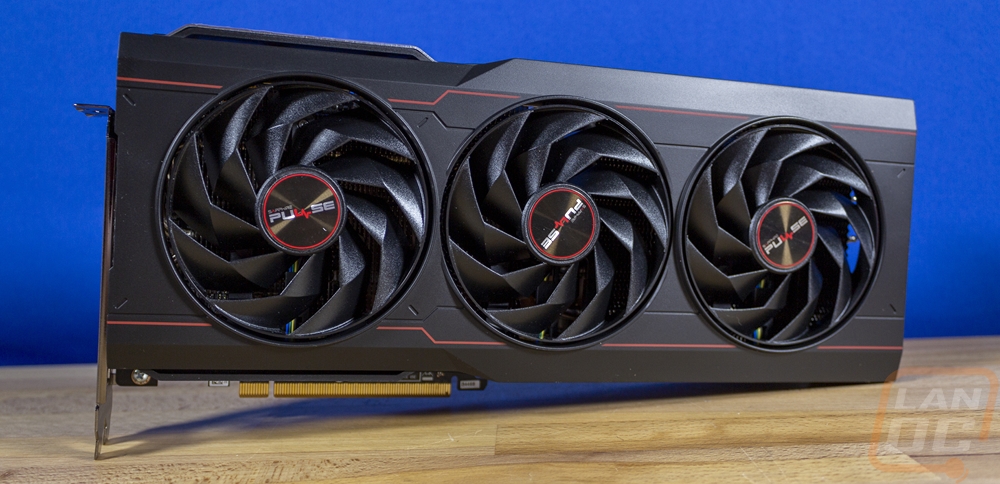
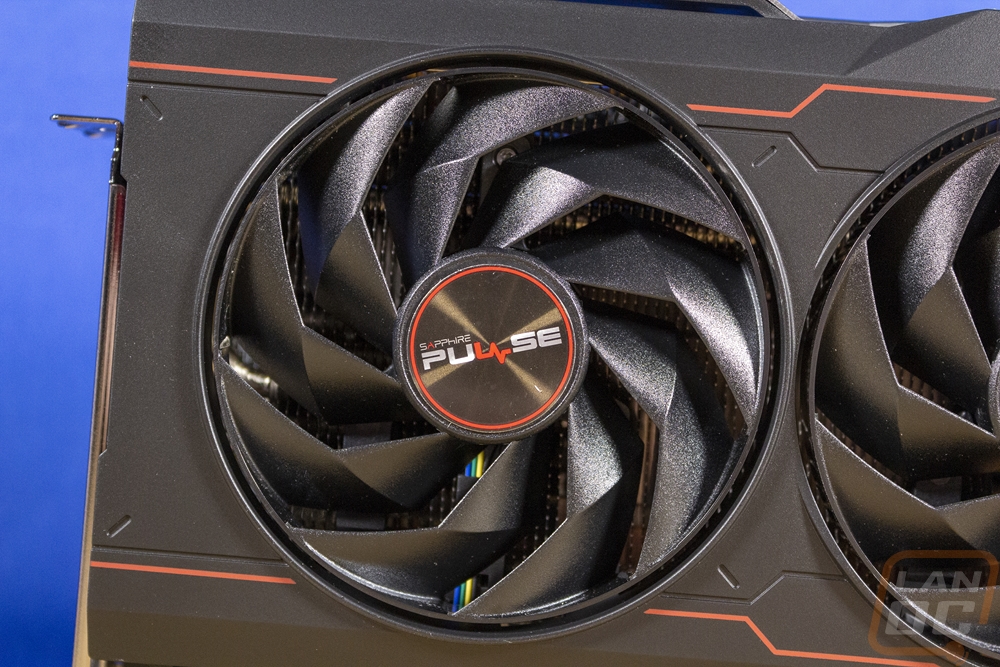
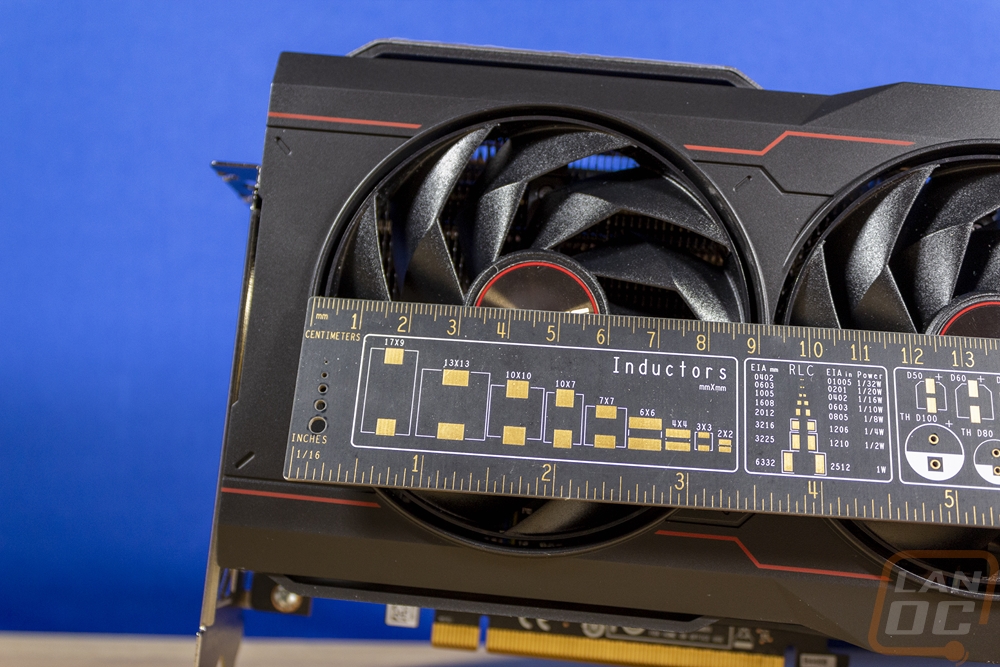
The fan side of the Sapphire 7900 XT Pulse has three fans which are all the same size. The fan opening is 91mm and the blades themselves measure 88 mm wide. The design is axial, blowing air down into the heatsink below it. Each has 9 blades with an interesting angular shape to them. They also have an outer ring at the end of the blades that links them all together and adds strength. These are the same fan design I saw on the Sapphire Nitro+ RX 6750 XT last generation as well. Then in the center, they have a sticker in the middle with a metal finish and the Sapphire Pulse logo on it as well as a red ring on the outside that matches the red on the fan shroud.
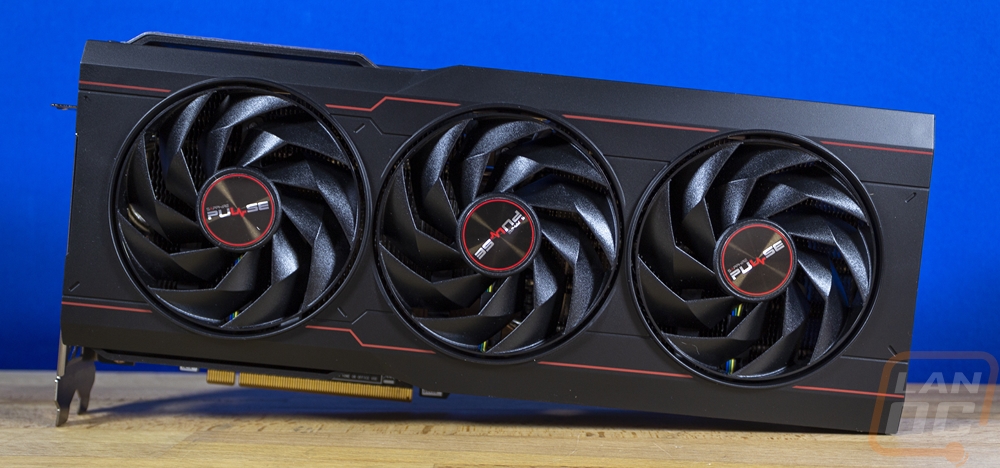
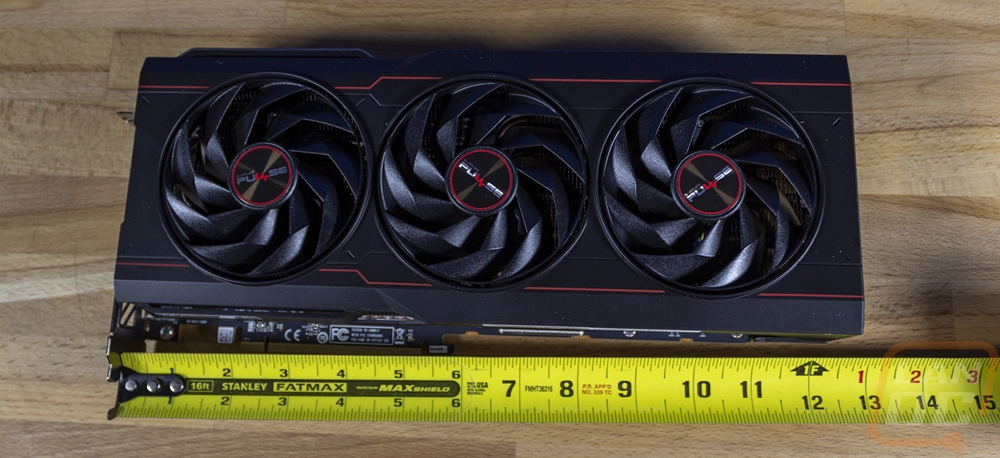
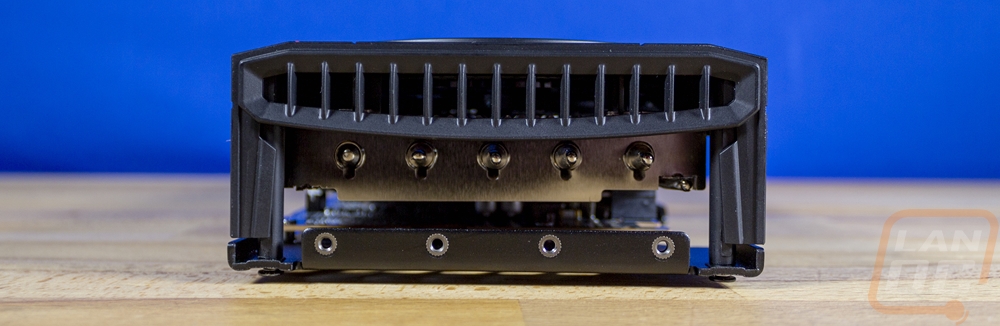
So Sapphires 7900 XT Pulse design isn’t as compact as AMDs reference design but it also is far from the crazy huge designs that you see a lot of aftermarket cards end up having or even Nvidia’s higher-end Founders Edition cards as well. It is officially a 2.7-slot design which is in line with it being 52.67 mm thick at the fans. It is then 313 mm long and 133.75 mm tall. So the card is taller than the “standard” PCI device but with 27mm up over top of the top of the PCI bracket the Pulse isn’t too bad at all. Overall this should make it a much better choice in more compact cases, especially with the power connections being recessed as well.
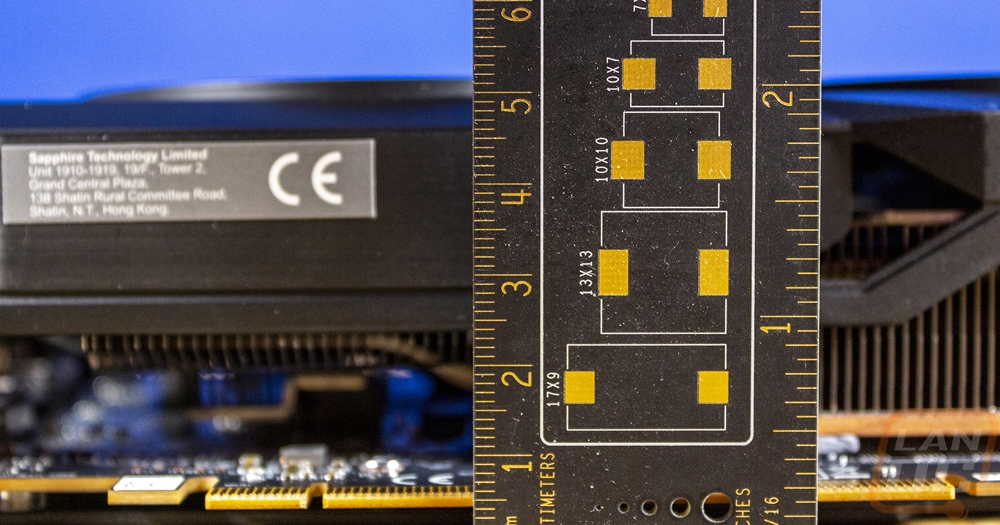
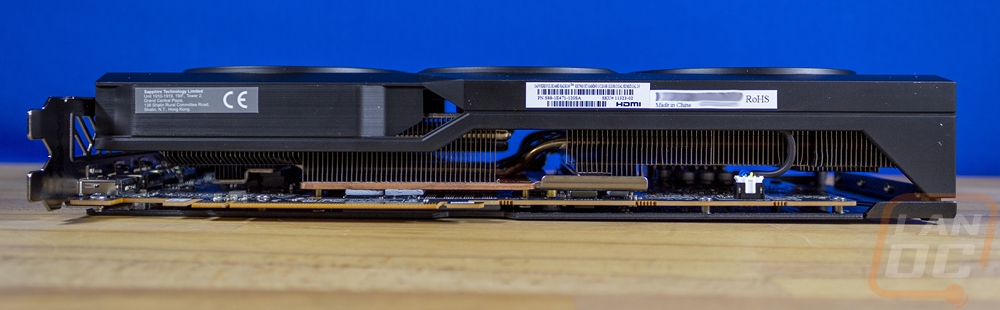
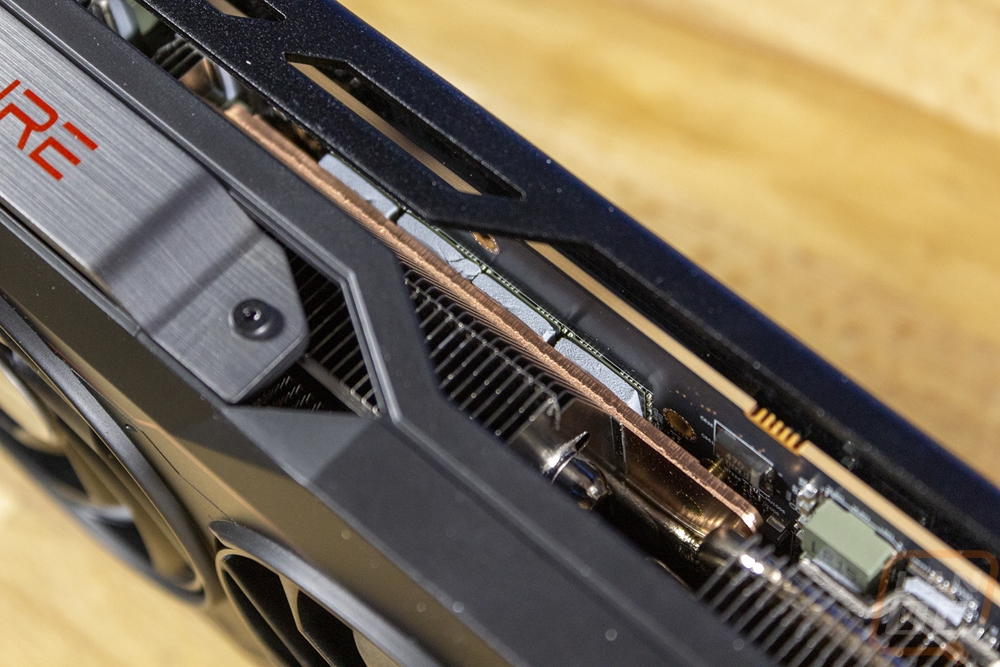
The view of the top, bottom, and end edges gives us more information about the Pulse design as well. For starters, we can see that Sapphire went with a horizontal aluminum fin design on their heatsink which means the air blowing down onto the cooler from the fans will mostly exit out the top and bottom of the card. We can also see the S-shaped heatpipes which run close to the heat plate and then transition up into the higher heatsink on the right. The heatpipes also curve back around and go over the middle of the card a second time as well. The top and bottom have large open areas for the airflow designed into the fan shroud. The end of the card is also partially open as well, not that much air should be blowing in that direction. The end also has four threaded mounting holes that you can use with some cases to keep the card stable. The top edge does have the aluminum backplate bent around onto it and in addition to the Radeon branding there is also a brushed aluminum silver plate with the Sapphire branding in red as well. There isn’t any lighting however which to some people will be a big feature of the Pulse design.
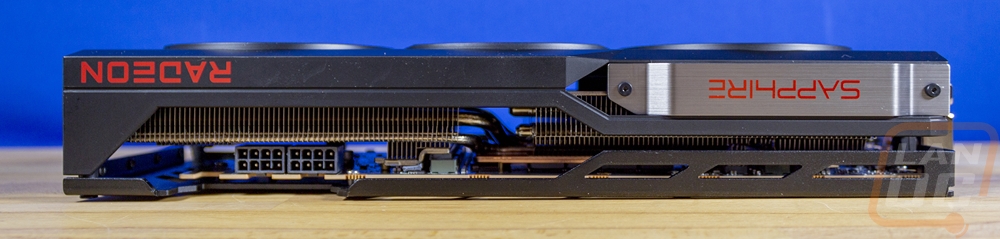
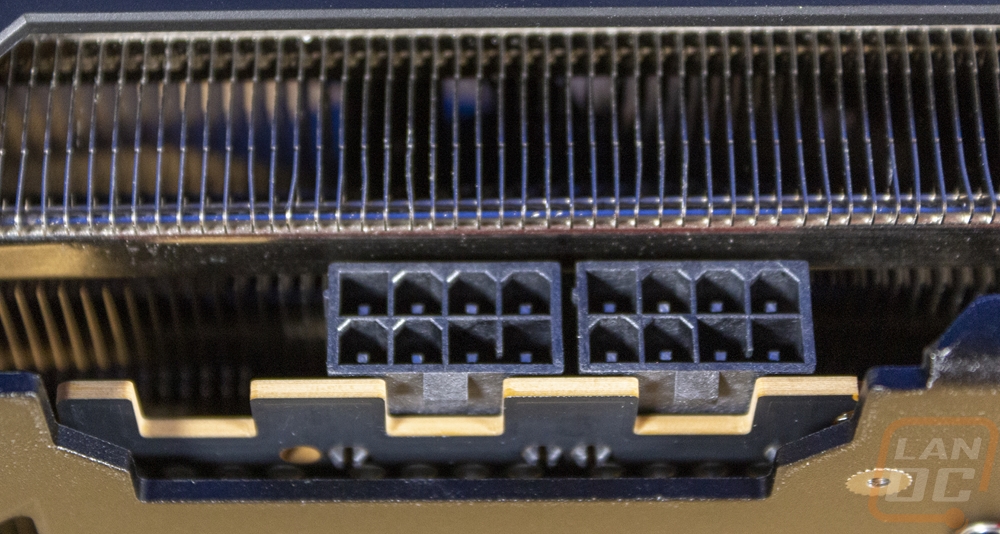
Also up on the top edge of the 7900 XT Pulse the backplate and the shroud at the top of the card open up to allow access to the power connections. The 7900 XT Pulse has the same two 8-pin power connections that the reference card had. The PCB is notched to allow room for the clips to have the power connections flipped around which saves room for the heatsink. Interestingly there is room for a third connection which I assume allows the same PCB to be used on the XTX as well. The top-down view also gives us a great look at the large copper heat plate that sits over the GPU and on the memory as well with the thermal pads on each memory chip. This is what the heatsink is in contact with to pull the heat out and away.
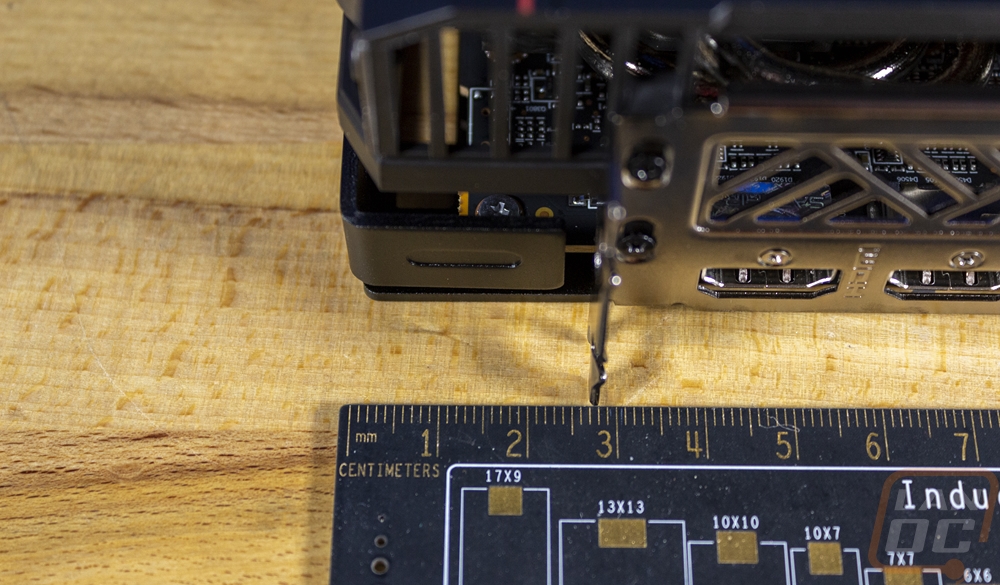
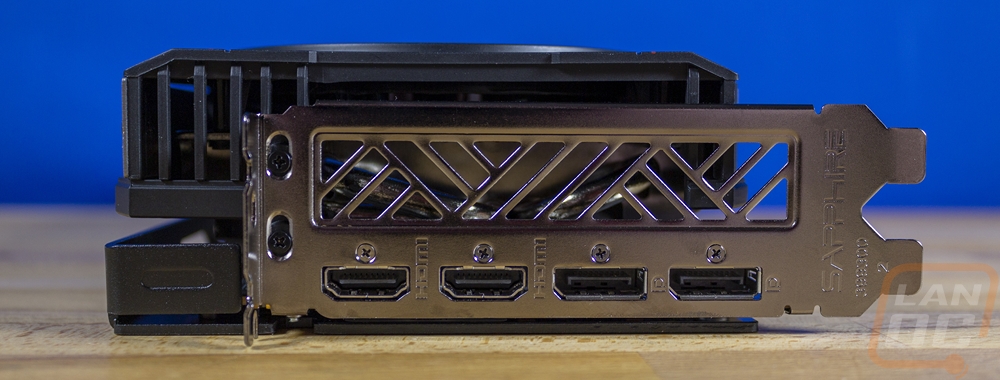
For the PCI bracket end of the 7900 XT Pulse Sapphire has given it a slightly different connection layout than AMD did with the reference design. The reference design had two DisplayPorts, one HDMI, and one Type-C. The Pulse has the same dual DisplayPorts but they are paired up together not split apart. Then they dropped the Type-C connection and went with two HDMI. I’m a little torn on this because three DisplayPort and one HDMI has been the standard for a while now, but for anyone who has a few older monitors the extra HDMI might be a better choice. Beyond that, the bracket has the Sapphire branding at the bottom and then the second slot is just all ventilation. With the blacked-out card design having this be black would have been a nice touch, but knowing that this is a budget-focused card, I do understand why they may not be possible.
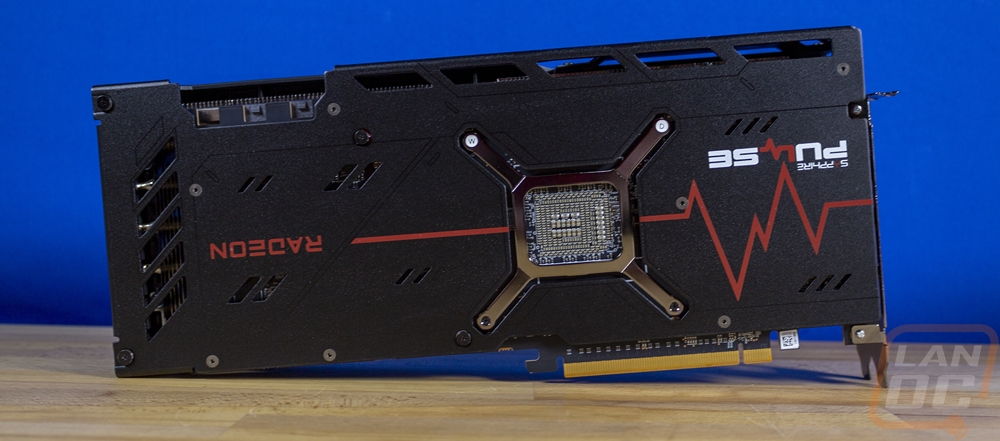
For the back of the 7900 XT Pulse Sapphire didn’t skimp at all. The back of the card has a full metal backplate that covers everything on the back except for the cutout that exposes the back of the GPU itself. The backplate also wraps around up at the top into the top edge of the card which helps give it more strength. While this isn’t a huge card like most, the extra strength should help keep it from sagging along with the included bracket. The backplate has a textured black finish on it and then they have printed a red zig-zag line for the pulse branding along with Radeon down at the end of that and the Sapphire and Pulse logos. The backplate also has small cutouts over the back of different sizes for additional accents as well as larger cutouts down at the end where the PCB ends and the front fan can blow through slightly.
Test Rig and Procedures
Test System
CPU: Intel Core-i9 13900K – Live Pricing
Motherboard: Asus Z790 Extreme – Live Pricing
Cooling: Corsair H100i Elite LCD Display - Live Pricing
Noctua NT-H1 Thermal Paste - Live Pricing
Memory: Crucial 32GB Kit (2 x 16GB) DDR5-5600 UDIMM– Live Pricing
Storage: Sabrent Rocket Q4 2TB – Live Pricing
Power Supply: Thermaltake Toughpower GF3 1000W- Live Pricing
Case: Primochill Wetbench - Live Pricing
OS: Windows 11 Pro 64-bit - Live Pricing
|
Our Testing Procedures |
|
|
3DMark |
All 3DMark-based tests are done using the most recent version. We test using all three versions of Fire Strike, Both Time Spy and Time Spy Extreme, and Speed Way. Tests to look at ray tracing performance are done with Port Royal when supported and for Nvidia cards that support DLSS, the DLSS subtest is also done at 1440p with the performance setting and DLSS 2.0 as well as a look at DLSS 1, 2, and 3 at 4K. |
|
Unigine Superposition |
1080p Extreme and 4k Optimized benchmarks along with the VR Future test are done. The VR test is done at the Oculus resolution |
|
VRMark |
Only the Blue room test is run |
|
CS:GO |
This test is done using the workshop map called CS:GO Benchmark. You can find more information at this link. https://www.gamingpcbuilder.com/how-to-install-csgo-fps-benchmark-map/ I test at 1080p, 1440p, and 4K resolutions. All auto settings are turned off and detail is set to their highest settings. shadow quality high, model texture detail high, shader detail very high, AA set to 16x, uber shaders enabled |
|
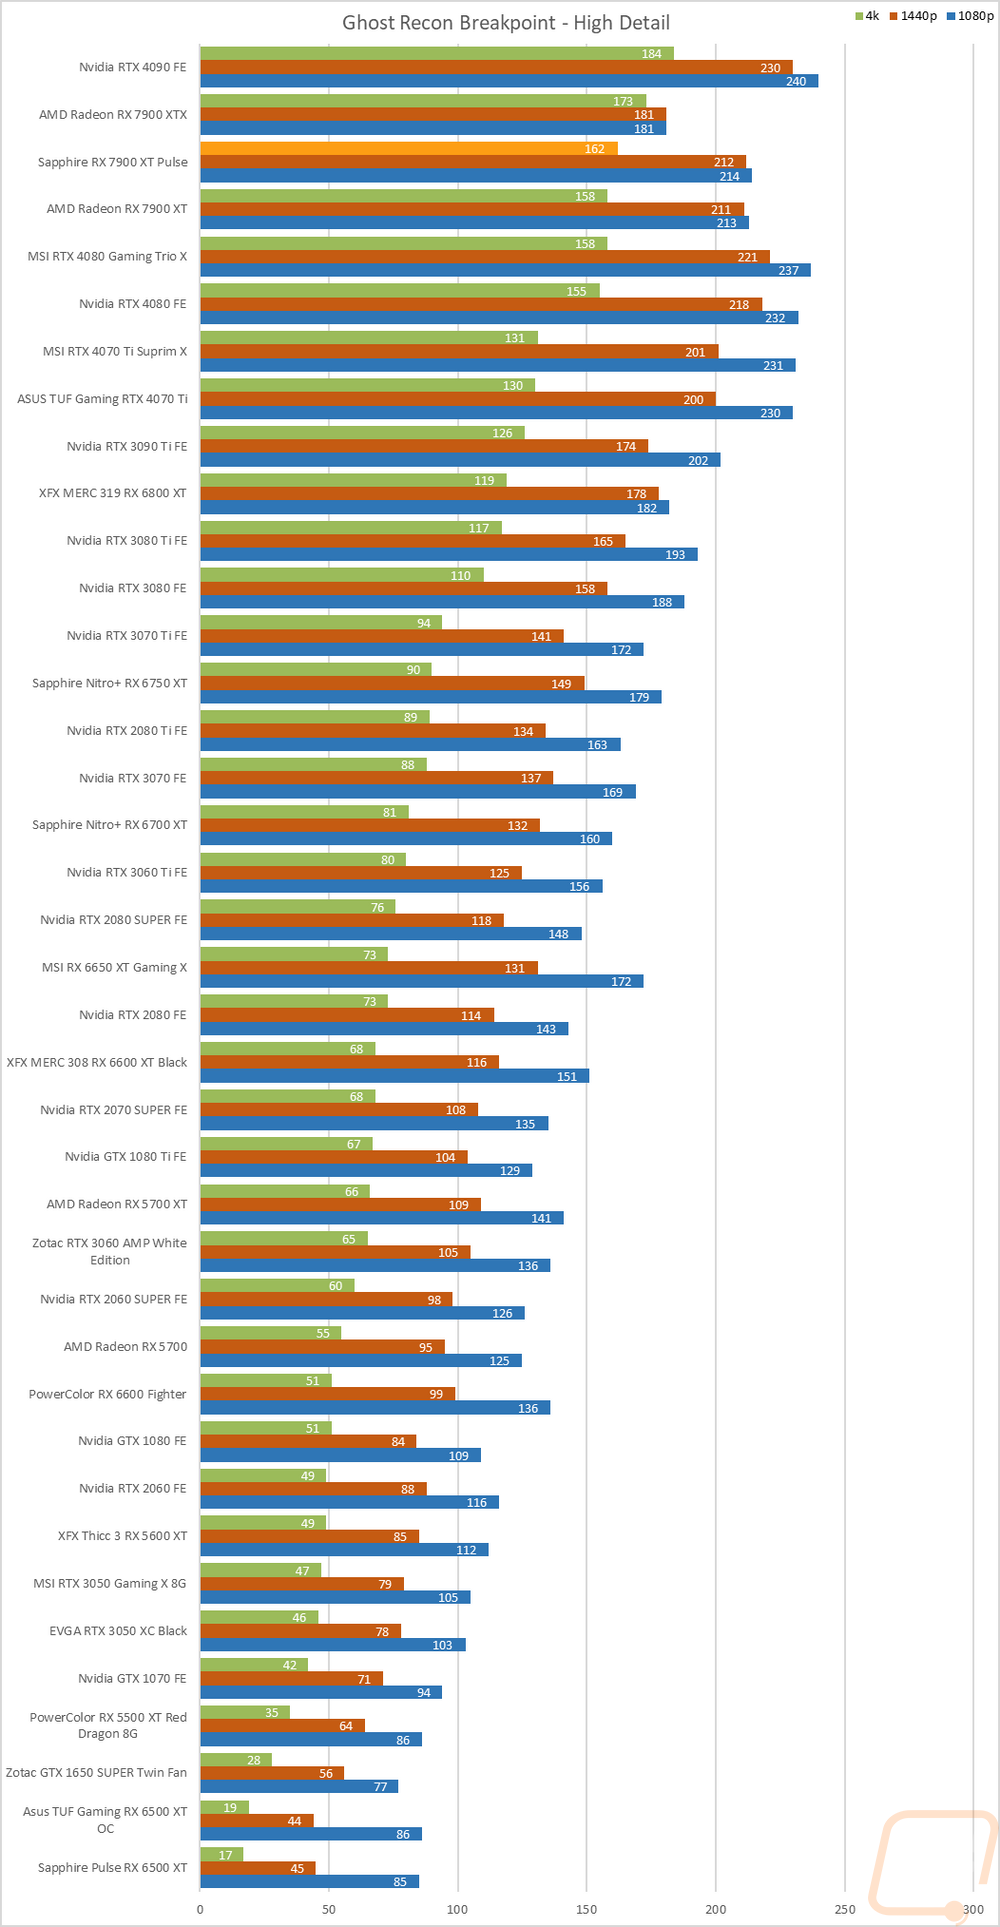
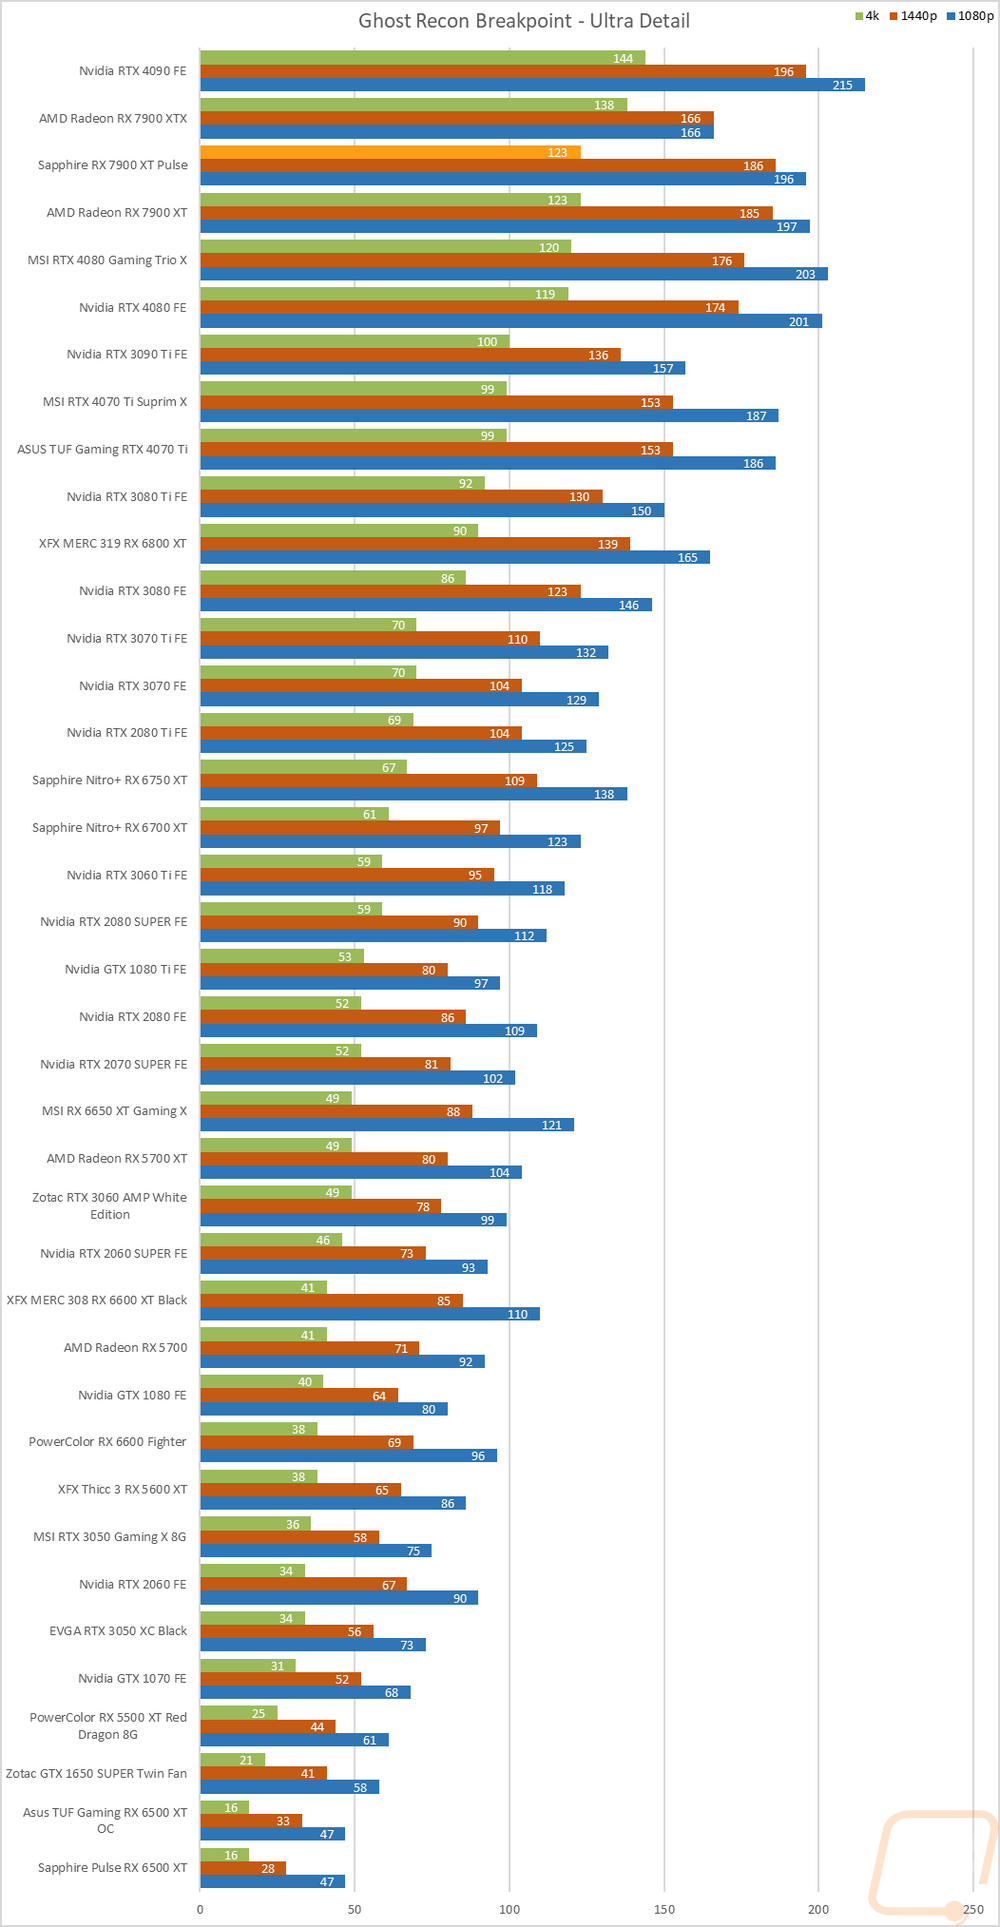
Ghost Recon Breakpoint |
Built-in benchmark tested at 1080p, 1440p, and 4k with the Ultra and Medium detail settings |
|
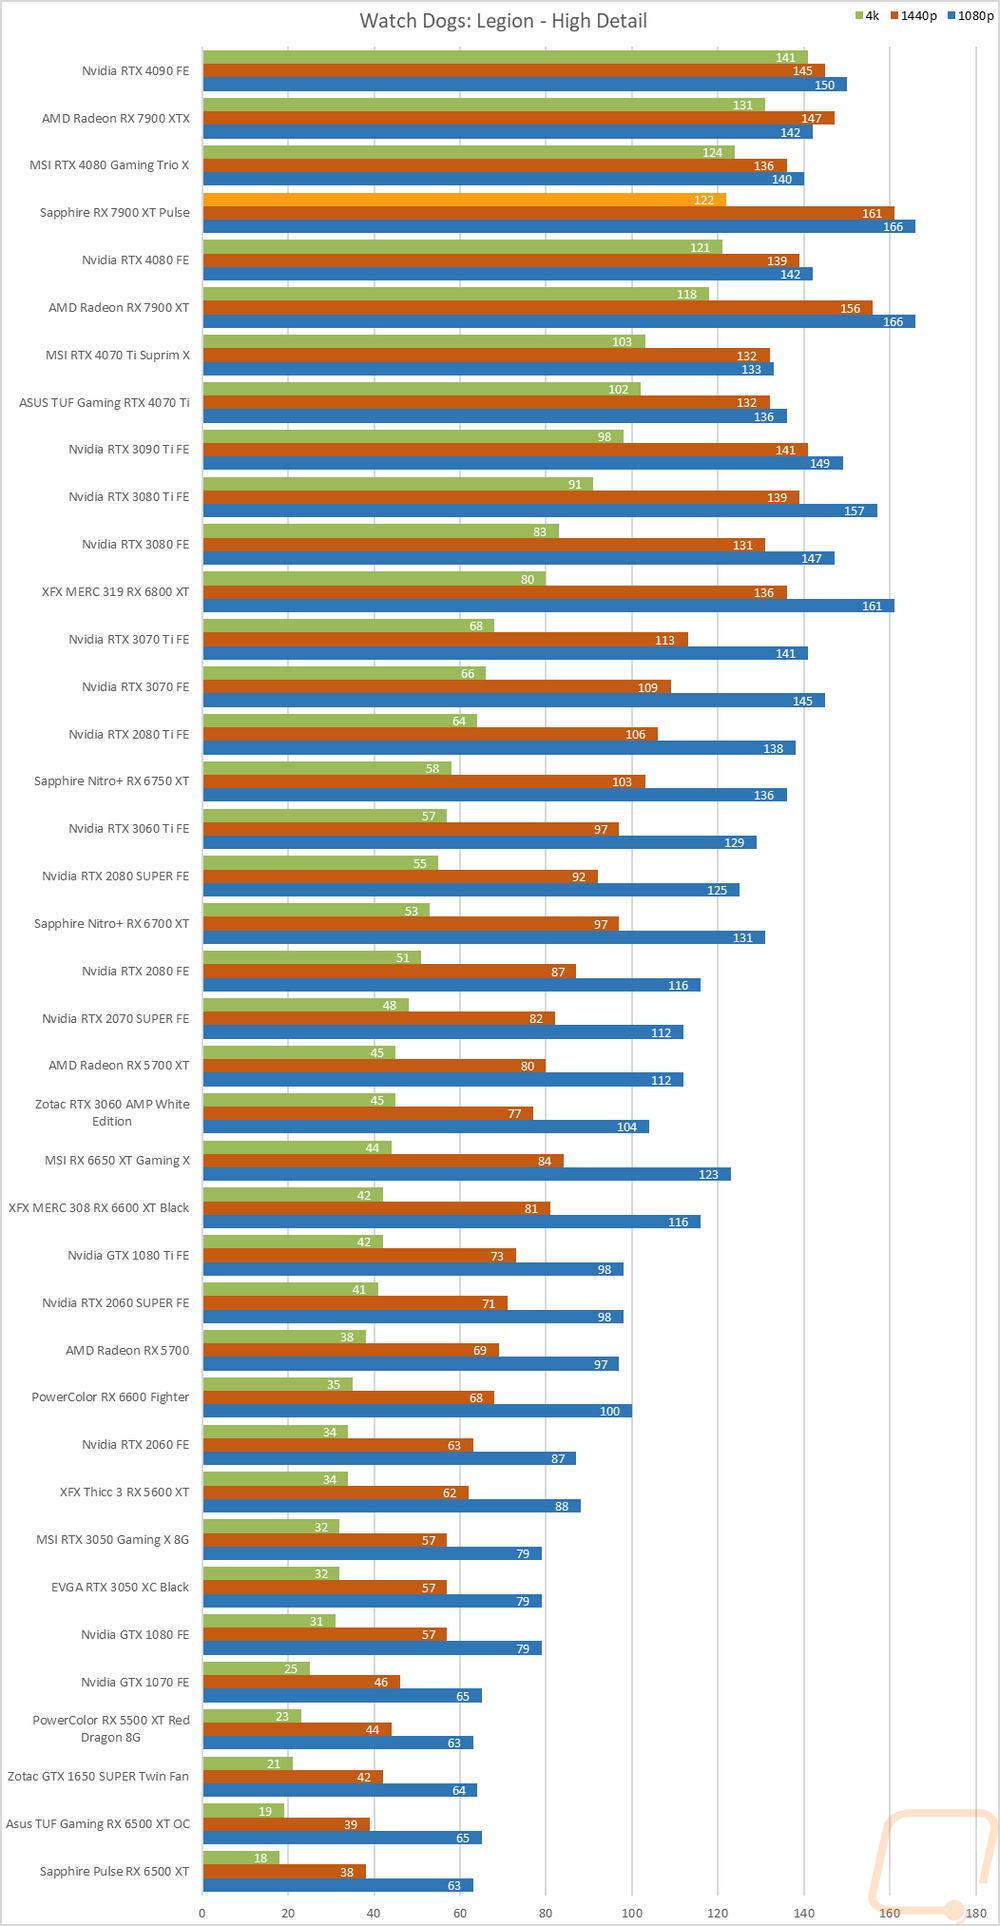
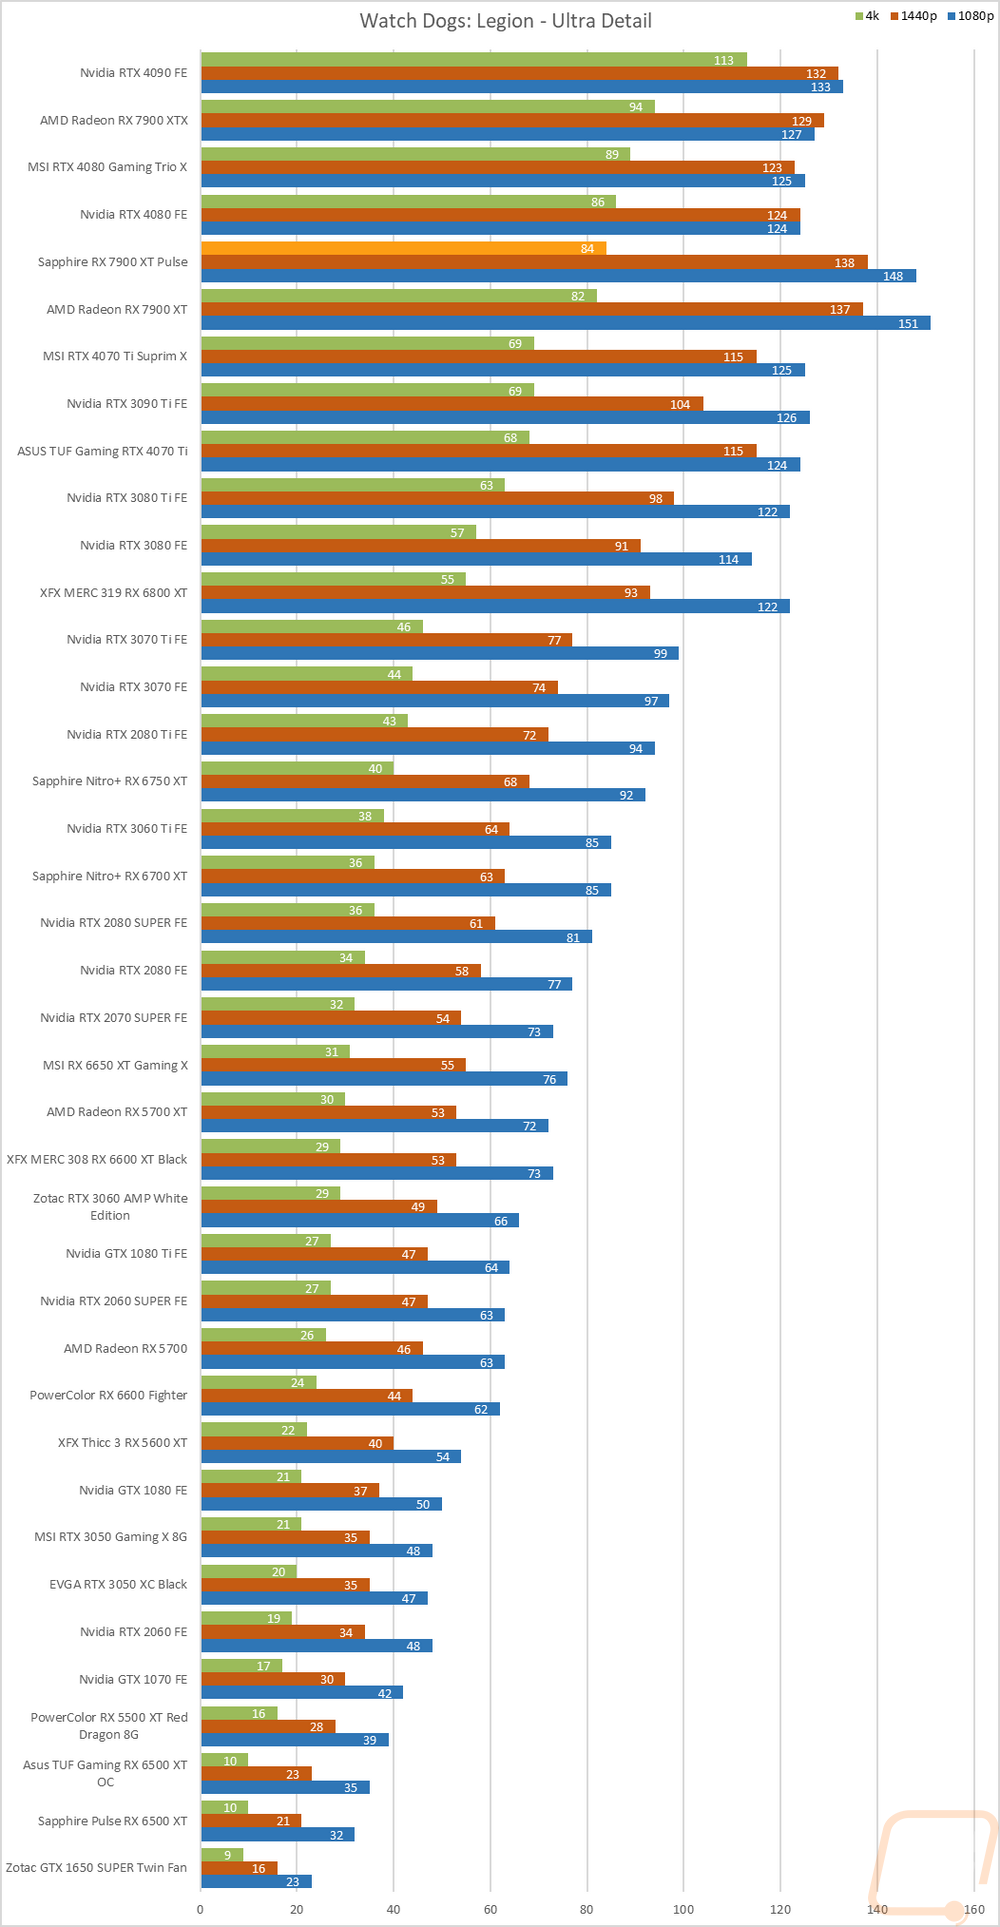
Watch Dogs: Legion |
Built-in benchmark testing at ultra and high details. Tested at 1080p, 1440p, and 4k. I also do RTX and DLSS testing on Nvidia cards at 4K using the Ultra detail settings as a base as well. |
|
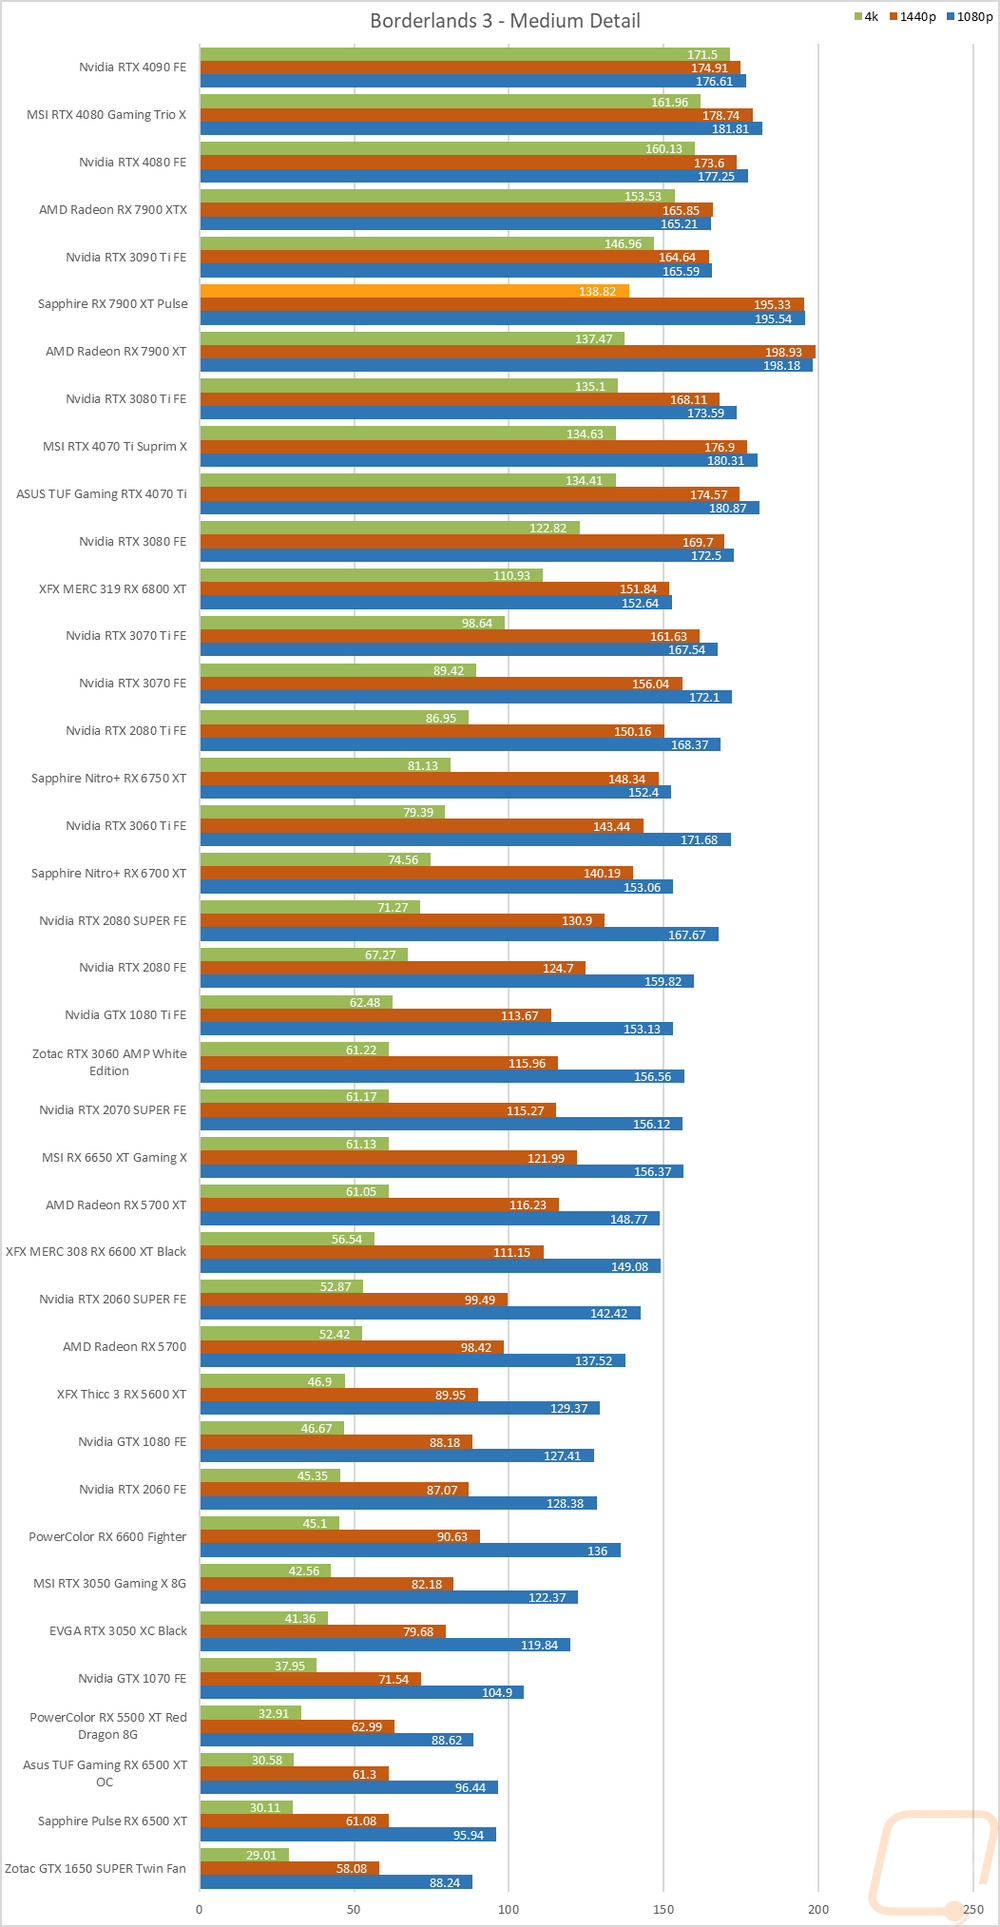
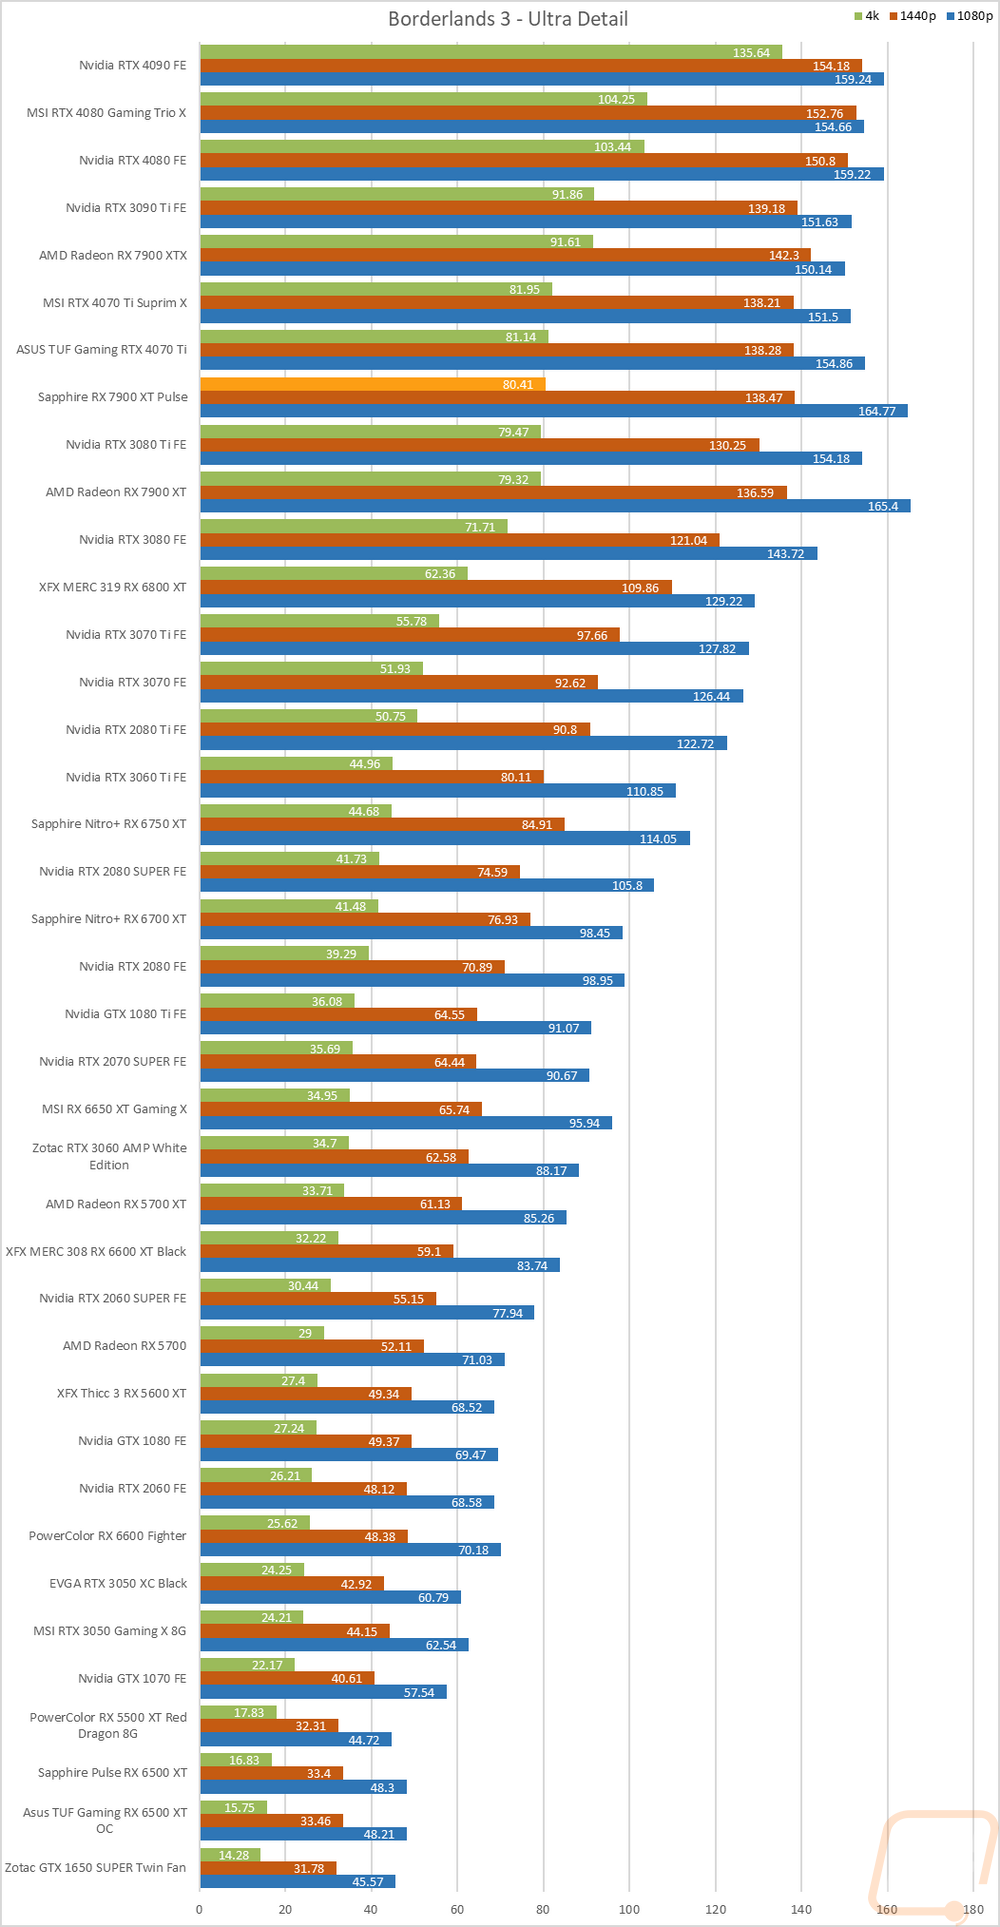
Borderlands 3 |
Built-in benchmark testing with the ultra detail setting and medium detail setting, done at full screen with default settings at 1080p, 1440p, and 4k on DX11 |
|
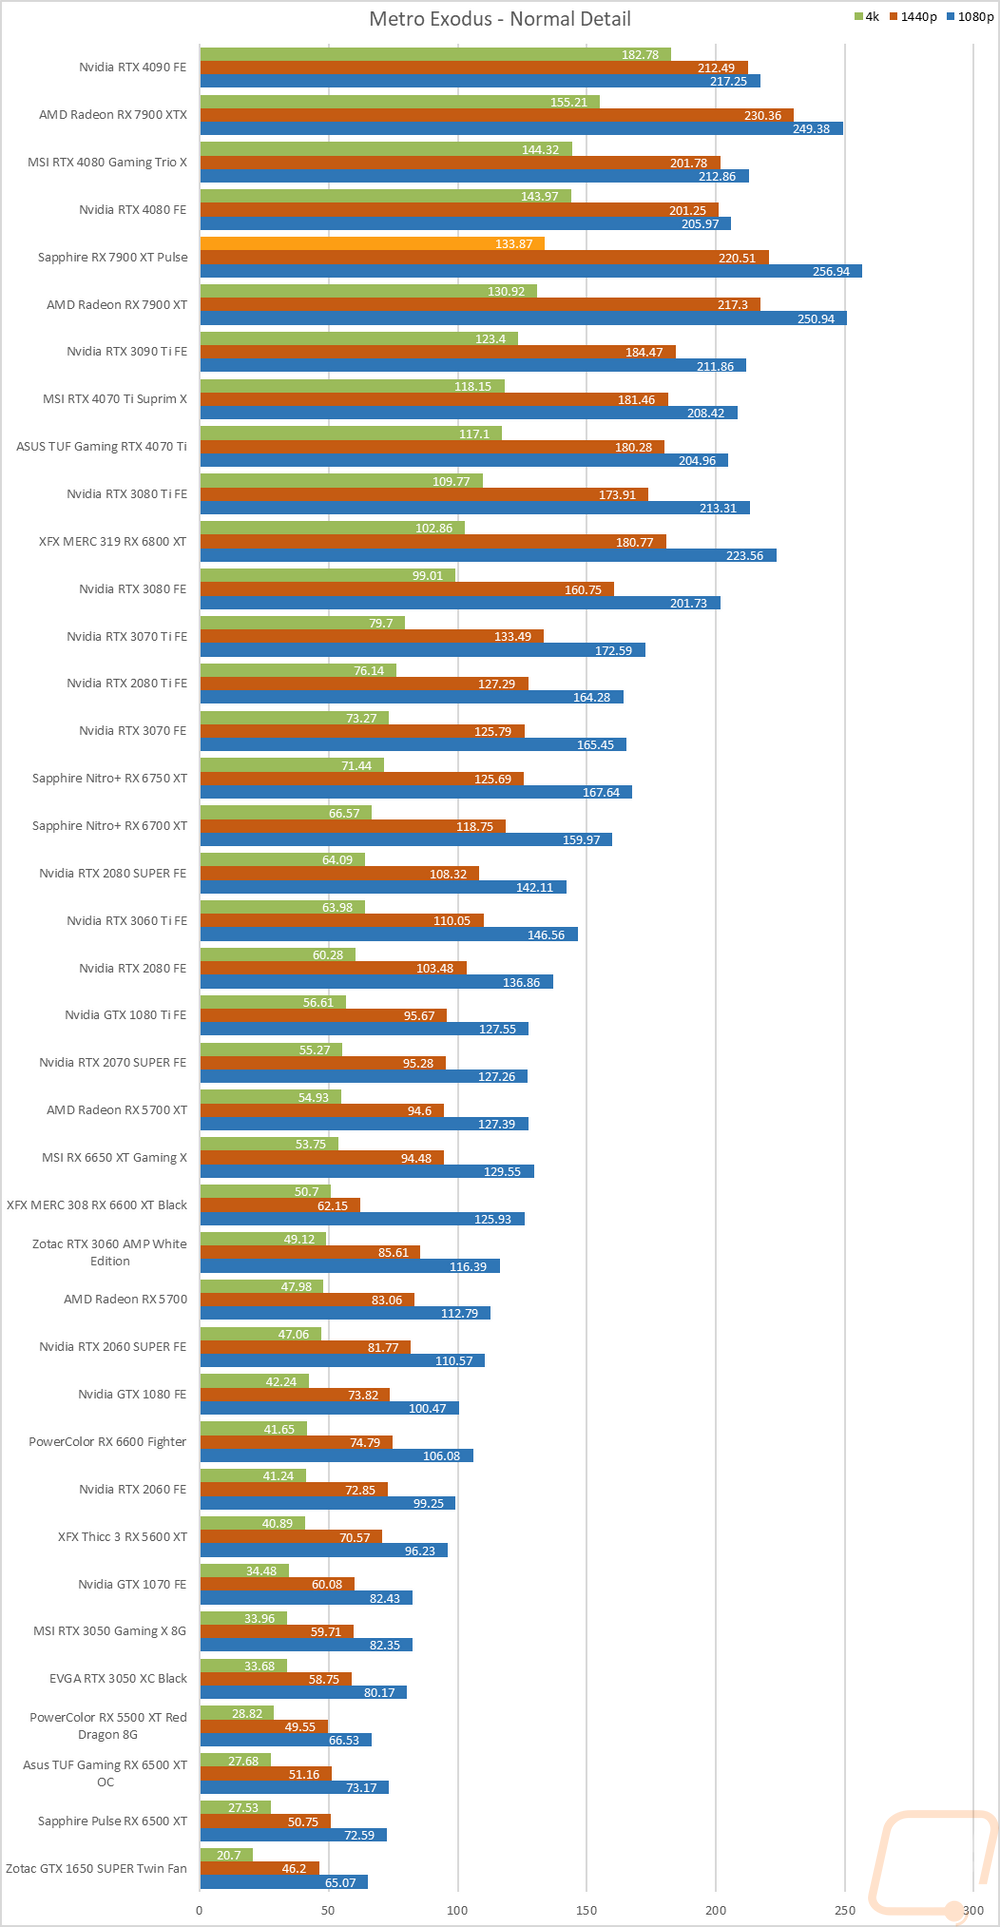
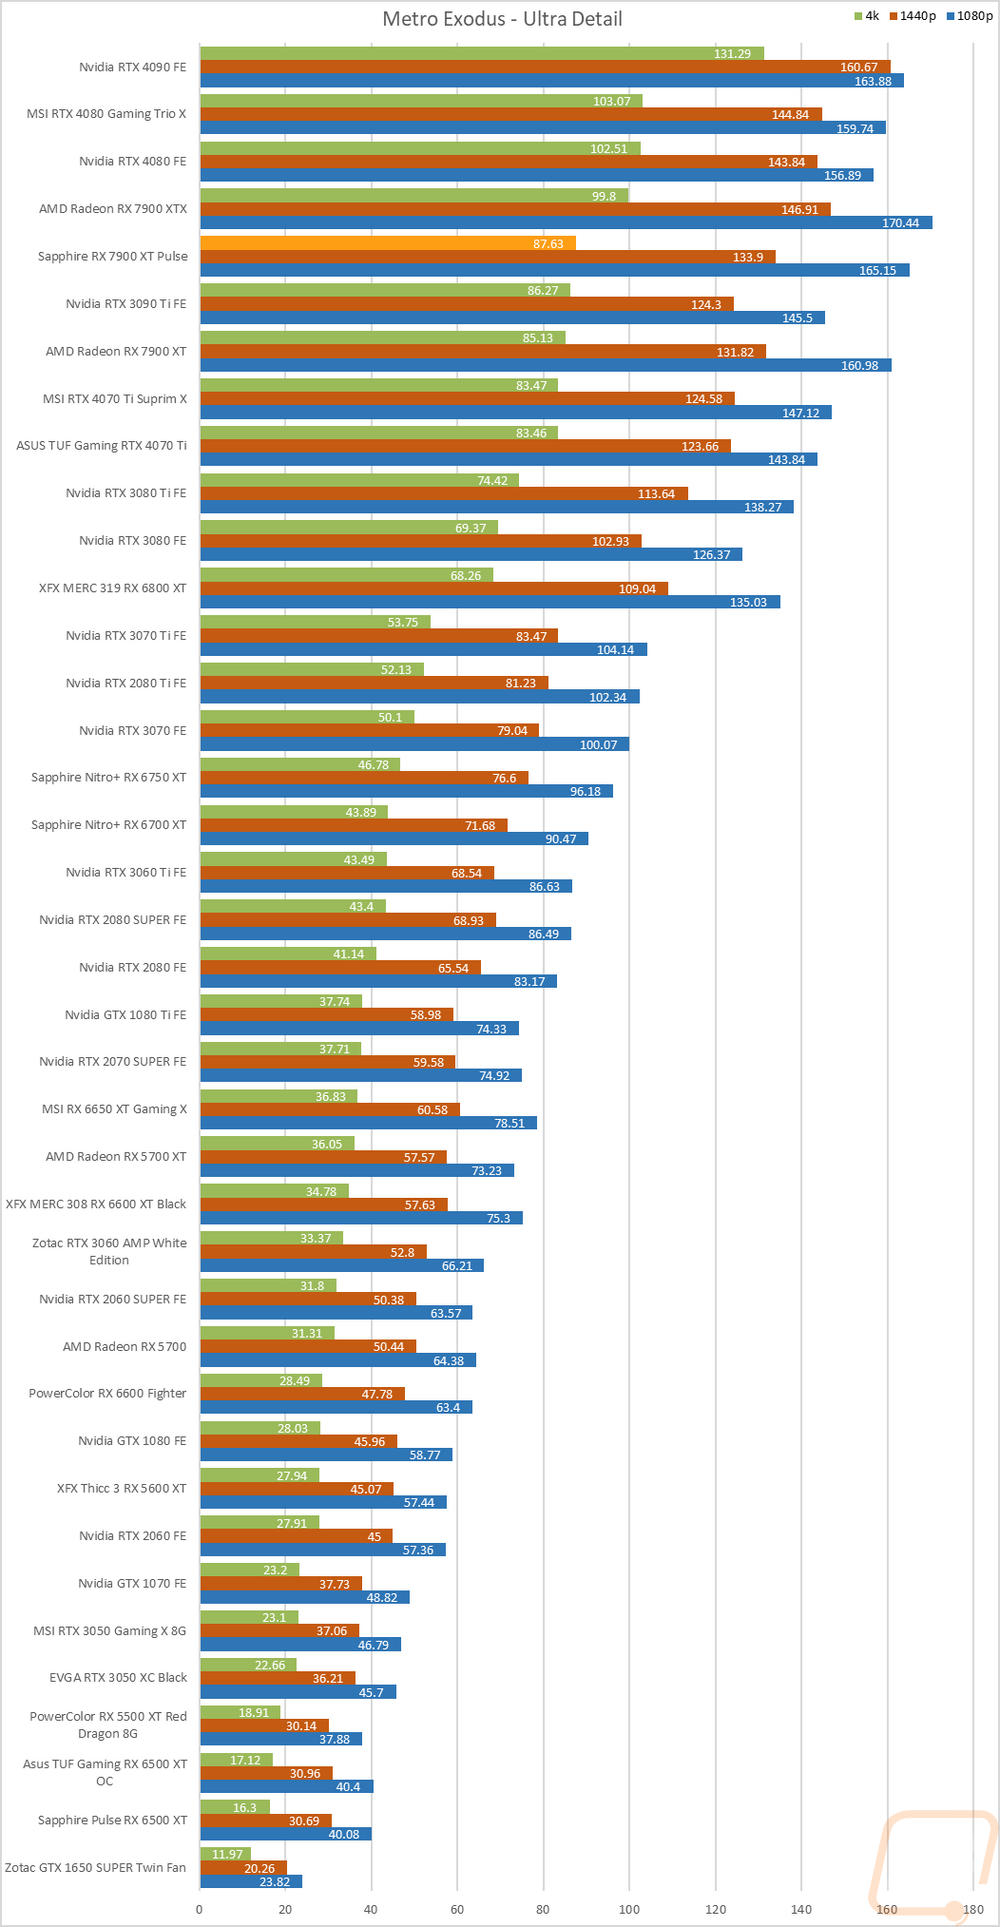
Metro Exodus |
Using built-in benchmark, testing at ultra and normal details at 1080p, 1440p, and 4k. I also do RTX and DLSS testing at 4K with the ultra-detail base settings for Nvidia cards as well. |
|
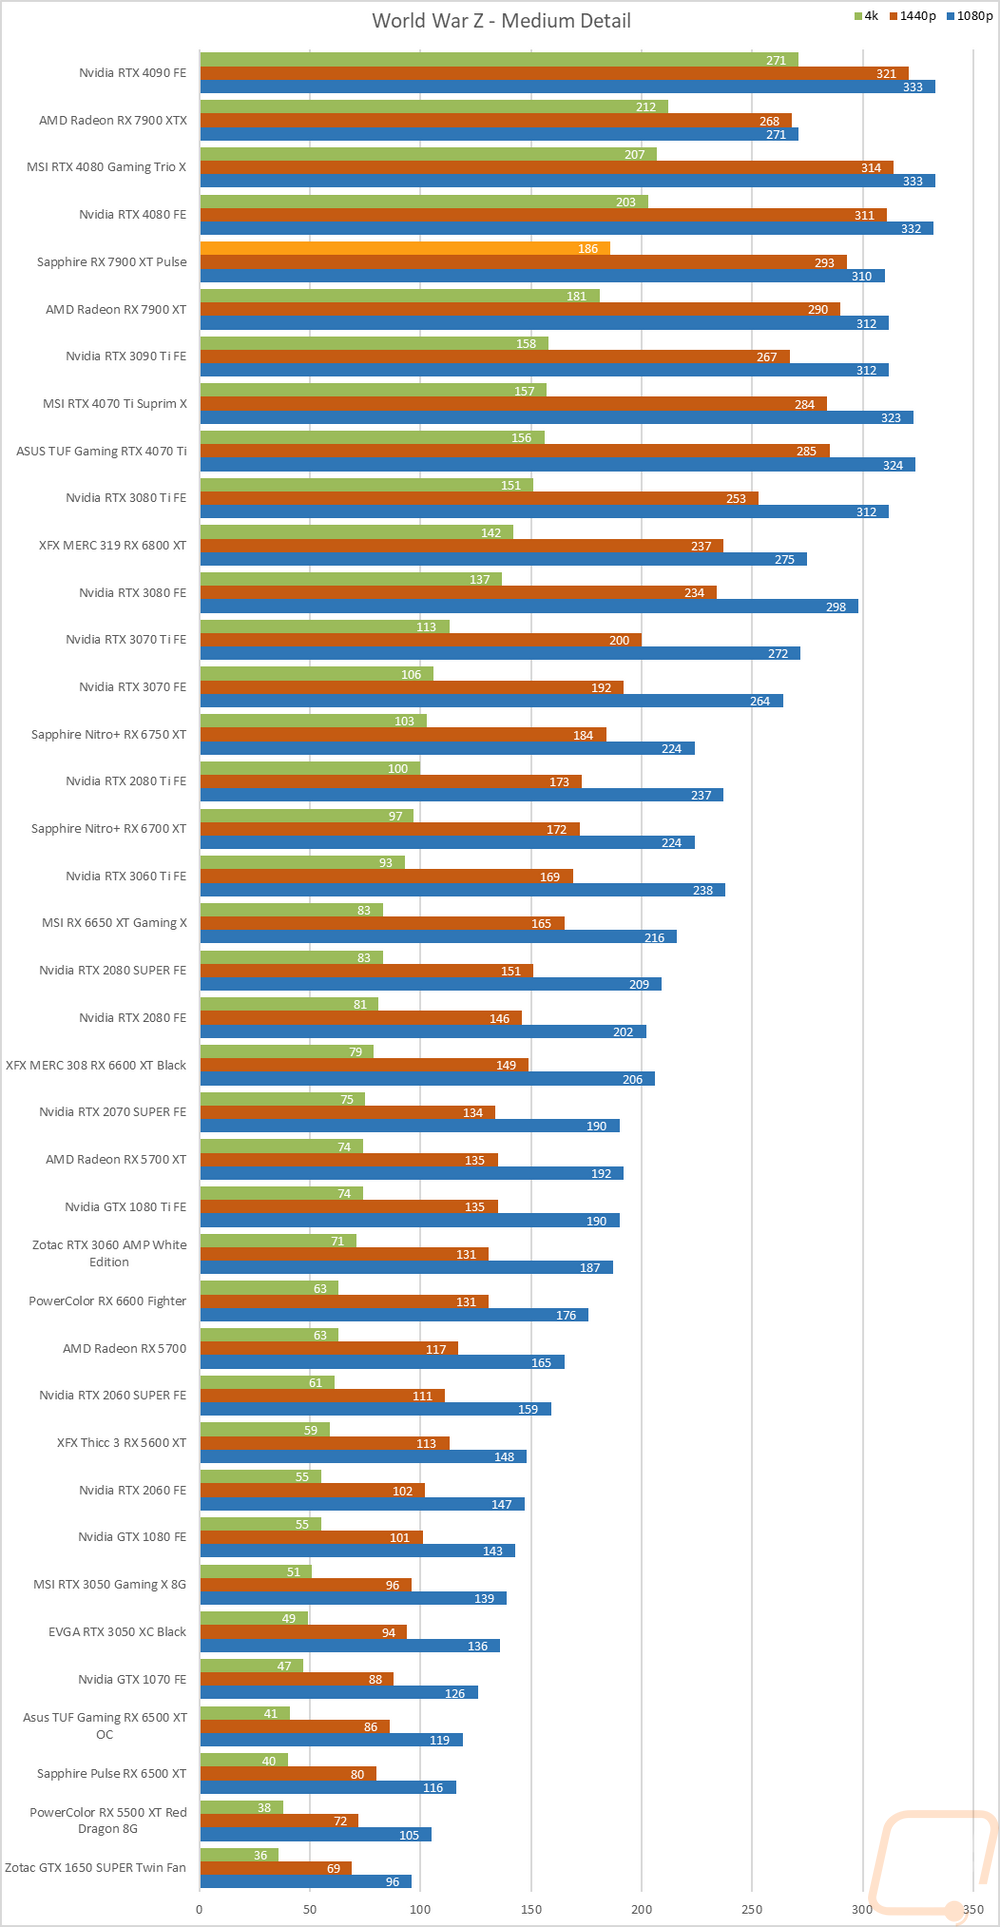
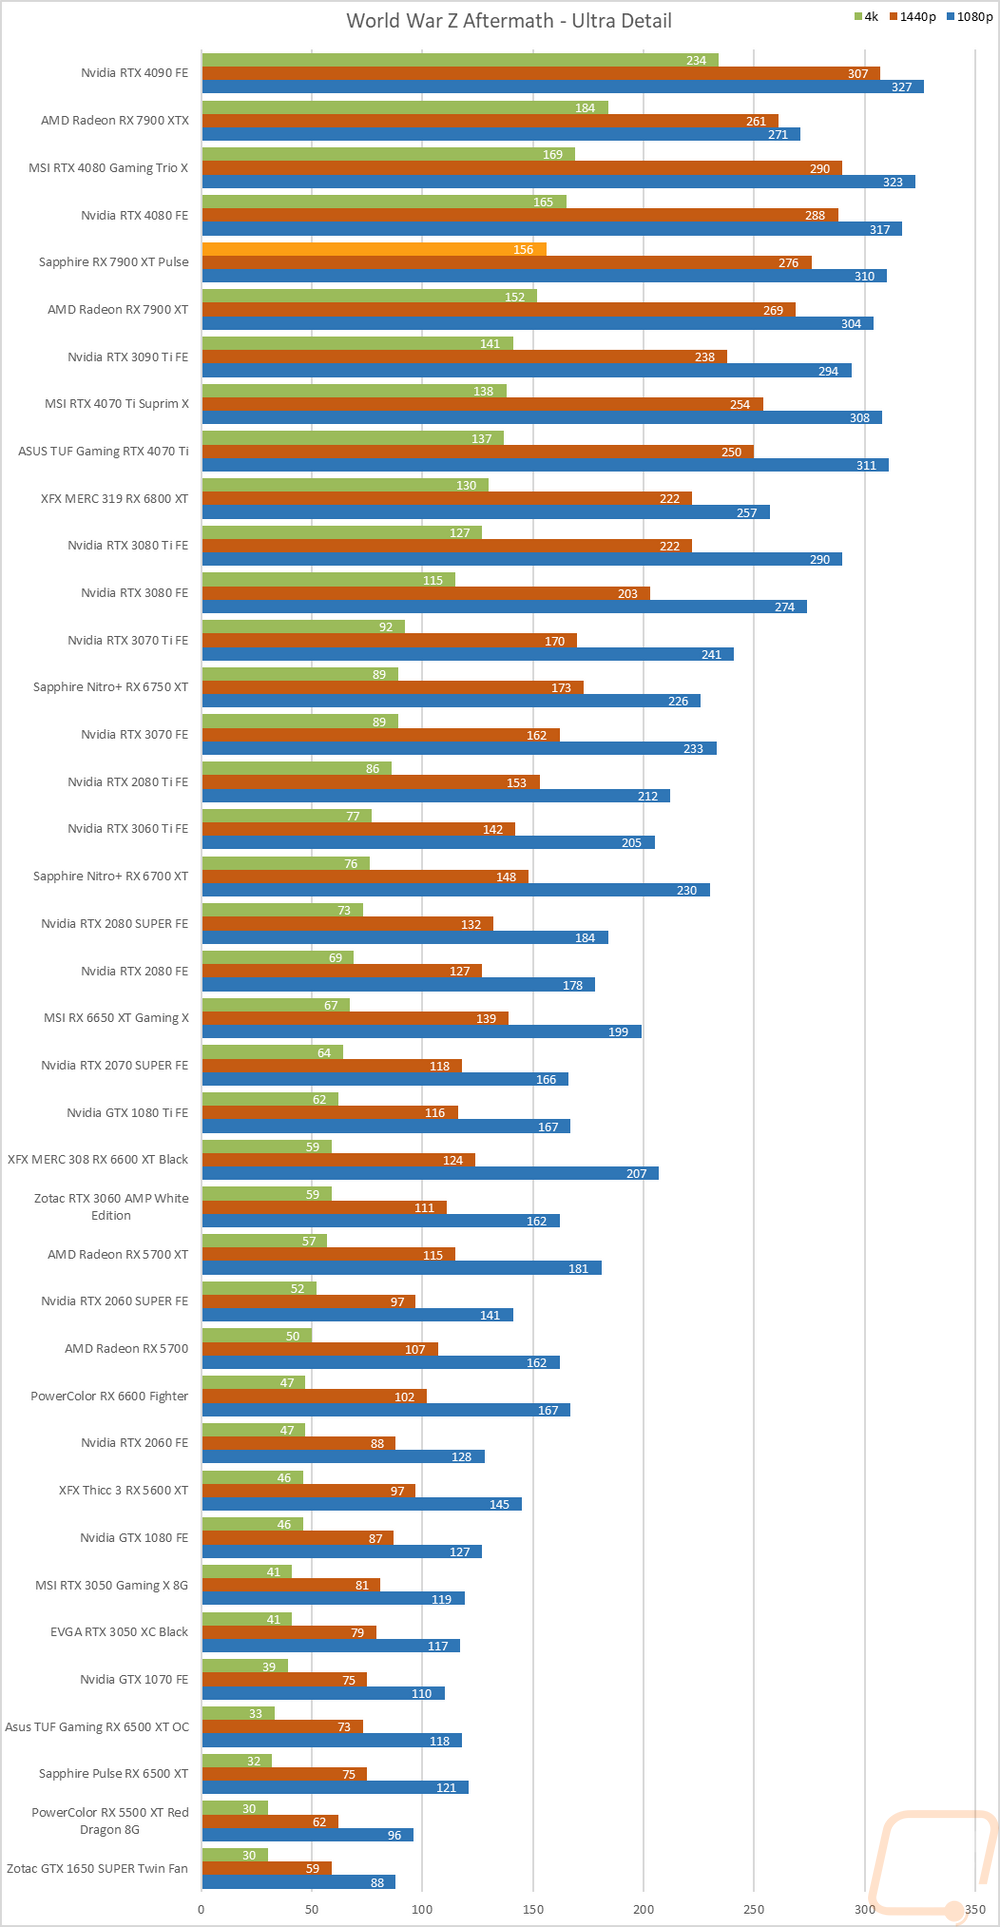
World War Z Aftermath |
Built-in benchmark in DX11 testing both the Ultra detail and Medium detail levels at 1080p, 1440p, and 4K resolutions |
|
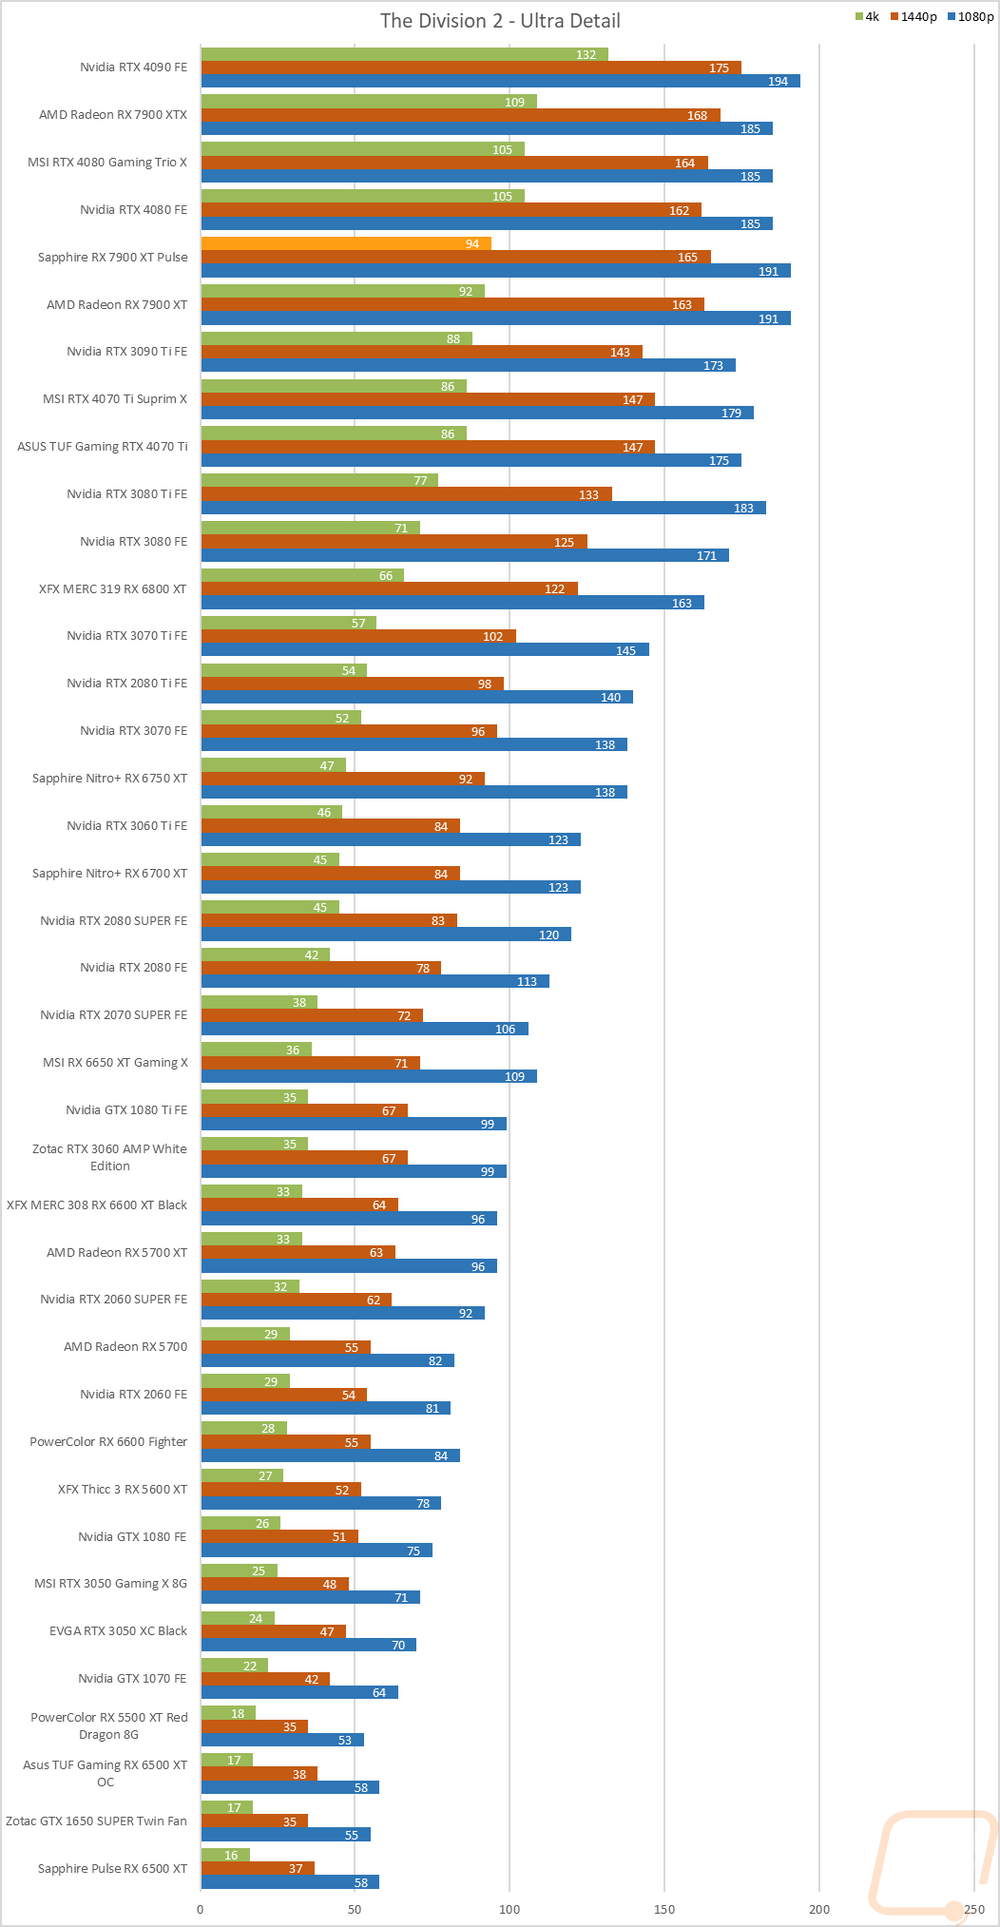
The Division 2 |
Built-in benchmark at Ultra detail with V-Sync turned off at 1080p, 1440p, and 4k resolutions. |
|
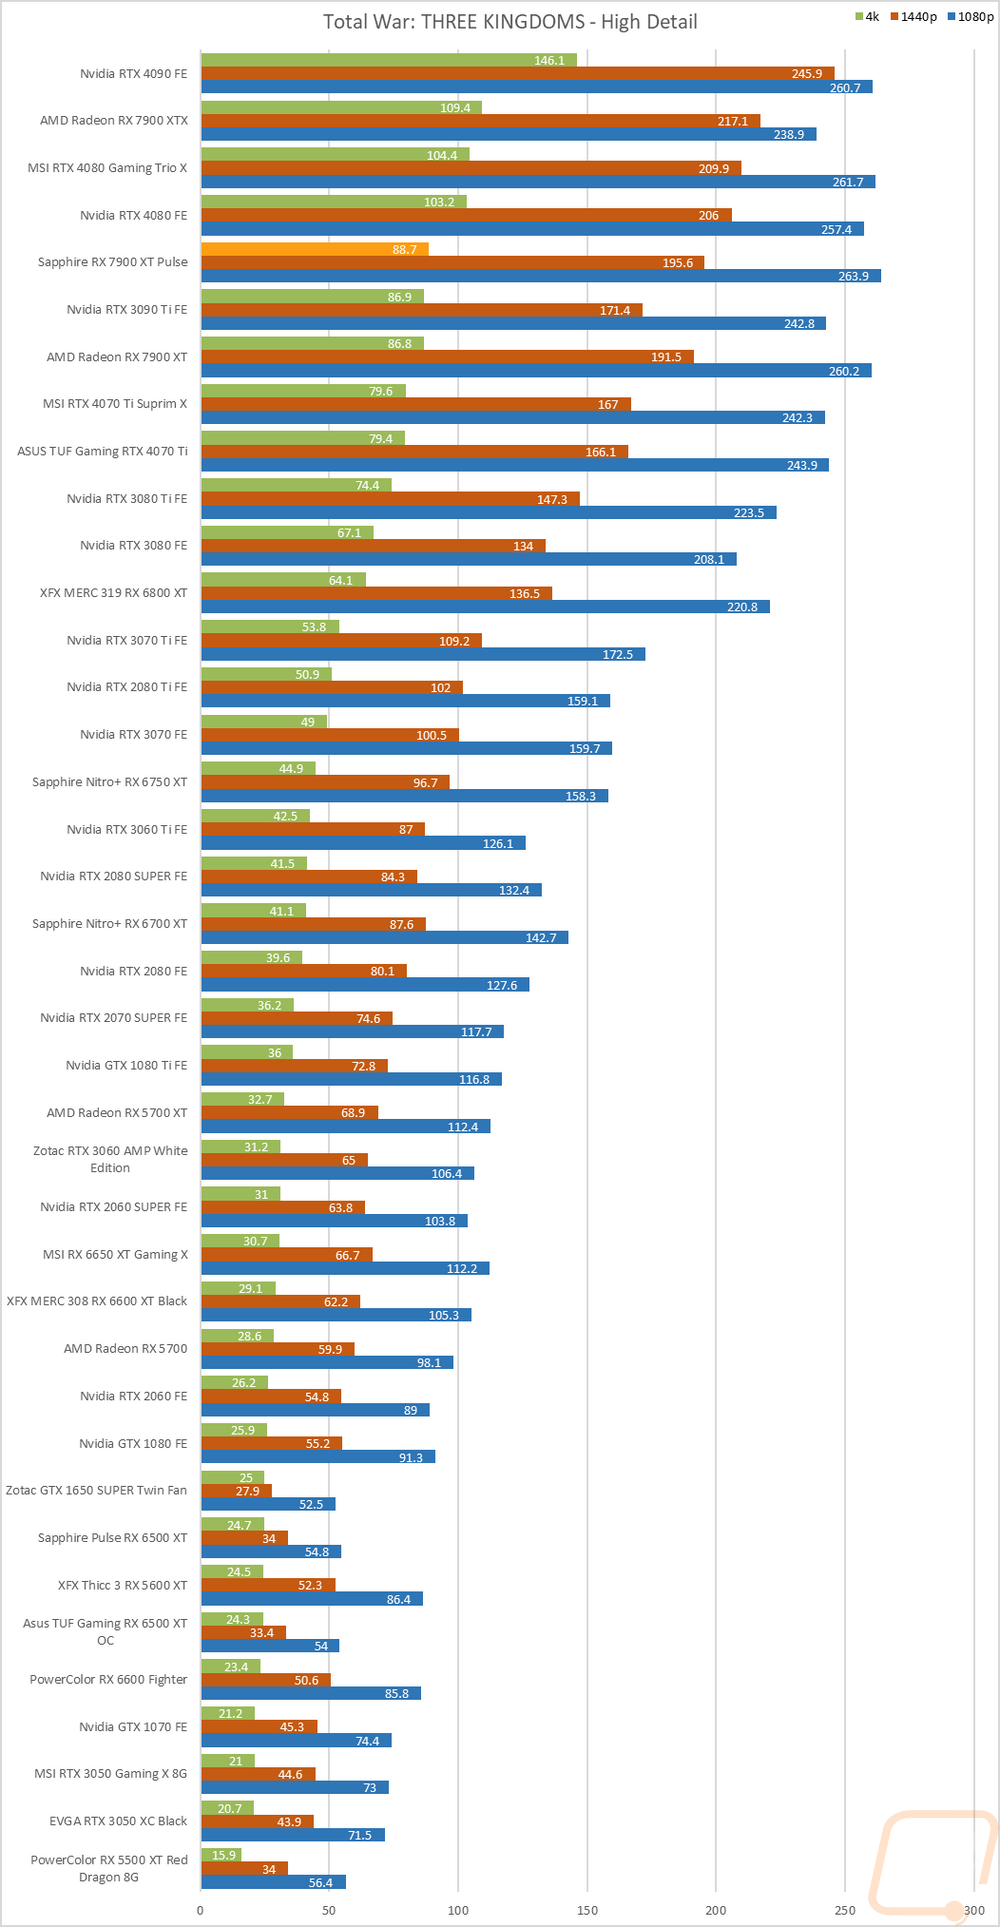
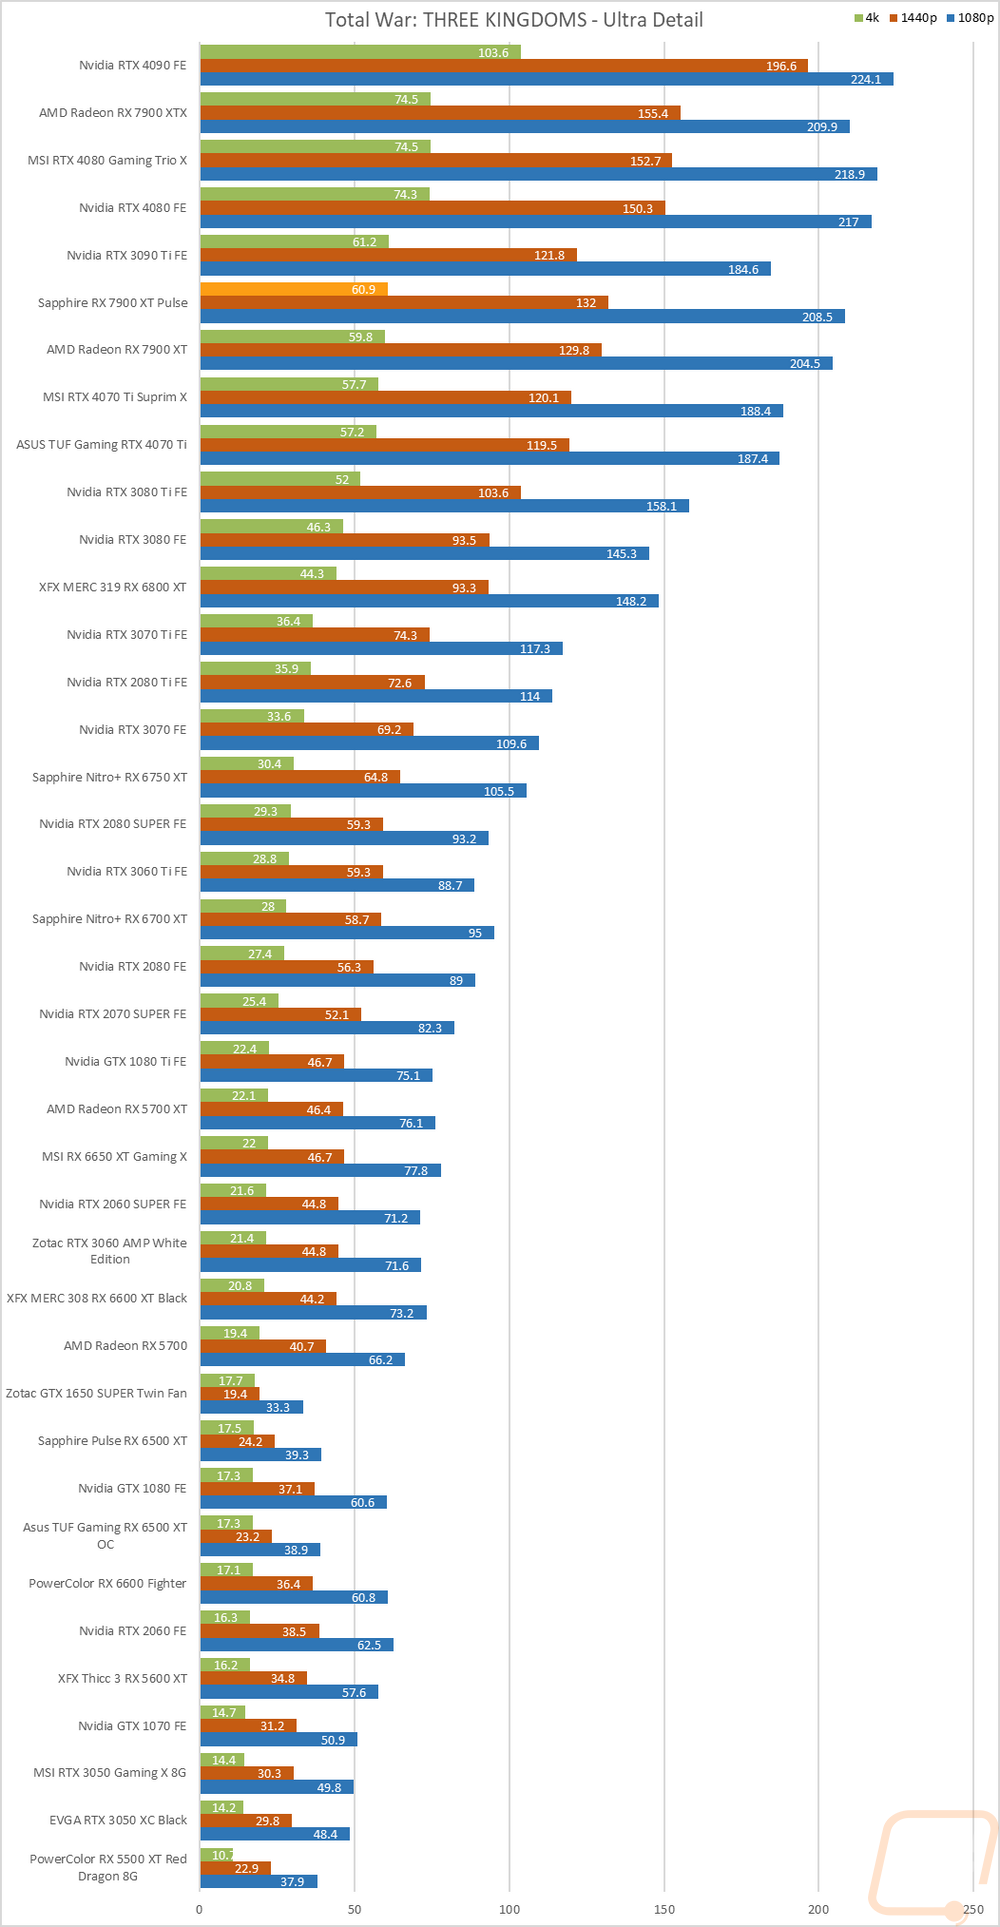
Total War: Three Kingdoms |
Built-in benchmark using the Battle Benchmark setting. Tested at 1080p, 1440p, and 4k at both high and ultra detail settings |
|
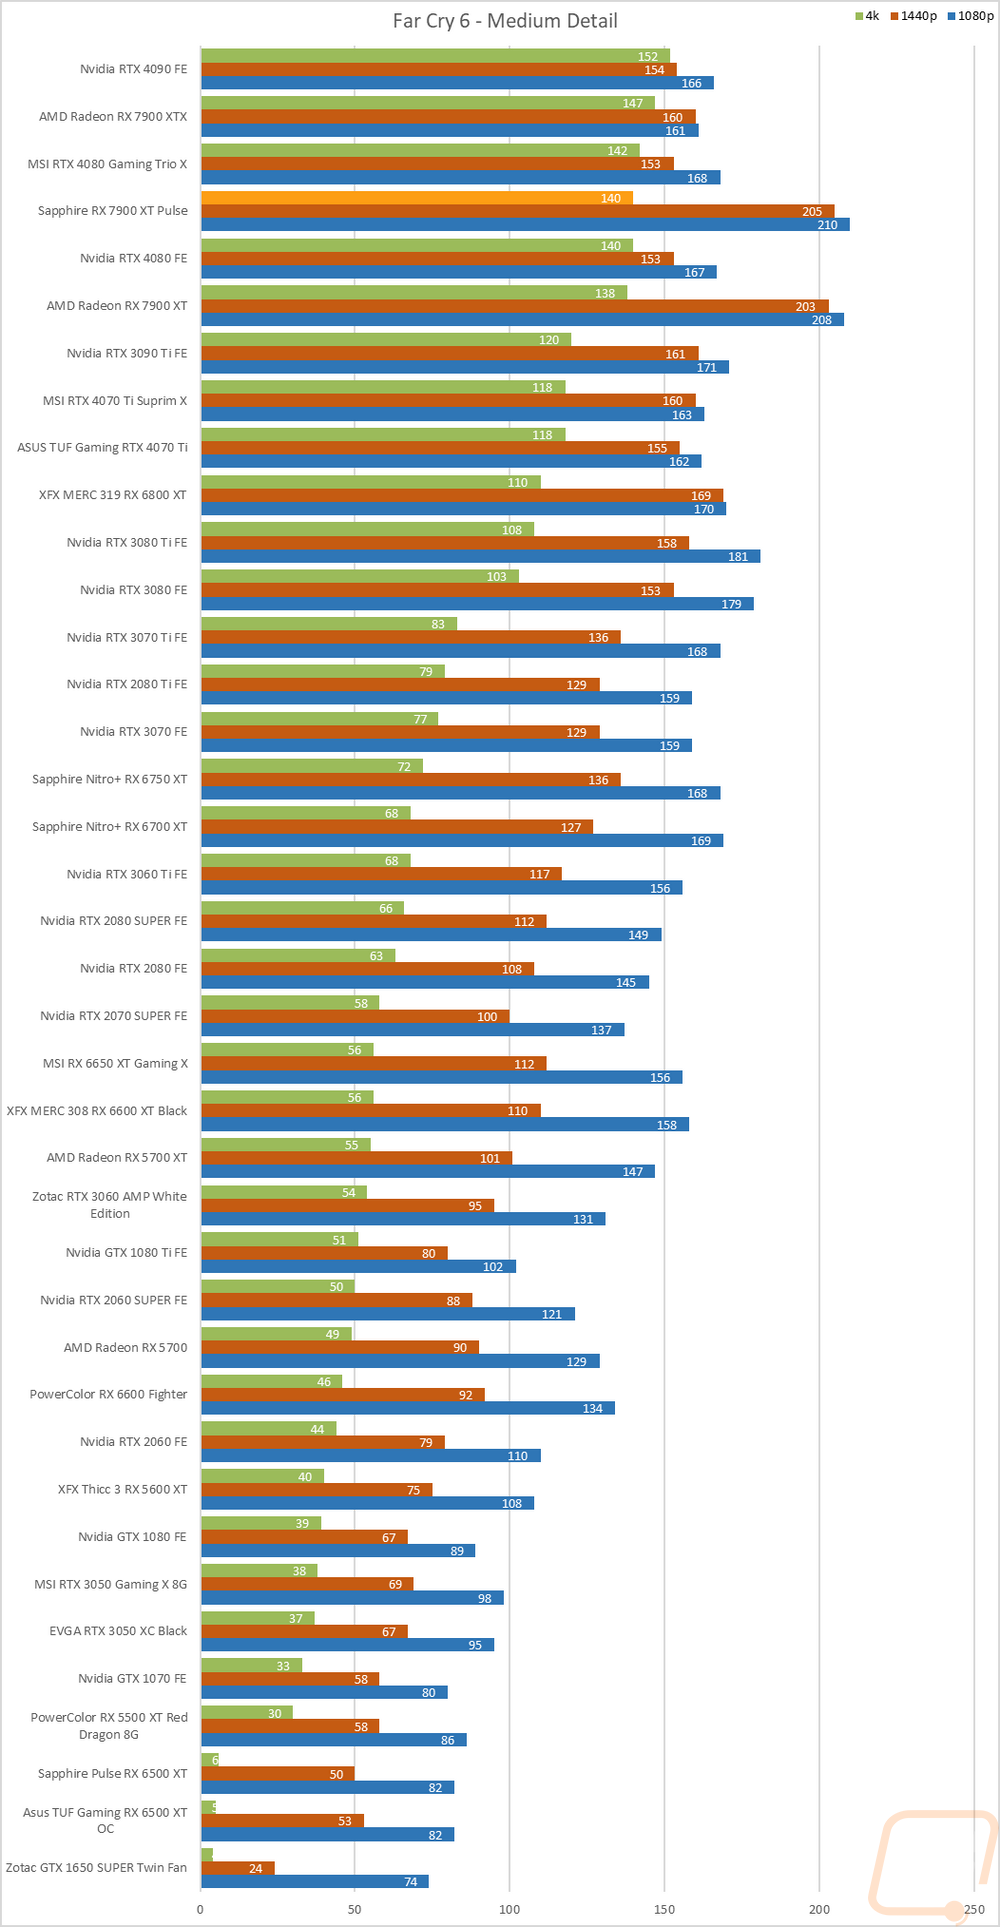
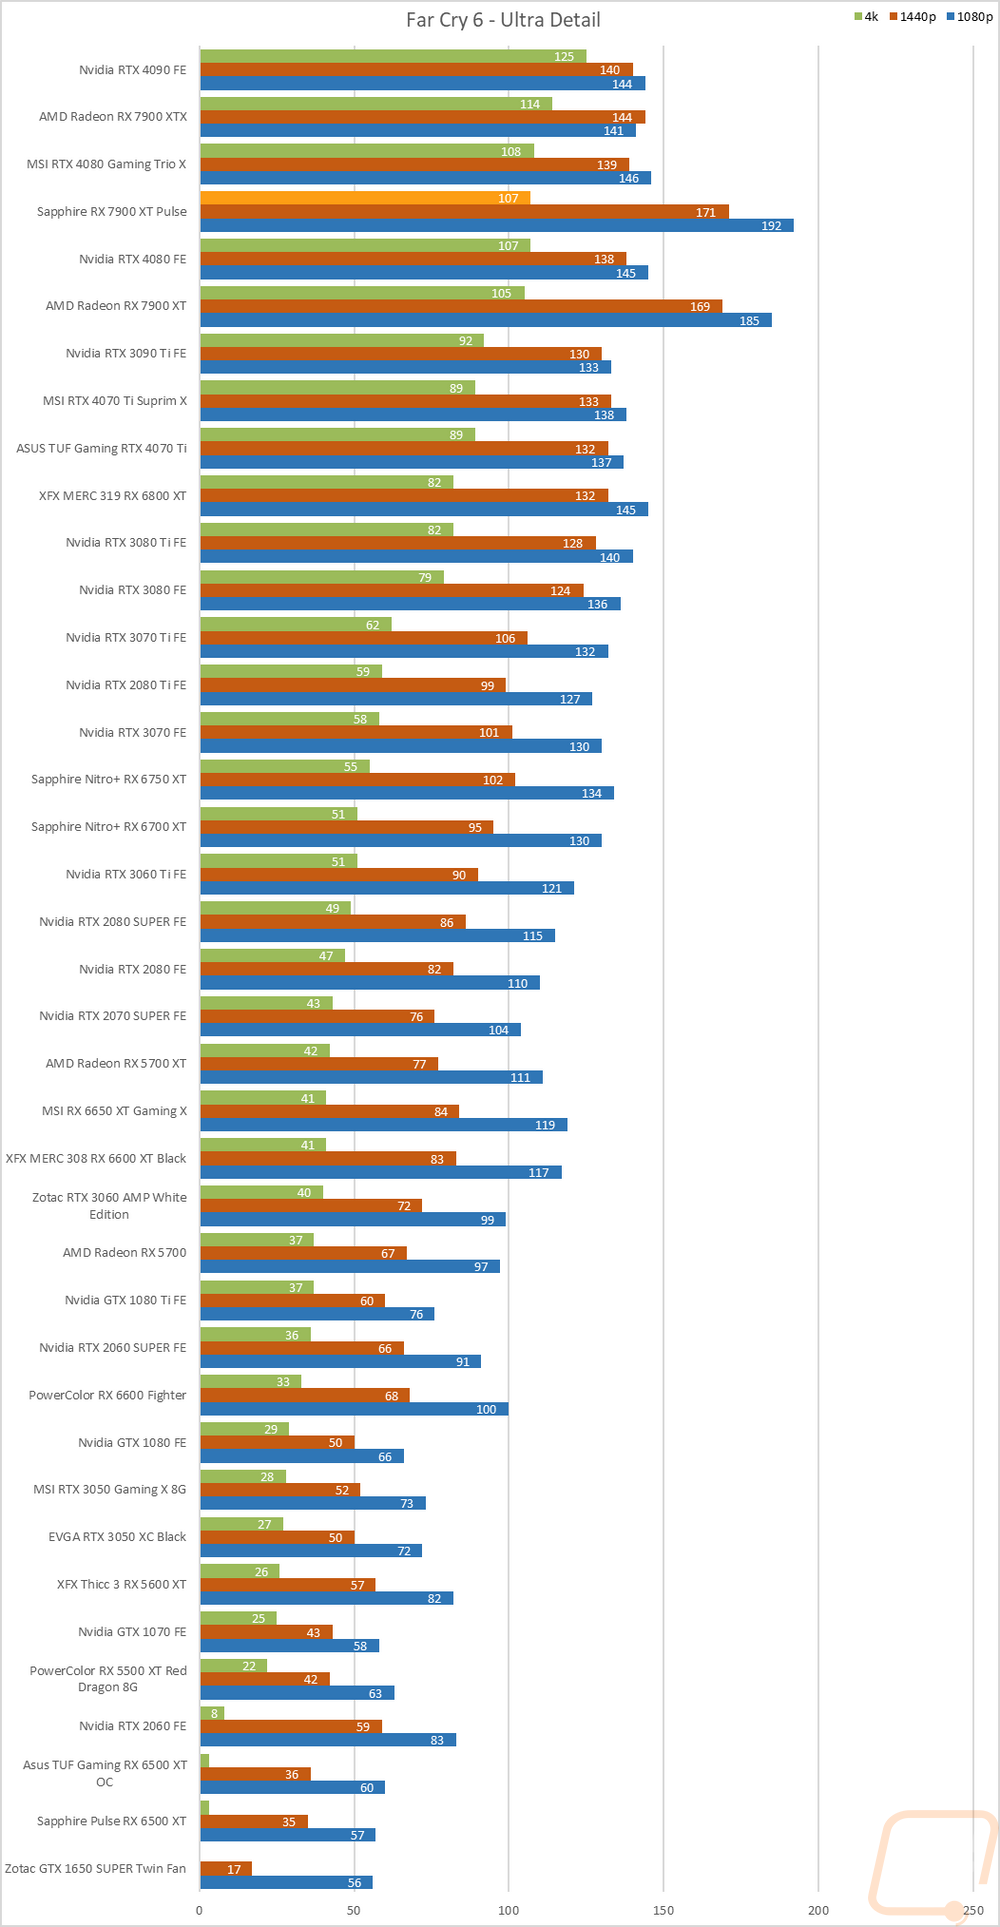
Far Cry 6 |
Built-in benchmark tested at 1080p, 1440p, and 4k with the Ultra and Medium detail settings |
|
V-Ray 5 |
V-Ray 5 benchmark us run with CUDA and RTX settings on cards that support it |
|
Boundary Benchmark |
Testing different DLSS detail levels on cards that support it. All testing is done at 4k with RTX on |
|
Bright Memory Infinite RTX Benchmark |
Benchmark all of the different RTX detail levels. Resolution at 4k and DLSS on balanced for each test |
|
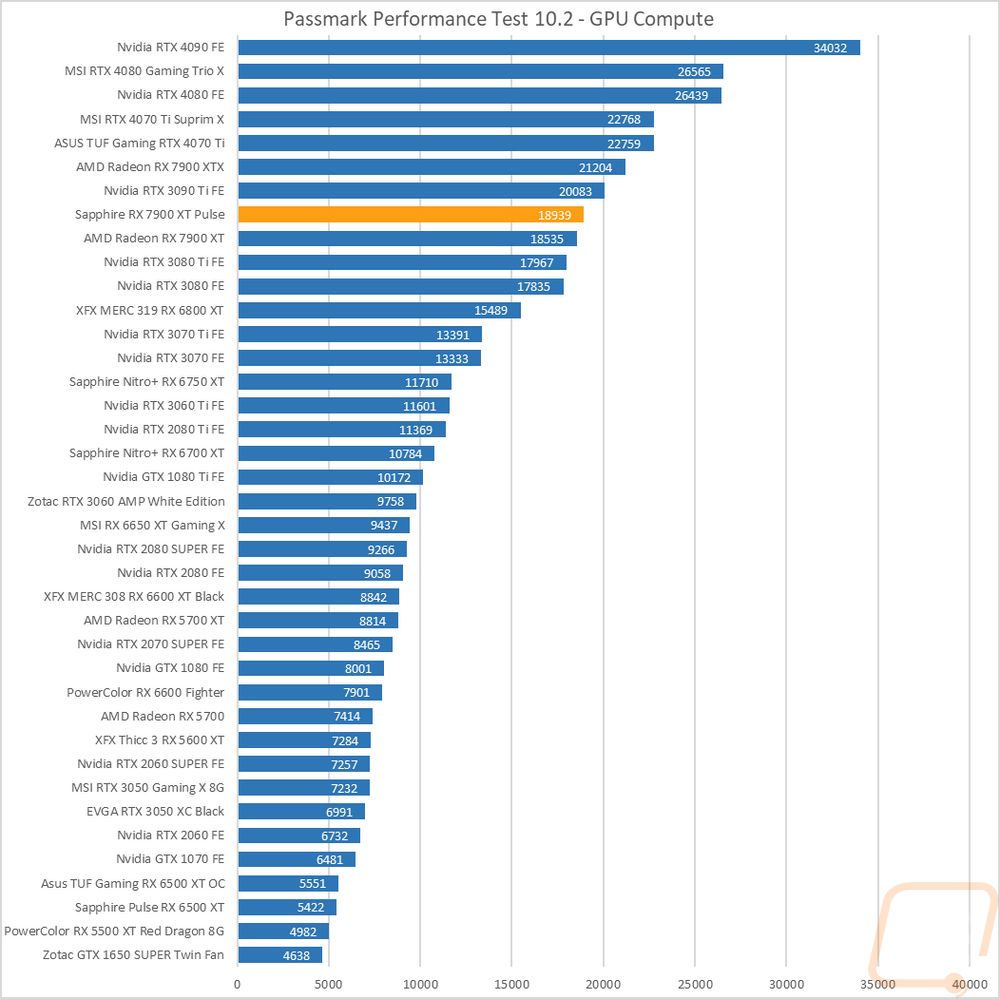
Passmark Performance Test 10.2 |
Test using the GPU Compute Score inside of Passmark’s Performance Test 10.2 |
|
Blender |
Using the standard Blender Benchmark I run the test using the Blender 3.4 setting which tests using the Monster, Junkshop, and Classroom tests. |
|
OctaneBench 2020.1 |
OctaneBench is designed to test rendering in OctaneRender. RTX and non-RTX are both ran. This is a CUDA-only test so only Nvidia cards are tested |
|
Power Testing |
Using a PCat v2 to monitor power between the PCIe slot and the card as well as power through the power cables I test the peak power when running ADIA64, 3DMark Speed Way, 3DMark Time Spy Extreme, FarCry 6 at 4k and Ultra Detail, Watch Dogs Legion at 4K and Ultra detail, and Blender 3.4.0. The results are then averaged as well as the highest result. |
|
Noise Testing |
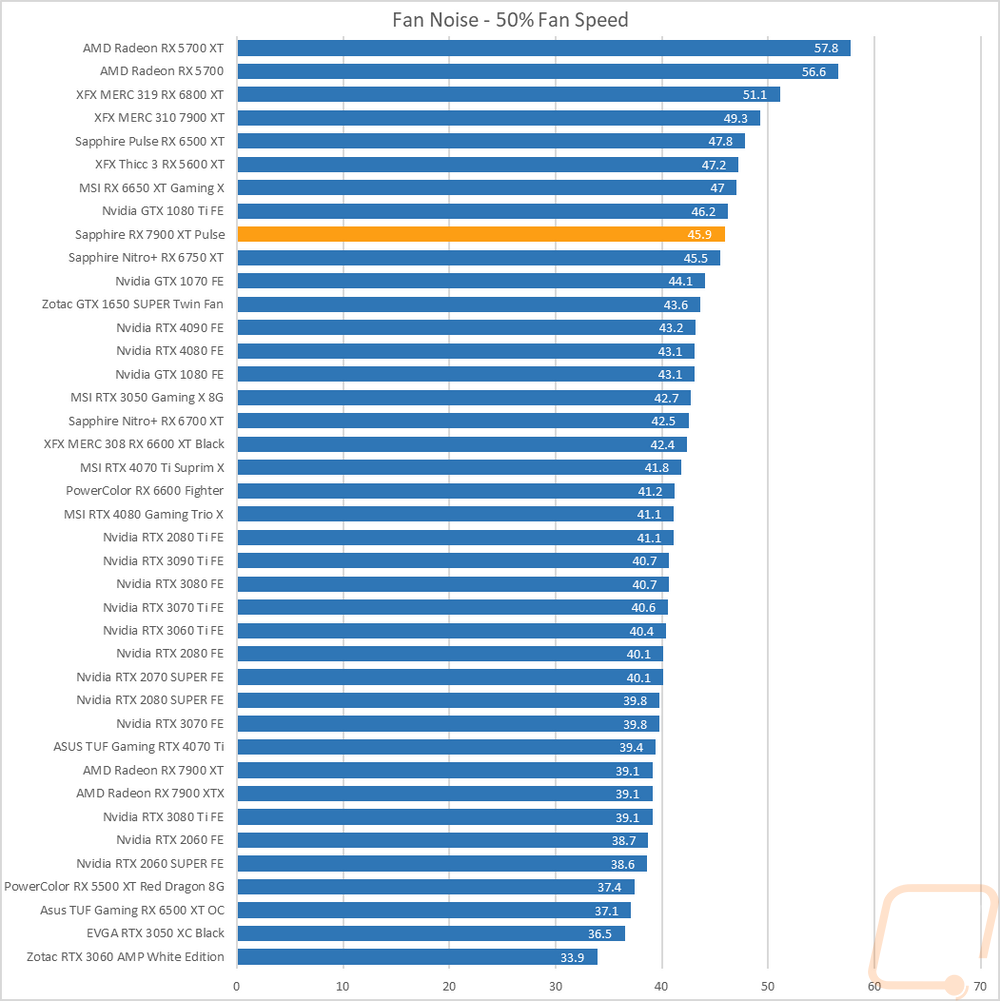
Our Noise testing is done using a decibel meter 18 inches away from the video card on the bottom/fan side of the card. We test at 50% and 100% fan speeds as well as a third test while under load using AIDA64's stress test. This is done using a Protmex PT02 Sound Meter that is rated IEC651 type 2 and ANSI S1.4 type 2. Tests are done set weighted to A and set to a slow response using the max function. The ambient noise level in the testing area is 33.3 decibels. |
|
Temperature Testing |
Using AIDA64, the GPU stress test is run for 30 minutes or until the result has leveled off. The test is run twice, once with the stock fan profile and a second time with 100% fan speed. During this, I also document the 100% fan speed RPM and document the delta between the fan profile and 100% fan speed as well as get thermal images. |
Synthetic Benchmarks
As always I like to start my testing with a few synthetic benchmarks. 3DMark especially is one of my favorites because it is very optimized in both Nvidia and AMD drivers. It's nice to not have to worry about it being favored too much either way and the repeatability of the results makes it a nice chance to compare from card to card, especially when comparing with the same GPU. For the Sapphire 7900 XT Pulse, it does have a small overclock over the stock 7900 XT so I am curious to see how it compares, I also want to keep an eye on how it compares to the 4070 Ti as well which is Nvidia’s direct competition.
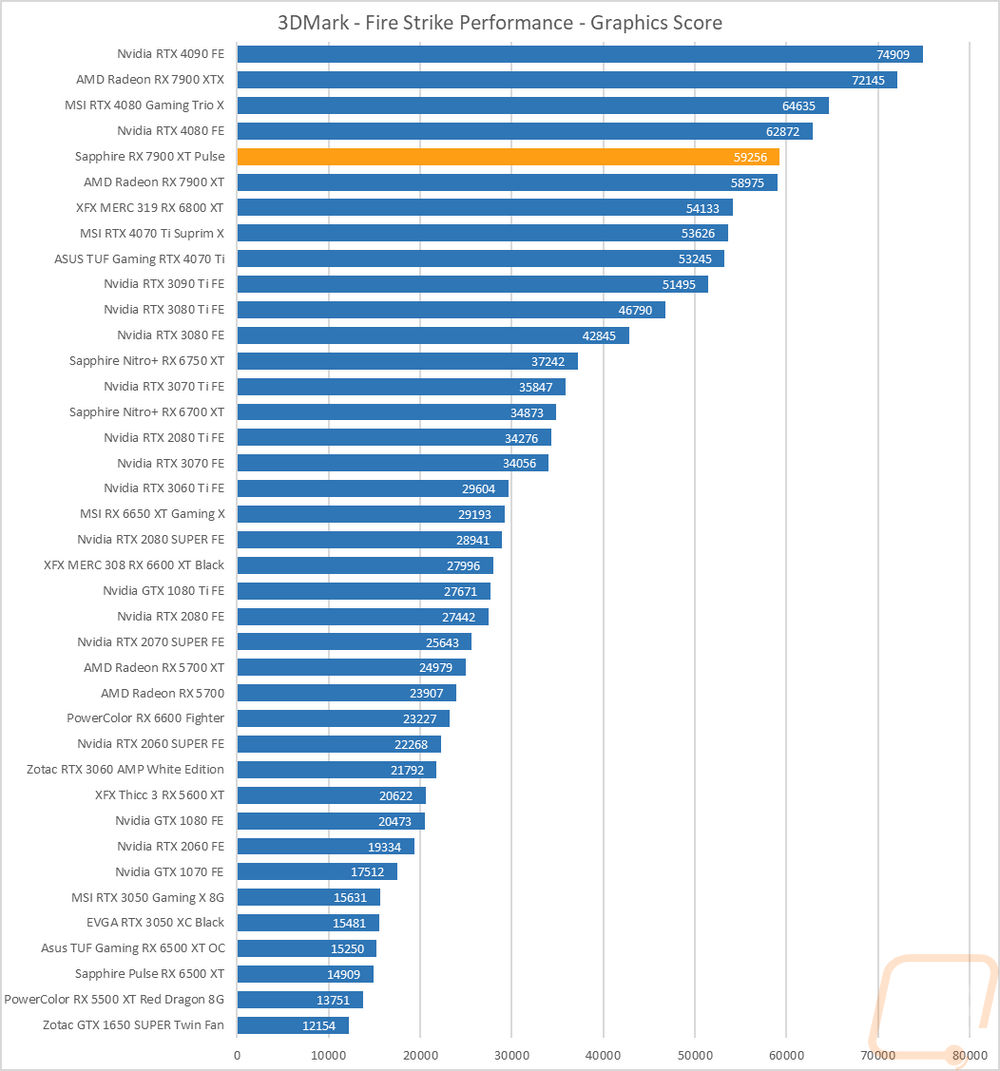
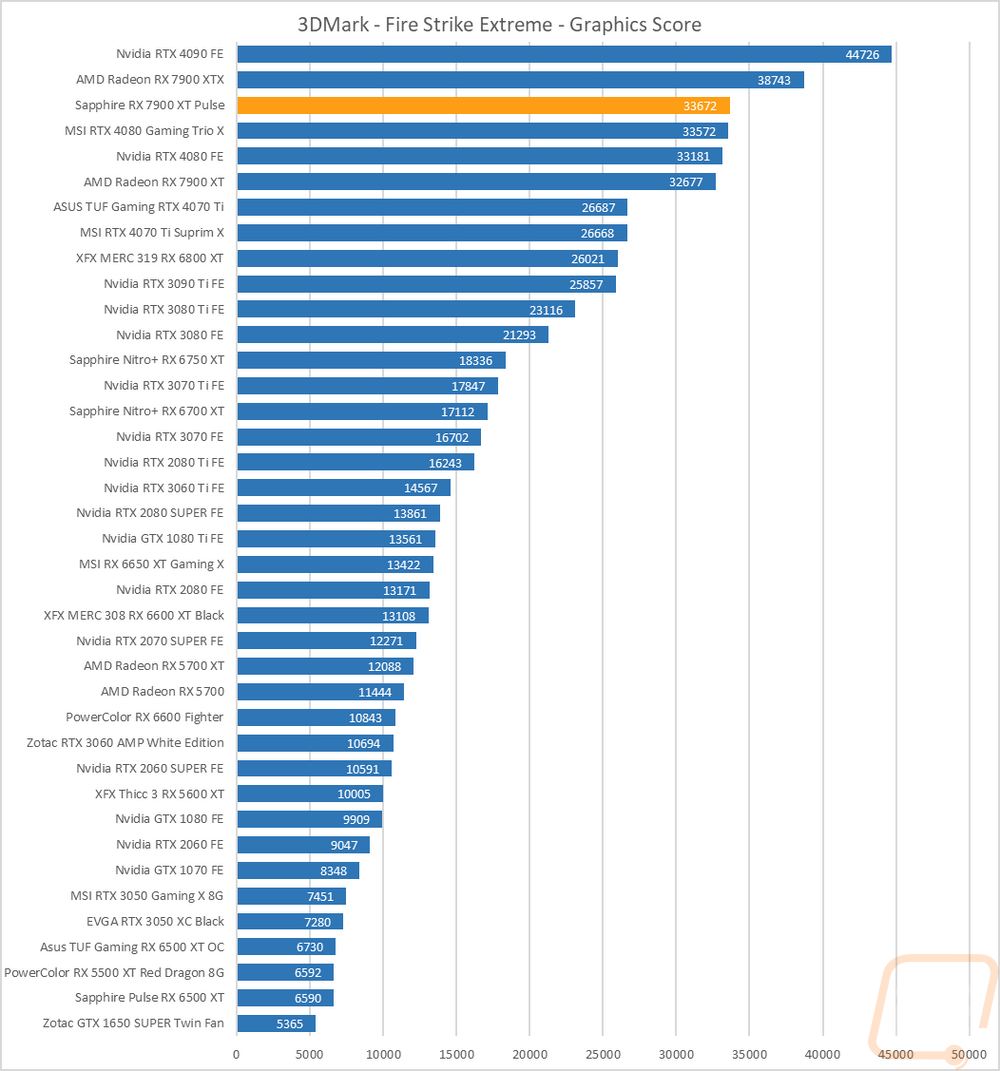
The first round of tests were done in the older Fire Strike benchmark which is a DX11 test. There are three detail levels, performance, extreme, and ultra. The Sapphire 7900 XT is right with the stock 7900 XT in the base Fire Strike benchmark with little gap between the two. The Fire Strike Extreme has more of a performance difference which was enough to push it up just past the RTX 4080. Then in the Fire Strike Ultra test, the Sapphire 7900 XT really stands out compared to the stock 7900 XT and is right with the stock RTX 4080.

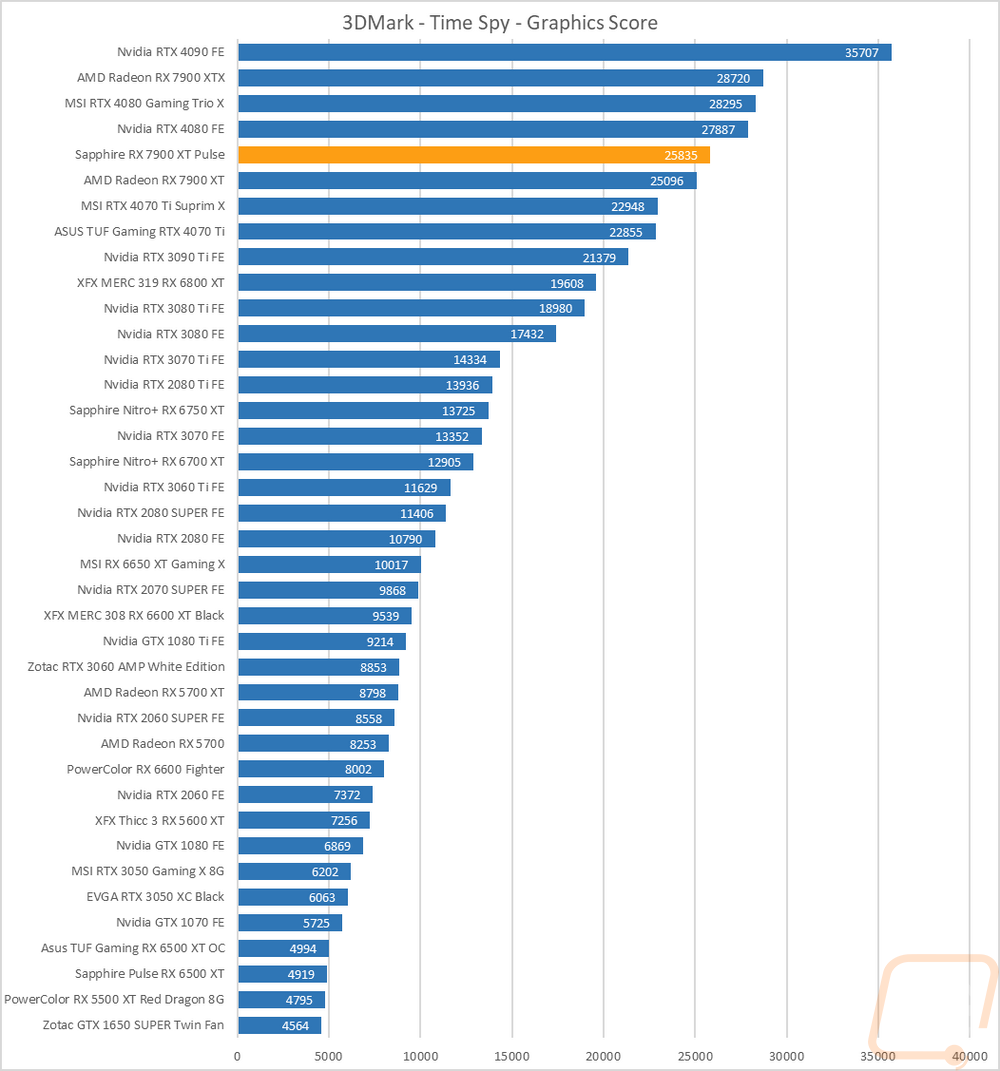
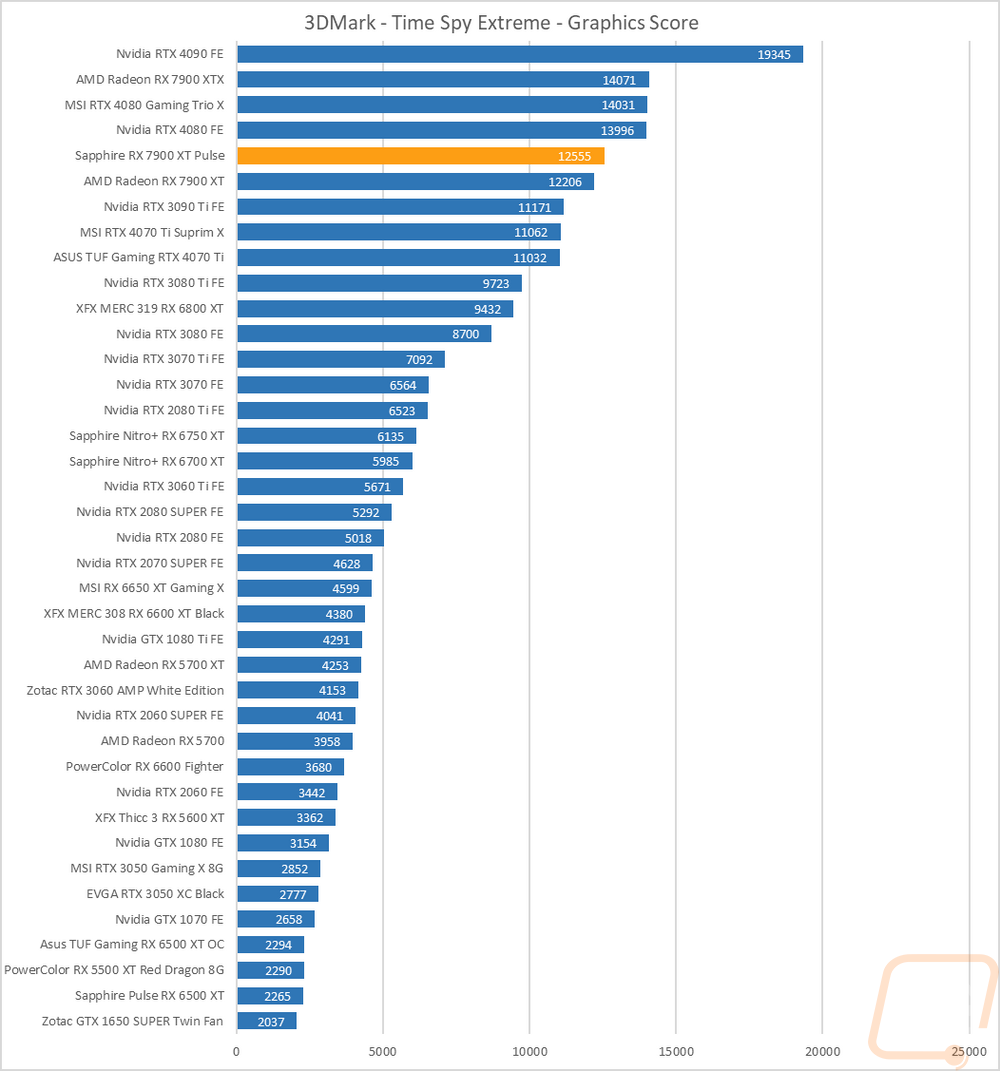
The next two were both based on the Time Spy benchmark. One is the standard test and then there is the extreme detail level. These are DX 12 based and the Sapphire 7900 XT improved on the stock 7900 XT by 2.9% which is about as big of a gap as you would expect to see for an overclock and much more than the overclock itself would do, I would guess that cooling and power profiles are playing a part as well. In Time Spy Extreme the Sapphire 7900 XT is 2.8% out in front of the reference 7900 XT and for both tests, it wasn’t enough to get anywhere near the RTX 4080 which is way out ahead here but it is out in front of the 4070 Ti.
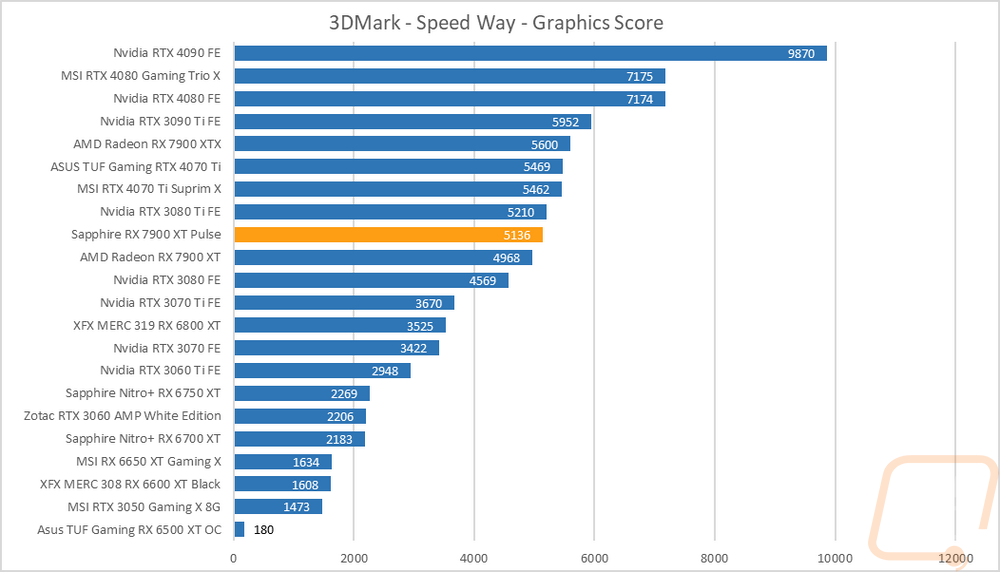
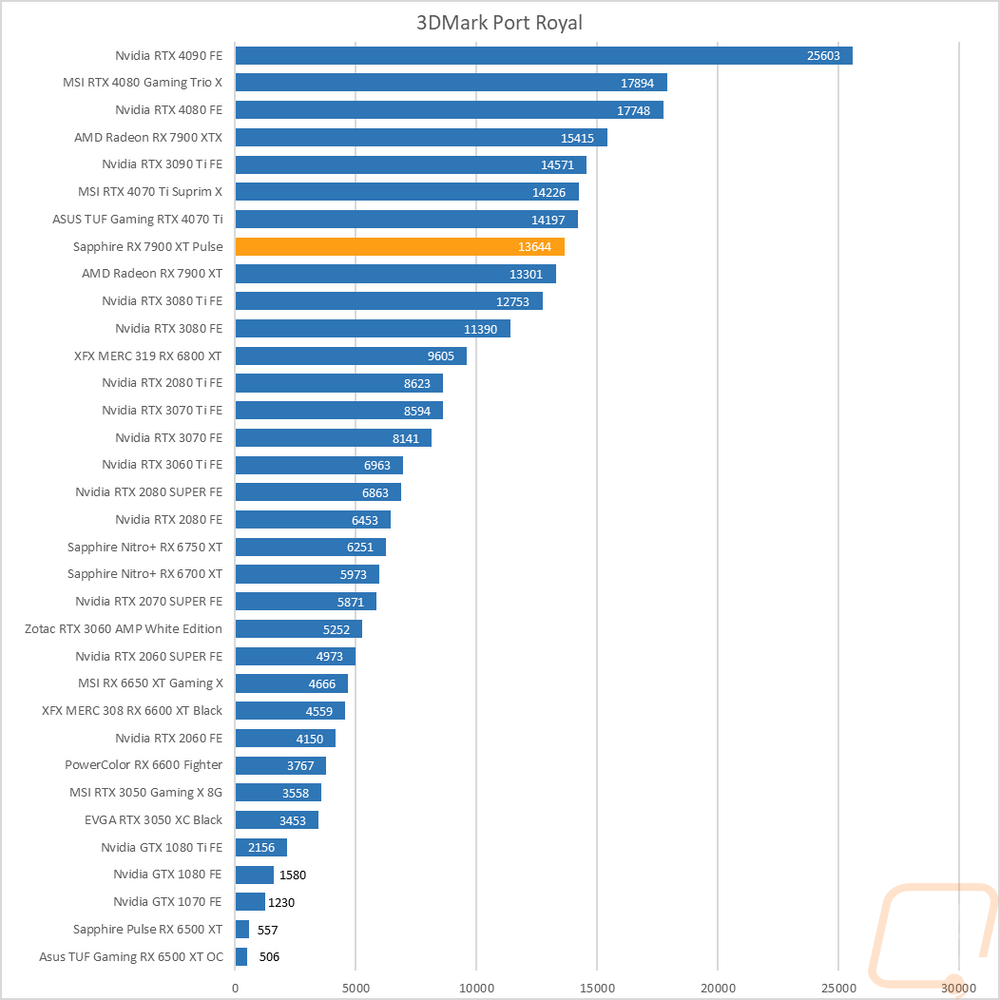
For ray tracing performance, I ran both the 3DMark Port Royal test which is ray tracing focused as well as the new 3DMark Speed Way test which tests all future-looking features including ray tracing. In Speed Way, the Sapphire 7900 XT improved on the reference card by 3.3% which was enough to push it up near the 3080 Ti but still well behind the 4070 Ti which has better RTX performance that helps in this future-looking benchmark. Then in Port Royal, the 7900 XT Pulse is once again behind the 4070 Ti but it did best the stock 7900 XT once again.
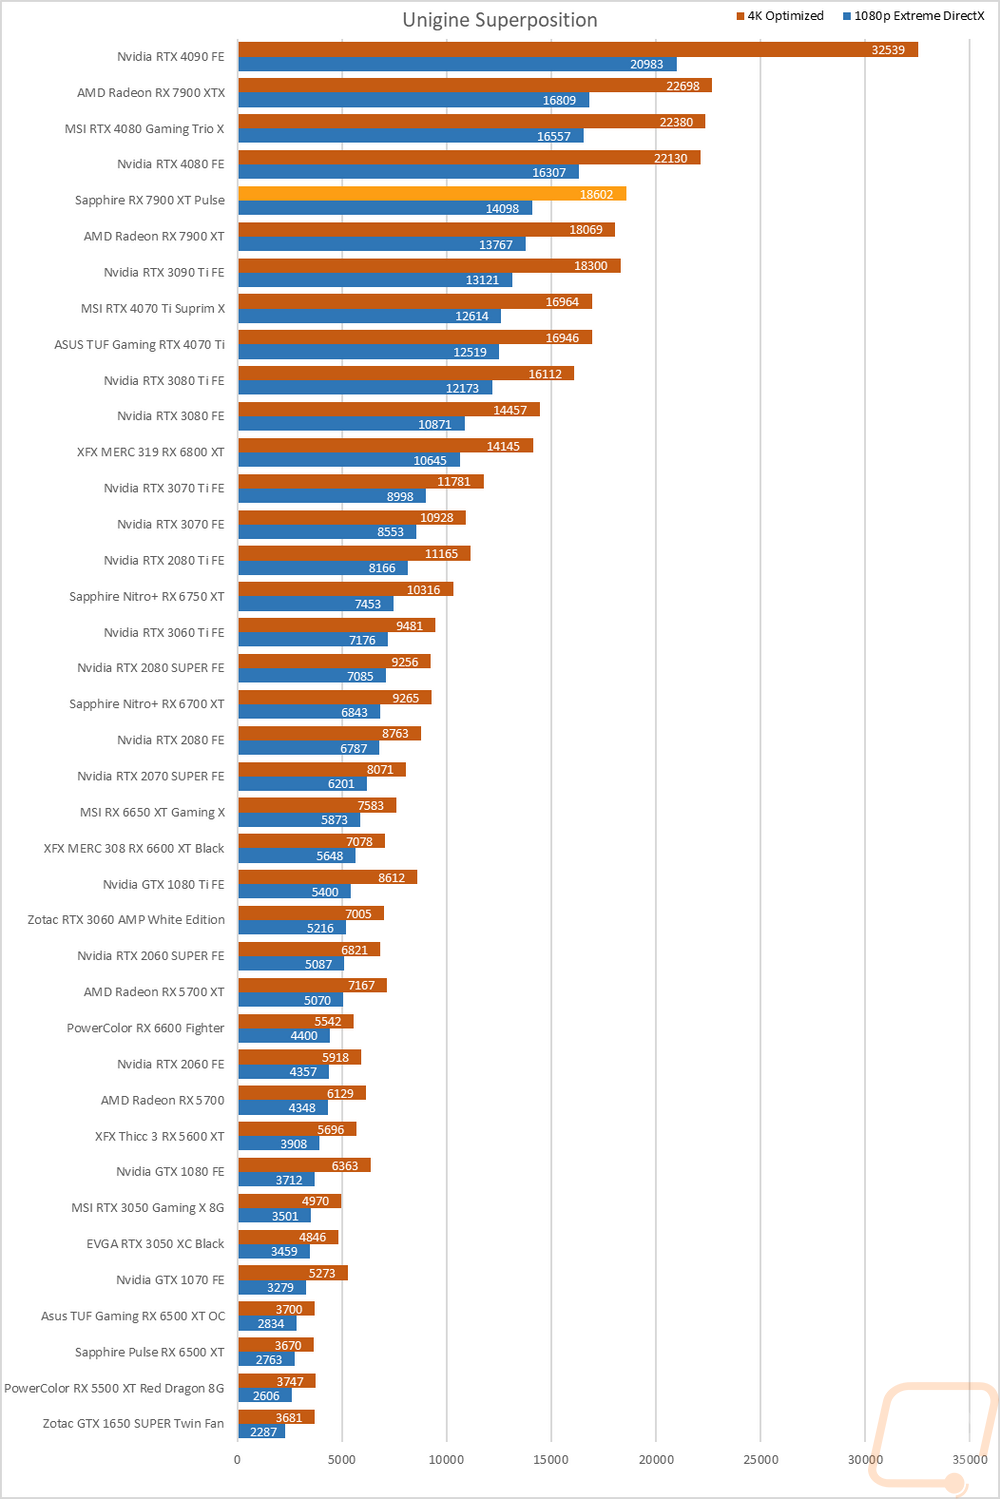
The last test was using the Unigine-based Superposition benchmark and I tested at 1080p with the extreme detail setting as well as the 4K optimized setting. In the extreme detail setting the 7900 XT Pulse improved in performance compared to the reference 7900 XT in both benchmarks. In the 4K test, this was enough to jump out ahead of the 3090 Ti where the 1080p Extreme result is already out in front.
VR Benchmarks
As for Virtual Reality, I love it but it is more demanding than traditional gaming. This is partially because of the resolutions needed to render for two eyes and because they render more than what is immediately visible. But also because of post effects to get the proper “fisheye” effect for it to look proper in your eyes with the HMD. You also have to have much higher expectations for frame rates in VR, skipping frames or lower FPS can cause motion sickness in VR. Because of that, I ran a few tests.
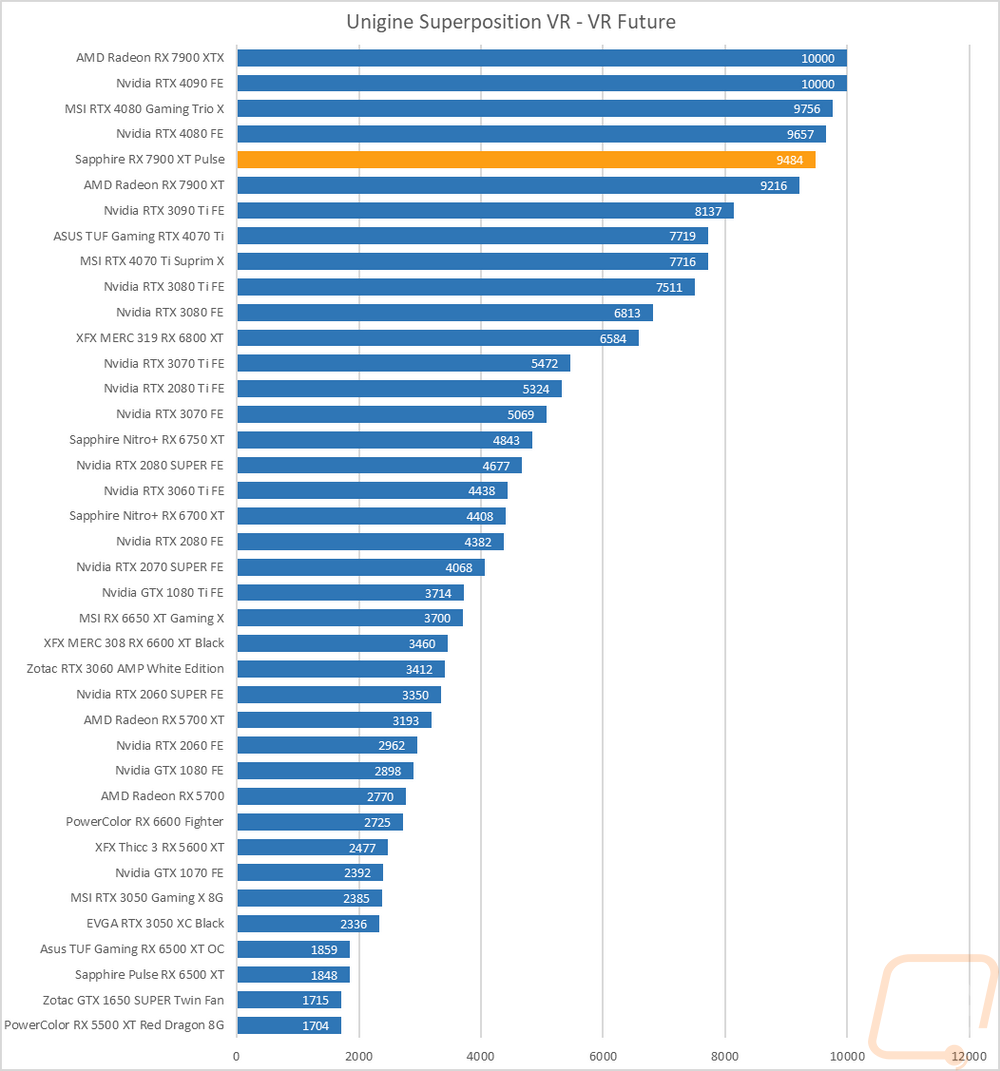
My first test was again in Superposition. This time I tested the VR Future test using the Oculus resolution. Here the 7900 XT Pulse improved on the reference performance by 2.9% and edged it up closer to the range of the RTX 4080.
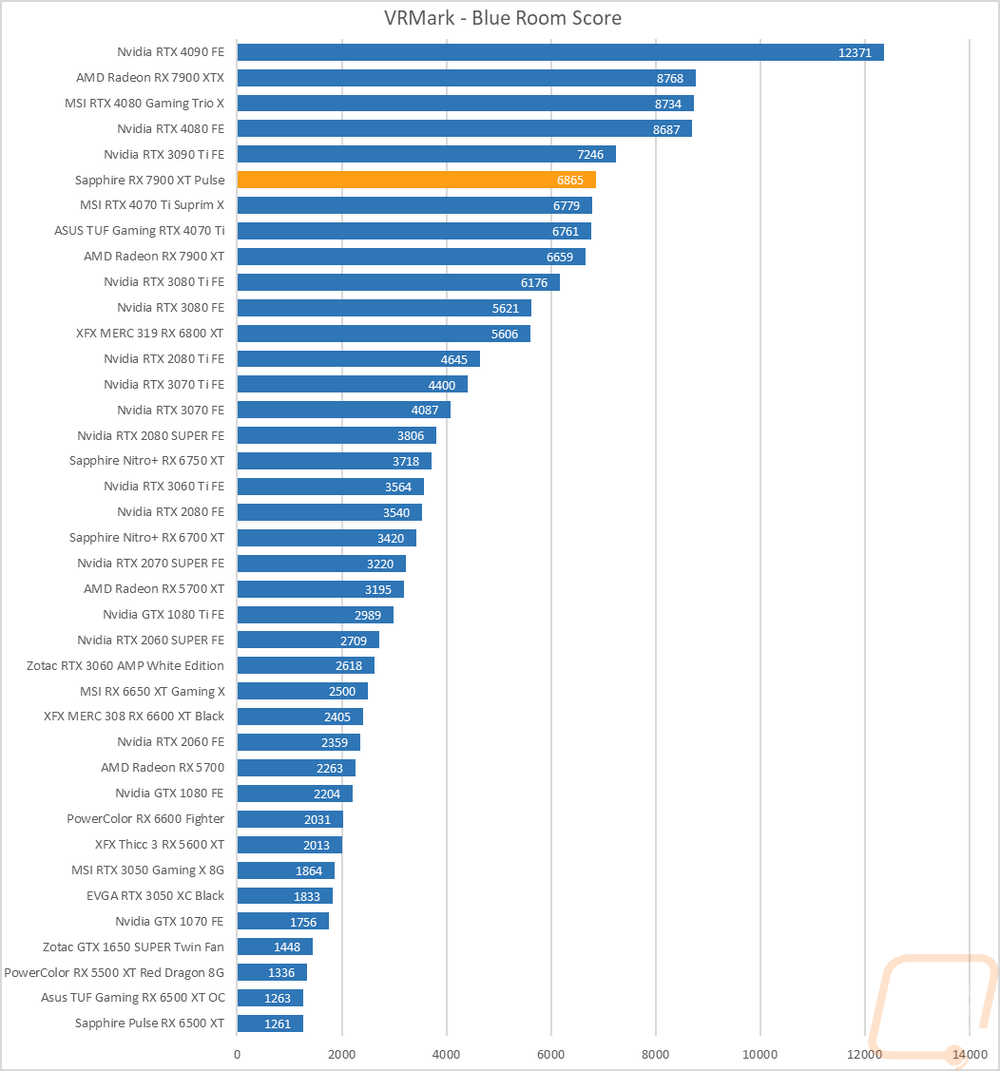
My second round of VR testing was in VRMark which has three tests that are similar to the VR tests in Superposition. I only focused on just the most demanding test called Blue Room which is looking more at future VR performance. The 7900 XT Pulse edged out in front of both RTX 4070 Ti’s in this test with its overclock.
In-Game Benchmarks
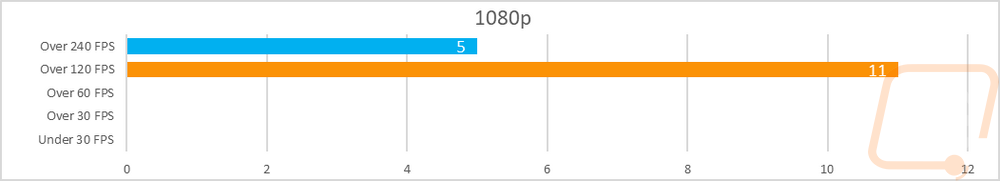
Now we finally get into the in game performance and that is the main reason people pick up a new video card. To test things out I ran through our new benchmark suite that tests 10 games at three different resolutions (1080p, 1440p, and 4k). Most of the games tested have been run at the highest detail setting and a mid-range detail setting to get a look at how turning things up hurts performance and to give an idea of if turning detail down from max will be beneficial for frame rates. In total, each video card is tested 54 times and that makes for a huge mess of results when you put them all together. To help with that I like to start with these overall playability graphs that take all of the results and give an easier-to-read result. I have one for each of the three resolutions and each is broken up into four FPS ranges. Under 30 FPS is considered unplayable, over 30 is playable but not ideal, over 60 is the sweet spot, and then over 120 FPS is for high refresh rate monitors.
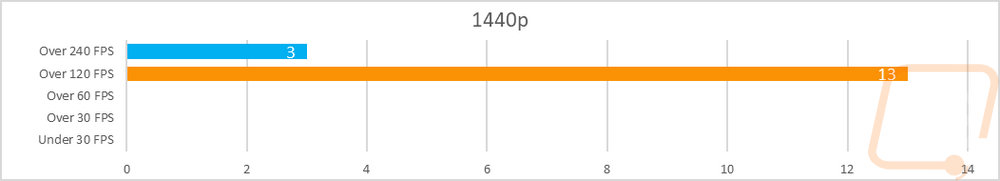
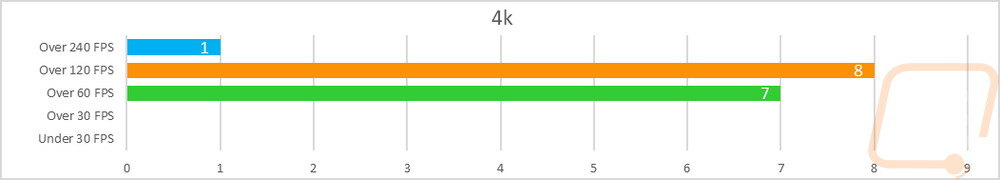
So how did the 7900 XT Pulse do? Like with the reference 7900 XT, at 1080p there wasn’t a test that the 7900 XT Pulse struggled with. In fact, the addition of the 240+ FPS range here helps show that even more with 5 out of the 16 tests are up over 240 FPS and the other 11 were over 120 FPS making this a great card for those looking for 1080p high refresh rate gaming. The same goes for 1440p as well with everything up over 120 FPS once again and three results were over 240 FPS once again. It isn’t until we get into 4k testing that the 7900 XT Pulse shows anything under 120 FPS and even then everything was up over 60 FPS with 7 results in the 60-119 FPS range and 8 over 120 FPS. Of course, CS:GO was still up over 240 as well. In other words, everything tested is going to be smooth and it just depends on if you are aiming for higher refresh rates.
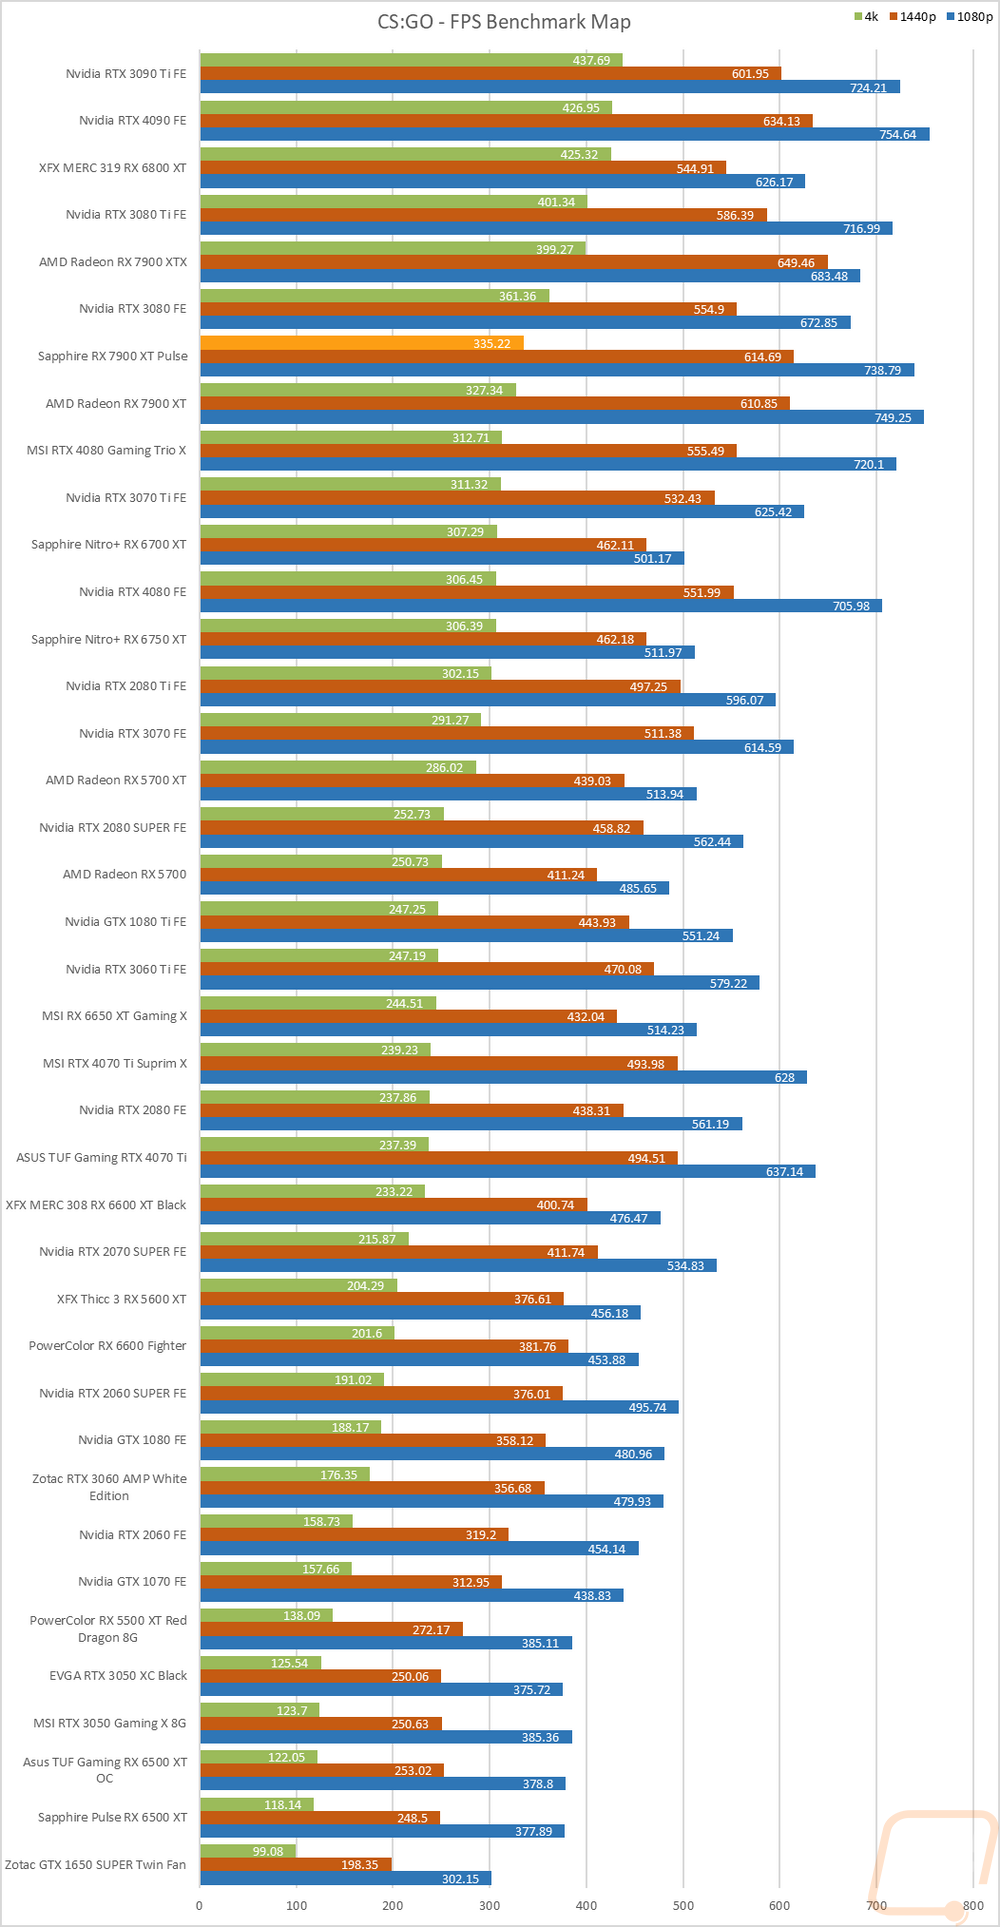
Of course, I have all of the actual in game results as well for anyone who wants to sort through the wall of graphs below. With the top end of the graph being CPU limited at 1080p and sometimes 1440p all of the results are sorted by 4K. The 7900 XT Pulse stayed out in front of the 4070 Ti, often by a good margin in 15 out of the 16 games tested. In fact, it was staying closer to the RTX 4080 and in a few games came out ahead there. At 4k I did also compare the performance between the reference 7900 XT and Sapphires 7900 XT Pulse. When including the CS:GO results which are always much higher and sometimes mess things up the Pulse averaged 131 FPS to the reference cards 128 which is a 2.3% improvement. Taking CS:GO out the Pulse averaged 118 to the reference cards 115 which was a 2.6% improvement, both being a great performance jump for such a small overclock.
Compute Benchmarks
Now some people don’t need a video card for gaming, they need the processing power for rendering or 2D/3D production, or in some cases people who game also do work on the side. So it is also important to check out the compute performance on all of the video cards that come in. That includes doing a few different tests. My first test was a simple GPU Compute benchmark using Passmark’s Performance Test 10 and the 7900 XT Pulse improved on the 18535 score of the reference 7900 XT by 2.1% with its 18939 score. This wasn’t enough to catch up to the 3090 Ti, however.
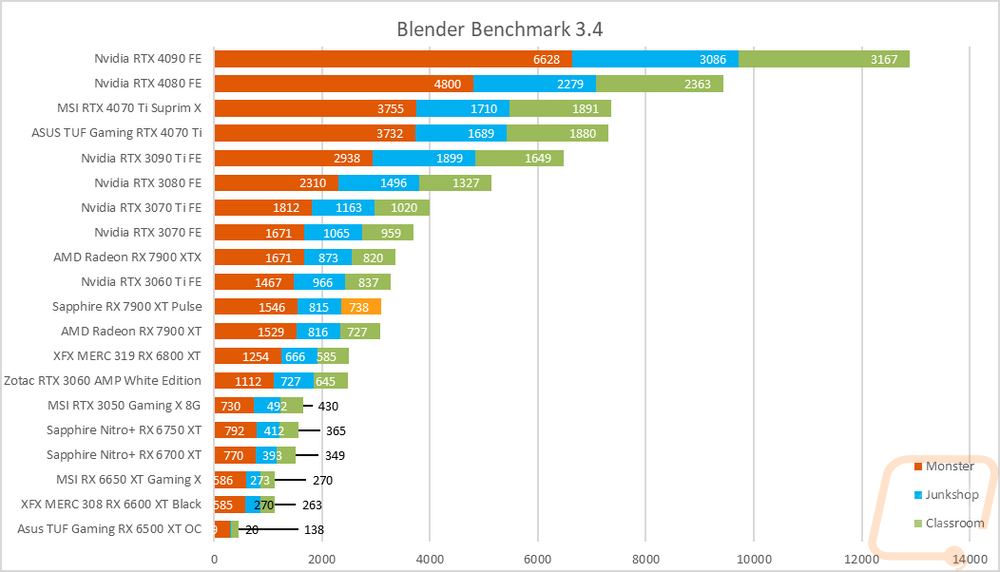
Blender is always my favorite compute benchmark because the open-source 3D rendering software is very popular and it isn’t a synthetic benchmark. With the latest version of Blender, they redid the benchmark so we now have a new test that runs three different renderings and gives each a score. I have all three stacked together so we can see the overall performance. The 7900 XT Pulse is right with the reference 7900 XT with both not doing well and sitting behind the 3060 Ti in this test.
Cooling Noise and Power
For my last few tests, rather than focusing on in game performance, I like to check out other aspects of video card performance. These are also the most important ways to differentiate the performance between cards that have the same GPU. To start things off I took a look at power usage.
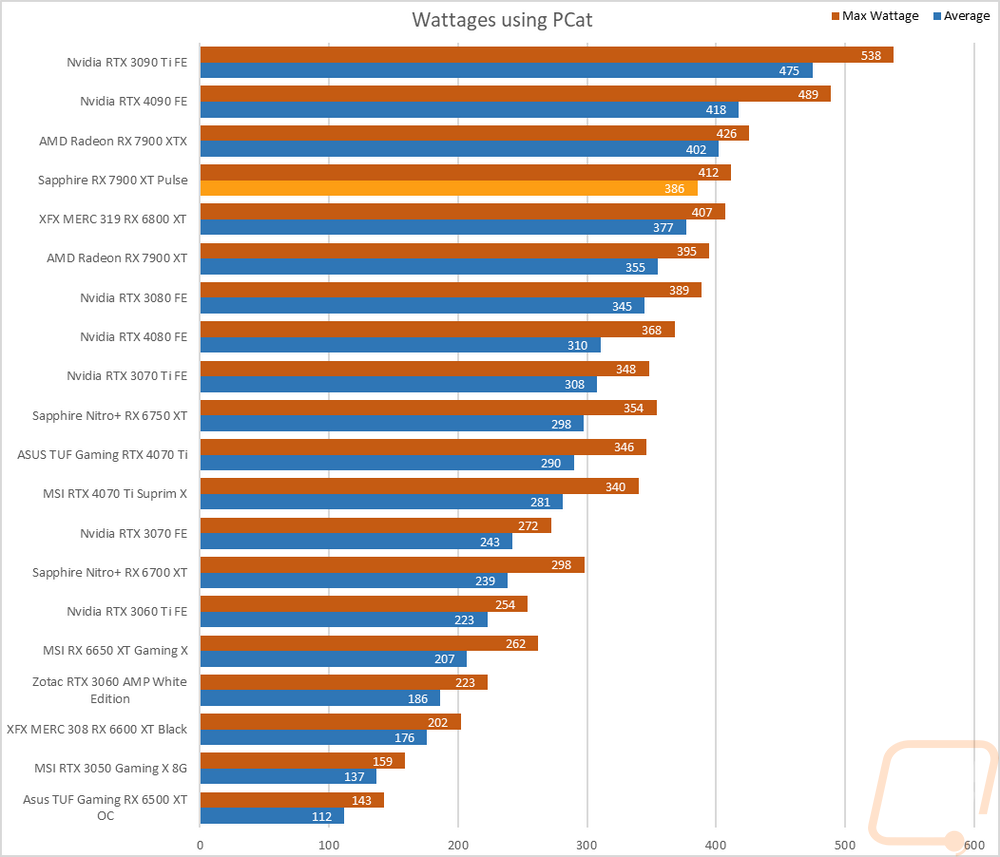
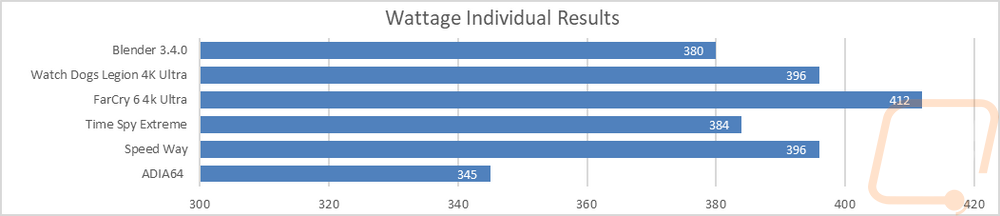
For this, our new test setup utilizes the Nvidia-designed PCat v2 along with cables to handle both traditional 6 or 8-pin connections as well as the new 12VHPWR. The PCat also utilizes a PCIe adapter to measure any power going to the card through the PCIe slot so we can measure the video card wattage exclusively, not the entire system as we have done in the past. I test with a mix of applications to get both in game, synthetic benchmarks, and other workloads like Blender and AIDA64. Then everything is averaged together for our result. I also have the individual results for this specific card and I document the peak wattage result as well which is almost always Time Spy Extreme. After seeing the performance improvement that the 7900 XT Pulse was able to do with a small overclock over the reference 7900 XT I wasn’t surprised to see the power draw go up. It averaged 386 watts across the tests to the reference cards 355 watts and its peak wattage was 412 to 395 on the reference card. This jumped it up over the overclocked 6800 XT and put it a lot closer to the 7900 XTX.
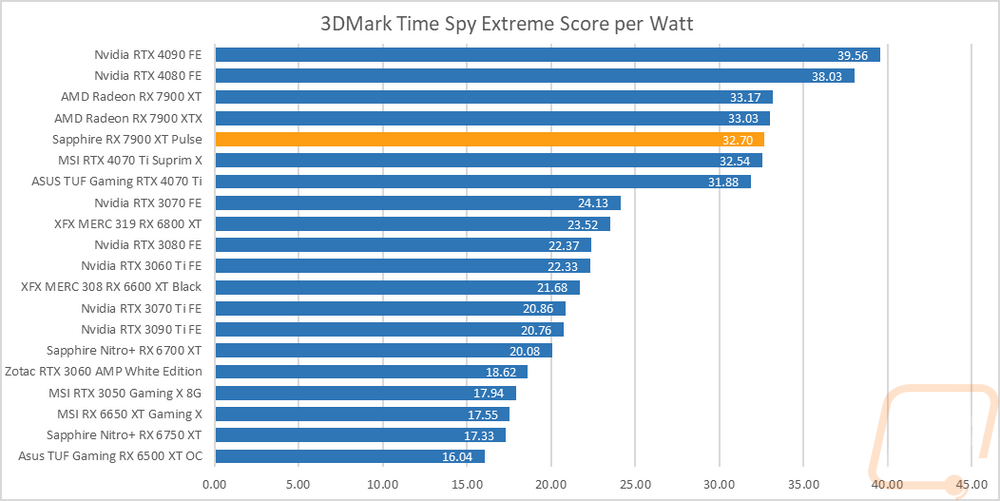
With having exact peak wattage numbers when running Time Spy Extreme I was also able to put together a graph showing the total score for each watt that a card draws which gives us an interesting look at overall power efficiency in the popular and demanding benchmark. With the increased power usage, the 7900 XT Pulse ended up with a score per watt of 32.7 which was lower than the stock 7900 XT and the 7900 XTX as well, no surprise there. This just tells us that while faster, because of the power the Pulse isn’t as efficient as the stock clocked card.
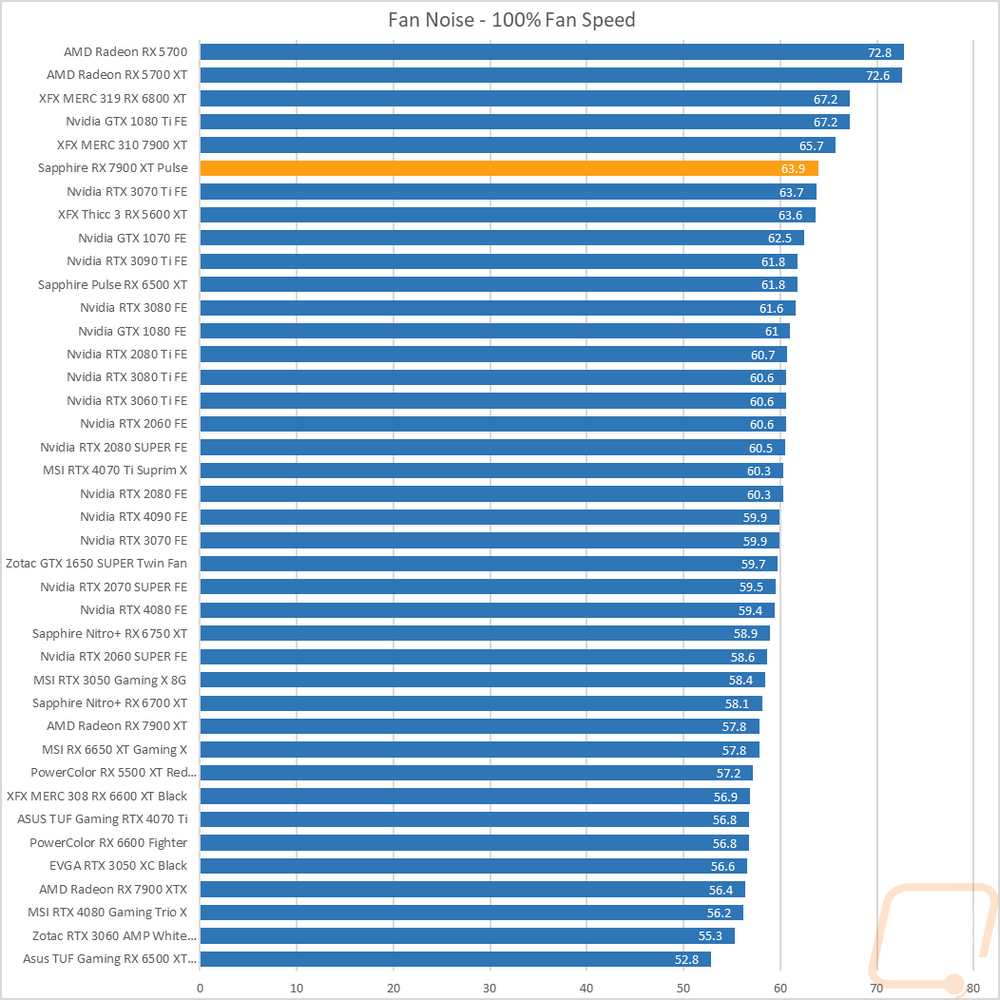
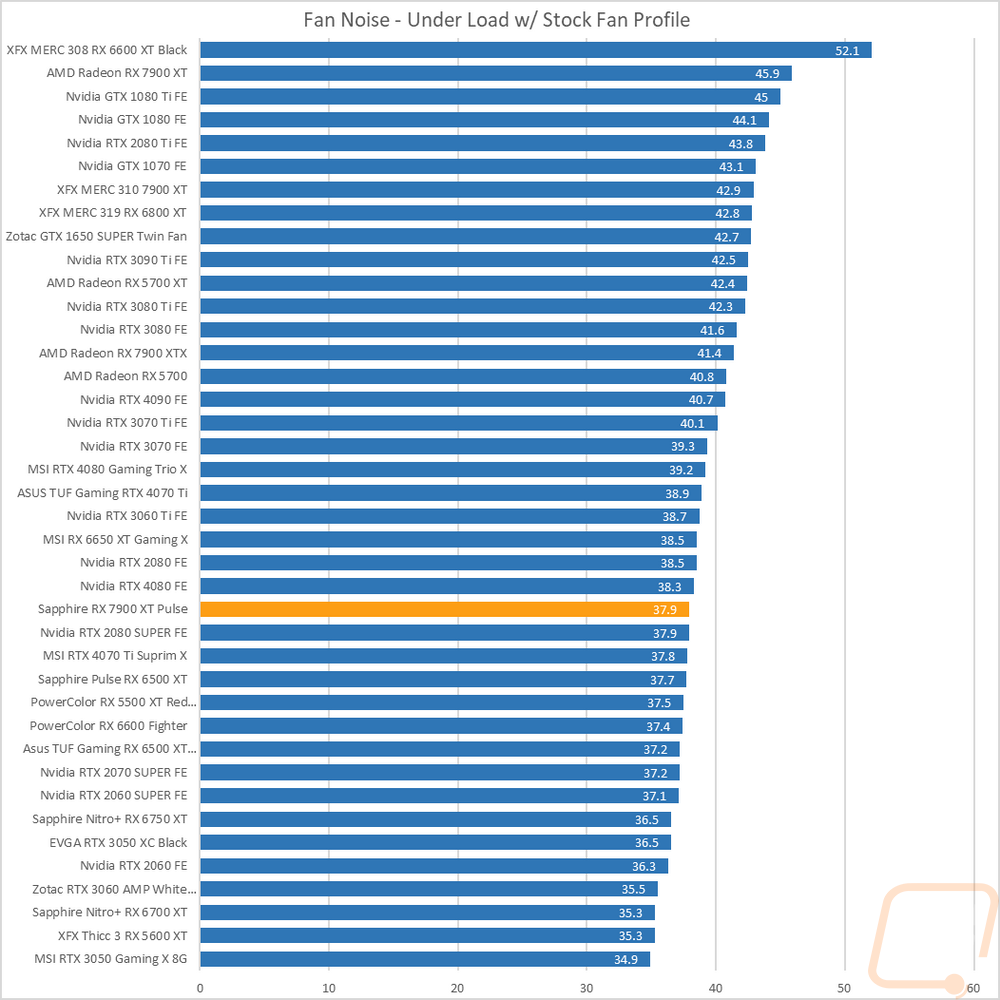
My next round of tests were looking at noise levels. These are especially important to me because I can’t stand to listen to my PC whirling. Especially when I’m not in game and other applications are using the GPU. For my testing, though I first tested with the fan cranked up to 100% to get an idea of how loud it can get, then again at 50% to get an idea of its range. The 7900 XT Pulse came in at 45.9 decibels at 50% and 63.9 at 100%. The 100% fan speed put it way up in the chart but not ahead of the XFX 7900 XT. The 50% performance was better but still up in the top 1/3 of the chart. I also take a look at noise performance while under load. For that when running AIDA64’s stress test I wait until the temperature of the card has leveled off and then measure how loud things are when the card is at its worst-case scenario with the stock fan profile. Here the Sapphire 7900 XT Pulse did great running at just 37.9 decibels. This was a full 8 decibels lower than the reference card and 5 decibels lower than the XFX design as well.
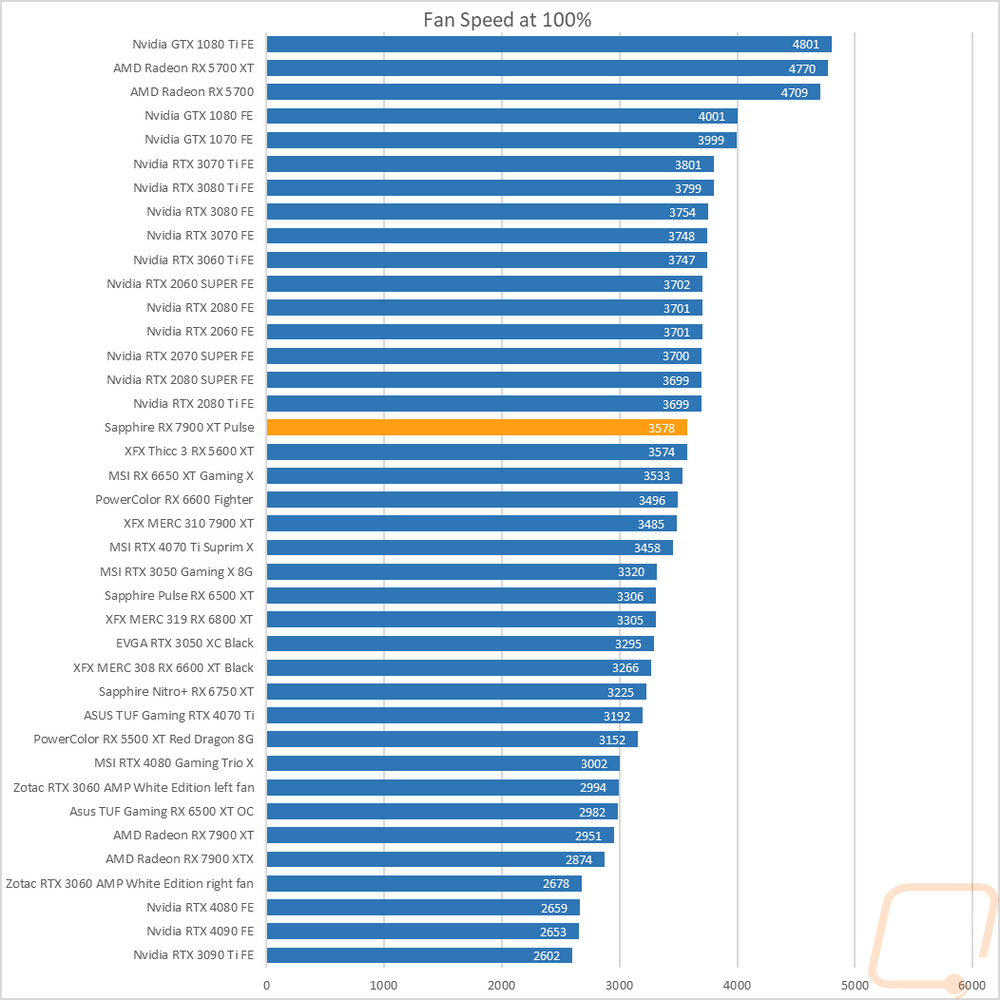
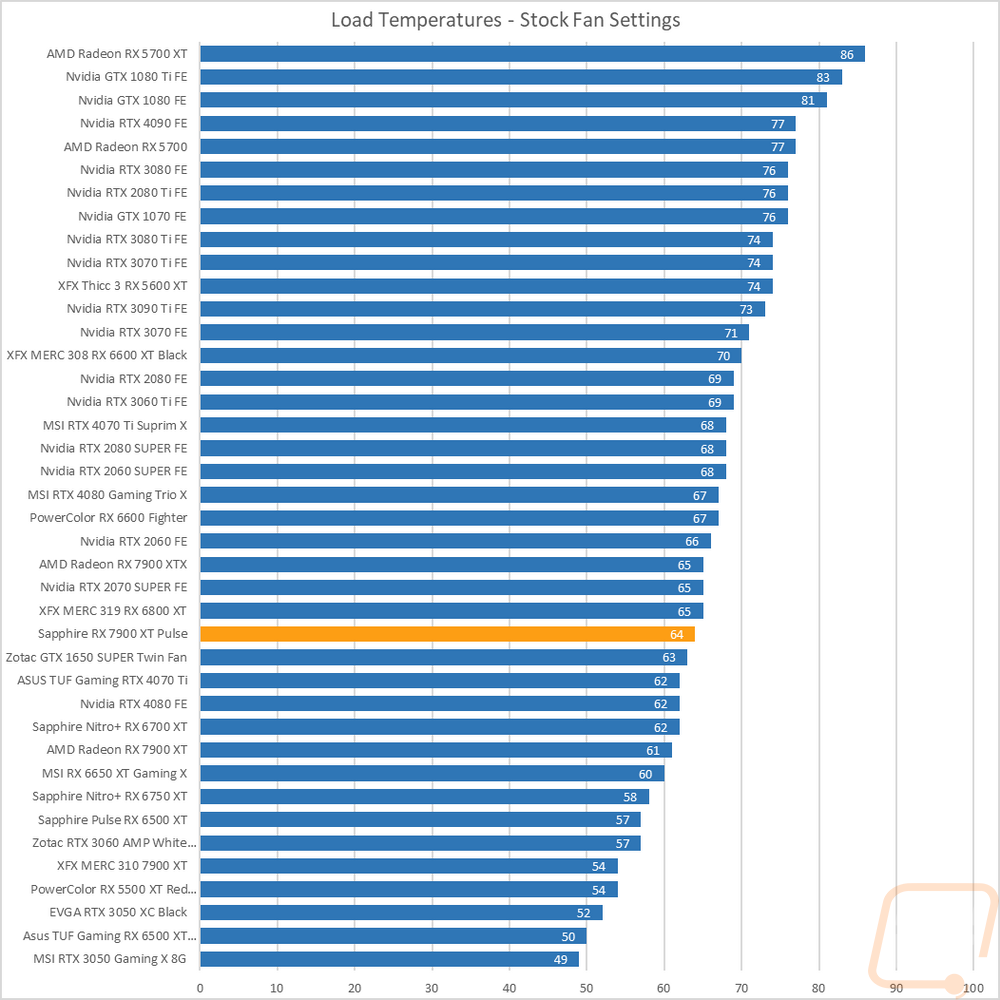
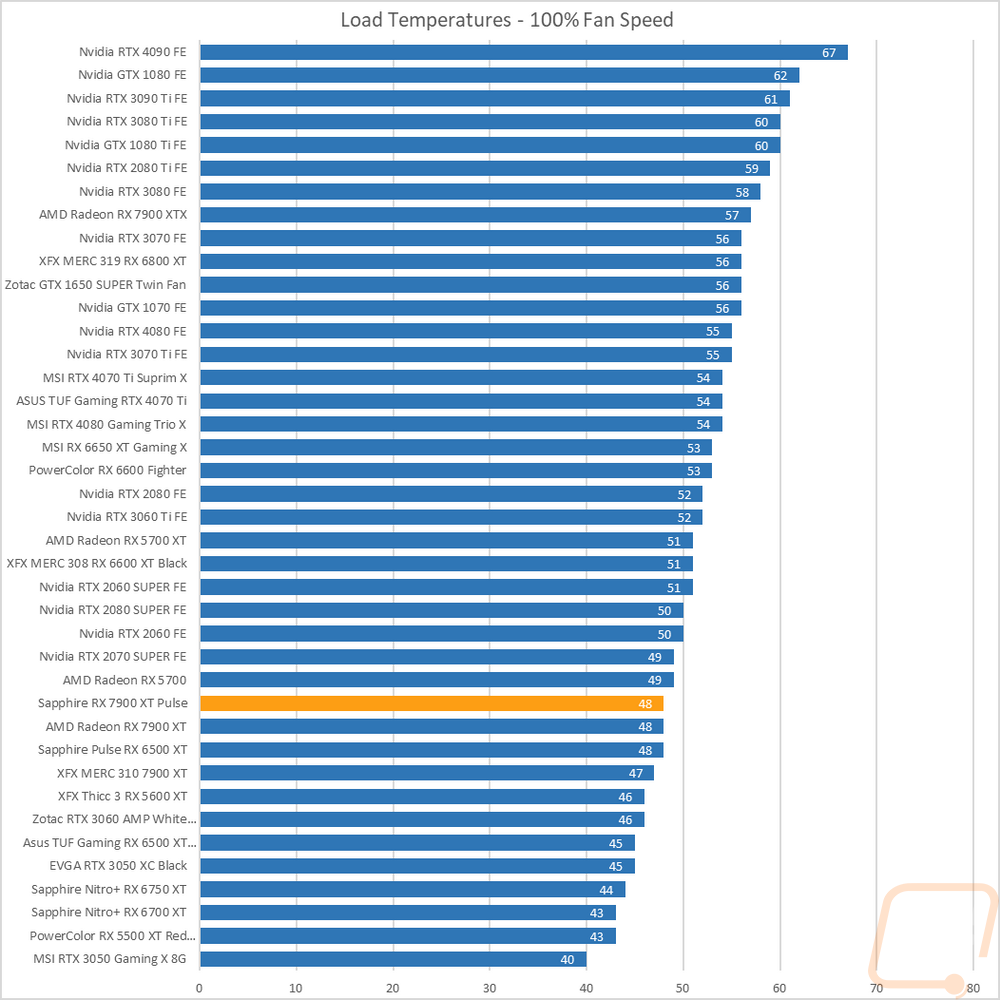
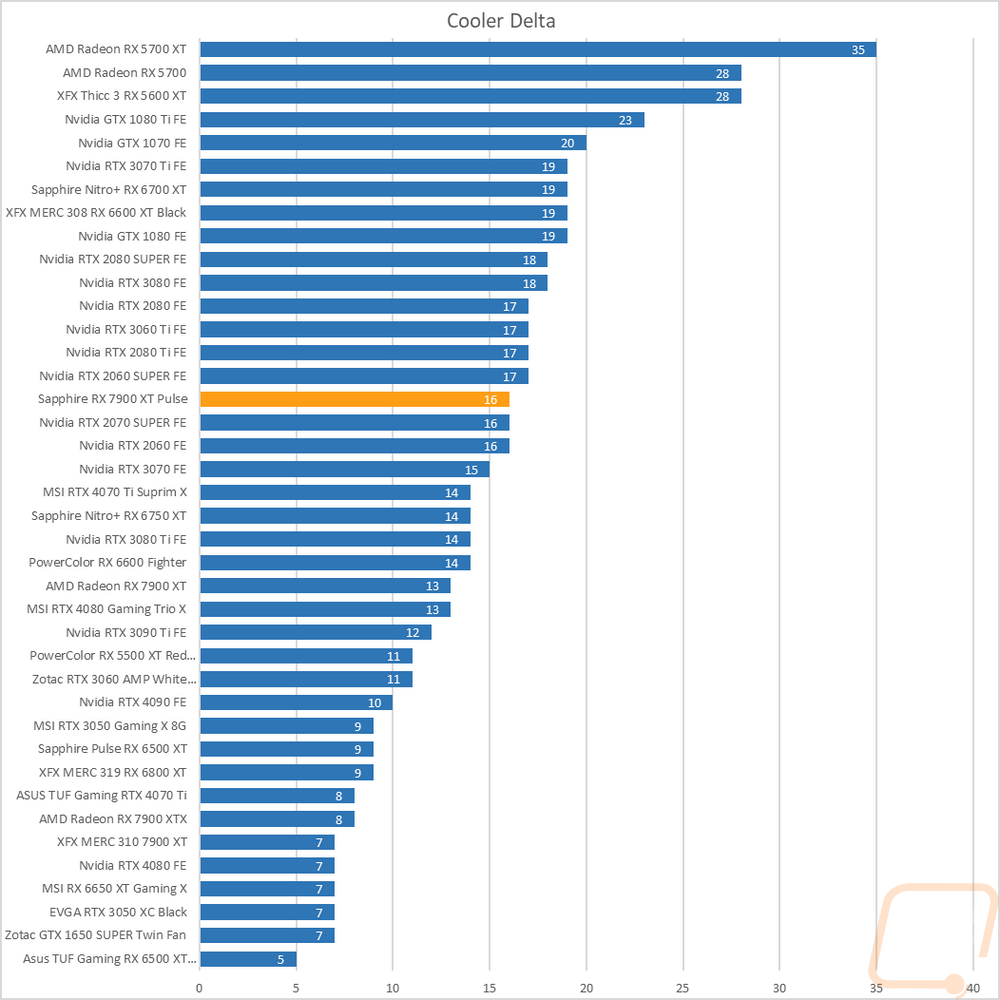
To finish up my testing I of course had to check out the cooling performance. To do this I ran two different tests. I used AIDA64’s Stress Test run for a half-hour each to warm things up. Then I documented what temperature the GPU leveled out at with the stock fan profile and then again with the fans cranked up to 100%. With the stock profile, the Sapphire 7900 XT Pulse leveled off at 64 degrees. This was 3 degrees higher than the reference 7900 XT and 10 over the XFX 7900 XT. Then with the fans cranked up, the 7900 XT Pulse dropped down to 48 degrees putting it right with the reference 7900 XT and one degree over the XFX card. This put the overall delta between the two at 16 degrees which is a big delta showing that Sapphire has the card's profile tuned more for fan noise which we did see in the noise testing.
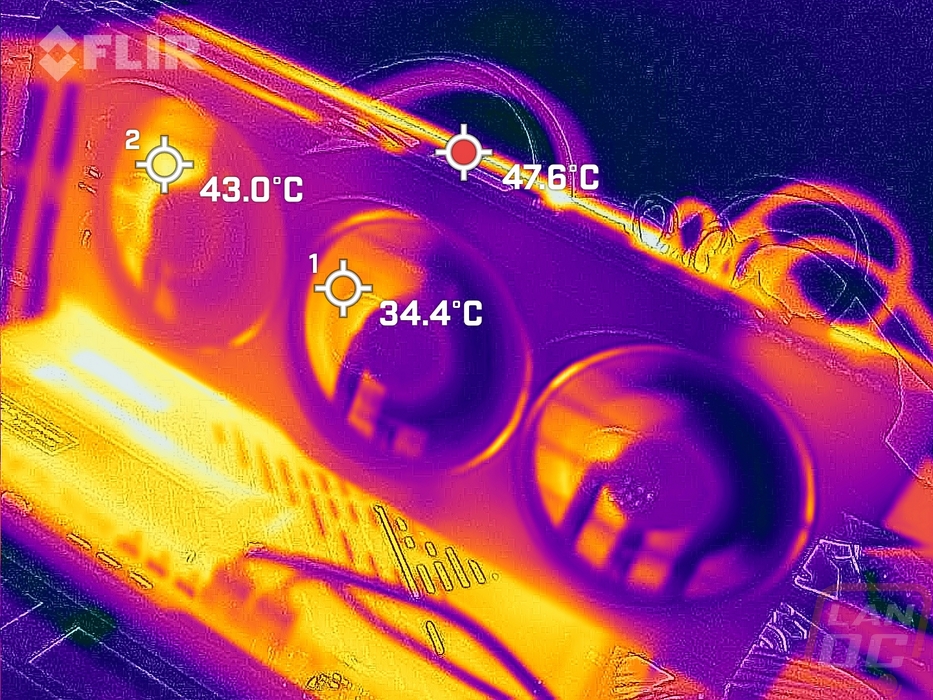
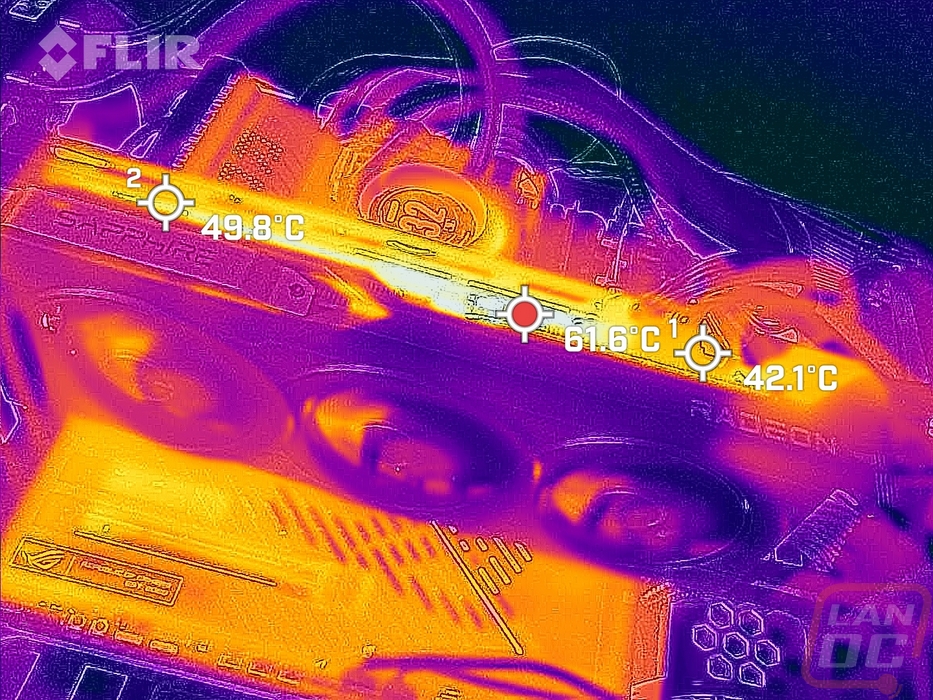
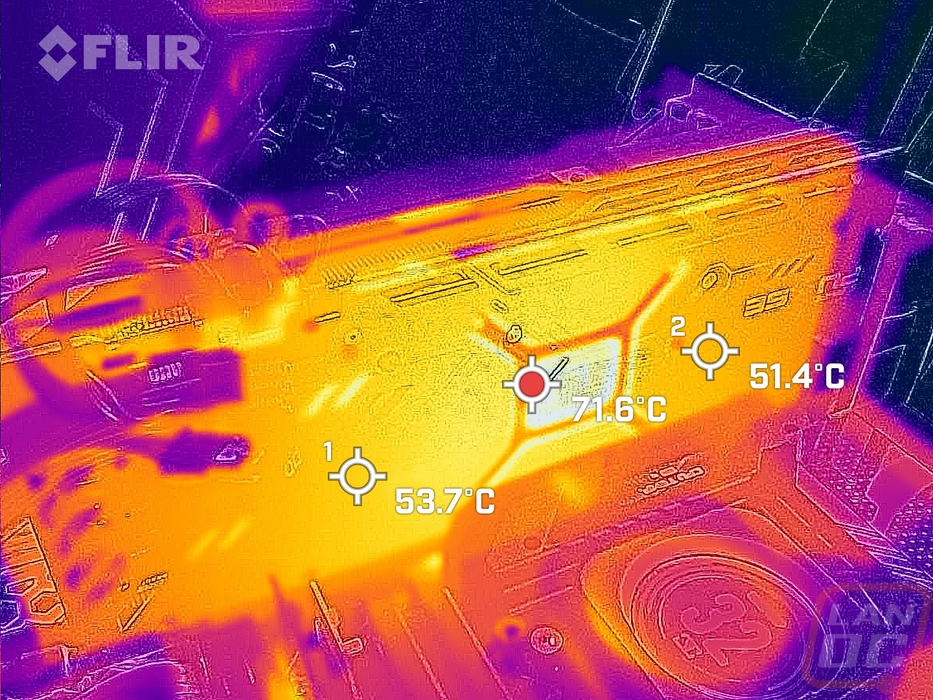
While running the stock fan profile testing I also took the time to get a few thermal images so we could see what is going on. The fan side of the 7900 XT Pulse shows that the heatpipes are doing a good job pulling the heat out across all three fans but even then we can still see that the left side of the card closest to all of the heat is a little warmer. The top edge view which exposes the PCB and the heatsink is of course going to have a few higher temps. The hottest area is the exposed power circuitry just to the left of the power plugs, beyond that though at 49.8c the rest of the exposed areas aren’t doing bad. Then on the back side of the Pulse, the open exposed PCB behind the GPU is of course the hottest spot on the entire card with it running 71.6c. The rest of the metal backplate is transferring heat through the thermal pads which is good.
Overall and Final Verdict
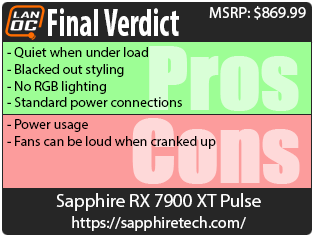
With price reductions for the RX 7900 XT just recently announced I can’t think of a better time for us to dive in and take a closer look at Sapphire’s RX 7900 XT Pulse. Their Pulse lineup sits in between the reference design and their Nitro+ lineup at the high end of things. This means that like with the reference card designs the Pulse is a little more budget focused and also doesn’t have a huge cooler that isn’t going to fit in some cases but unlike the reference design it does have an overclock and Sapphire hasn’t left the cooling alone as well. The 7900 XT Pulse has a triple fan cooler that is similar in size to the higher-end cards of a few years ago which means easier fitment and their design is almost entirely blacked out with just a few red accents and of course the branding up on the top edge. It also stands out in the market because it has ZERO RGB lighting. I have been known to like lighting from time to time, but normally on the middle of the range cards, we end up seeing lighting just being used to backlit branding which is boring and never really adds anything to the card. The blacked-out theme the Pulse has works well without the lighting and I think it’s a good choice here. It also shows that Sapphire's focus is on the performance and for that, the Pulse did stand out. While it only had a small overclock, combined with improved cooling and a more aggressive power profile it ended up being 2%-3% faster than the reference design in just about all of our tests. On a card that already performs well, the 7900 XT handled everything I threw at it, especially 1080p and 1440p where at times the CPU was the limitation. But even at 4K none of our in-game tests were anything less than 60 FPS and with more than half over 120 FPS.
The increased power profile did mean that in our efficiency tests the Pulse came in under the reference card but that was to be expected. It also pulls more power as well in all of our different power tests. The cooling performance was middle of the range and it was clear the fan profile was tuned to run quiet which it did very well. There was a lot of headroom left in the fans but when you crank them all the way up things did get noisy so it isn’t something I would recommend. Beyond that, like with the other 7900 XT’s the Pulse has the older standard PCIe power connections for power, not the new 12VHPWR connection that some of the Nvidia cards come with which means you don’t need to worry about an upgrade to ATX 3.0 just yet. It also has a nice blacked-out aluminum backplate that shows the build quality focus that Sapphire gave the Pulse and you also get a metal anti-sag bracket as well if needed. For display connections, the 7900 XT Pulse does have an unusual layout with two HDMI and two DisplayPort connections. I didn’t put this in the pros or cons because really for some the extra HDMI will be a big pro but for others not having three matching DisplayPorts for a triple monitor setup could be a con.
As far as pricing goes, the 7900 XT Pulse originally had an MSRP of $999.99 but with the new lower price it has dropped down to $869.99. There are some RX 7900 XTs down at 799.99 and a lot of the reference 7900 XTs are listed at $840-$850. So the 7900 XT Pulse is still a little expensive, but given its performance, compared to the reference cards it isn’t too far off. AMD also currently has the game bundle which gets you The Last of Us Part 1 to go with the card which helps with the value.

Live Pricing: HERE
