Cooling Noise and Power
For my last few tests, rather than focusing on in game performance, I like to check out other aspects of video card performance. These are also the most important ways to differentiate the performance between cards that have the same GPU. To start things off I took a look at power usage.
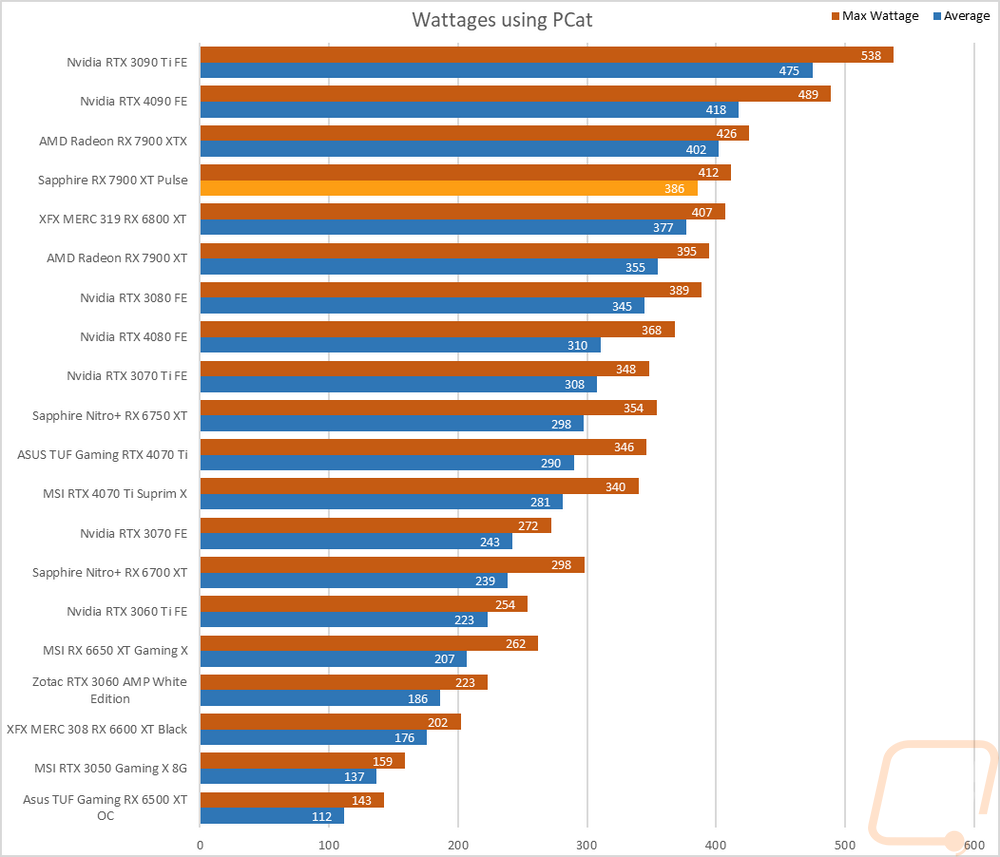
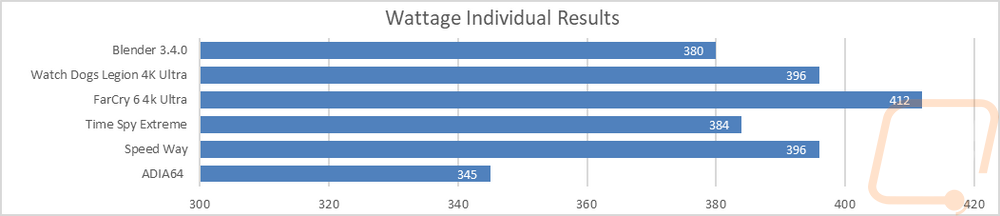
For this, our new test setup utilizes the Nvidia-designed PCat v2 along with cables to handle both traditional 6 or 8-pin connections as well as the new 12VHPWR. The PCat also utilizes a PCIe adapter to measure any power going to the card through the PCIe slot so we can measure the video card wattage exclusively, not the entire system as we have done in the past. I test with a mix of applications to get both in game, synthetic benchmarks, and other workloads like Blender and AIDA64. Then everything is averaged together for our result. I also have the individual results for this specific card and I document the peak wattage result as well which is almost always Time Spy Extreme. After seeing the performance improvement that the 7900 XT Pulse was able to do with a small overclock over the reference 7900 XT I wasn’t surprised to see the power draw go up. It averaged 386 watts across the tests to the reference cards 355 watts and its peak wattage was 412 to 395 on the reference card. This jumped it up over the overclocked 6800 XT and put it a lot closer to the 7900 XTX.
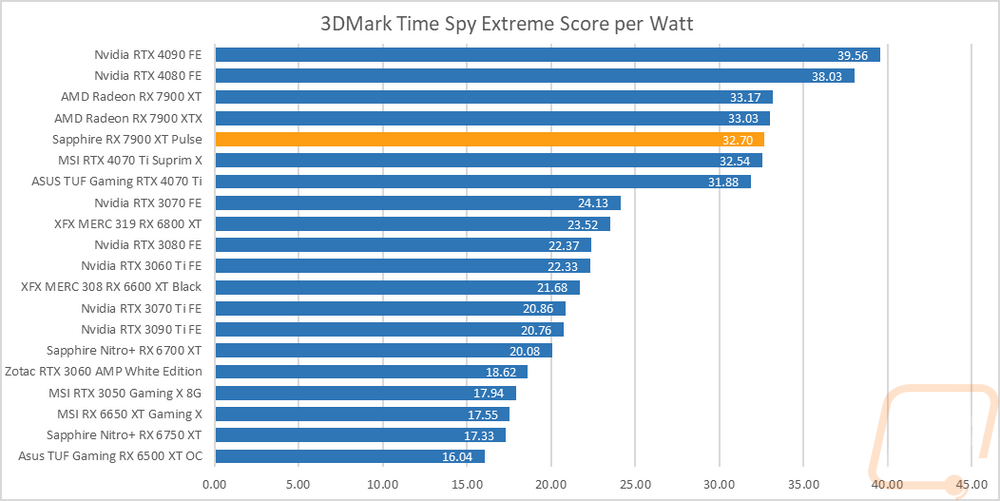
With having exact peak wattage numbers when running Time Spy Extreme I was also able to put together a graph showing the total score for each watt that a card draws which gives us an interesting look at overall power efficiency in the popular and demanding benchmark. With the increased power usage, the 7900 XT Pulse ended up with a score per watt of 32.7 which was lower than the stock 7900 XT and the 7900 XTX as well, no surprise there. This just tells us that while faster, because of the power the Pulse isn’t as efficient as the stock clocked card.
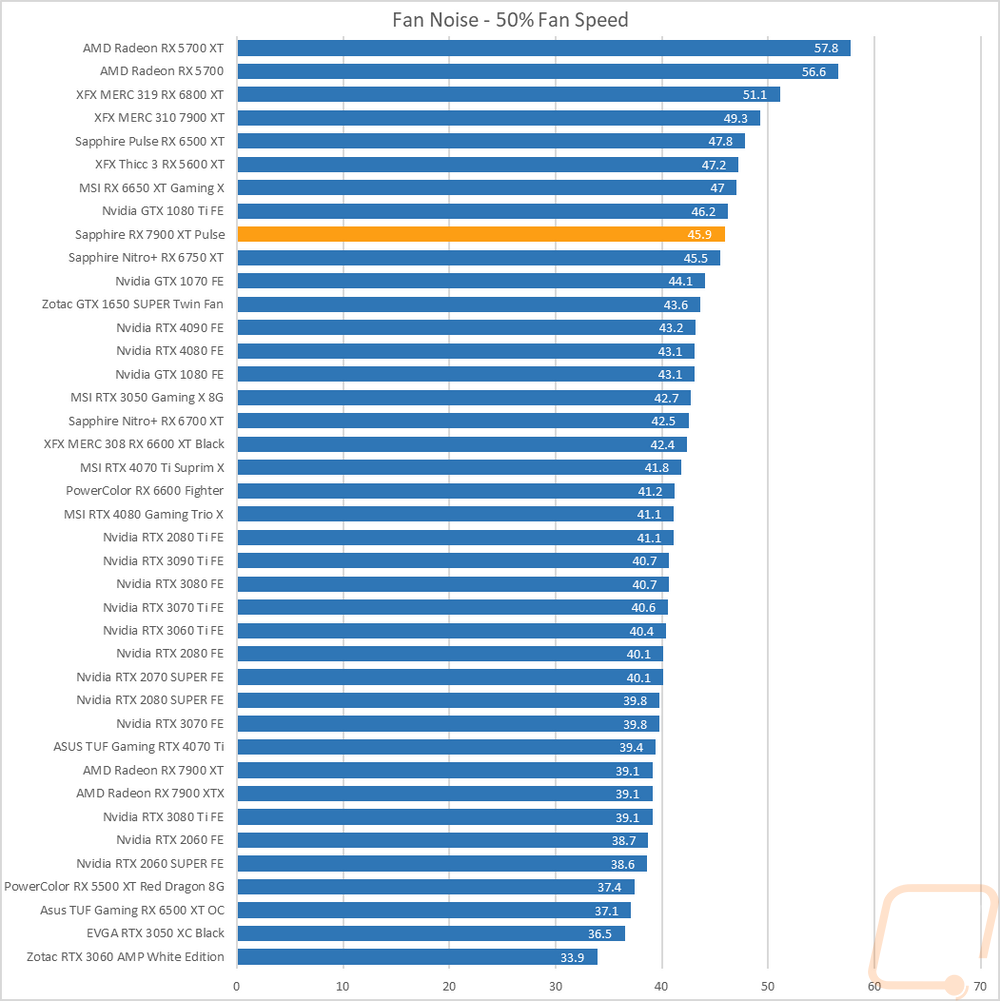
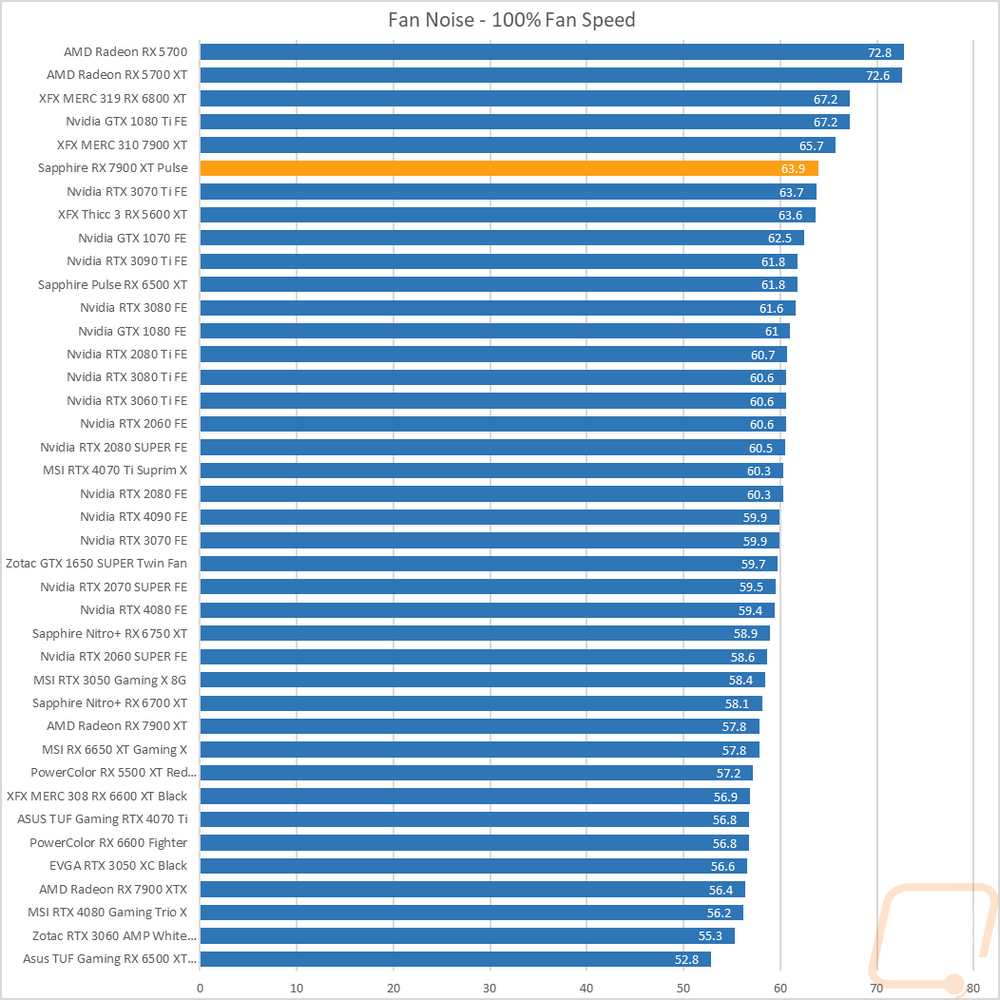
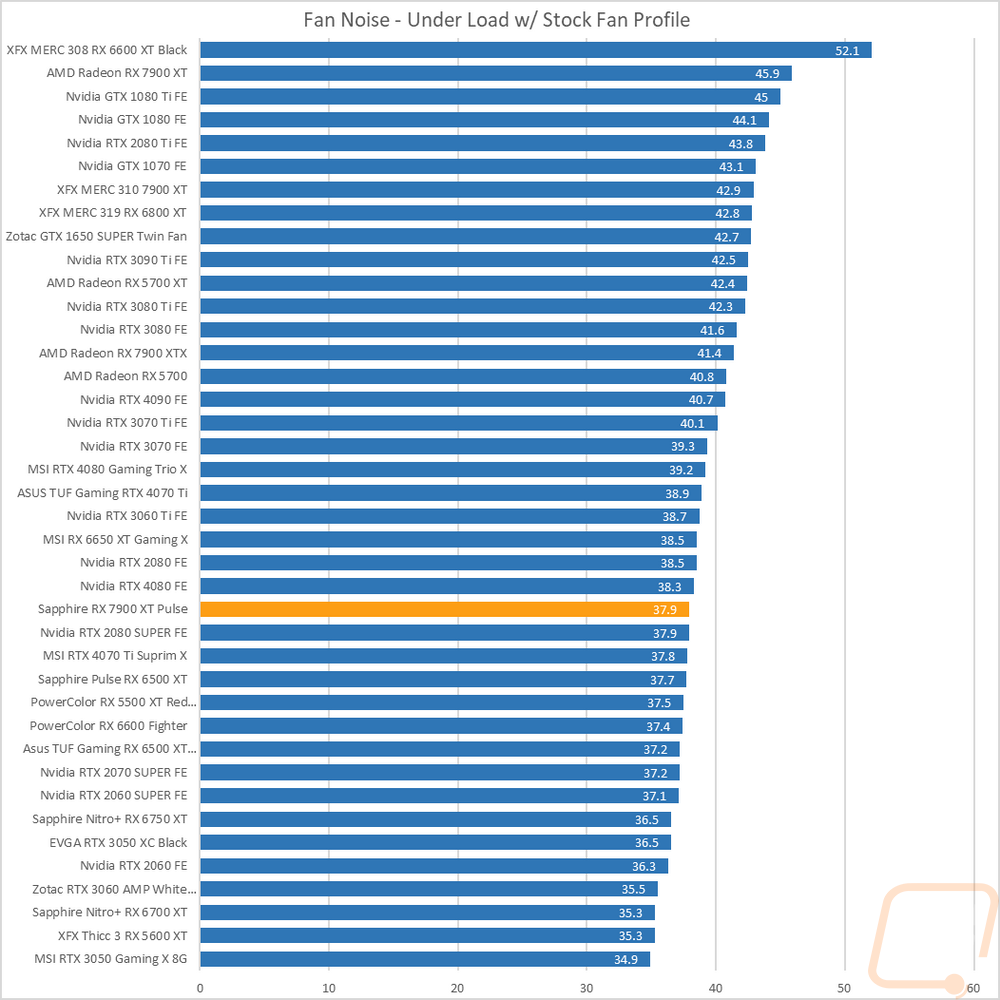
My next round of tests were looking at noise levels. These are especially important to me because I can’t stand to listen to my PC whirling. Especially when I’m not in game and other applications are using the GPU. For my testing, though I first tested with the fan cranked up to 100% to get an idea of how loud it can get, then again at 50% to get an idea of its range. The 7900 XT Pulse came in at 45.9 decibels at 50% and 63.9 at 100%. The 100% fan speed put it way up in the chart but not ahead of the XFX 7900 XT. The 50% performance was better but still up in the top 1/3 of the chart. I also take a look at noise performance while under load. For that when running AIDA64’s stress test I wait until the temperature of the card has leveled off and then measure how loud things are when the card is at its worst-case scenario with the stock fan profile. Here the Sapphire 7900 XT Pulse did great running at just 37.9 decibels. This was a full 8 decibels lower than the reference card and 5 decibels lower than the XFX design as well.
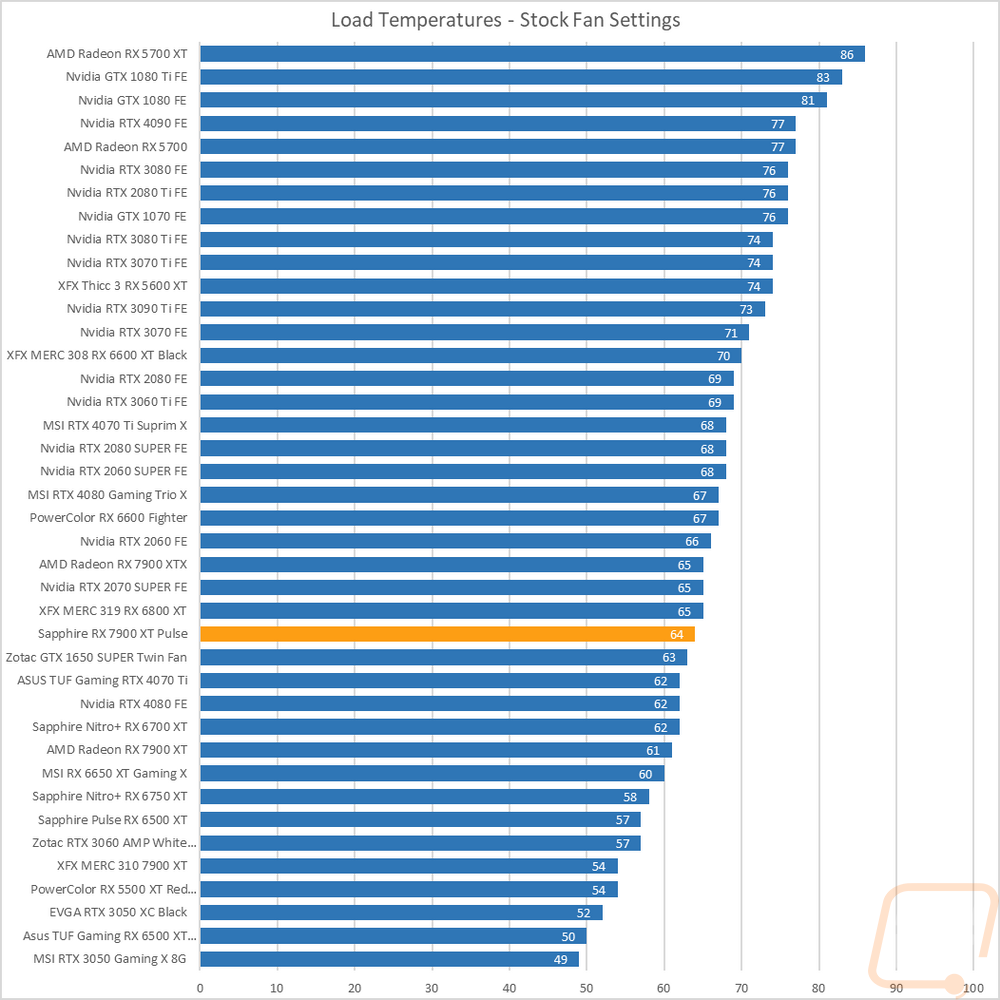
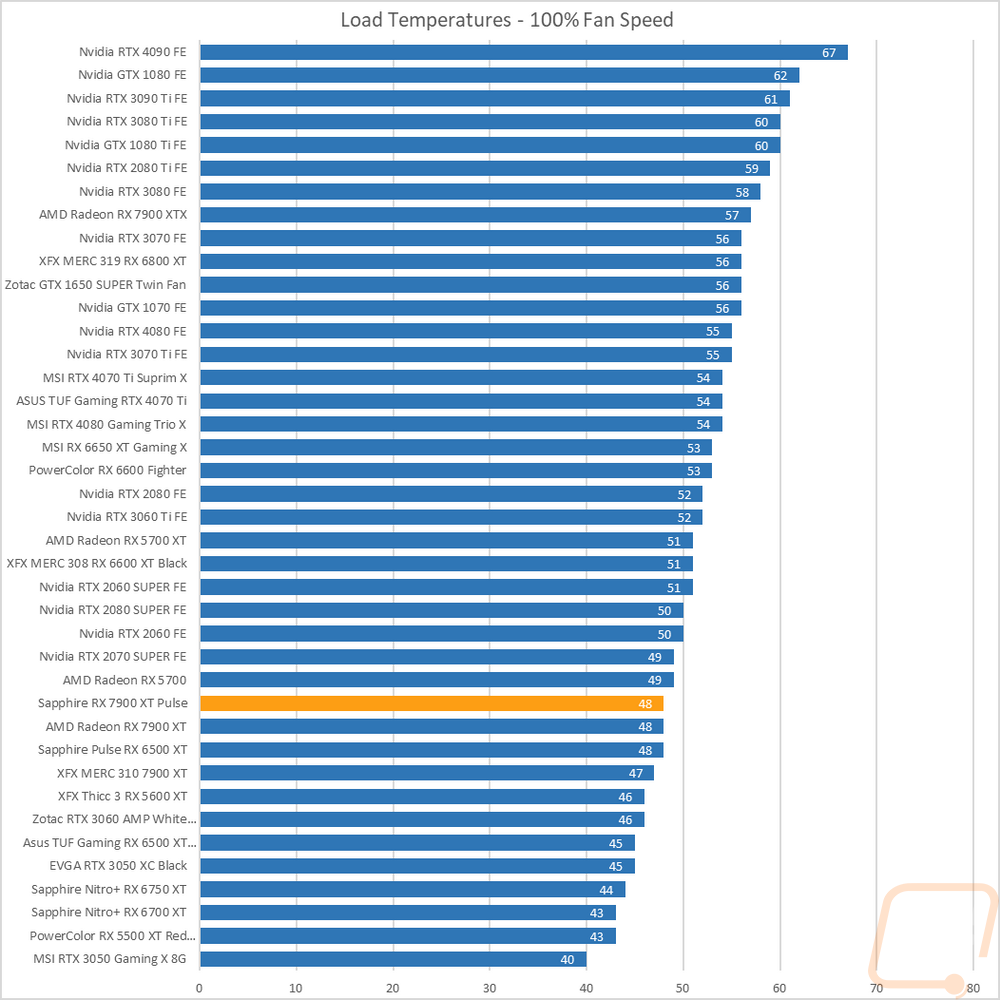
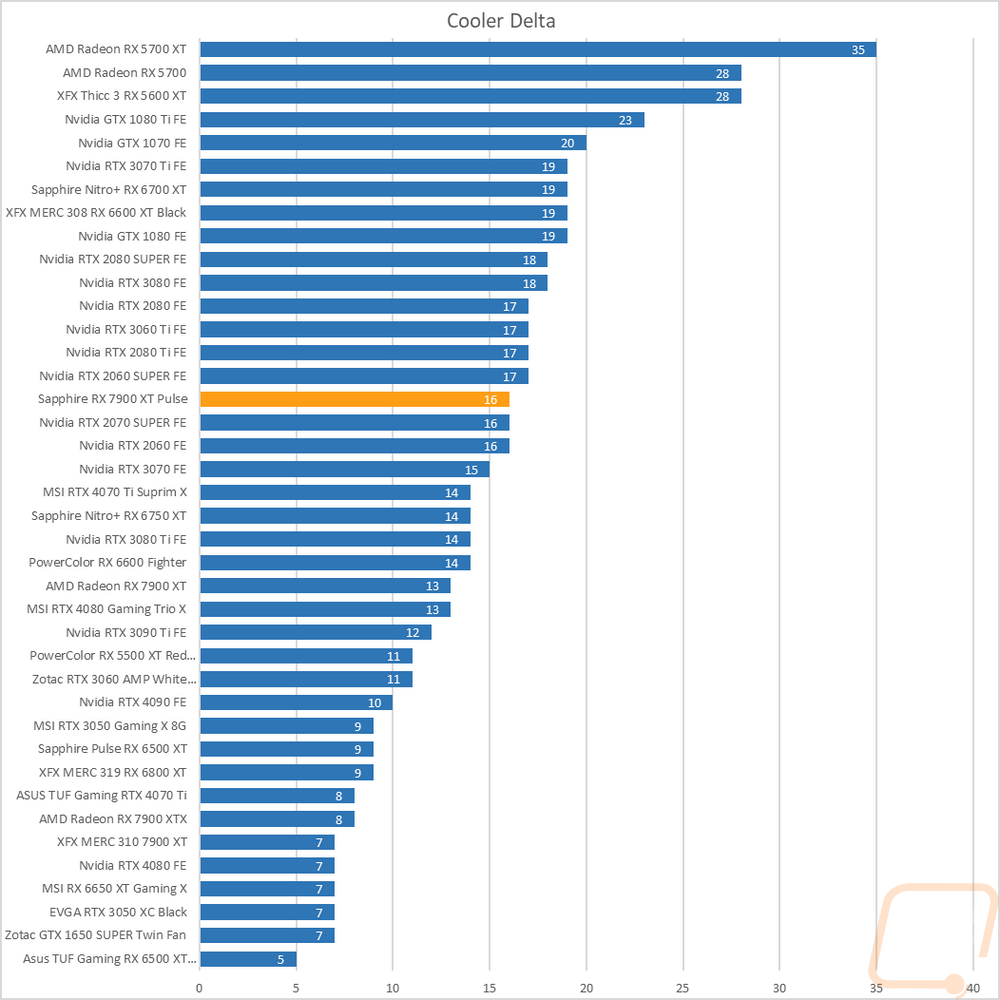
To finish up my testing I of course had to check out the cooling performance. To do this I ran two different tests. I used AIDA64’s Stress Test run for a half-hour each to warm things up. Then I documented what temperature the GPU leveled out at with the stock fan profile and then again with the fans cranked up to 100%. With the stock profile, the Sapphire 7900 XT Pulse leveled off at 64 degrees. This was 3 degrees higher than the reference 7900 XT and 10 over the XFX 7900 XT. Then with the fans cranked up, the 7900 XT Pulse dropped down to 48 degrees putting it right with the reference 7900 XT and one degree over the XFX card. This put the overall delta between the two at 16 degrees which is a big delta showing that Sapphire has the card's profile tuned more for fan noise which we did see in the noise testing.
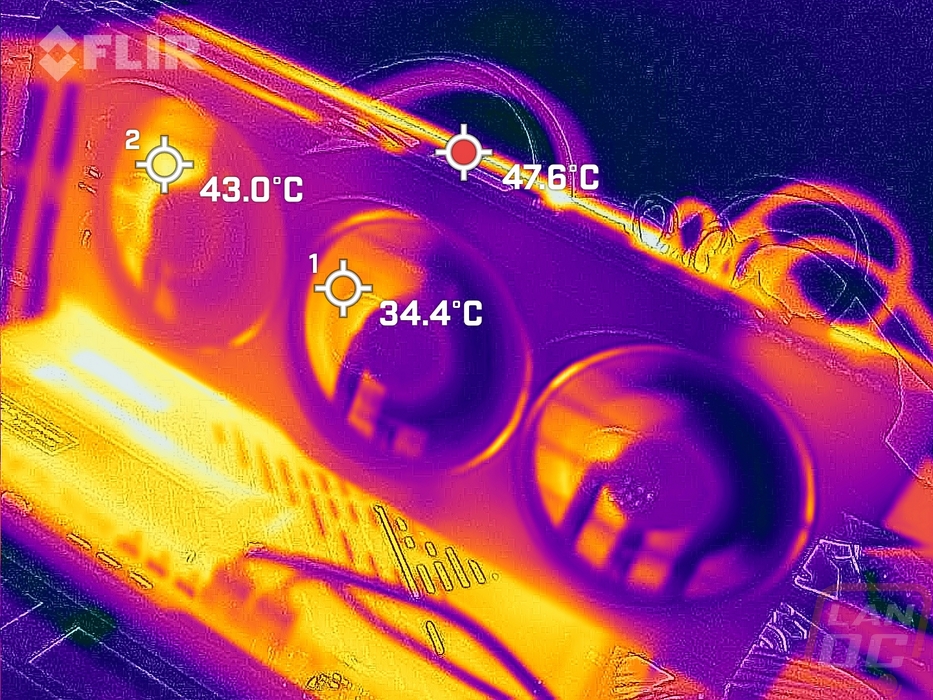
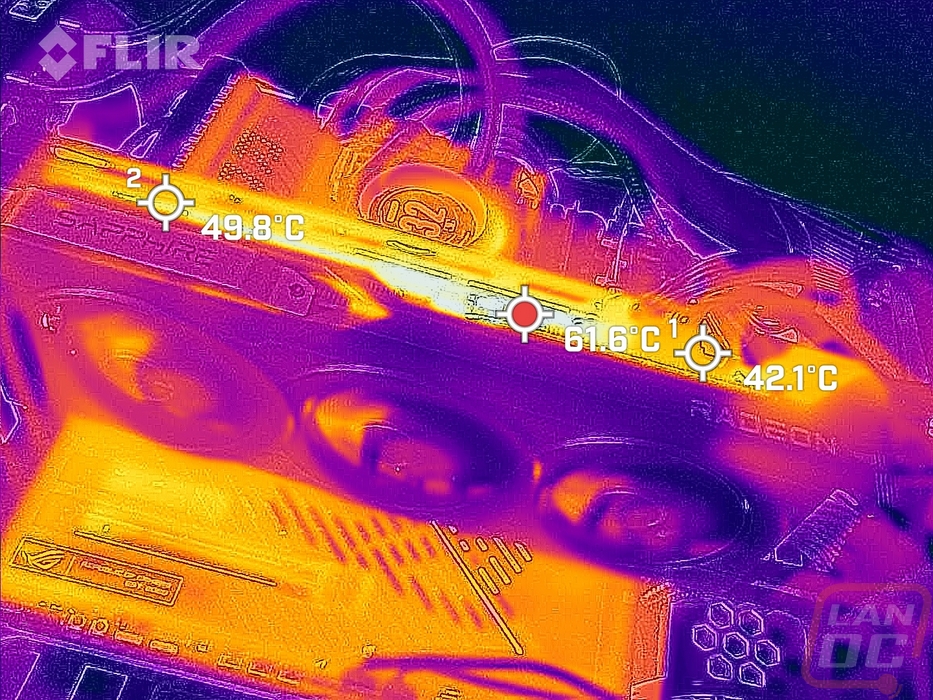
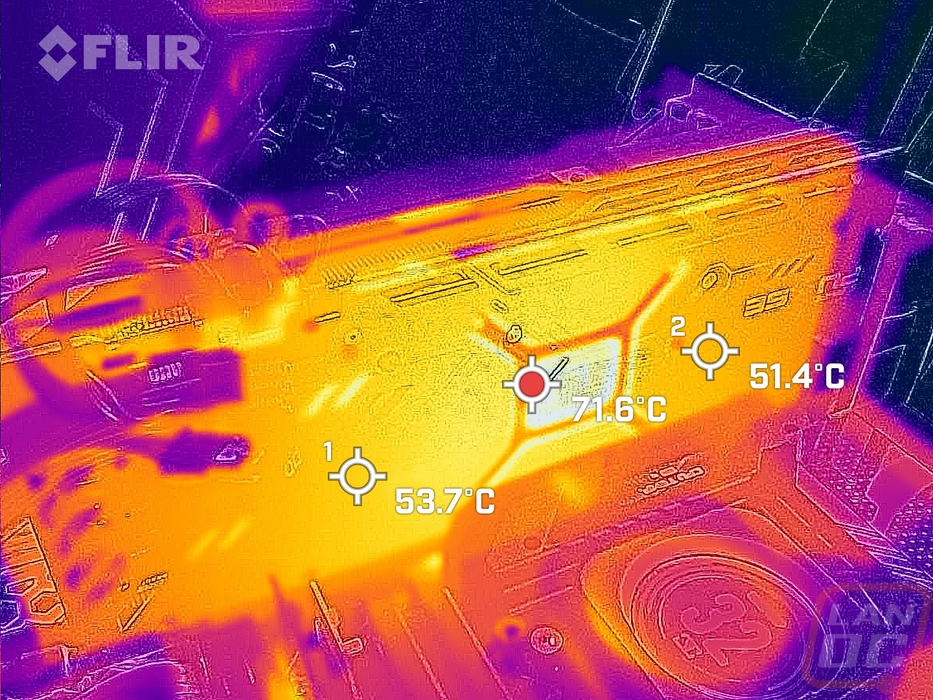
While running the stock fan profile testing I also took the time to get a few thermal images so we could see what is going on. The fan side of the 7900 XT Pulse shows that the heatpipes are doing a good job pulling the heat out across all three fans but even then we can still see that the left side of the card closest to all of the heat is a little warmer. The top edge view which exposes the PCB and the heatsink is of course going to have a few higher temps. The hottest area is the exposed power circuitry just to the left of the power plugs, beyond that though at 49.8c the rest of the exposed areas aren’t doing bad. Then on the back side of the Pulse, the open exposed PCB behind the GPU is of course the hottest spot on the entire card with it running 71.6c. The rest of the metal backplate is transferring heat through the thermal pads which is good.