Cooling Noise and Power
For my last few tests, rather than focusing on in game performance, I like to check out other aspects of video card performance. These are also the most important ways to differentiate the performance between cards that have the same GPU. To start things off I took a look at power usage.
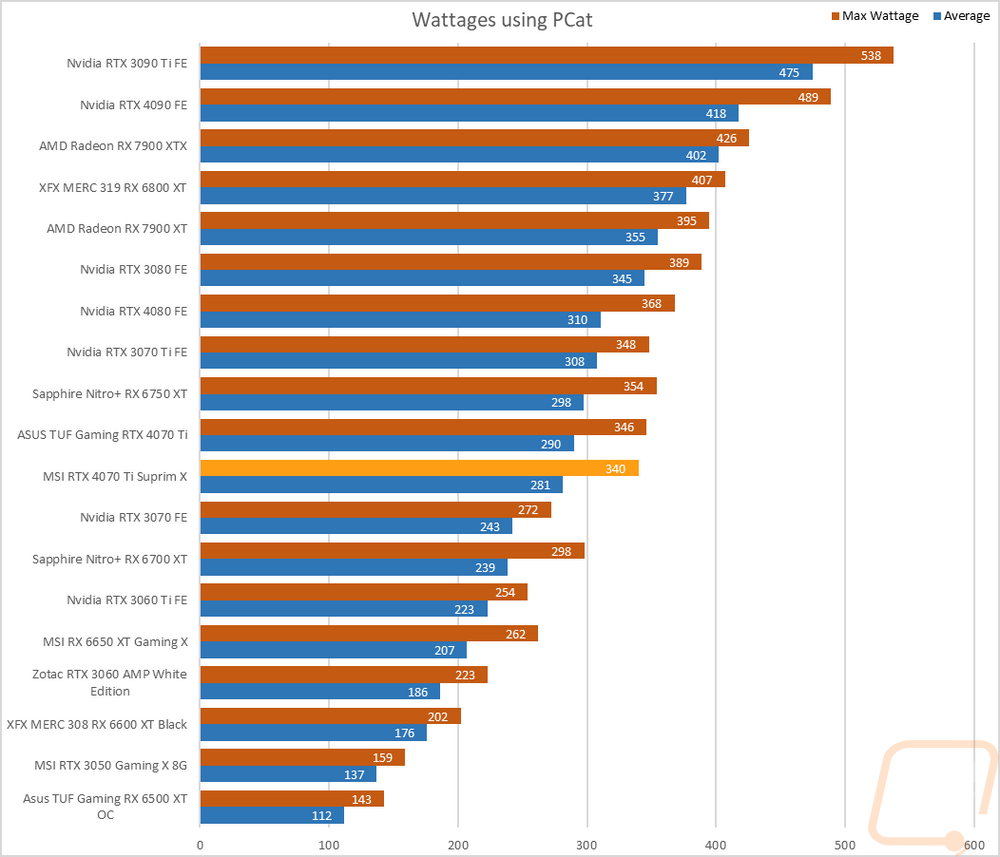
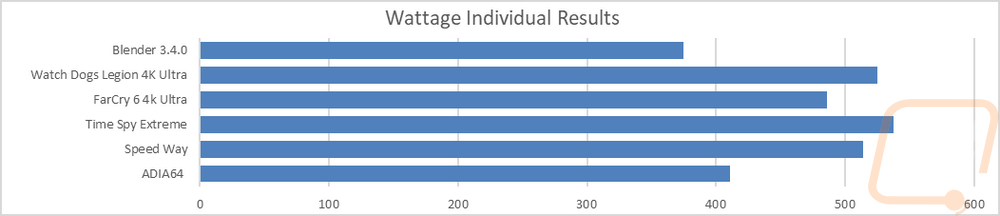
For this, our new test setup utilizes the Nvidia-designed PCat v2 along with cables to handle both traditional 6 or 8-pin connections as well as the new 12VHPWR. The PCat also utilizes a PCIe adapter to measure any power going to the card through the PCIe slot so we can measure the video card wattage exclusively, not the entire system as we have done in the past. I test with a mix of applications to get both in game, synthetic benchmarks, and other workloads like Blender and AIDA64. Then everything is averaged together for our result. I also have the individual results for this specific card and I document the peak wattage result as well which is almost always Time Spy Extreme. The RTX 4070 Ti Suprim X averaged 9 watts lower than the Asus TUF 4070 Ti OC and was 6 watts lower on its peak power draw as well showing that while MSI did give it a larger clock speed they were more conservative on their power profile which would explain why in a few benchmarks the TUF card did edge out the Suprim X. That lower power is great to see heading into cooling testing.
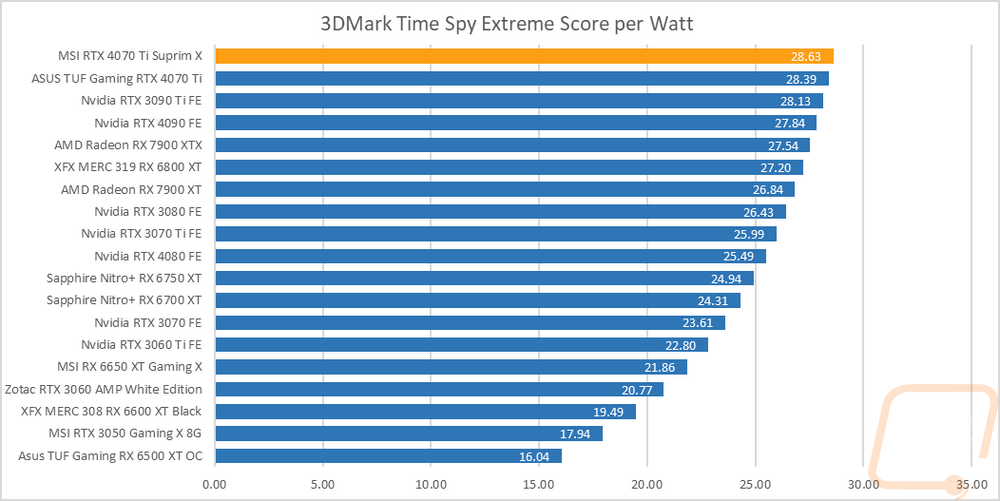
With having exact peak wattage numbers when running Time Spy Extreme I was also able to put together a graph showing the total score for each watt that a card draws which gives us an interesting look at overall power efficiency in the popular and demanding benchmark. Having a lower peak power draw but being faster than the TUF means that the RTX 4070 Ti Suprim X did end up ahead of the TUF in this putting it up at the top of the chart as the most efficient card tested which is cool as well.
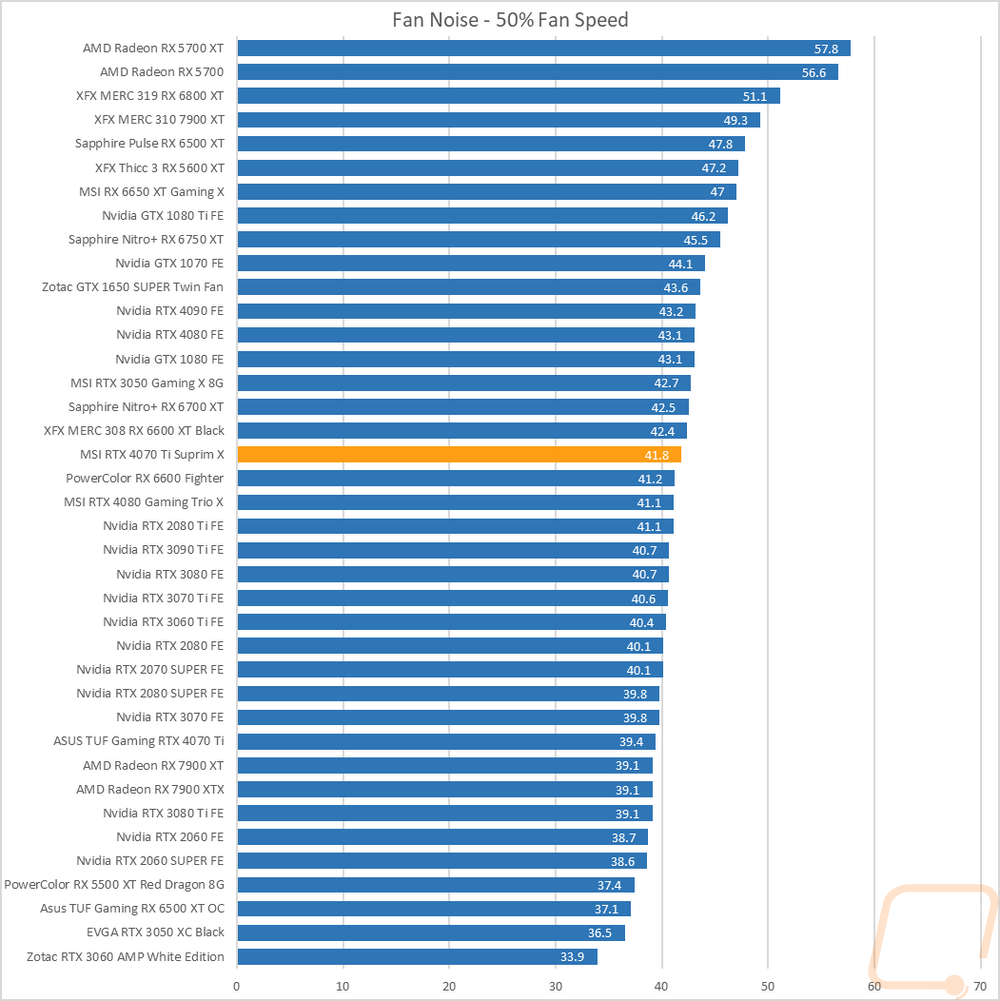
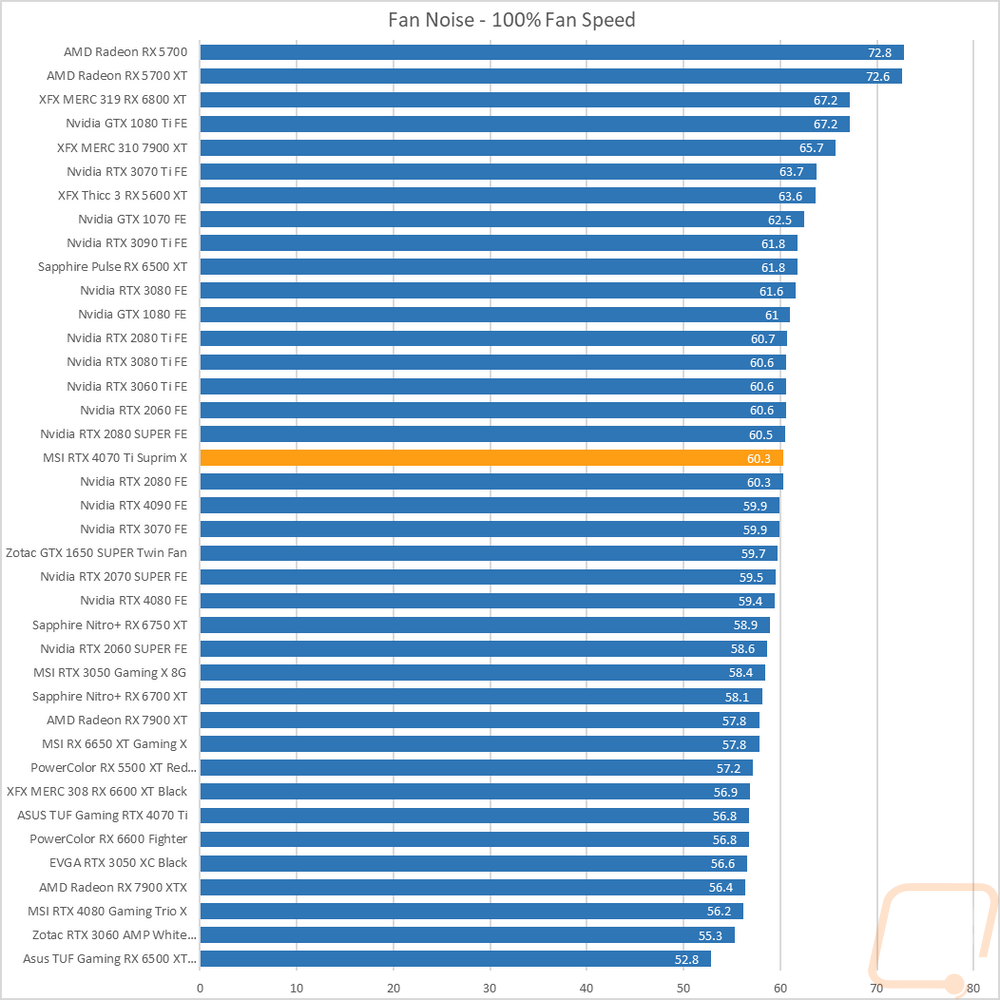
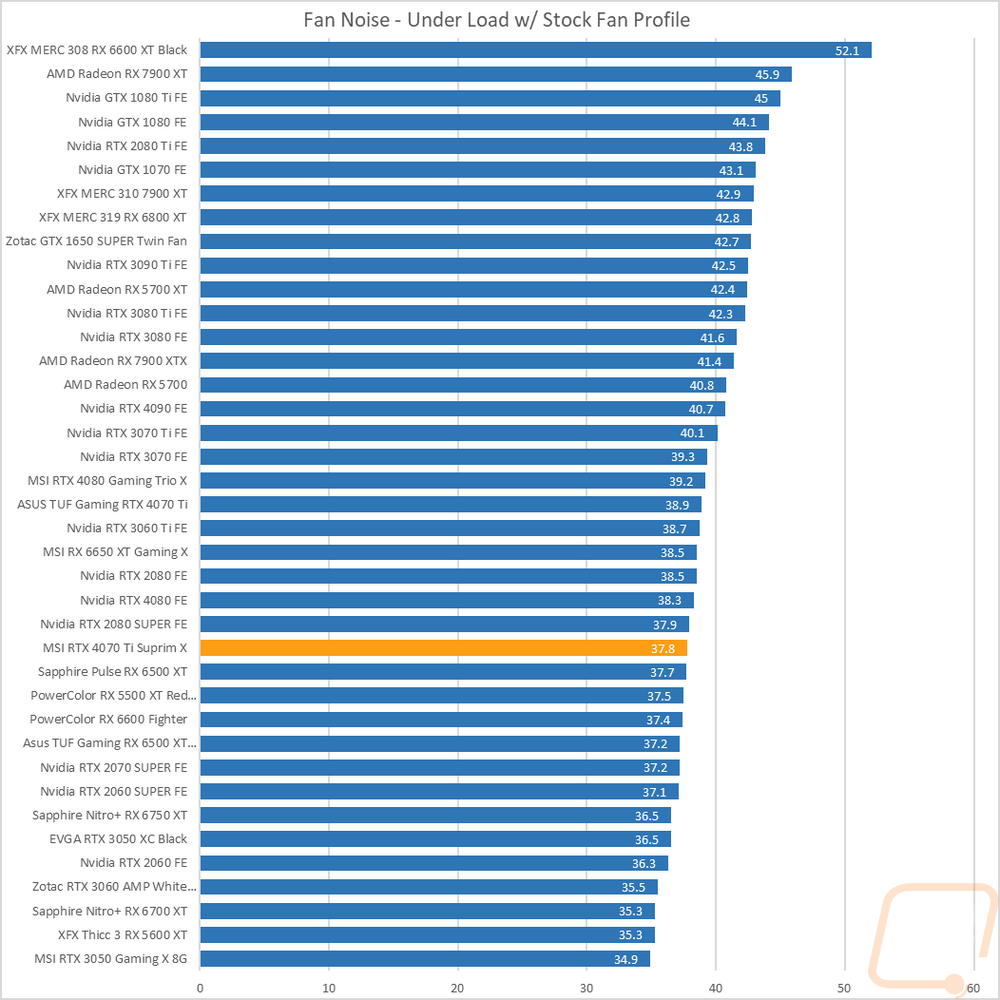
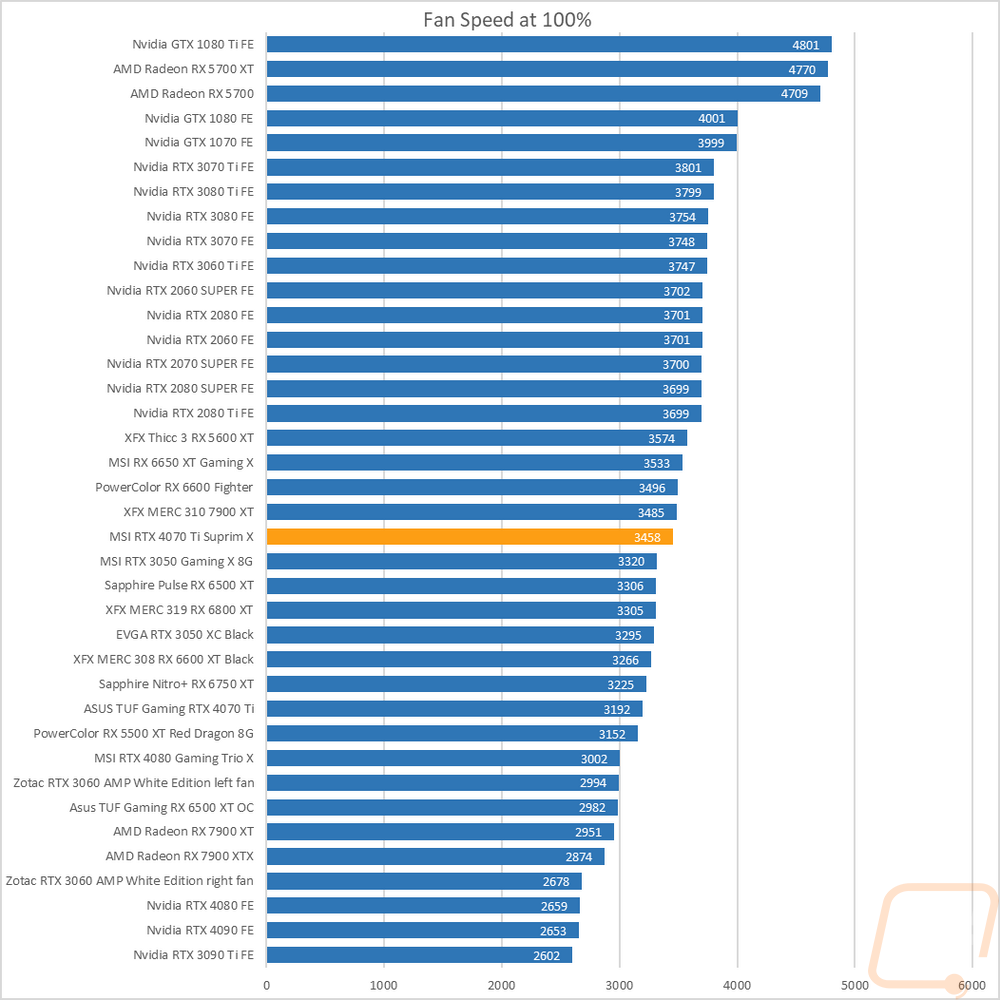
My next round of tests were looking at noise levels. These are especially important to me because I can’t stand to listen to my PC whirling. Especially when I’m not in game and other applications are using the GPU. For my testing, though I first tested with the fan cranked up to 100% to get an idea of how loud it can get, then again at 50% to get an idea of its range. The RTX 4070 Ti Suprim X fell into the middle of the pack on both the 50% and 100% fan speed tests at 41.8 decibels for 50% and 60.3 for 100% fan speed. This matches up with the total RPM speeds of the card which is nearly in the middle of the pack as well. I also take a look at noise performance while under load. For that when running AIDA64’s stress test I wait until the temperature of the card has leveled off and then measure how loud things are when the card is at its worst-case scenario with the stock fan profile. Here the RTX 4070 Ti Suprim X did even better coming in at 37.8 decibels. When running under a full load the fans maxed out at 37% fan speed.
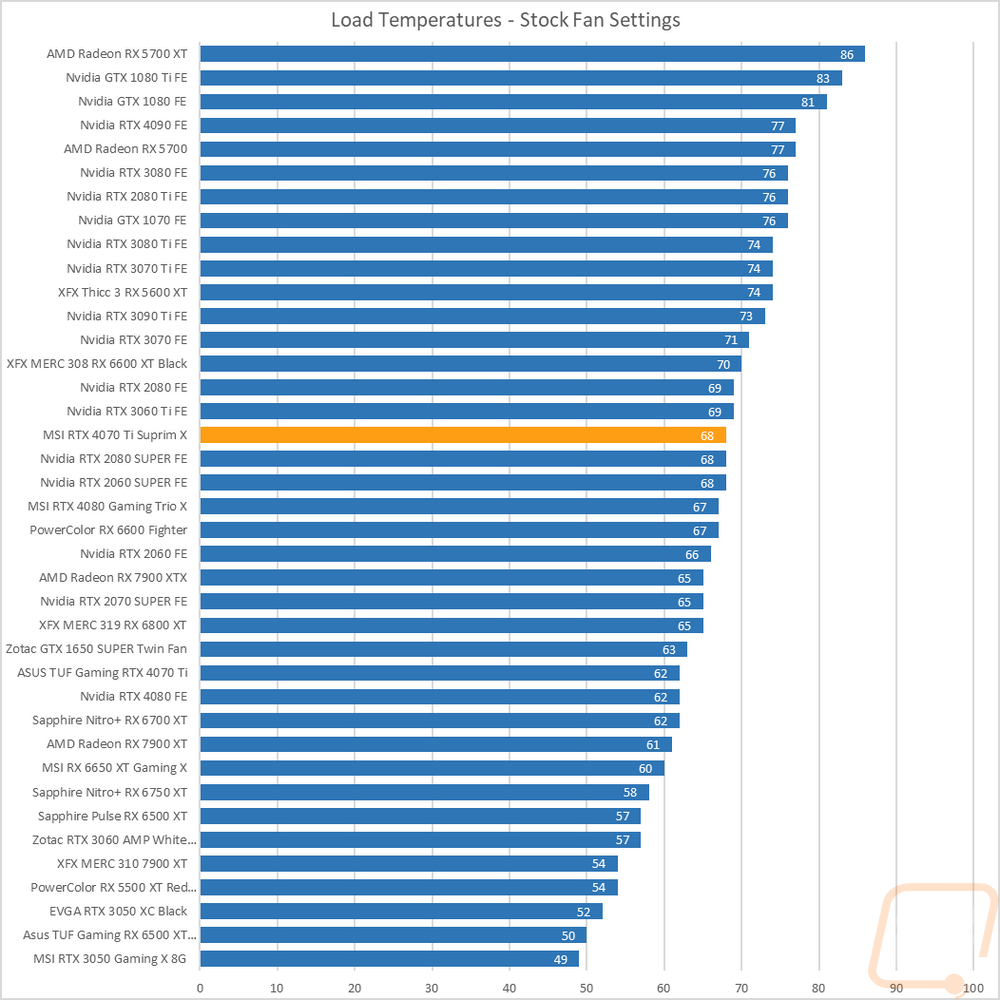
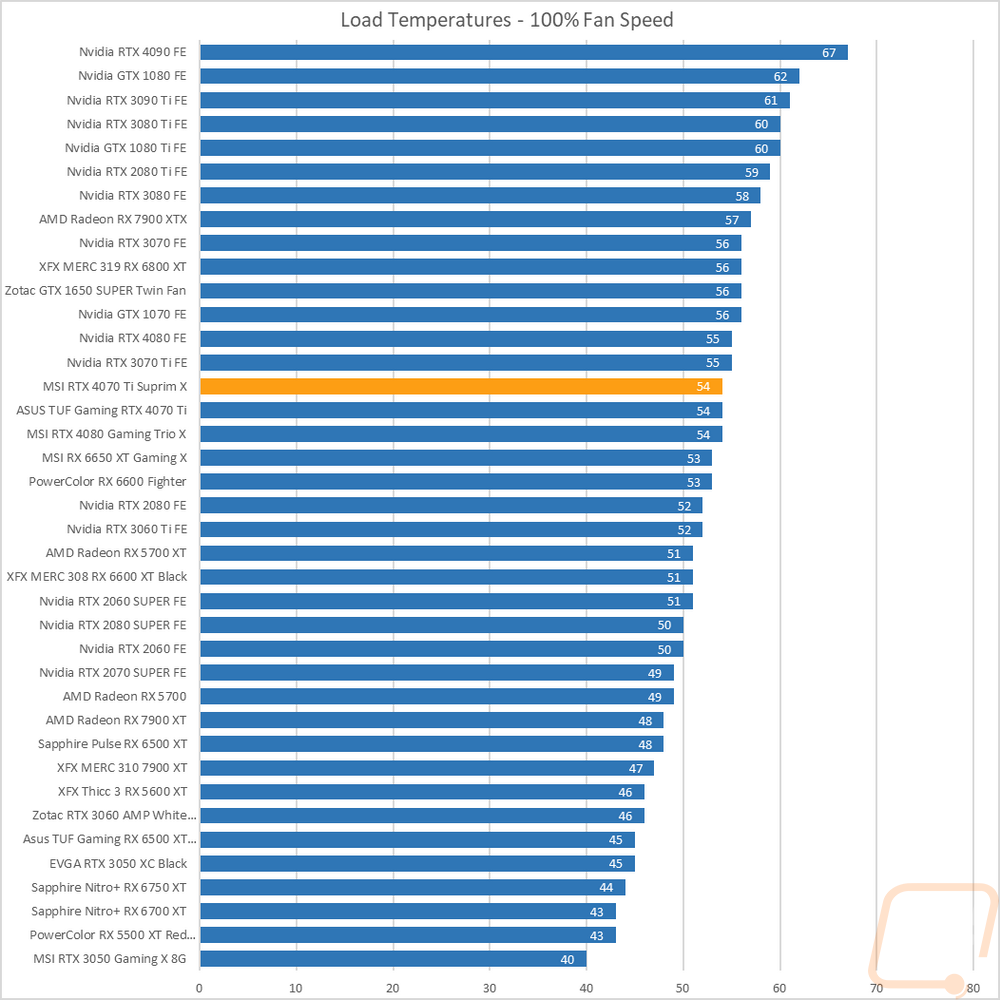
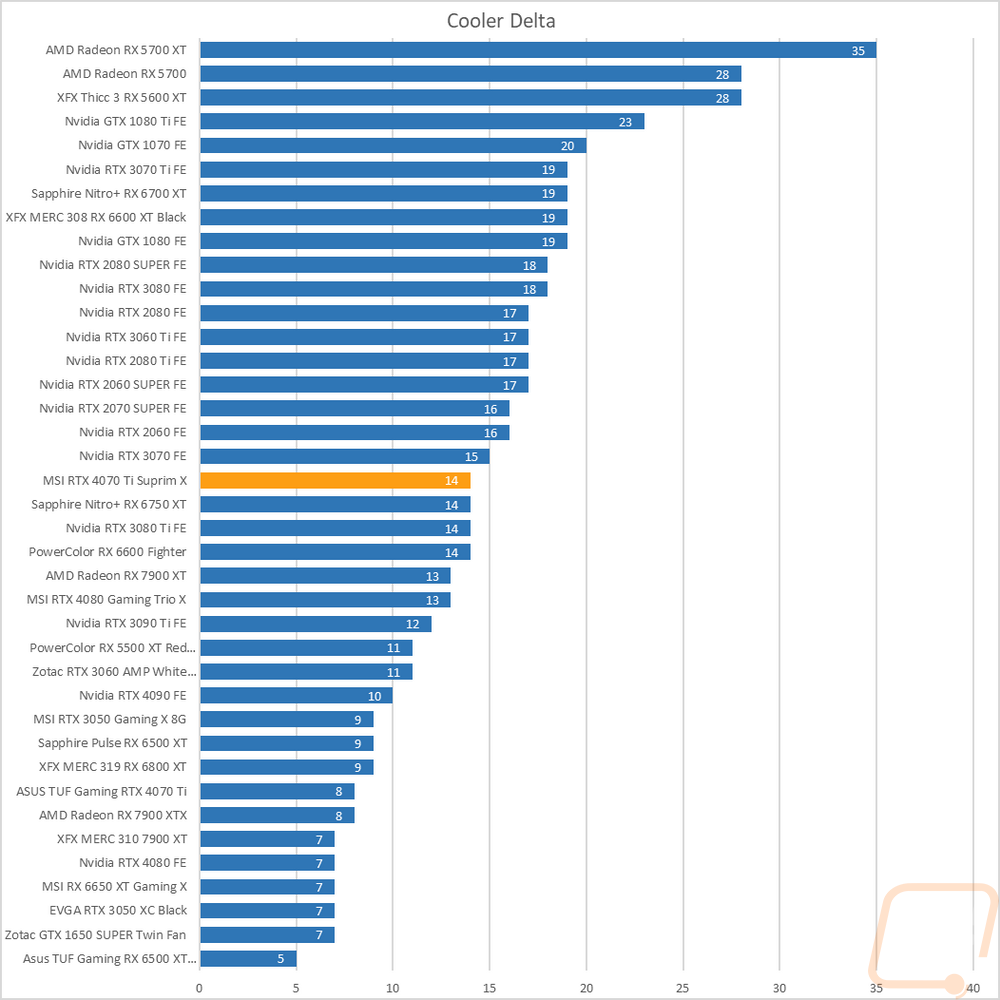
To finish up my testing I of course had to check out the cooling performance. To do this I ran two different tests. I used AIDA64’s Stress Test run for a half-hour each to warm things up. Then I documented what temperature the GPU leveled out at with the stock fan profile and then again with the fans cranked up to 100%. With the stock profile, the RTX 4070 Ti Suprim X peaked at 68c with a GPU hotspot of 82cwhich is right in the middle of the pack and is 5c higher than the TUF 4070 Ti but we also know that it was only running at 37% fan speed at this time. Cranking the huge triple-fan cooler on the Suprim X helped lower temps down to 54c but surprisingly this only matched the temperatures of the TUF 4070 Ti at 100% fan speed. The GPU hotspot was improved at 65c as well. Even with a little less power draw and a larger cooler, it didn’t end up translating to better cooling. There was however a bigger delta between the stock fan temperature and 100% fan speed temps meaning you do have room to adjust there.
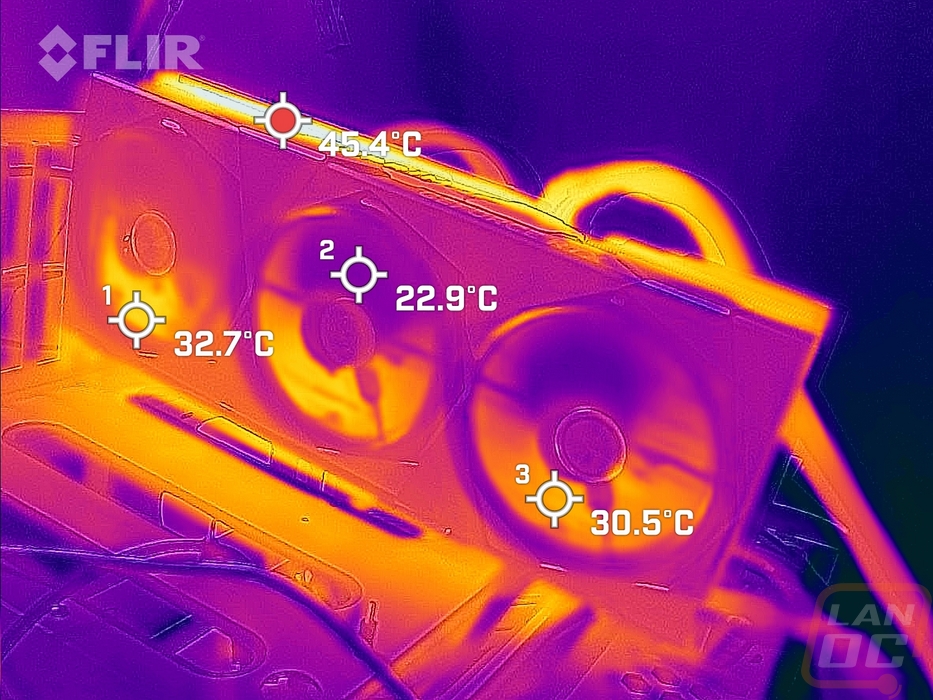
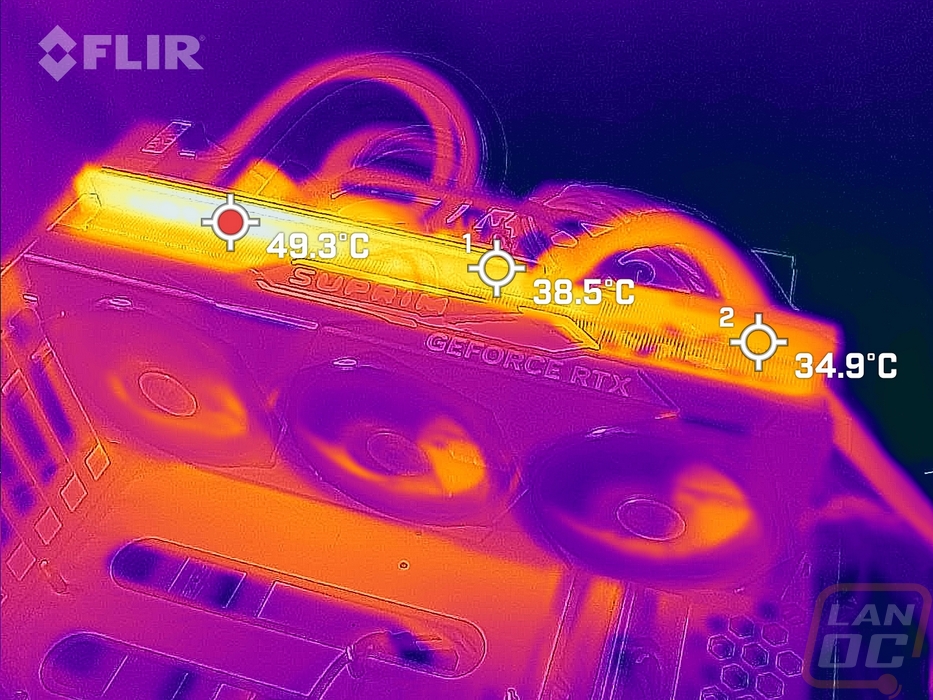
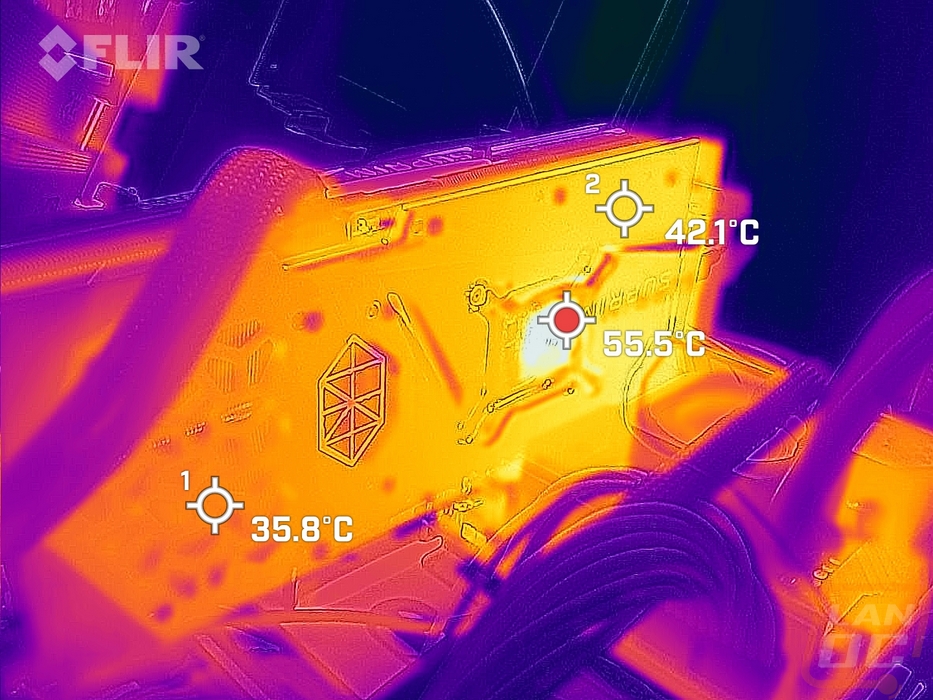
While running the stock fan profile testing I also took the time to get a few thermal images so we could see what is going on. The fan side of the RTX 4070 Ti Suprim X has behind the fans running up to 32c and down to 22.9c and the hotspot when viewing the side is the top edge of the card where you have a view of the PCB itself and also where the card is pushing the warmed air up and out. The top view has most of the heat on the left side of the card where it is running at 49c. On the right side of the top edge, you can see the temperatures drop the farther to the right you go. The 12VHPWR connection that I was a little concerned with being in the middle of the heatsink is running cool but you can see where the cable itself does have more heat in it from the heatsink blowing on it. Then at the back of the card, the metal backplate is pulling some of the heat out across it but the hotspot is still right behind the GPU where the PCB is exposed. The blow-through side of the card however is significantly cooler running 20c lower.