It’s been a crazy month with launches from everyone all packed together. We just finished checking out AMD's new CPUs and Intel announced their new 13th-generation CPUs. Sadly right in the middle of all of that fell my pre-planned vacation. So while everyone else has taken a look at the new CPUs I’m late to the party and had both the Intel i9-13900K and the i5-13600K waiting for me when I got home. I jumped into testing and today I can finally step back and take a look at all of the numbers to see how Intel’s CPUs compare with the last few generations of CPUs from AMD and Intel. Let’s not waste any more time and dive right in!
Product Name: Intel i9-13900K and i5-13600K
Review Sample Provided by: Intel
Written by: Wes Compton
Amazon Affiliate Links: Intel i9-13900K and Intel i5-13600K
Intel 13th Generation Core Desktop Processors
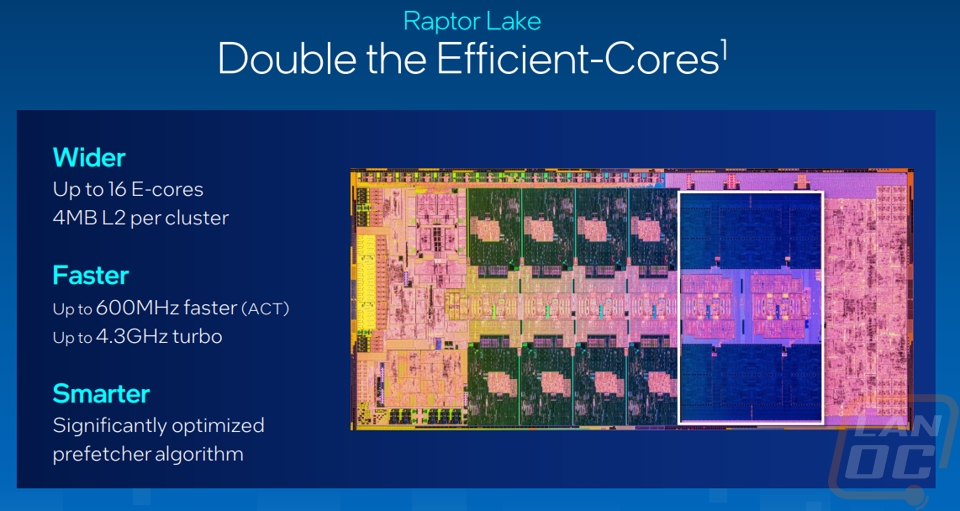
Last year Intel launched their 12th Generation CPUs which brought significant changes from the new LGA 1700 socket, DDR5 being optional, PCIe 4.0 and 5.0, as well as Intel’s new P and E core design. With all of those changes, it took a little while for things to settle down with the new platform and for pricing and availability to be worked out on things like DDR5. With AMD's new launch they have also moved to DDR5 and PCI 5.0 and I’m excited to see what Intel’s follow-up code named Raptor Lake will improve on things. One of those big changes with Raptor Lake is they have doubled up on the efficient cores. If you didn’t learn about the E and P cores with the last launch the P cores are a traditional design where the core size is larger with a focus on raw speed, especially with single-threaded work. The E or efficiency cores on the other hand are smaller in size with multiple e-cores fitting in the space of one p-core, these are more focused on multi-threaded performance or can be used to offload background tasks to leave the faster p-cores to focus on things like gaming performance.
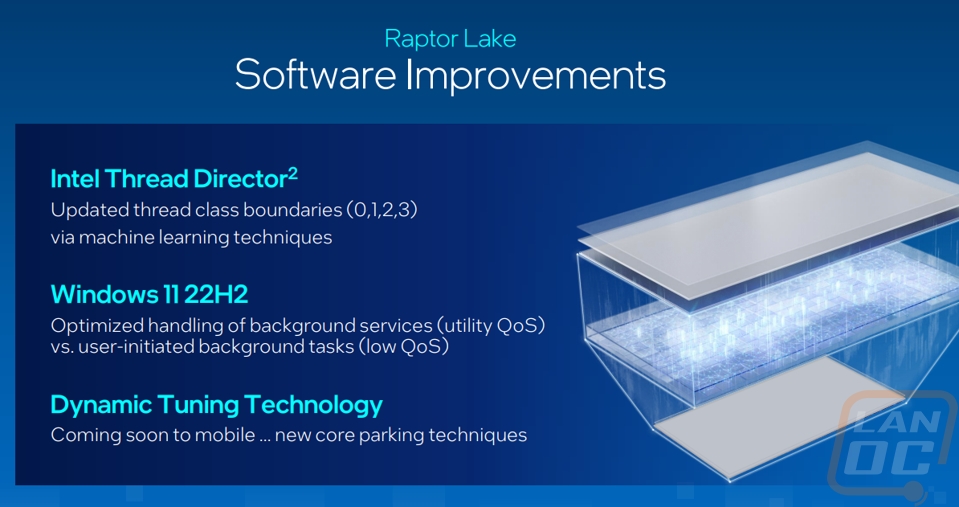
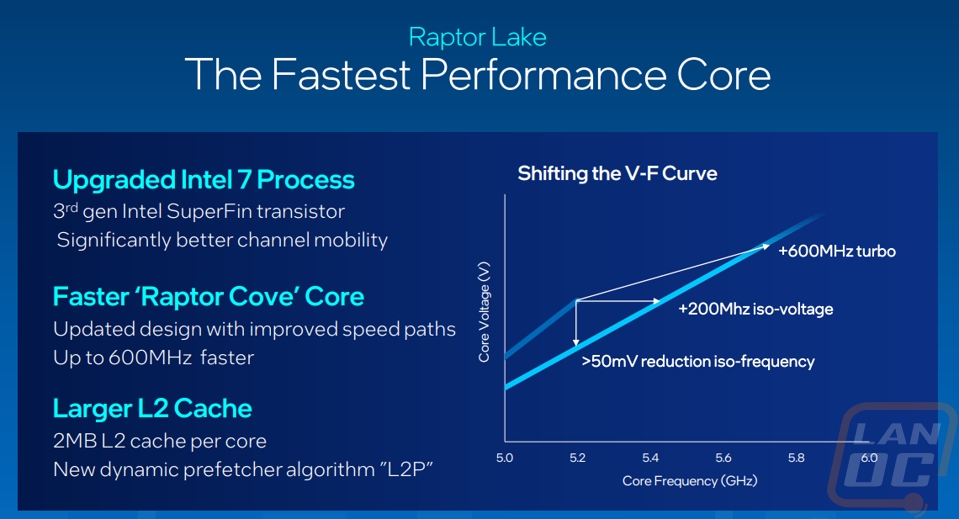
Manufacturing of the 13th Gen CPUs is on the same Intel 7 that the 12th Gen CPUs were on. Intel was able to improve core voltage optimization at higher frequencies which allows them to raise clock speeds up to 600 MHz faster in some cases. The new CPUs also have a larger L2 Cache as well. Beyond that, the software side of things has improved in the last year. Intel’s thread director has used machine learning to improve class boundaries and Windows itself has better optimization to the dual-core design with the new Windows 11 22H2 update.
Now while Intel sent over the i9-13900K and the i5-13600K, they did launch more than just those two CPUs. The 13900K is the flagship but they do have it paired up with an i9-13900KF which is the same CPU but does not come with the integrated graphics which saves you a little more with the 13900K being $589 vs $564 for the i9-13900KF. The i5-13600K has a matching F model without integrated graphics as well which is $25 less. Then there is also an i7 with the i7-13700K and the 13700KF. The 13700K falls in between the 13900K and the 13600K with 24 threads and its 12900K like 8 p-cores and 8 e-cores configuration. The 13700K has the same 253 turbo max power at the 13900K but does have lower clock speeds with the p-core mac at 5.4 GHz and the e-core at 4.2 GHz.
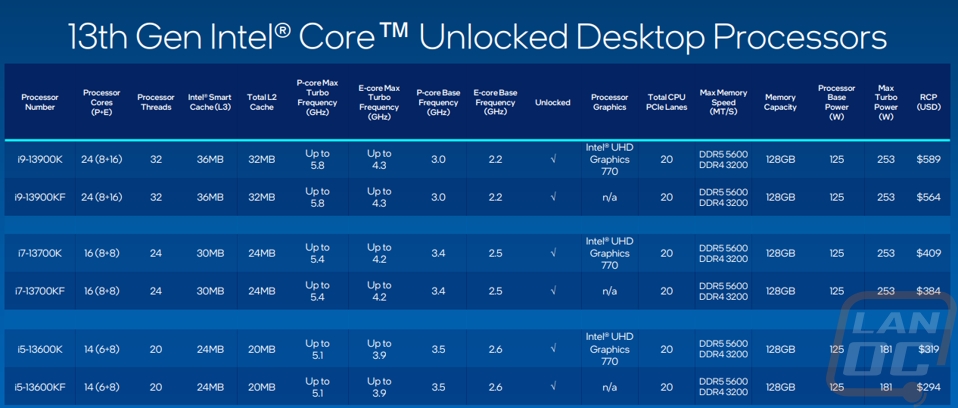
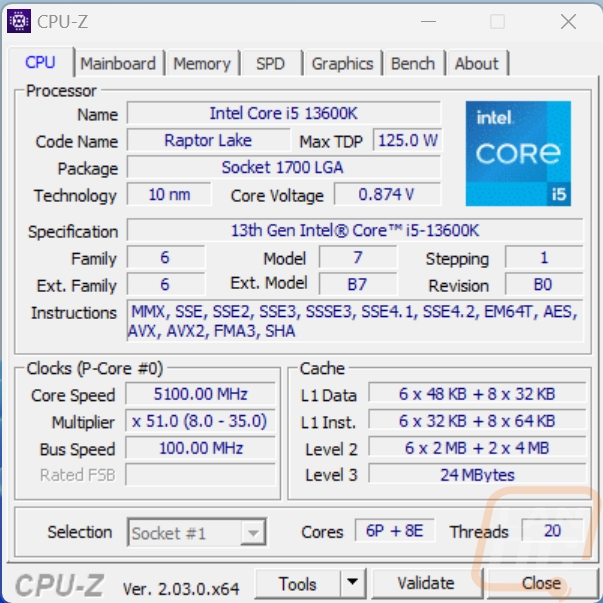
Because we have the i9-13900K and the i5-13600K both on hand I did want to dive into their specs a little and compare them with the i9-12900K and i5-12600K that we took a look at last year. Putting them next to each other we can see a few of the areas where Intel has changed things up for this generation. The biggest change when I already mentioned is the addition of more E-Cores this time around. The 13600K has 8 E-Cores whereas the i5-12600K had 4, the P-Core count is still at 6 just like before but the additional E-Cores bring the thread count up to 20. The i9-13900K doubled up its E-Core count as well going from 8 on the 12900K to 16 for a total of 32 threads. The P-Core count is still 8 just like before. Both increased their total L2 cache with the 12600K going from 20MB to 24MB and the 13900K going from 30MB to 36MB. Then Intel also bumped clock speeds up with the 13600K now at 5.1 GHz for the max turbo frequency, the E-Core turbo frequency increased from 3.6 GHz to 3.9 as well. But interestingly the base clock speed on the P-Cores was lowered from 3.7 GHz to 3.5 GHz and the E-Core went don’t to 2.6 GHz from 2.8 GHz. The 13900K saw an even bigger jump on the max turbo frequency with it now capable of 5.8 GHz from 5.2 GHz and the E-Core turbo at 4.3 GHz from 3.9 GHz. Its base clocks have also dropped from 3.2 GHz to 3.0 GHz on the P-Core and down to 2.2 GHz from 2.4 GHz on the E-Cores. To handle all of this the base power is still the same on both at 125 watts but the turbo power stock limits have increased to 181 watts on the 13600K and 253 watts on the 13900K. Beyond that, the integrated graphics are still running the same Intel UHD Graphics 770 but both received a small bump in clock speeds there as well. As for pricing, the i5-13600K did increase compared to the $289 MSRP of the 12600K up to $309 but the i9-13900K stayed the same at $589 as the 12900K which puts it in between the new AMD Ryzen 9 7900X at $549 and the Ryzen 9 7950X with its $699 MSRP.
|
|
I5-12600K |
I5-13600K |
i9-12900K |
i9-13900K |
|
Total Cores |
10 |
14 |
16 |
24 |
|
# of Performance Cores |
6 |
6 |
8 |
8 |
|
# of Efficient cores |
4 |
8 |
8 |
16 |
|
Total Threads |
16 |
20 |
24 |
32 |
|
Max Turbo Frequency |
4.9 GHz |
5.1 GHz |
5.2 GHz |
5.8 GHz |
|
Efficient-core Max Turbo Frequency |
3.6 GHz |
3.9 GHz |
3.9 GHz |
4.3 GHz |
|
Performance-core Base Frequency |
3.7 GHz |
3.5 GHz |
3.2 GHz |
3.0 GHz |
|
Efficient-core Base Frequency |
2.8 GHz |
2.6 GHz |
2.4 GHz |
2.2 GHz |
|
Cache |
20 MB Intel Smart Cache |
24 MB Intel Smart Cache |
30 MB Intel Smart Cache |
36 MB Intel Smart Cache |
|
Total L2 Cache |
9.5 MB |
20 MB |
14 MB |
32 MB |
|
Processor Base Power |
125 Watts |
125 Watts |
125 Watts |
125 Watts |
|
Maximum Turbo Power |
150 Watts |
181 Watts |
241 Watts |
253 Watts |
|
Processor Graphics |
Intel UHD Graphics 770 |
Intel UHD Graphics 770 |
Intel UHD Graphics 770 |
Intel UHD Graphics 770 |
|
Graphics Base Frequency |
300 MHz |
300 MHz |
300 MHz |
300 MHz |
|
Graphics Max Dynamic Frequency |
1.45 GHz |
1.5 GHz |
1.55 GHz |
1.65 GHz |
|
Socket |
LGA1700 |
LGA1700 |
LGA1700 |
LGA1700 |
|
MSRP |
$289 |
$309 |
$589 |
$589 |
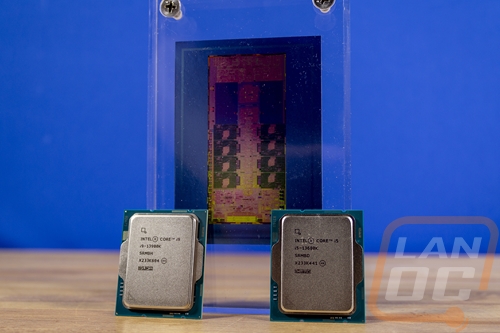
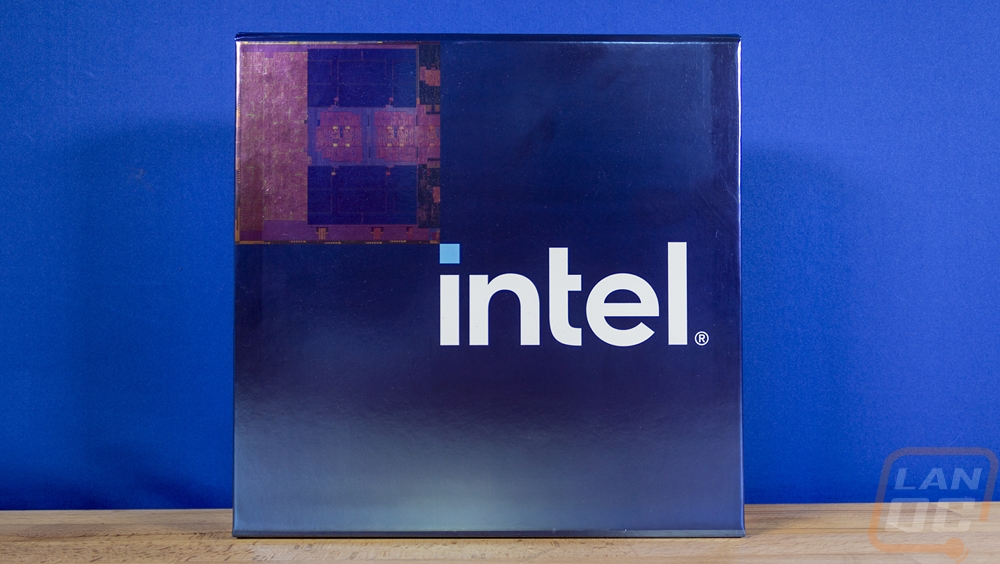
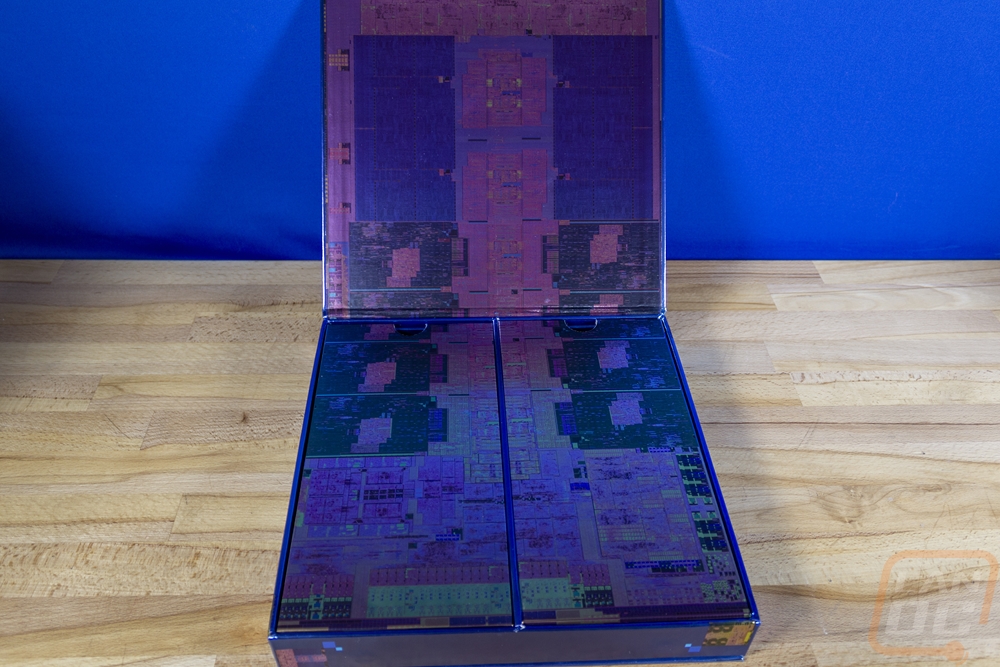
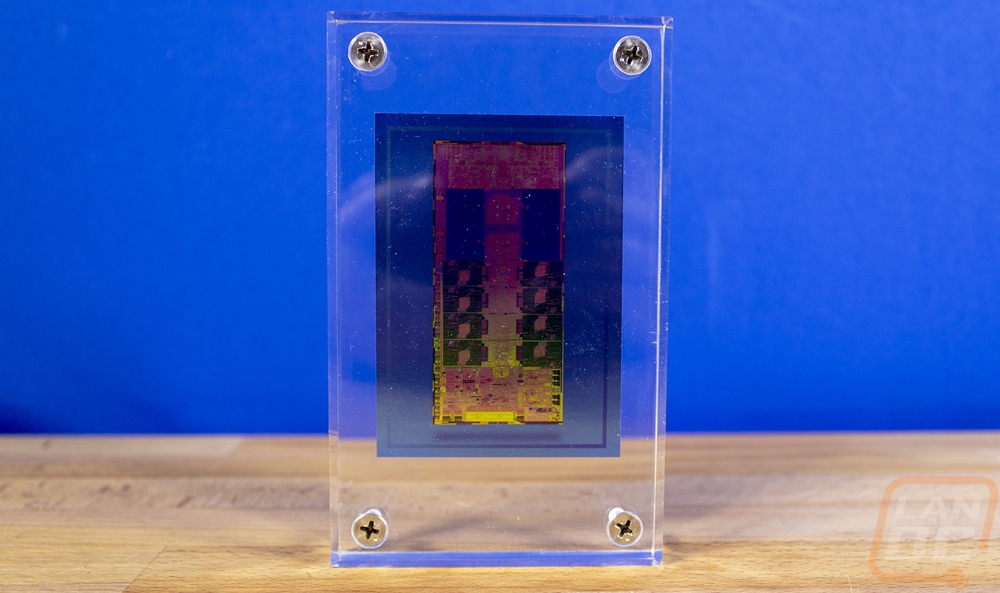
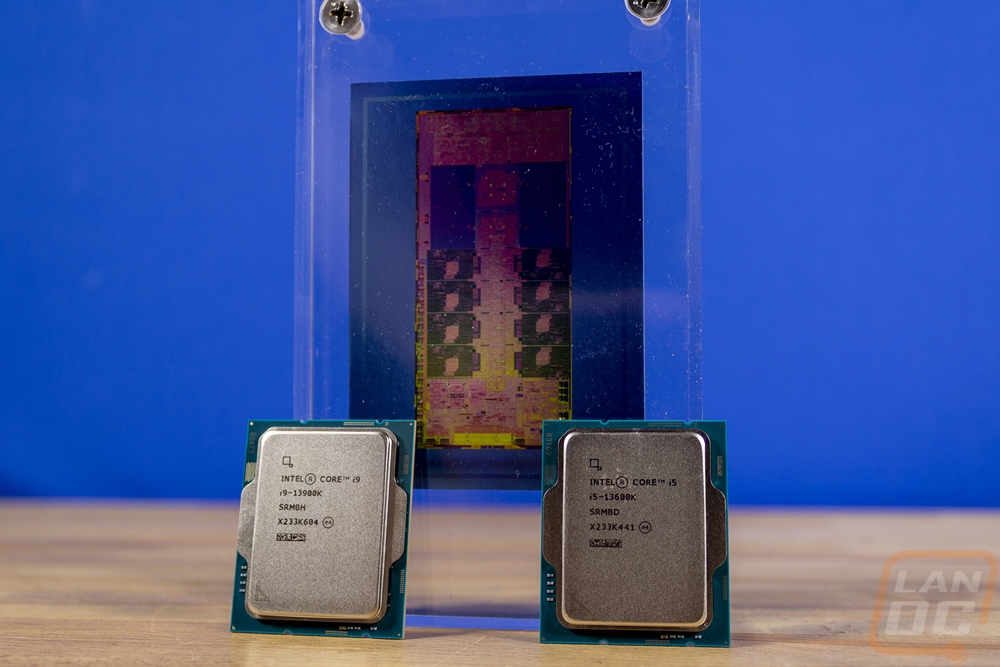
For the launch Intel didn’t just send over the two CPUs, they put together a cool set for the press kit like they have done with previous launches. They came in a box with the Intel branding on the front with a metallic finish that has the die image of the CPU on it. When you open the box up there are larger zoomed in die images with panels that cover up two compartments. These cover a compartment that has both CPUs and a second that has an acrylic keepsake that has a card with the die printed on it.
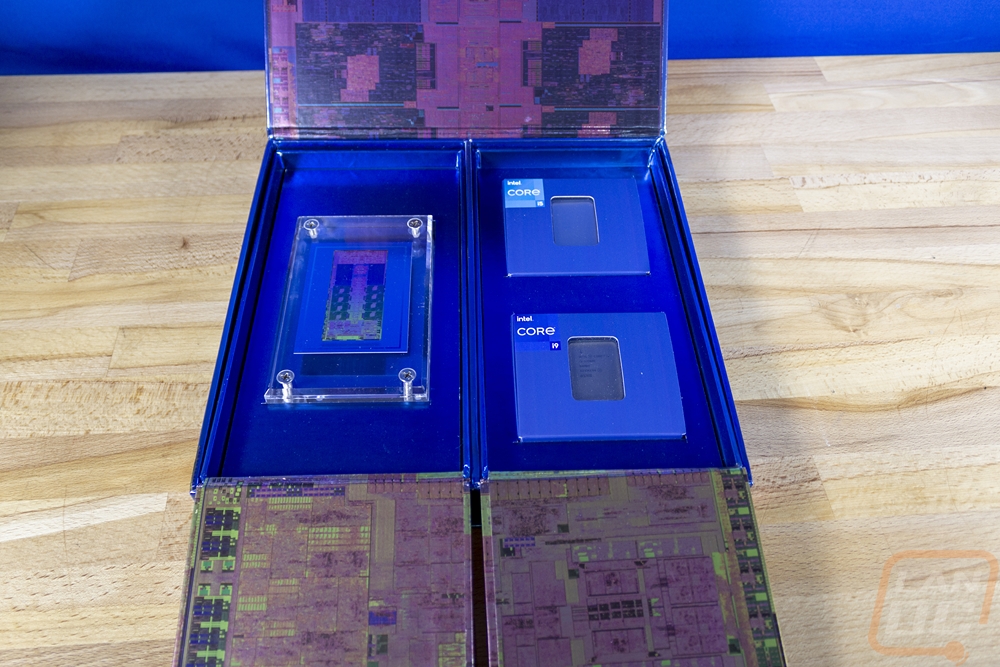
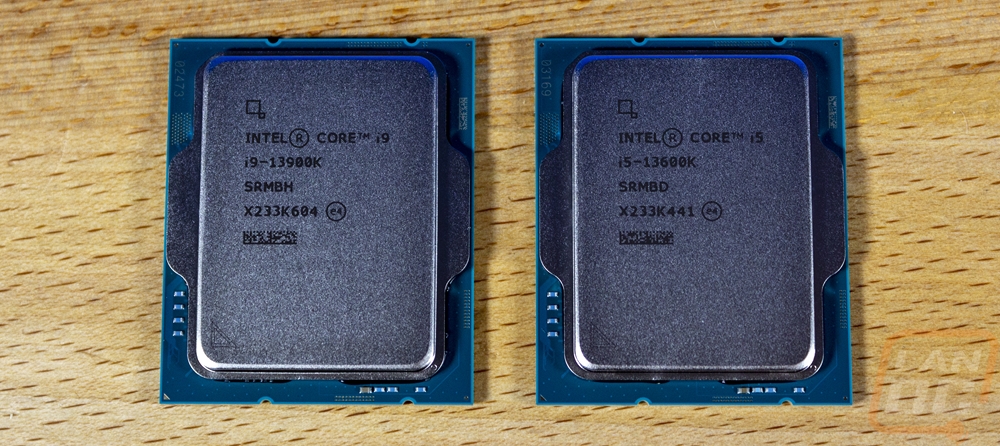
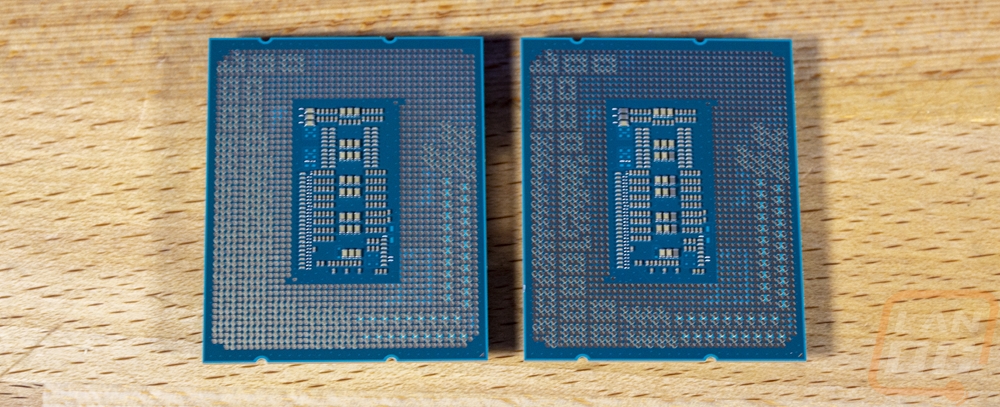
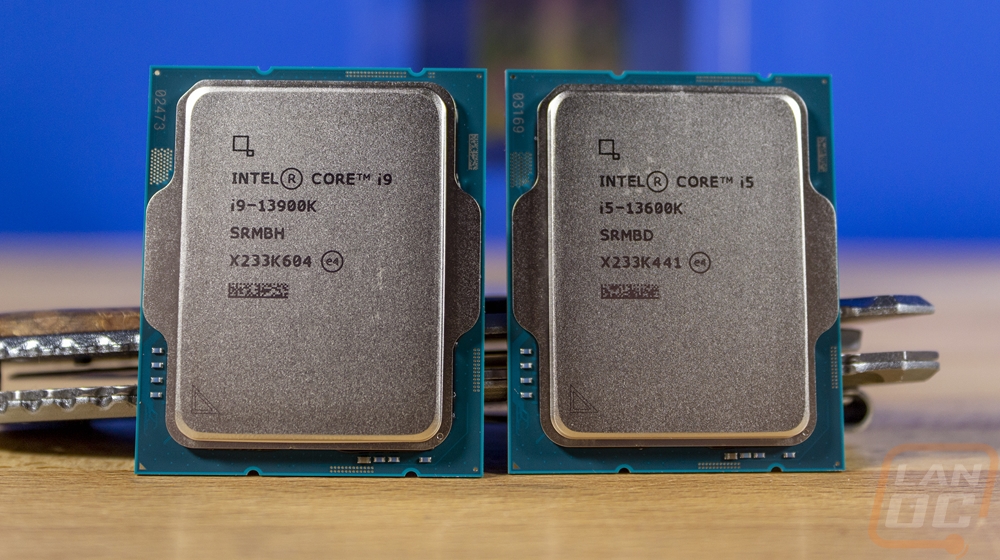
For the CPUs, Intel included the new flagship, the i9-13900K as well as the mid-range CPU, the i5-13600K which is the same combination as they have sent in the past as well. The new CPUs are the same LGA 1700 socket as the 12th-generation CPUs which means they have the same rectangle shape. They don’t have a crazy X-shaped heatspreader like AMD has gone with, they have the standard heatspreader with the model name laser etched on the top. I do wish they would do a larger Intel logo like how AMD does with their Ryzen branding but let’s be honest it will be under a cooler its entire life anyhow so it isn’t a big deal. Being an LGA socket the pins are on the motherboard and the CPU has contact pads on the bottom just like in the past. Beyond the model name etched on top, these don’t look any different than the 12th gen CPUs.
Test Rig and Procedures
Test System
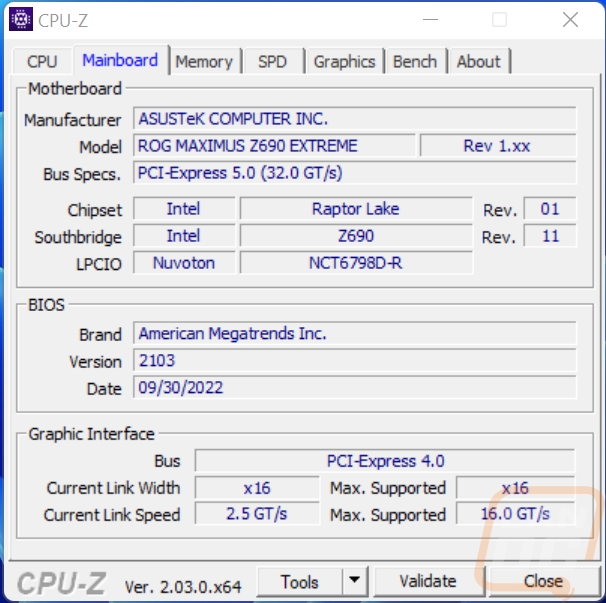
Motherboard: ASUS ROG Maximus Z690 Extreme – Live Pricing
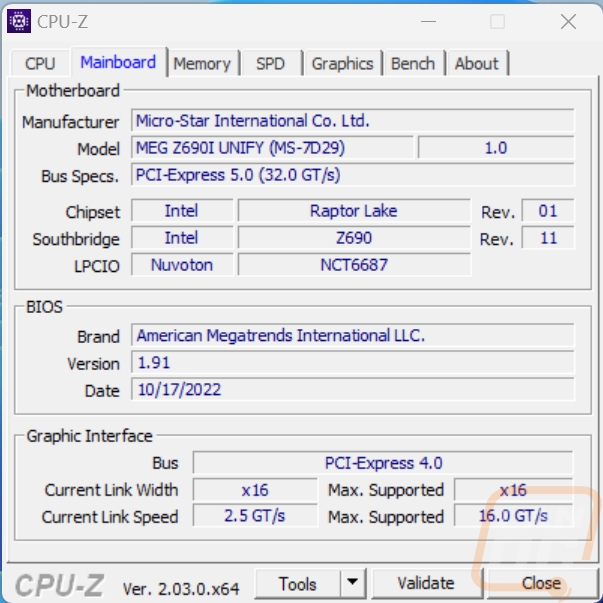
Also used MSI MEG Z690I UNIFY Gaming Motherboard – Live Pricing
Cooling: Corsair iCUE H100i ELITE LCD Liquid CPU Cooler - Live Pricing
Noctua NT-H1 Thermal Paste - Live Pricing
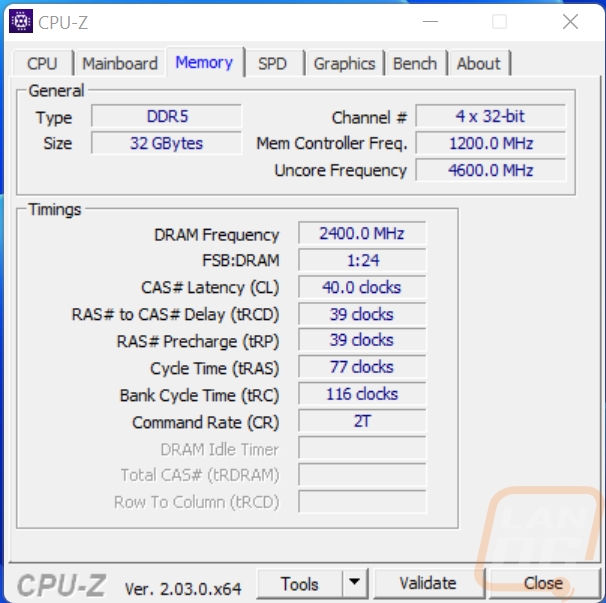
Memory: Crucial 32GB Kit (2 x 16GB) DDR5-4800 UDIMM– Live Pricing
Storage: Sabrent Rocket Q4 2TB – Live Pricing
Video Card: Nvidia RTX 3070 FE - Live Pricing
Power Supply: Corsair AX1200 - Live Pricing
Case: Primochill Wetbench - Live Pricing
OS: Windows 11 Pro 64-bit - Live Pricing
Here are the GPUz screenshots from our testing as well. Our Z690 Extreme died at the end of testing the 13900K and I had to switch over to the smaller ITX Z690I UNIFY for the 13600K. Both were tested with the XMP turned on for the memory, PL1/PL2 settings as well as CPU amperage limits set to Intel’s recommendations (PL1/2 set to 181 on the 13600K and 253 for the 13900K and CPU amps set to 307 for the 13900K and 200 for the 13600K. Both boards had their BIOS updated to the latest at the time of testing to be able to support the new CPUs.

|
CPU Testing Procedures+BB3:C31 |
|
|
Team Fortress 2 |
|
|
Tom Clancy's Ghost Recon: Wildlands |
Built-in Benchmark, 1080p, High detail setting |
|
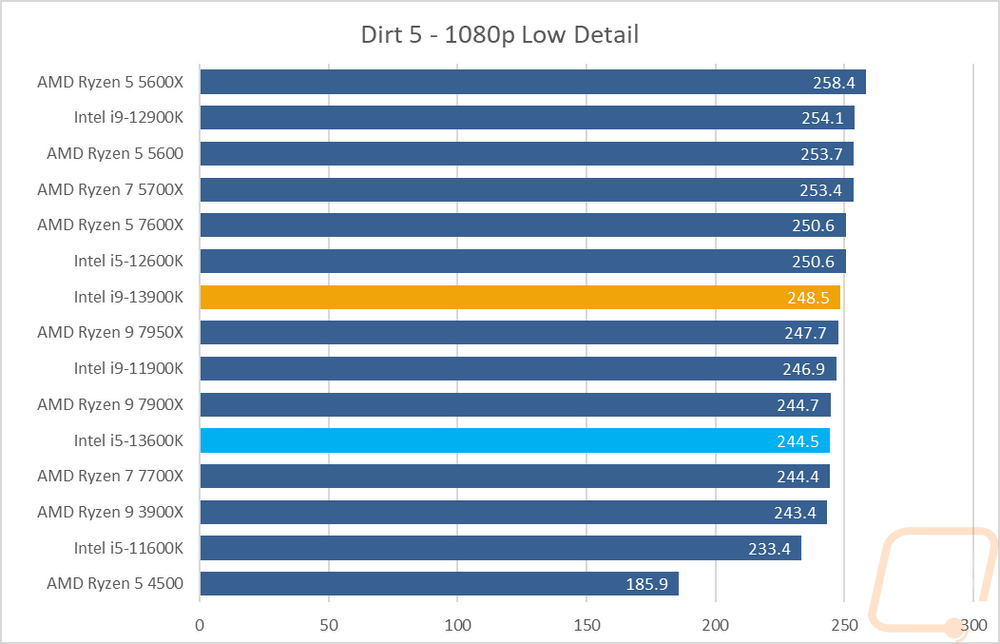
Dirt 5 |
built-in benchmark, running at 1080p on all three resolution settings, V-Sync is turned off, dynamic resolution is turned off, and on the low detail setting |
|
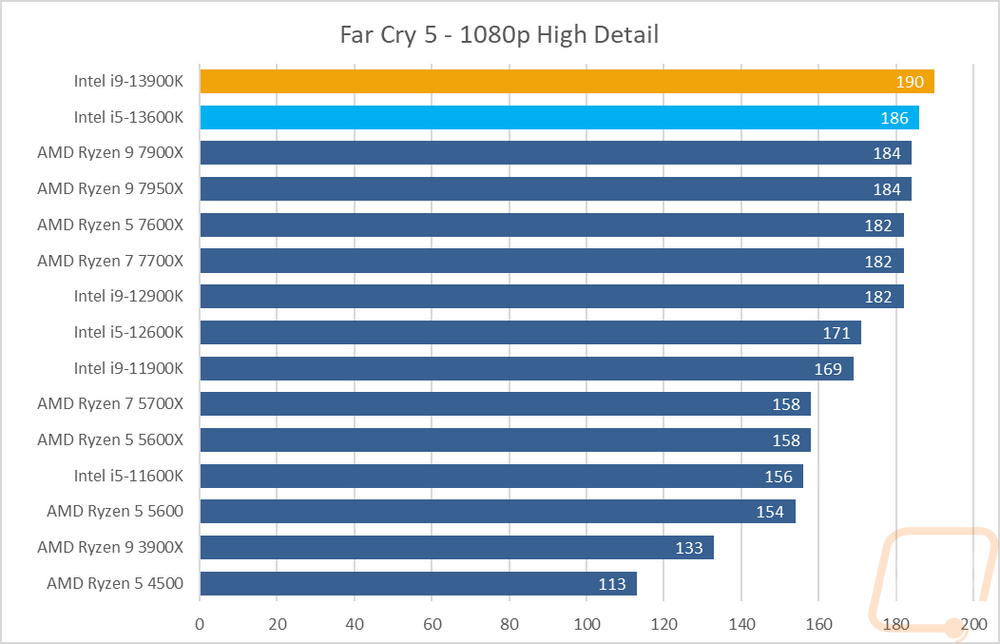
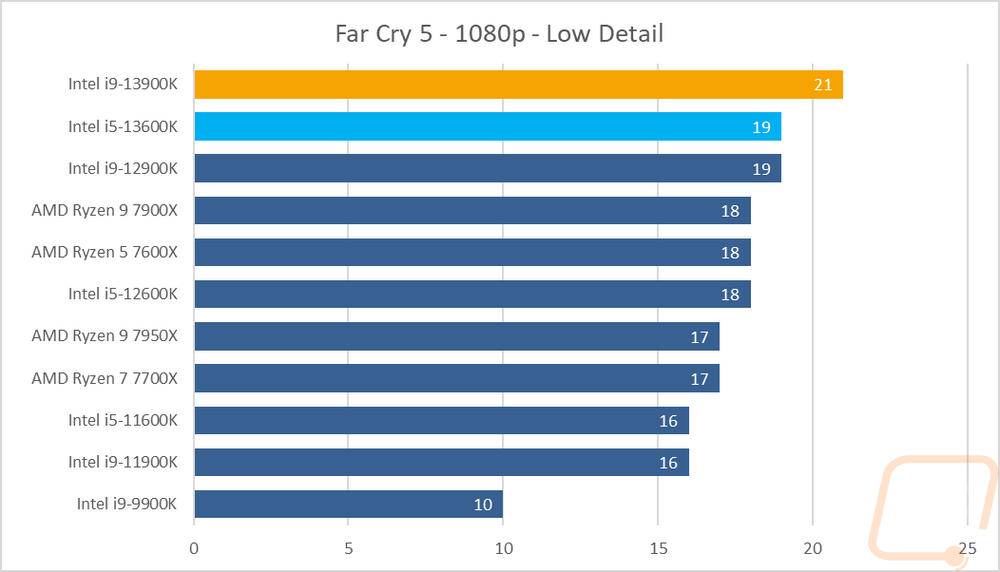
Far Cry 5 |
1080p with High Detail setting using the built-in benchmark |
|
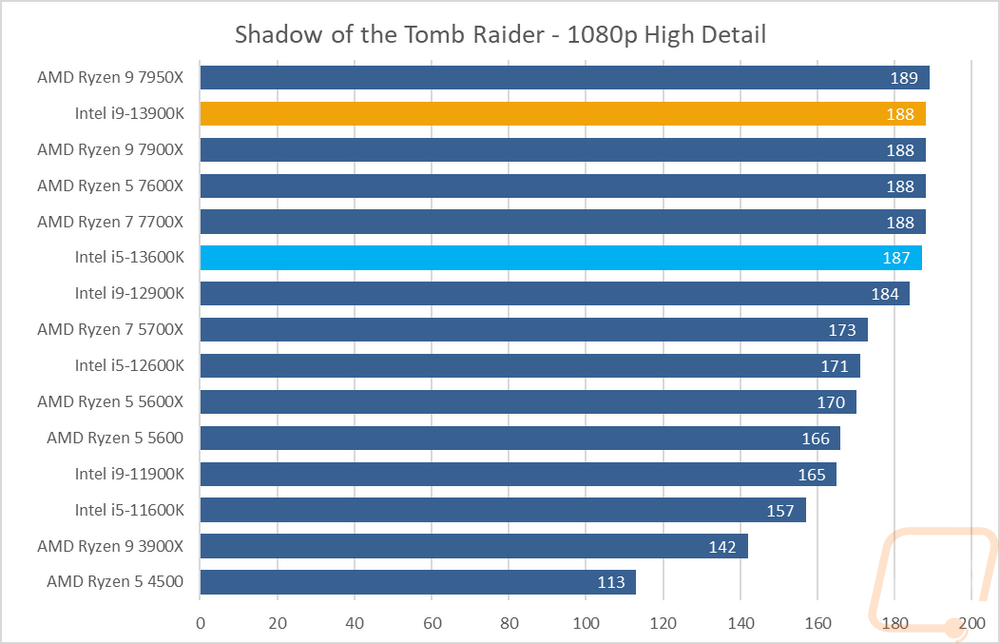
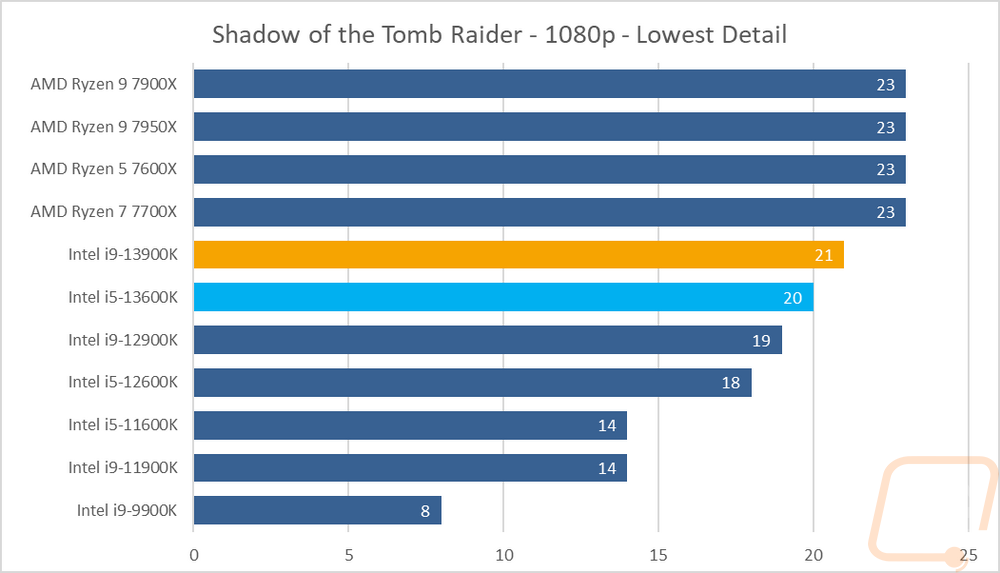
Shadow of the Tomb Raider |
built-in benchmark, 1080p, high detail setting, RTX/DLSS Off |
|
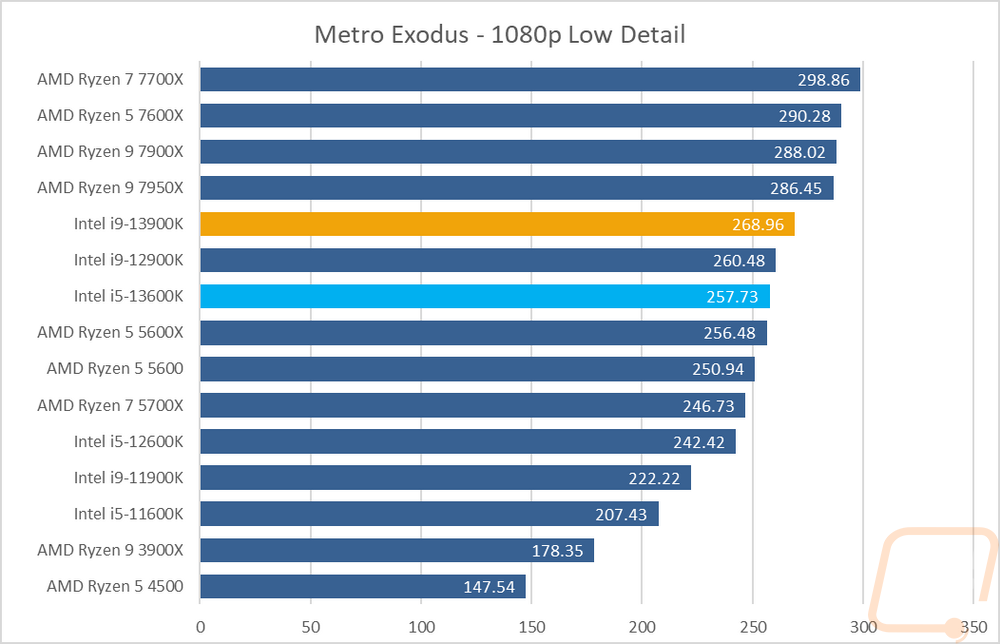
Metro Exodus |
Default benchmark low setting |
|
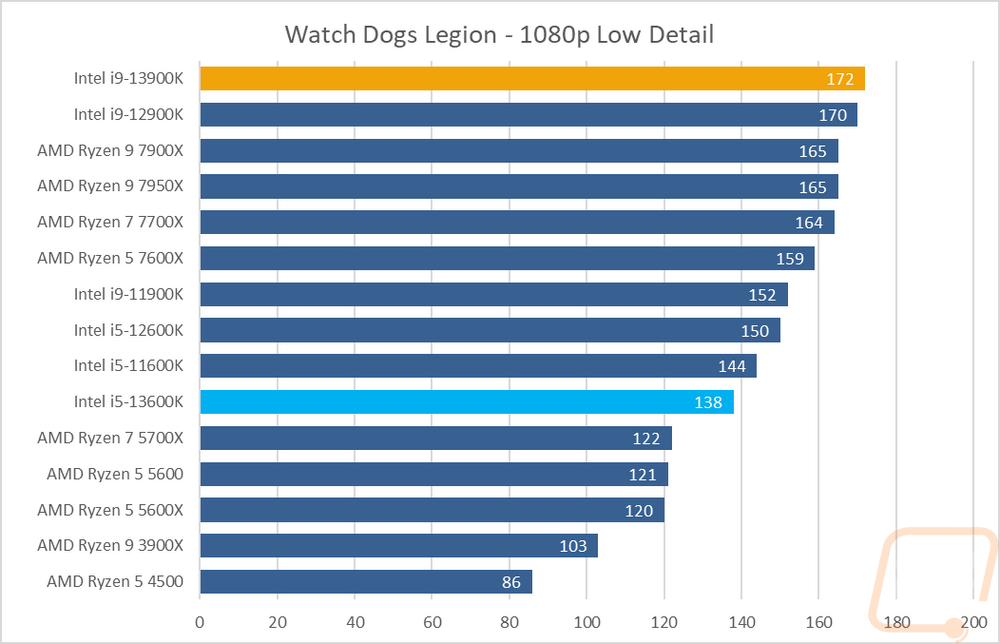
Watch Dogs Legion |
1080p, dx12, medium detail |
|
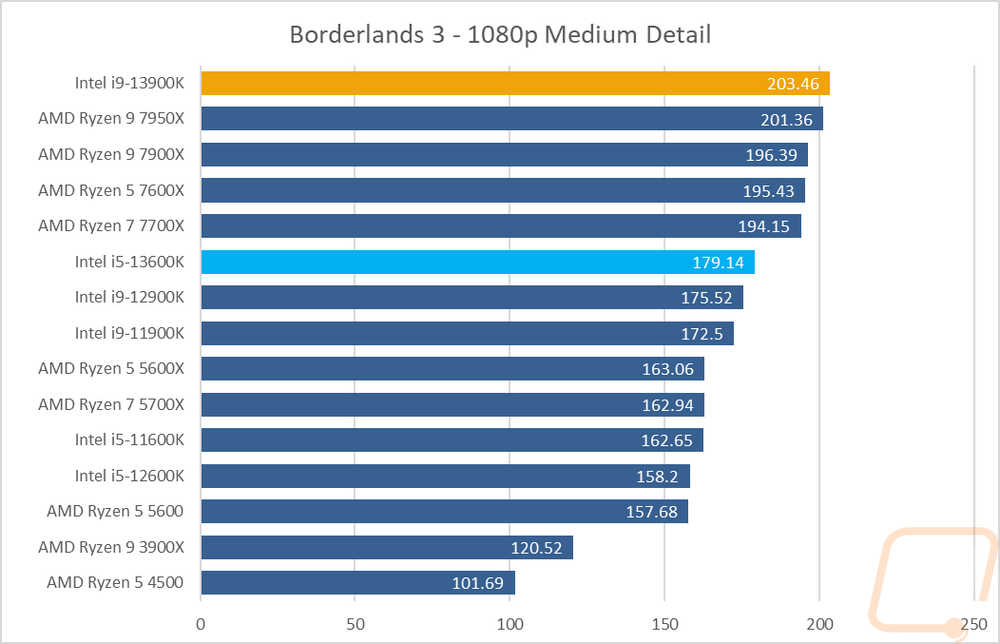
Borderlands 3 |
built-in benchmark. fullscreen, 1080p, medium quality, dx11 |
|
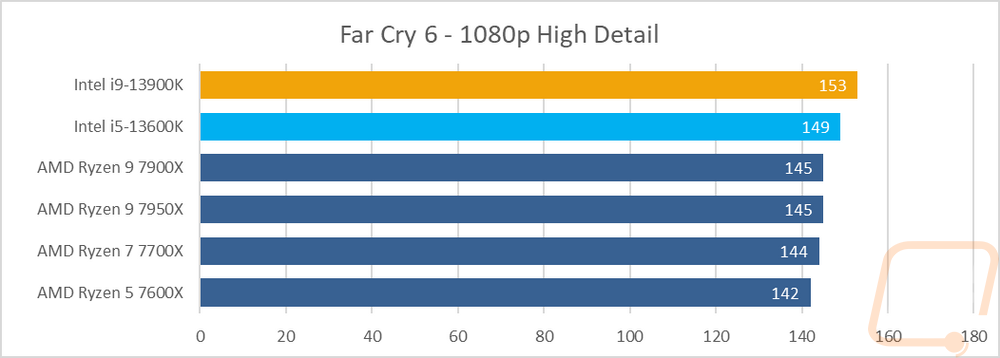
Far Cry 6 |
1080p with High Detail setting using the built-in benchmark |
|
Dolphin 5.0 Benchmark |
|
|
3DMark |
Fire Strike - Physics Score – Performance benchmark, Time Spy - CPU Score, and CPU Profile test |
|
7-Zip |
Built-in benchmark set to 32MB, run 4 or more passes. Combined MIPS, Compressing, and Decompressing scores all used. Just the Current result, not the resulting |
|
Jetstream |
|
|
wPrime |
1024M |
|
Crossmark |
Crossmark overall score |
|
Cinebench R20 |
CPU and CPU (Single Core results) |
|
Cinebench R23 |
CPU and CPU (Single Core results) |
|
CPUz |
CPUz's built-in benchmark, both single and multi-core scores |
|
Passmark 10 |
CPU Mark Score |
|
PCMark 10 |
Normal test ran, not the express or extended |
|
Procyon |
Office productivity benchmark is done with the current Microsoft Office 365, Photo Editing Benchmark is done with Adobe Photoshop and Lightroom Classic. Video Editing Benchmark uses Adobe Premiere Pro. All adobe products are running on the latest version at the time of testing |
|
V-Ray Benchmark 1.0.8 |
CPU Benchmark time used as the score |
|
V-Ray Benchmark 5.0.2 |
vsamples score |
|
POV-Ray |
Using built-in benchmark. Settings are all set to the "Standard Benchmark Switches" listed on http://www.povray.org/download/benchmark.php |
|
Handbrake |
Tested using 2d 4k 60 FPS version, resized using the Fast 1080p30 preset, average FPS used. Here is the file download location http://bbb3d.renderfarming.net/download.html |
|
Blender |
Using new official benchmark using 3.1.0 |
|
AIDA64 |
Memory, Cache, and FLOPS testing done with built-in GPGPU and Memory benchmarks |
|
Temps |
Aida64 FPU stability test to load and to record temperature readings |
|
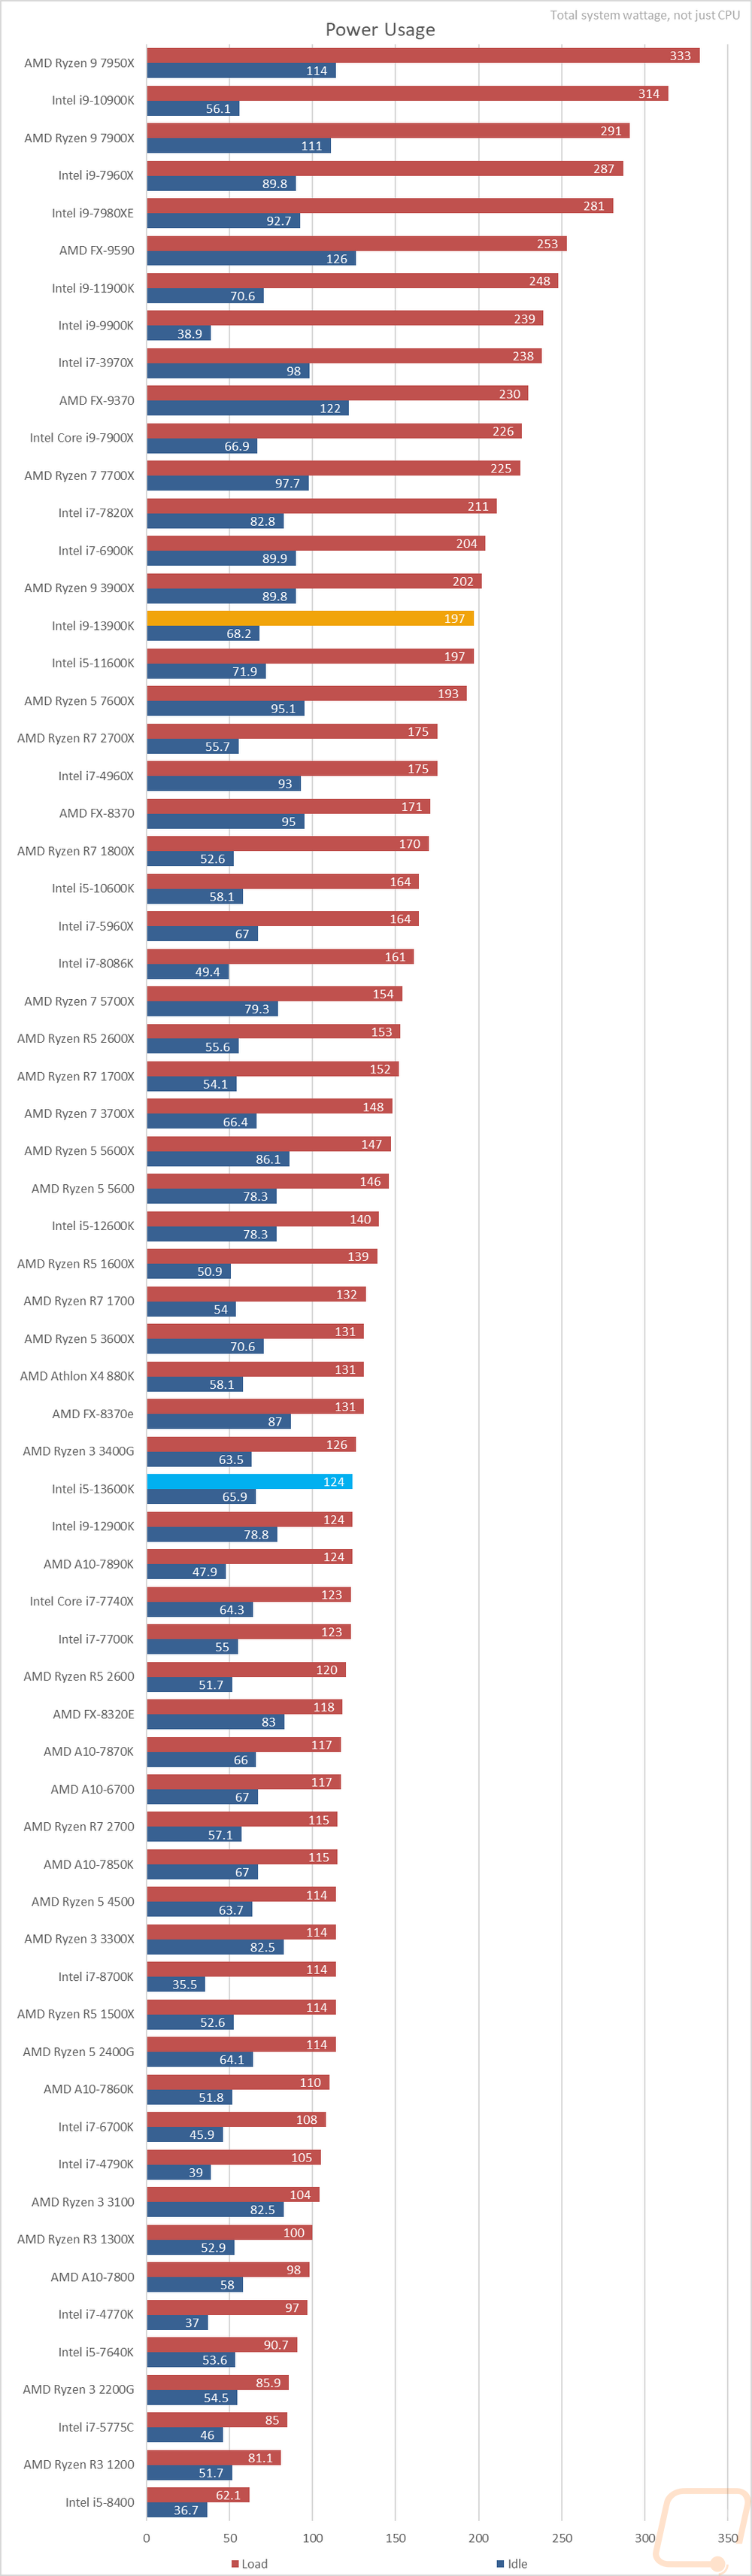
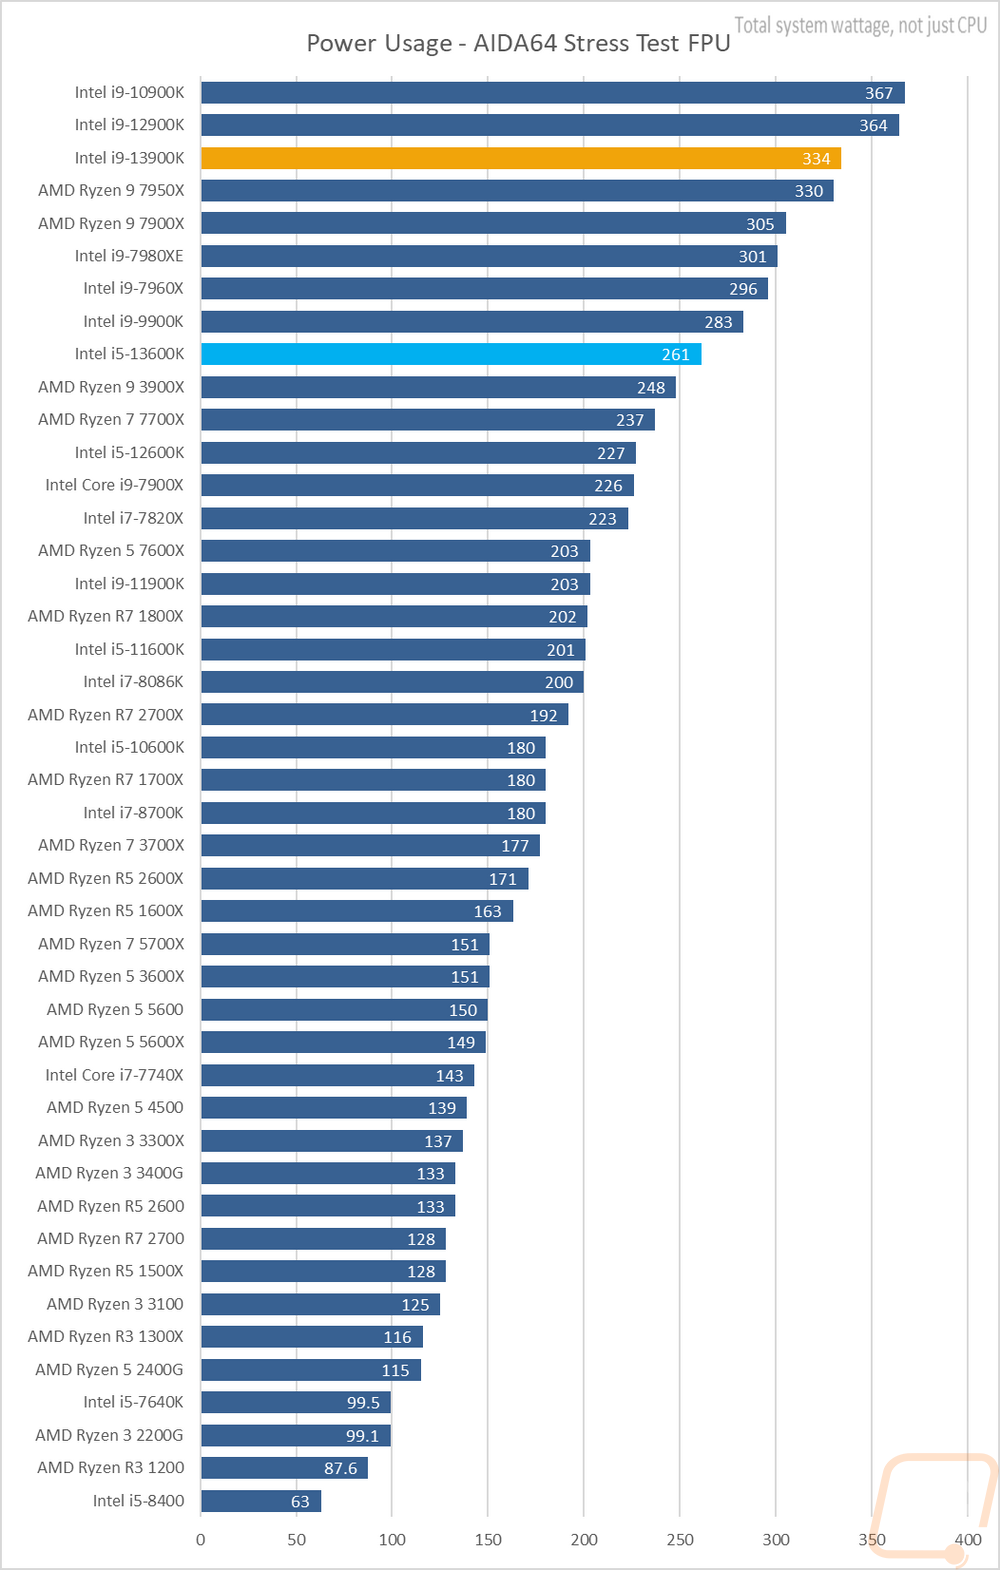
Power Usage |
Idle and load testing using a Kill-A-Watt and wPrime to put the CPU under load and again with the AIDA64 FPU CPU workload |
|
Onboard Testing Procedures |
|
|
Borderlands 3 |
In-Game benchmark, 1080p, Low detail preset |
|
Tomb Raider |
Adrenaline Action Benchmark Tool on the “Medium” quality setting at 1080p |
|
Hitman: Absolution |
Adrenaline Action Benchmark Tool on the “Medium” quality setting at 1080p |
|
Far Cry 5 |
1080p, Lowest Detail setting, In game benchmark |
|
Shadow of the Tomb Raider |
1080p, Low Detail setting, In game benchmark, RTX/DLSS off |
|
Team Fortress 2 |
1080p – high, very high, high, reflect world, high, enabled, 8x msaa, x16, multicore on. https://bit.ly/2vOebin |
|
Unigine Superposition |
720p Low and 1080p Medium settings |
|
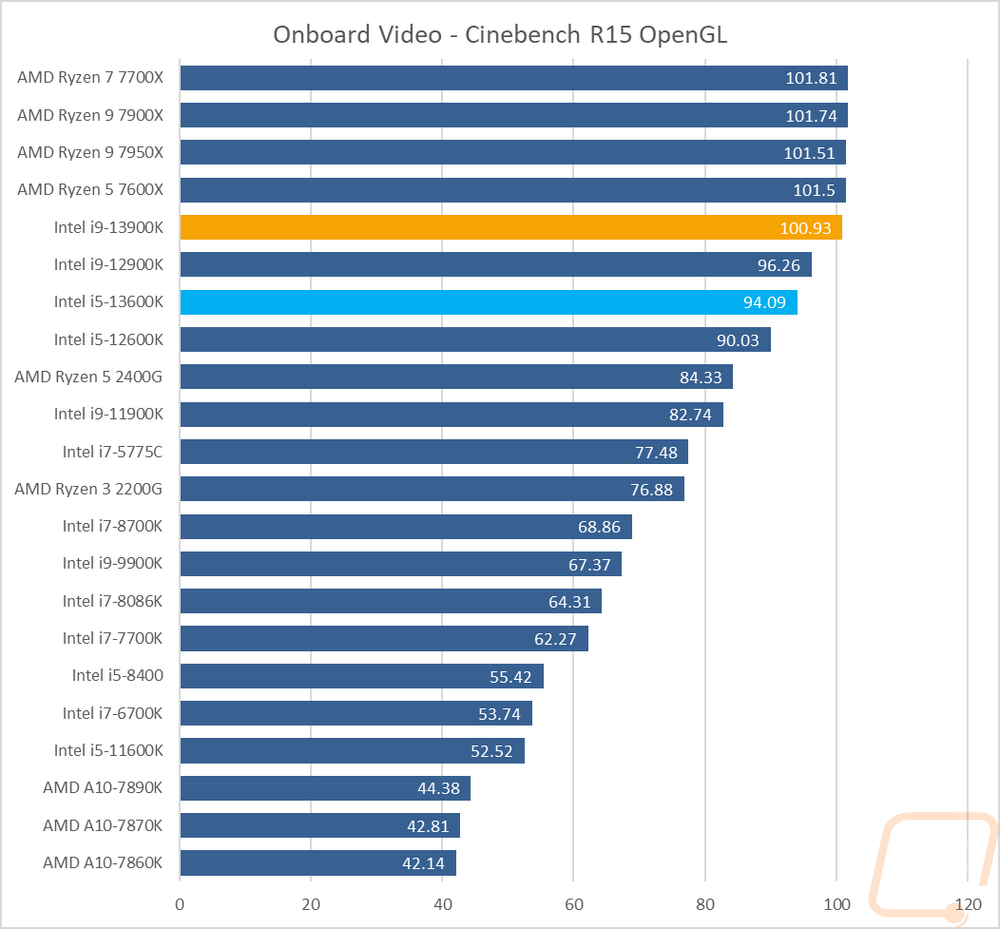
Cinebench R15 |
OpenGL benchmark |
|
3DMark Fire Strike |
Performance setting – GPU Score |
|
3DMark Time Spy |
GPU Score |
|
Tom Clancy's Ghost Recon: Wildlands |
Built-in Benchmark, 1080p, Low detail setting |
CPU Performance
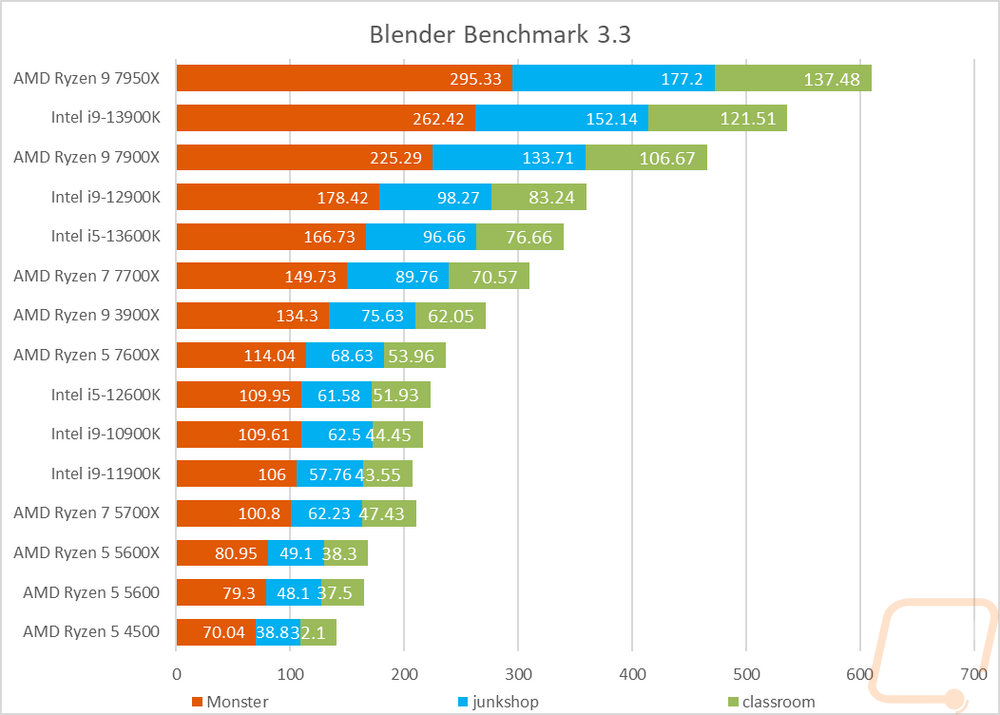
To start testing off I went with a rendering-focused benchmark with the always popular Blender. This benchmark was recently updated so our result list is smaller here. I have all three tests stacked together so we can see an overall of them altogether. Blender loves the higher core counts so it isn’t a surprise that the 16 core Ryzen 9 7950X is at the top here but the 13900K is next down the list. Both CPUs have the same thread count of 32, but the 7950X has full-sized cores for its 16 cores whereas the 13900K has its mixed P and E cores with the E-Cores not having hyper-threading. The big news in this test is with the 13600K coming in just behind last year's flagship 12900K and ahead of the Ryzen 7 7700X which is a more expensive CPU.
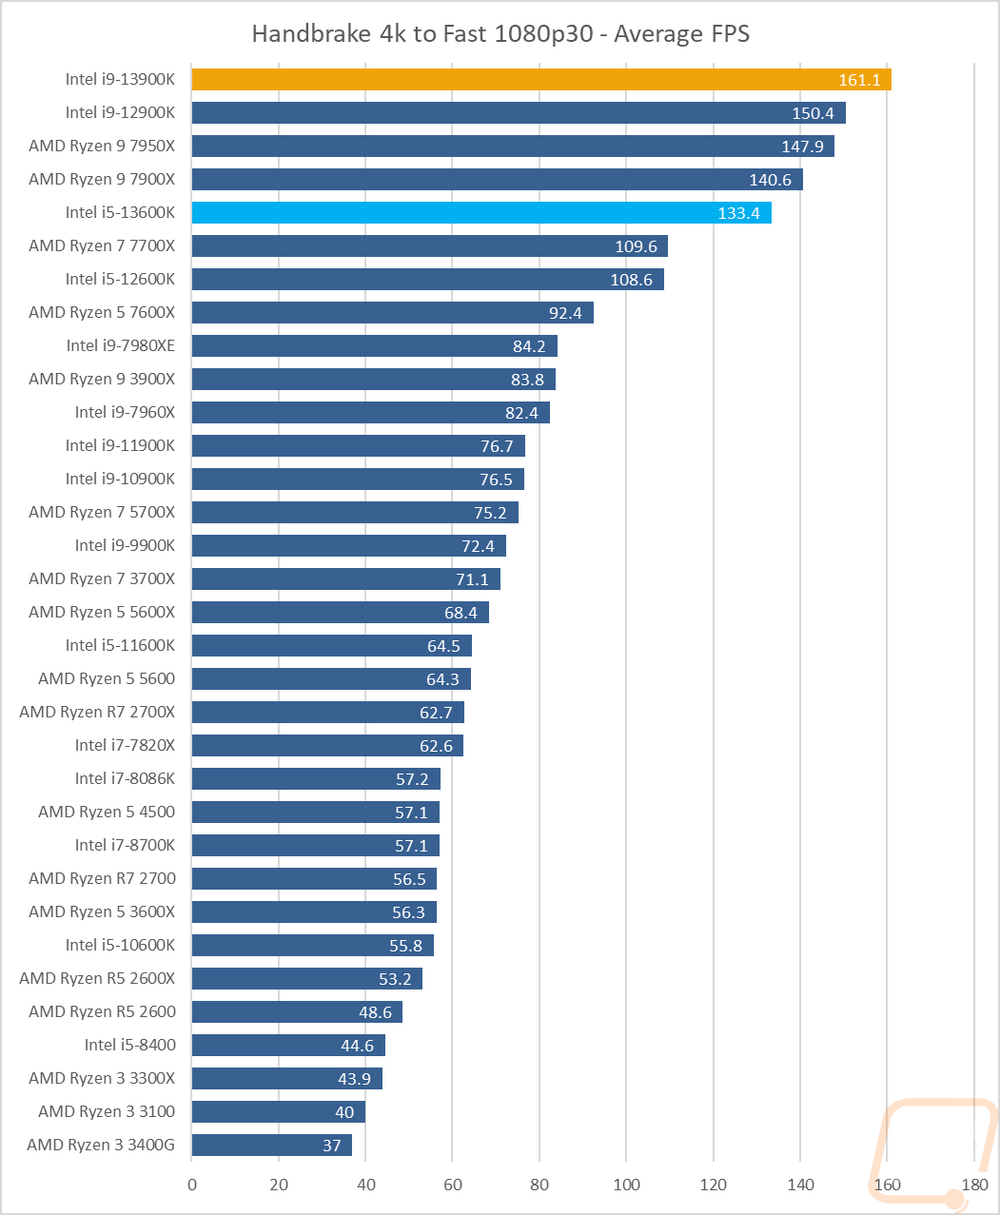
Continuing with the video encoding theme I also have Handbrake which is an open-source transcoder. For this test I am taking a 4k video down to 1080p 30 FPS, the results are the average FPS of that task. The Intel i9-13900K sits at the top of the chart here by 11 FPS over last year's 12900K with AMDs 7950X in third. Even the 13600K has a big improvement here with it gaining almost 25 FPS over last year's 12600K putting it up close to the $549 7900X.
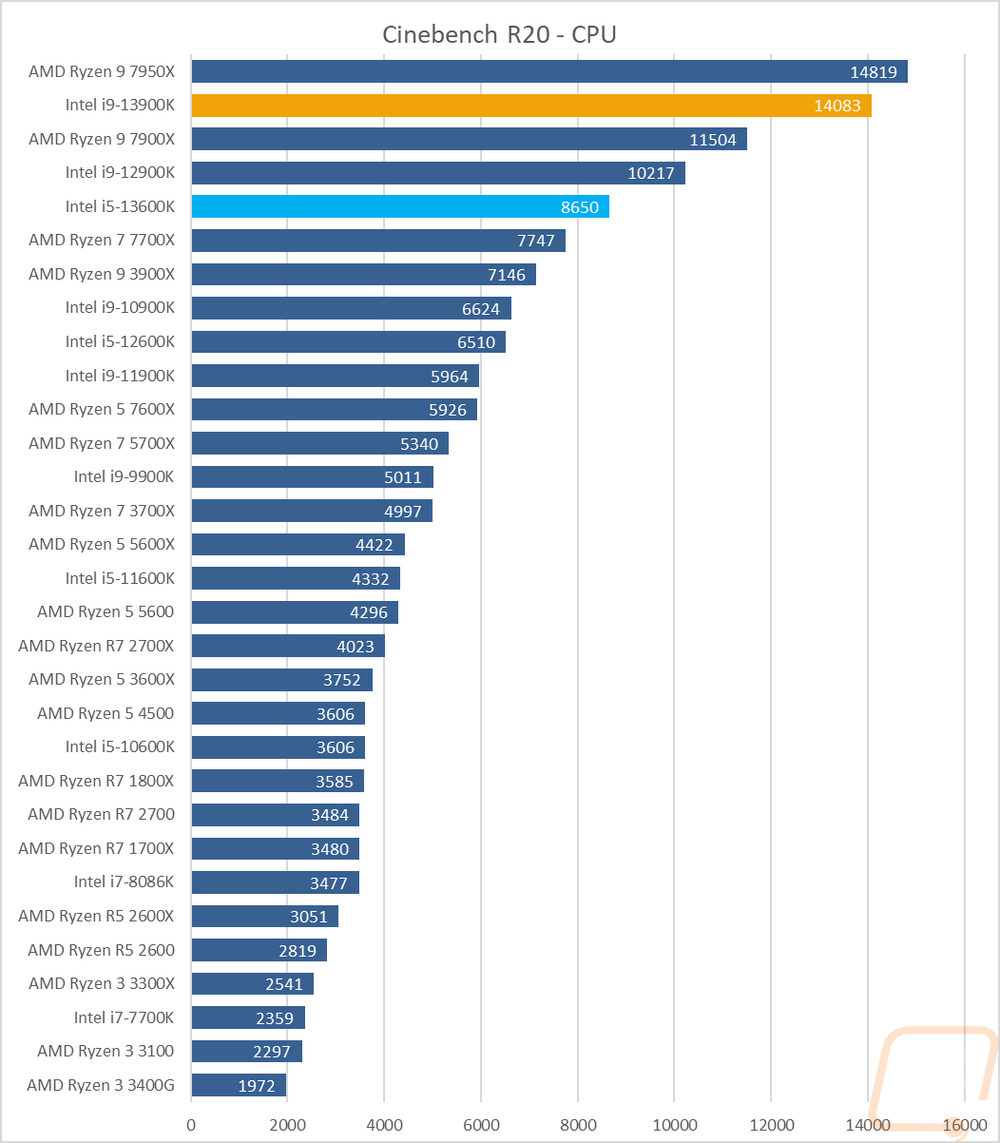
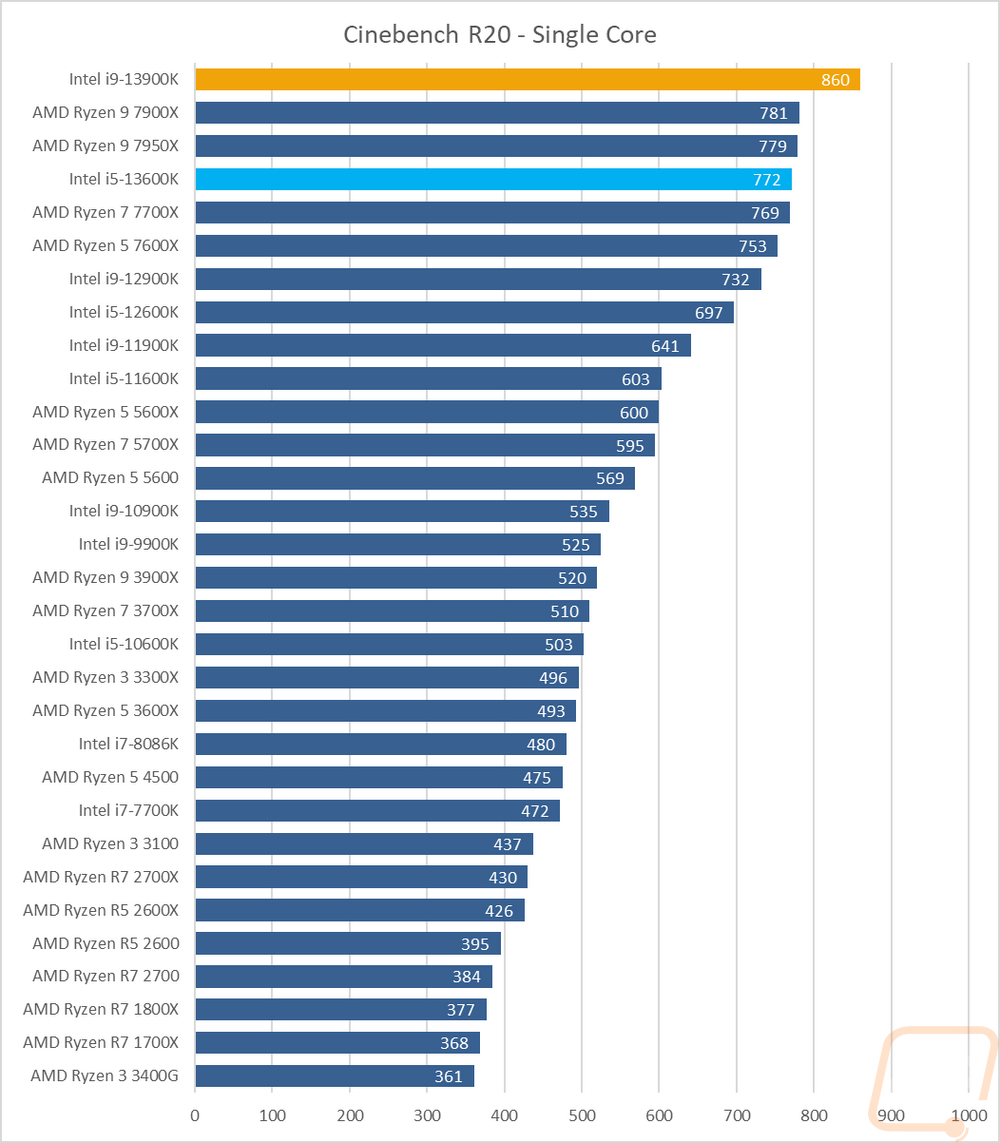
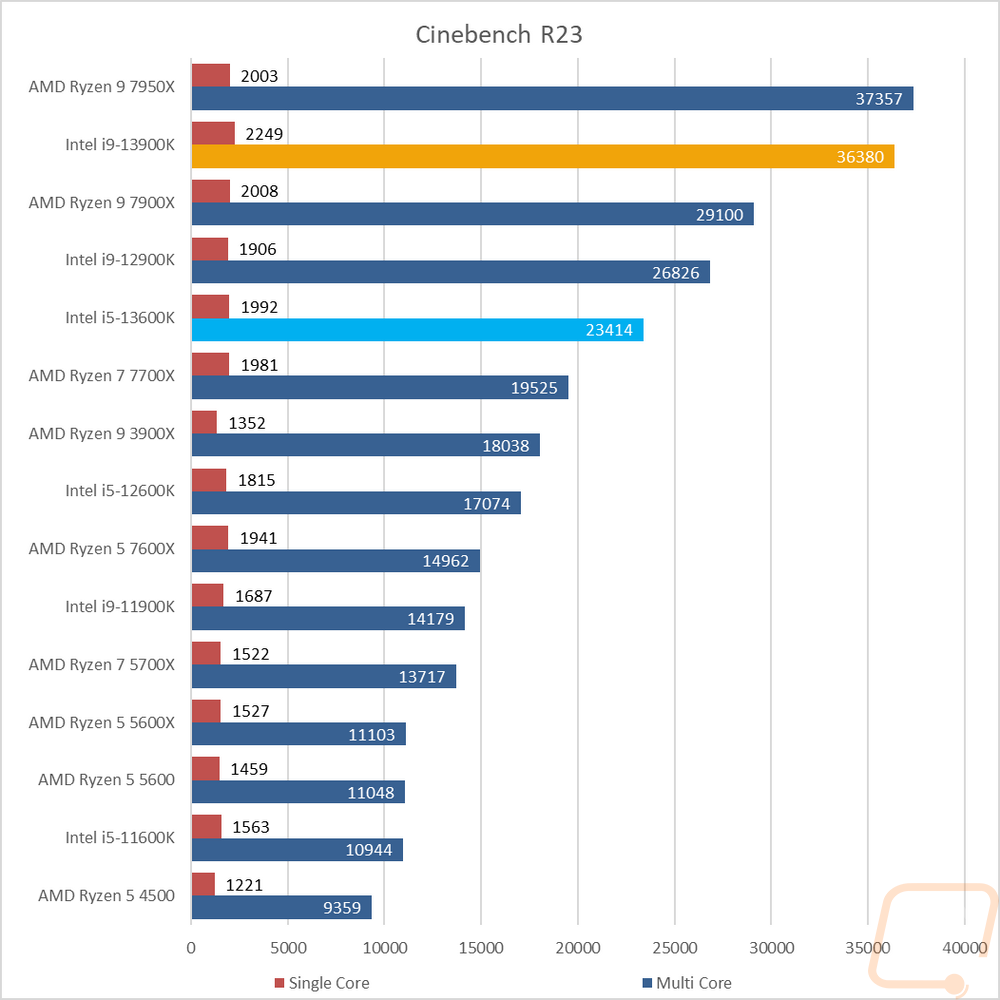
For the always popular Cinebench, I have finally retired the old R15 tests but I am still testing with the current R23 and the slightly older Cinebench R20. I always like Cinebench because we have multi-core and single-core performance which gives us a good look at the performance of the whole CPU and IPC performance. In R20 on the multi-core test, the 7950X with its 16 full-sized cores is still the king but the 13900K is a lot closer there than I would have expected with a big gap between it and the 7900X. The 13600K on the other hand sits between the 7700X and the older 12900K. But for the single-core test, the 13900K with its crazy 5.8 GHz max turbo clock speed is way out in front of everything else tested. The 13600K is in the middle of all of the new 7000 series Ryzen CPUs and 40 points ahead of last year's 12900K. Then in Cinebench R23, the results look similar with the 7950X and 13900X way out ahead of everything else in the multi-core test, and the 7950X is still in the lead there. But single core performance once again has the 13900K in its own class and the 13600K again ahead slightly of the 12900K.
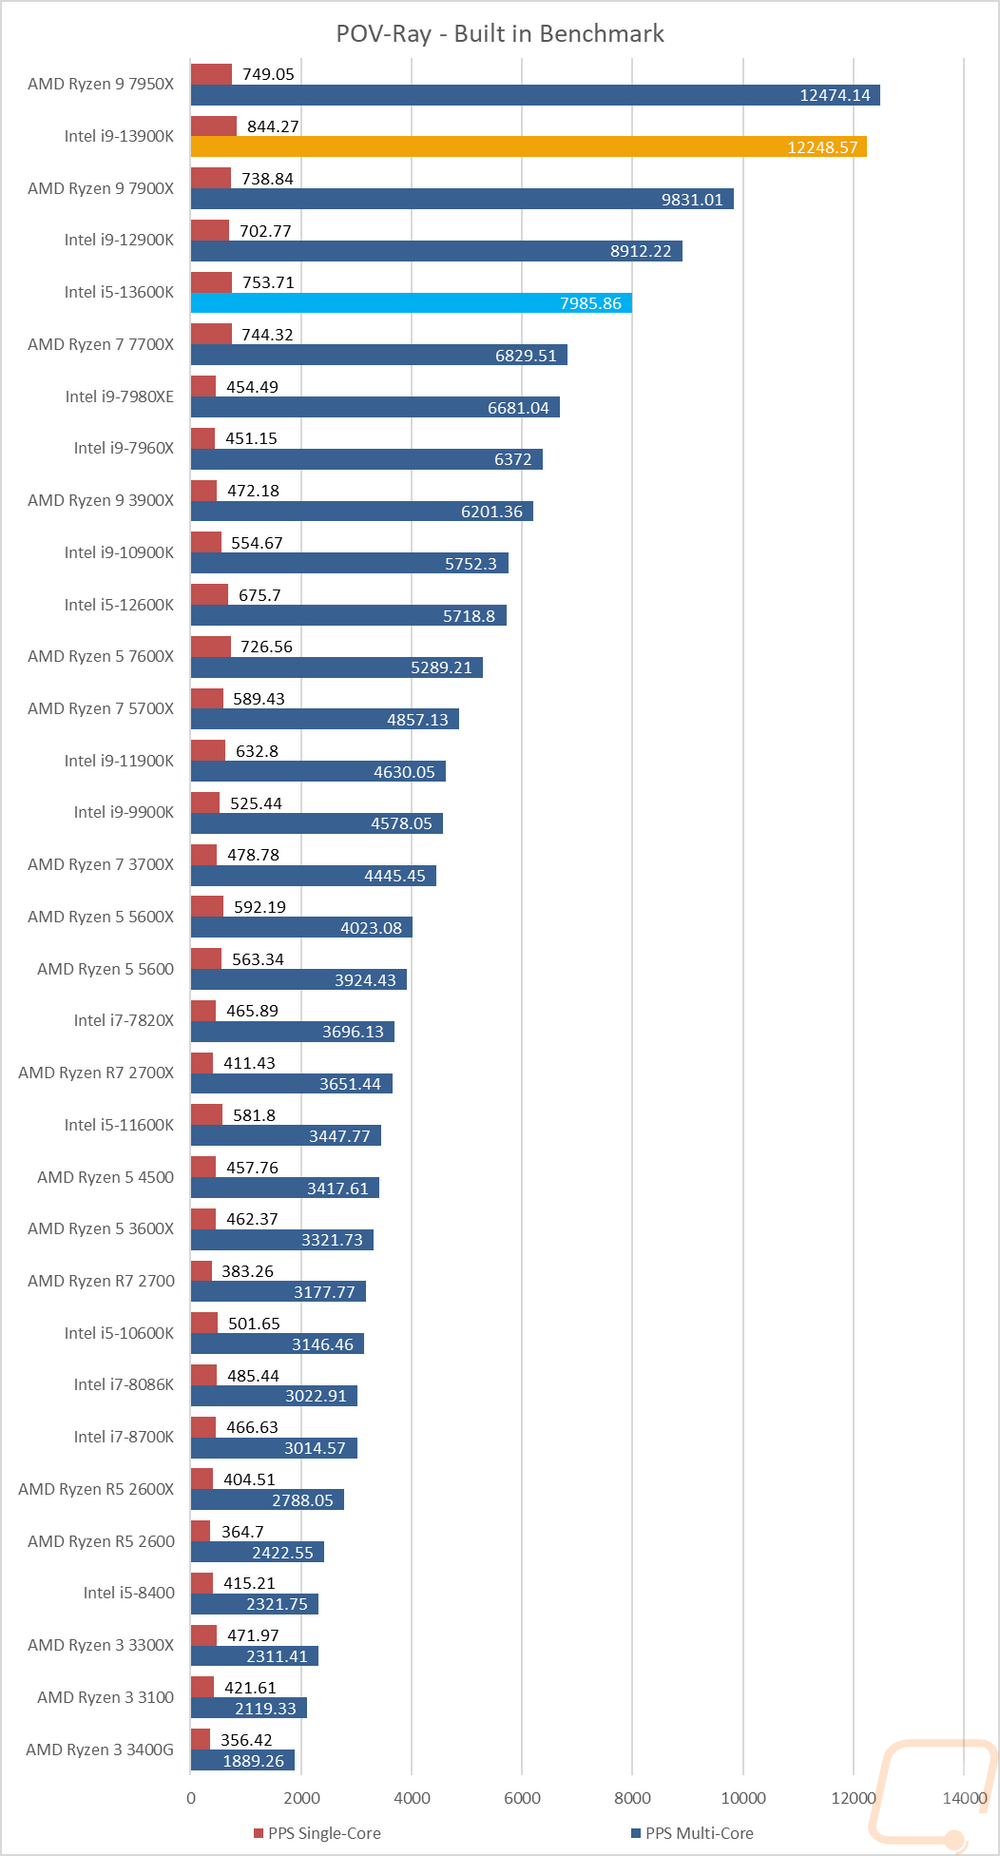
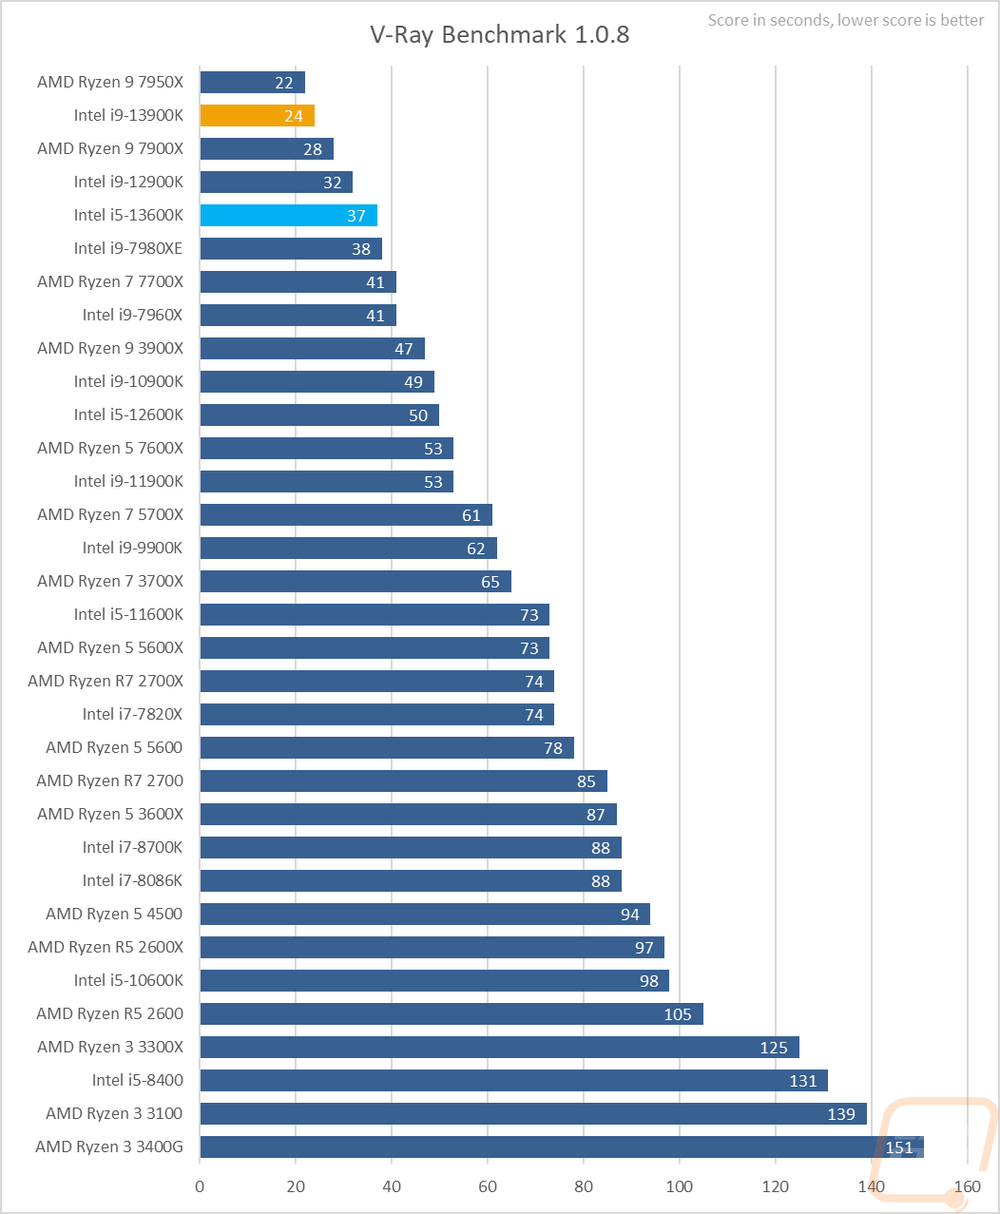
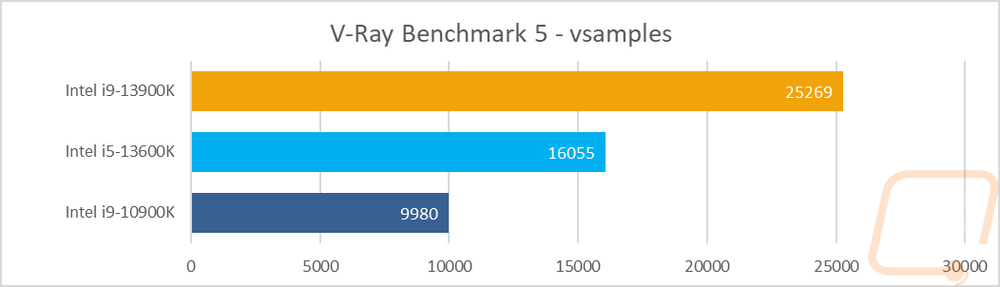
Next up we have ray tracing-focused rendering benchmarks. Here I tested the CPUs in POV-Ray and V-Ray including the newer V-Ray Benchmark 5. POV-Ray was also tested with a single core and across all of the cores. In POC-Ray the 7950X is still at the top with its raw cores but the 13900K isn’t too far behind then there is a big gap after that. The 13600K is sitting in good company ahead of the 7700X and the 12900K. Then for single-core performance, the 13900K is way out in front, and the 13600K is the next fastest running just ahead of all of the Ryzen 7000 Series CPUs. In the older V-Ray Benchmark 1.0.8 the 16 cores of the 7950X have it finishing the test two seconds faster than the 13900K and again the 13600K is sitting between the 12900K and the 7700X along with the old high core count 7980XE in the mix there as well. As for V-Ray Benchmark 5, I just added it into the mix last minute so I haven’t added in the Ryzen 7000 Series for comparison but I included it just to show how big the gap between the 13900K and the 13600K is in these multi-threaded tasks.
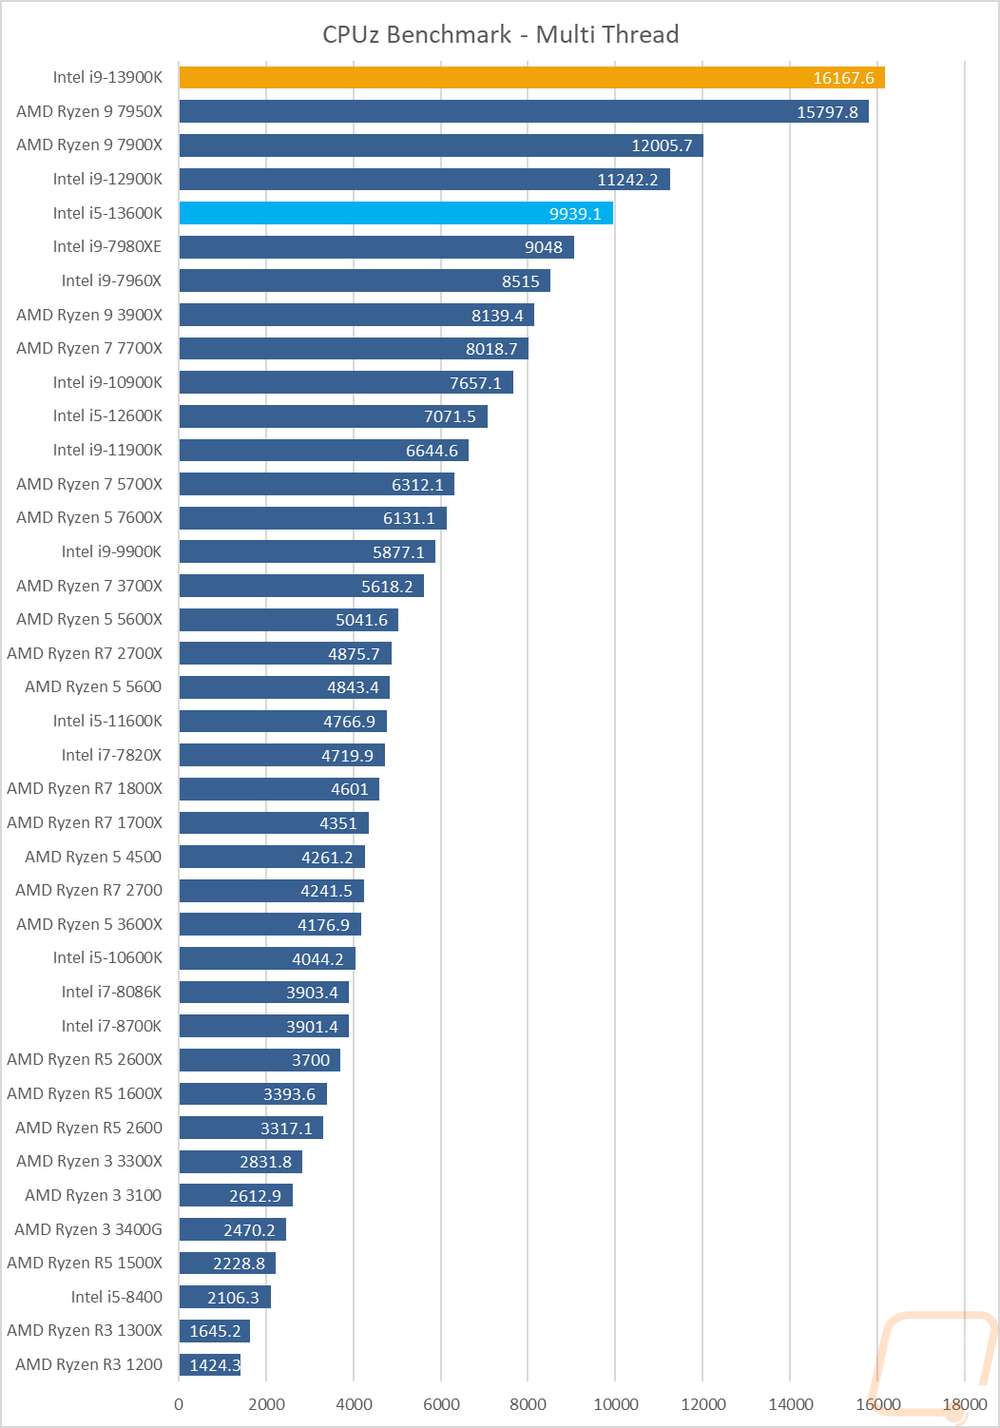
I also tested using the CPUz’s built-in benchmark which does run on a single thread and with all threads. I feel like I’m repeating myself over and over again but the single-thread performance test has both of the 13th gen CPUs at the top and the 13900K way out in the lead. This test does have the 13900K in front of the 7950X in the multi-thread test but it does seem to favor Intel slightly. The gap in performance after those two CPUs down to the 7900X is surprising or at least it would be if I hadn’t already seen it in a few of the previous tests already.

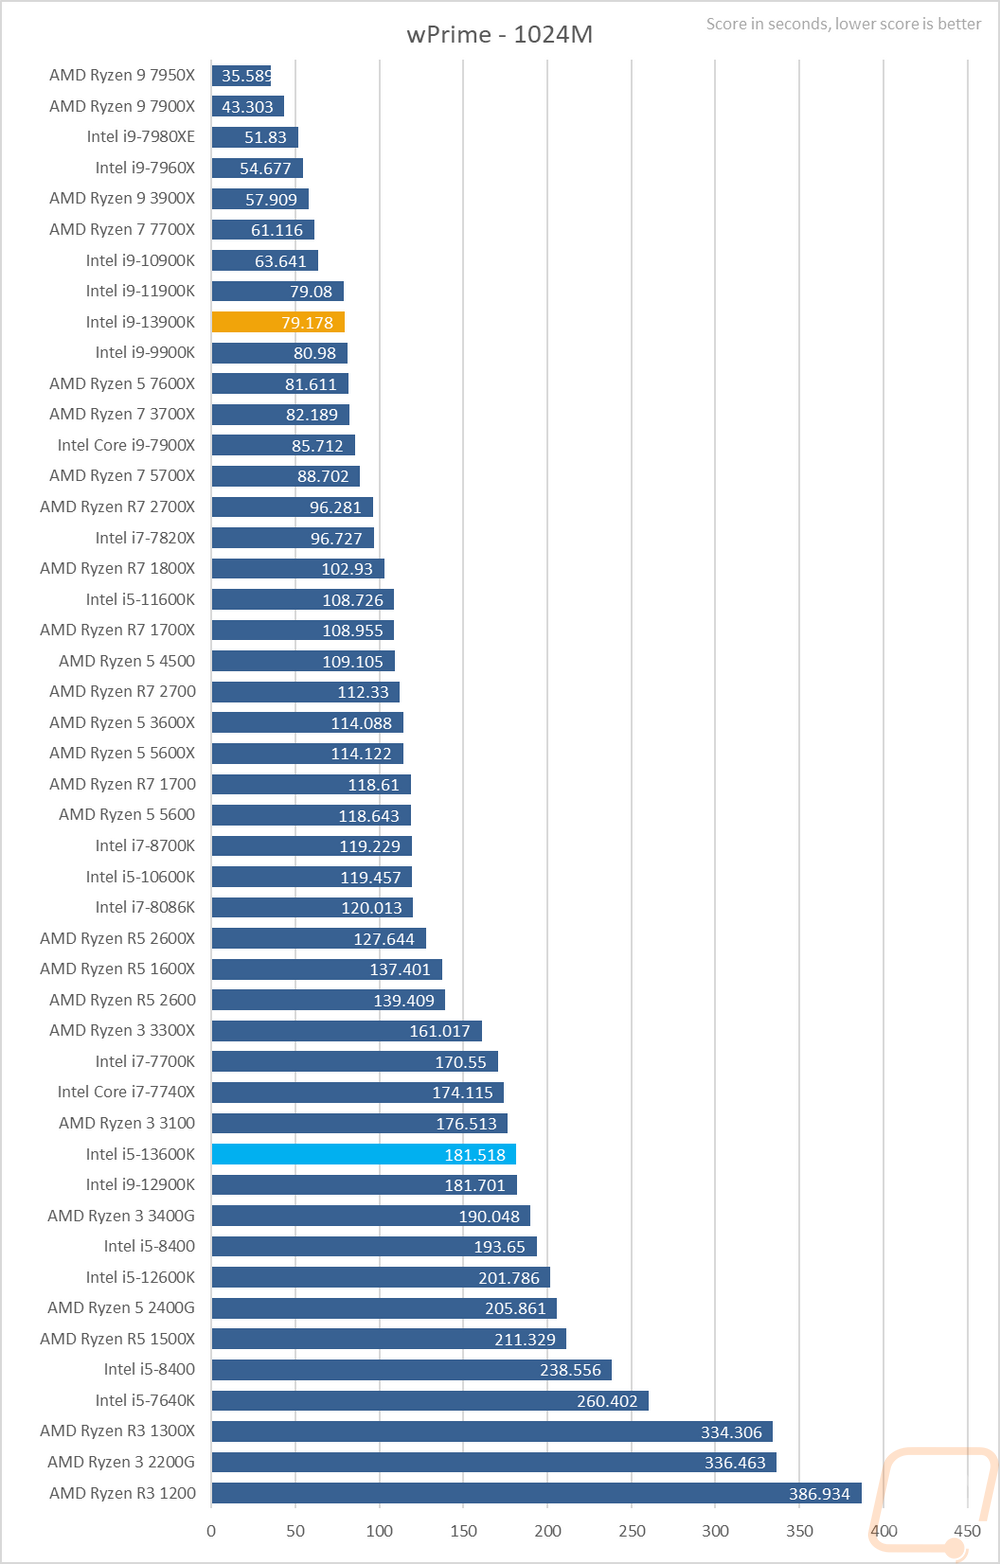
Next, we have wPrime which is a classic overclocking benchmark that calculates pi out to 1024 million digits and is timed. This is a multi-thread heavy test which has the older high core count CPUs still all over the top of the charts and while the 13900K does have 32 threads and 24 cores, 16 of the 24 cores are the E-Cores which are focused more on background tasks. The 13900K performed similarly to the 11900K and the 9900K and this was an improvement. The 79 second score was 102 seconds faster than the 12900K did in this same test. In fact, the 13600K was right with the 12900K, showing how the performance has improved.
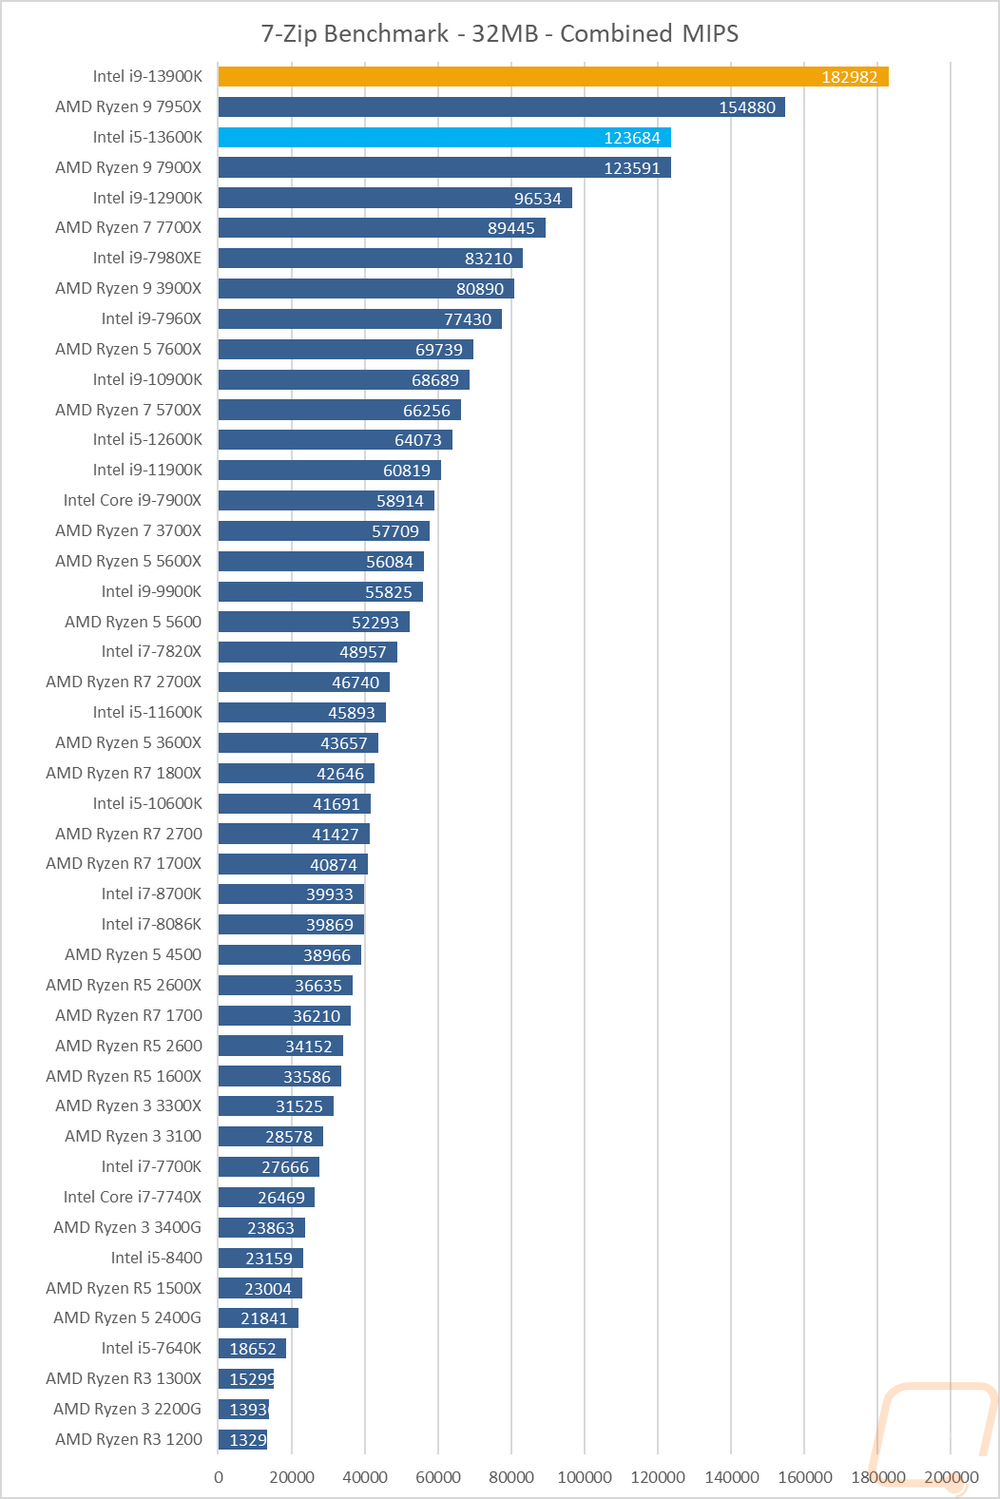
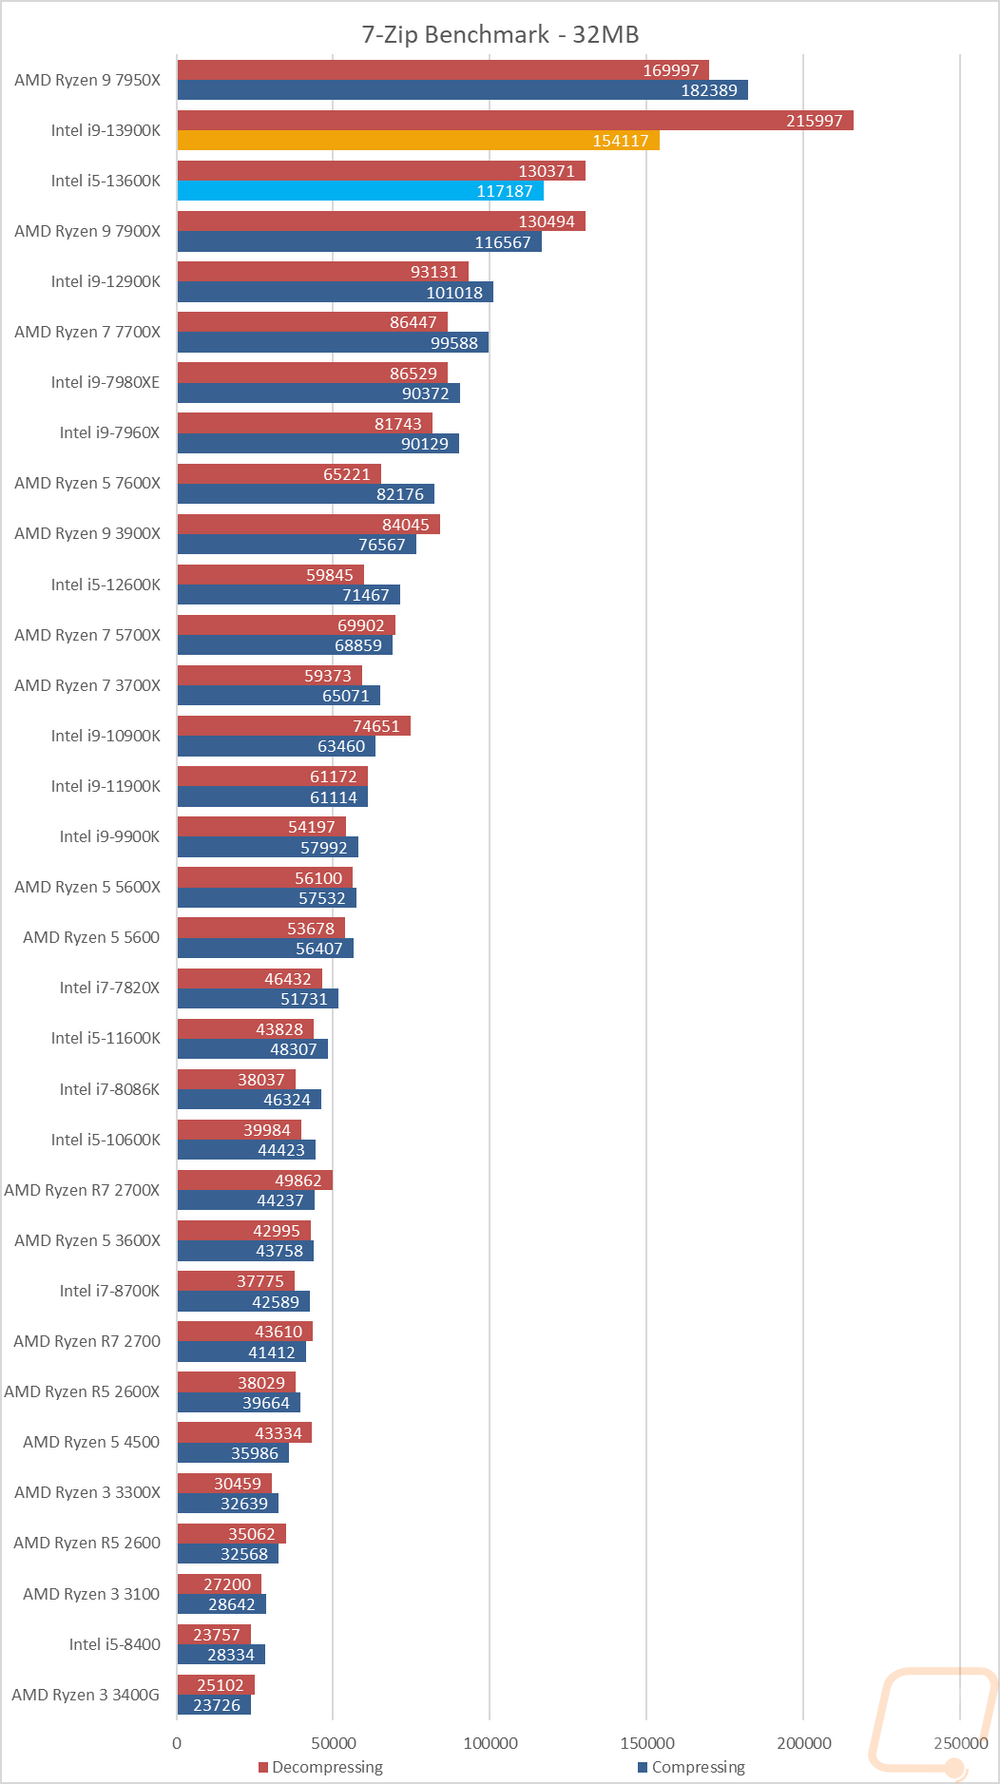
7 Zip is another open-source program, this time for compressing and decompressing all of your files. Here I have run the benchmark and we have three results. The combined MIPS is a combination of compressing and decompressing performance. Then I have it broken down between the two. This workload likes extra cores which can be seen with the CPUs that are up at the top being some of the older high core-count CPUs that I have tested in the past. Even with the Ryzen 9 7950X having a higher core and thread count though the i9-13900K has a substantial lead in the combined MIPS results and even the 13600K is punching way ahead of its weight class running right with the 7900X. The split results show us a little more though with the 7950X still being at the top of the chart with it sorted by the compressing results but the 13900K having a HUGE lead when decompressing which is what puts it ahead in the combined results. The 13600K however was right with the $200+ more expensive 7900X in all three results here.
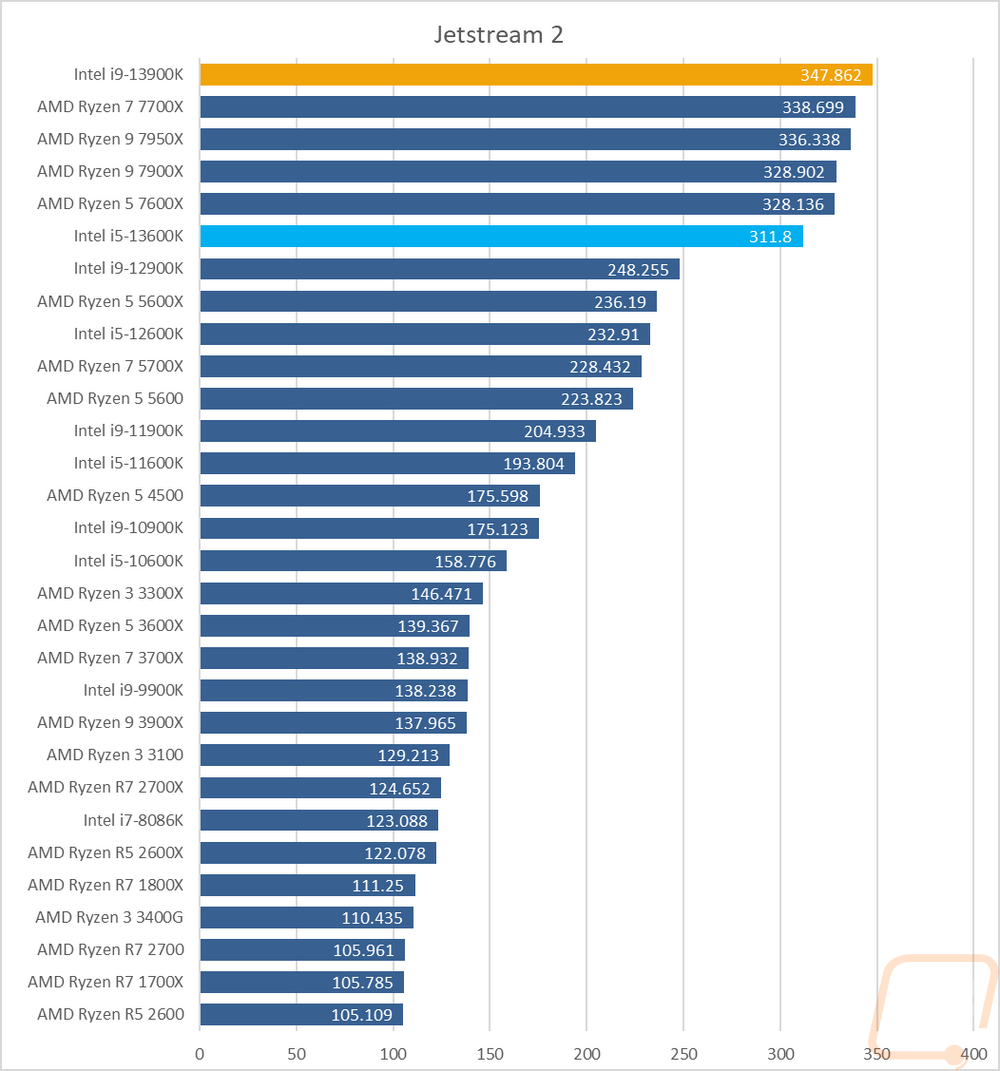
Jetstream 2 is a compilation benchmark that takes a long list of HTML5 and Java in-browser tests and runs them all three times and puts together an overall score. I love this benchmark because let's be honest, most people are using their browser more than any other game or program. Jetstream gives some interesting results sometimes though but it tends to prefer high IPC or single-core performance and there are some situations where it prefers lower core-count CPUs. This time around the 13600K didn’t outperform the 13900K but the two CPUs do sit on top and at the bottom of the four new Ryzen CPUs rounding out the top 6 results with the 13900K on top.
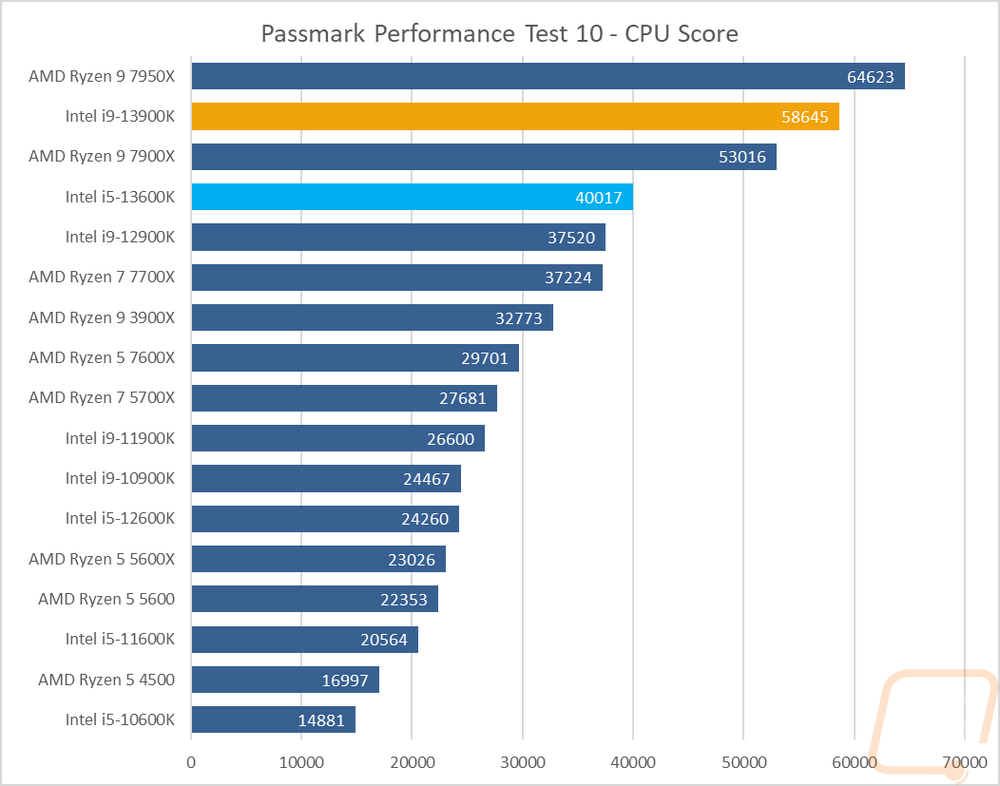
For Passmark Performance Test I used the latest version, Performance Test 10 I only look at the overall CPU score which takes a few different synthetic benchmarks and combines the results to put together an overall score. This is a test that does favor multi-threader performance over IPC and you can see that with the 7950X topping the chart here and the 13900K sitting between that and the 7900X. The 13600K did outperform last year's 12900K which is the most interesting result here as well as the 7700X.
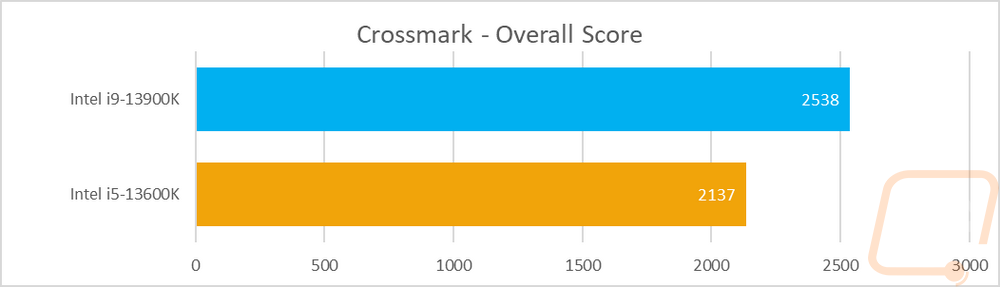
Crossmark was a late addition so I haven’t retested on other CPUs yet. Crossmark is from BAPCo which also makes SYSmark and this is a cross-platform test where you can compare performance between phones and both windows and mac computers. This is the start of our overall PC benchmarks and Crossmark uses a mix of real-world tests to output an overall score. Without any comparisons, this information doesn’t do us much good just yet but we can see that the 13900K scored a 2538 and the 13600K had a 2137.
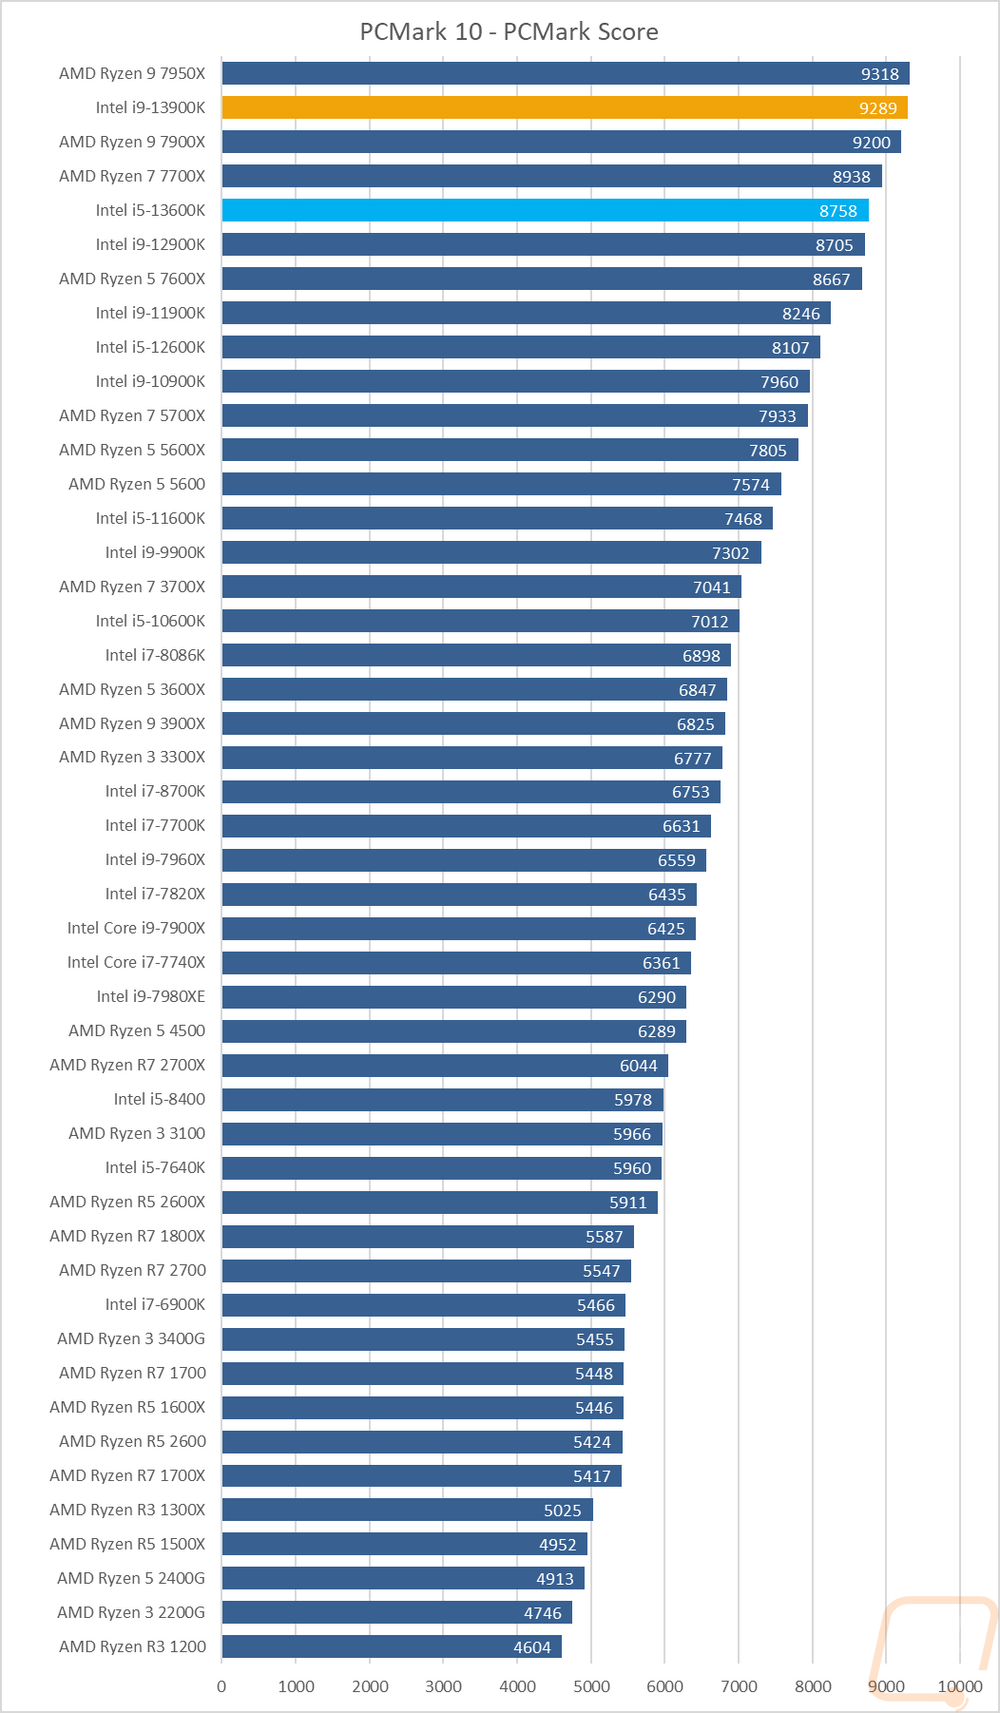
PCMark 10 is a great test because it tests things like video calls, browser performance, excel, and word performance to give an idea of real-world performance. It tends to like higher clock speeds but does take raw core count into account as well which you can see with the 7950X at the top of the chart here and the 13900K sitting behind it just barely. The 13600K is the surprise though with it outperforming the 12900K but the 7700X did outperform it here.
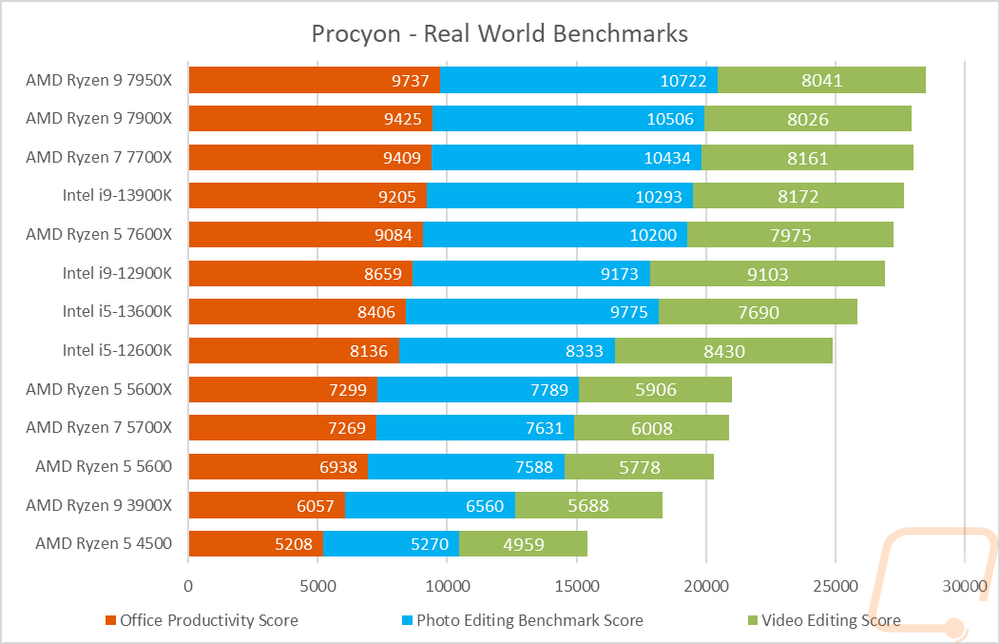
We recently added even more real-world testing with the UL Procyon Benchmarks which are as real-world as they can get using the actual programs that you would use in each test. There are three overall benchmarks, first is the Office Productivity Benchmark which uses Microsoft Office 365 to test actual performance in word, excel, PowerPoint, and outlook. The second benchmark is the Photo Editing Benchmark which is run using the latest version of Photoshop as well as Lightroom Classic to look at photo editing performance. Then the last test is the Video Editing Benchmark which uses the latest version of Adobe Premiere Pro to test video editing performance. I have all three scores stacked together to get an overall look at the performance. Three of the Ryzen 7000 series CPUs top the chart here which was a surprise, the 13900K did improve on the performance seen from the 12900K but it wasn’t enough to keep up with the latest Ryzen CPUs in these real-world tests. The one exception to that was in the video editing test where the 13900K did outperform all of the Ryzen CPUs, but that lead was lost with the Office and Photo editing results being lower.
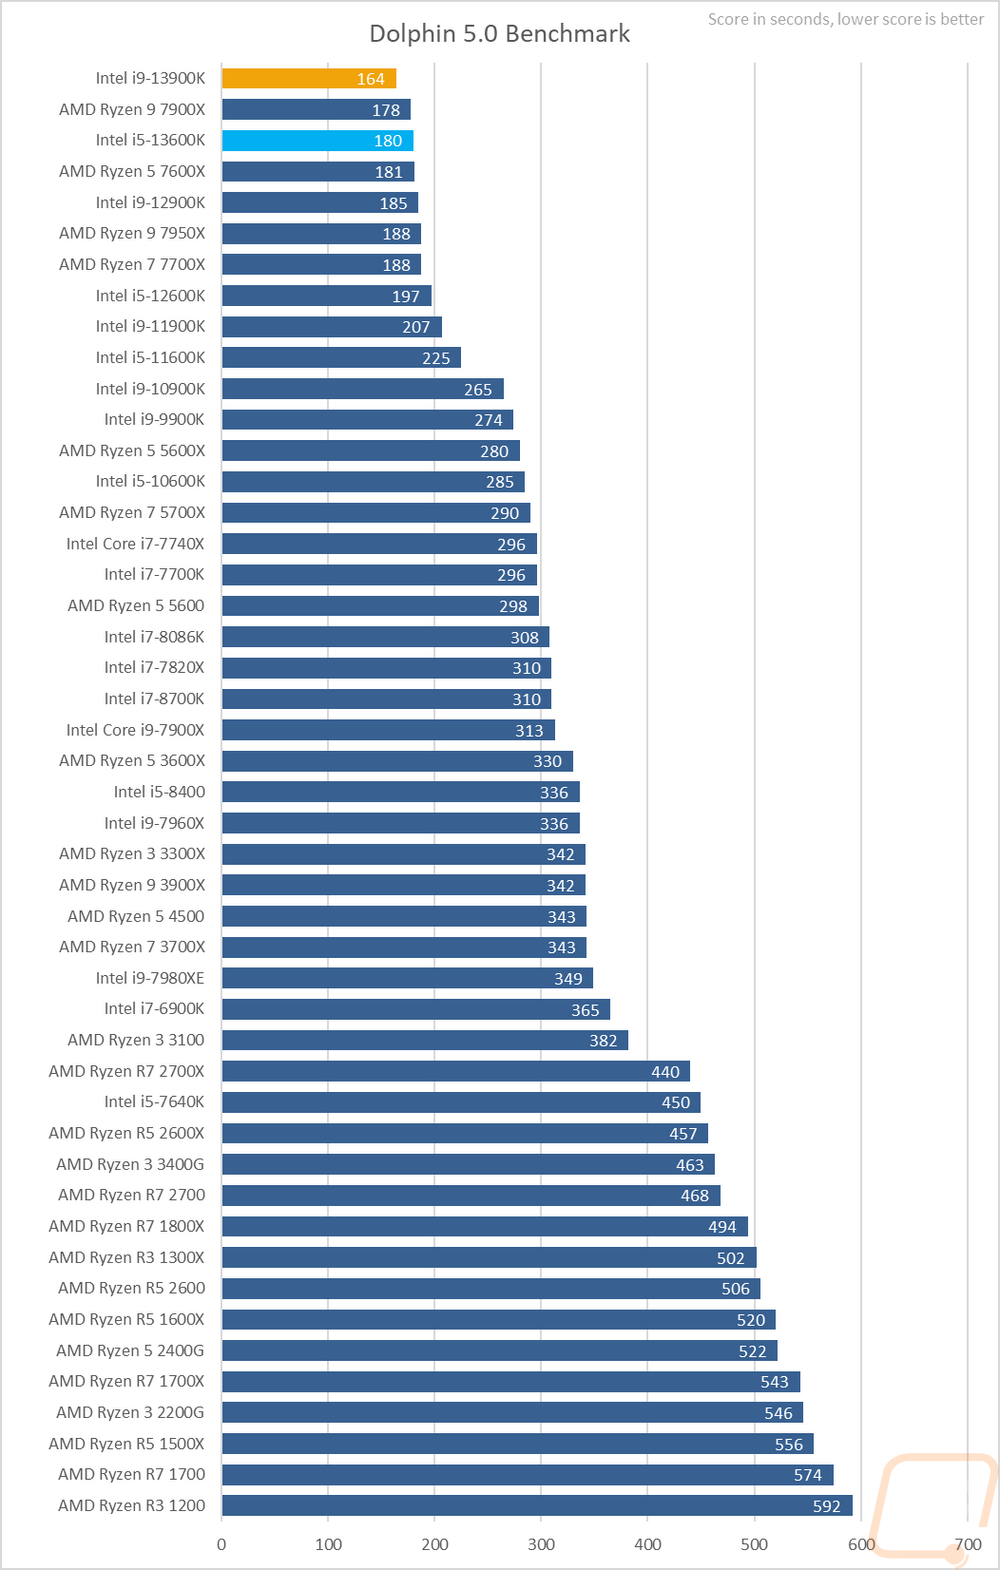
Moving the focus over towards gaming my next test is using Dolphin 5.0 Benchmark. Dolphin 5.0 is a Wii emulator and like most emulators, it doesn’t care about high core counts at all. In fact, it only runs two in total. Clock speeds are king here but apparently, it is all about the base clock speeds for the Ryzen CPUs with the lower-end versions with higher base clocks outperforming their higher-end brothers. None of that matters when compared to the 13900K however which improved from the 12900K by 21 seconds putting it 14 seconds faster than the 7900X. The 13600K improved by 17 seconds compared to the 12600K and this put it above all but one of the new Ryzen 7000 Series CPUs as well with it sitting behind the 7900X by just two seconds.
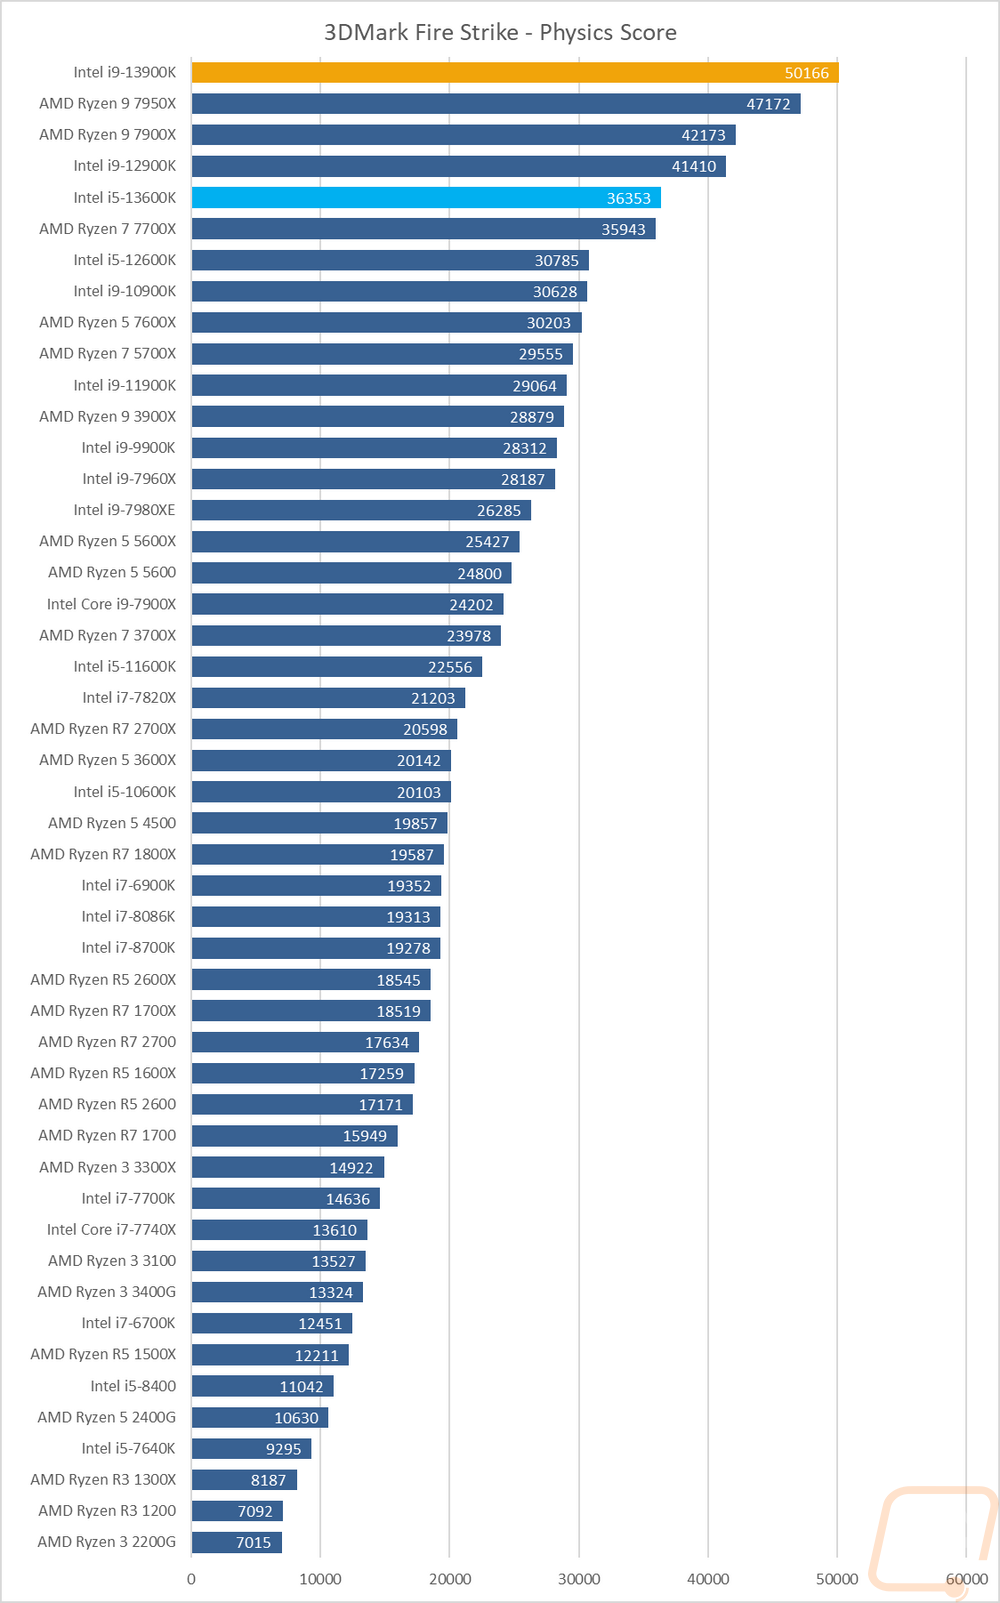
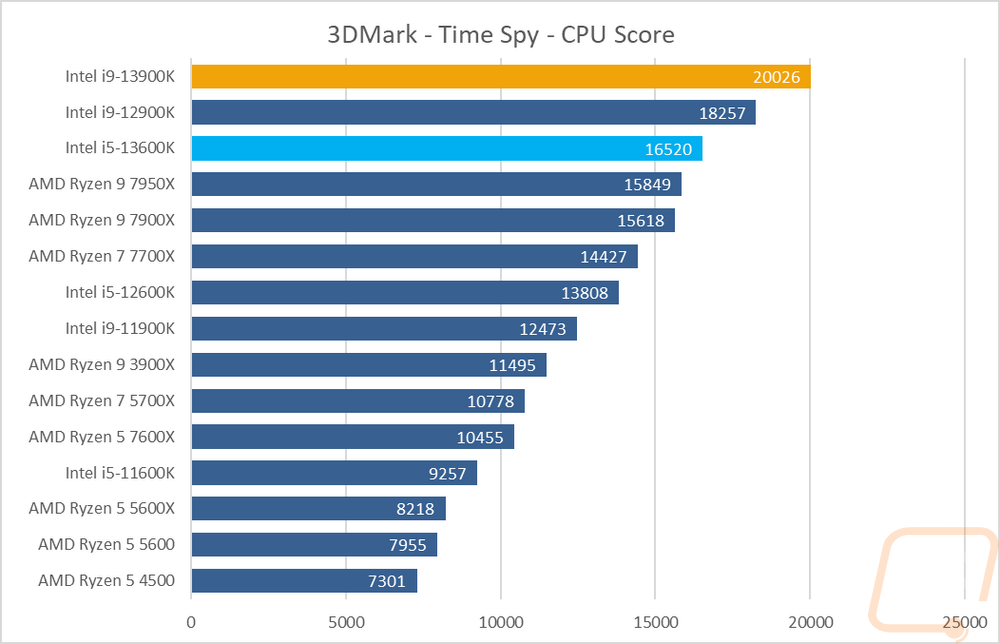
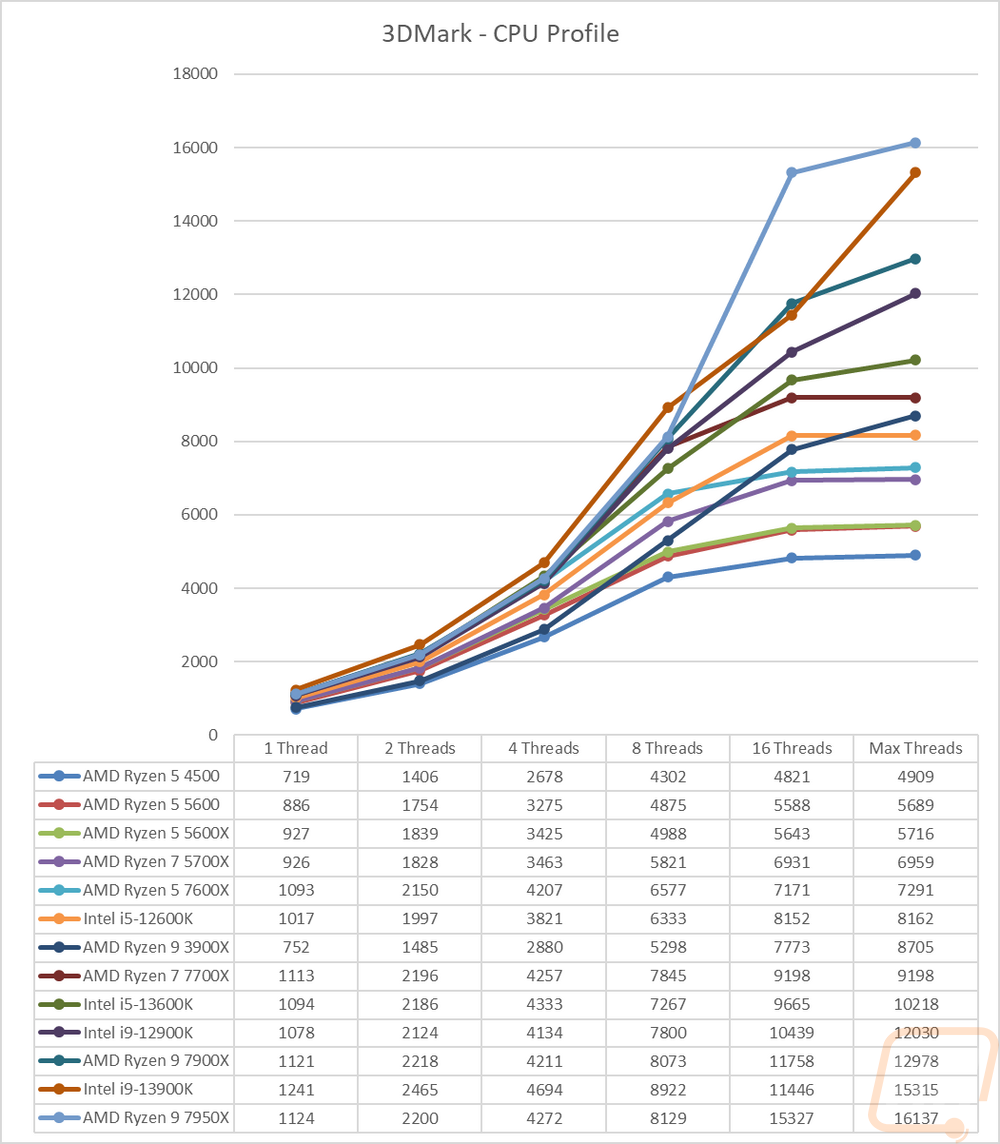
Before diving into game testing I wanted to check out synthetic performance using 3DMark. I tested with the older DX11 Fire Strike test as well as the newer DX12 Time Spy. I also added the new 3DMark CPU Profile benchmark into the mix as well which does a good job of showing the full range of thread counts that you might see being used in games as well as a max threads option that does everything above 16 threads. In the Fire Strike test, the 13900K is at the top of the chart with a big lead over the 7950X and the 7900X and the 12900K are surprisingly close together in their results. The 13600K running with the 7700X given the price difference. In the Time Spy test, Intel did even better with the 13900K out in front and then last year's 12900K behind it. Even the 13600K came in ahead of the 7950X in that test. In the last test, the CPU profile graph shows performance differences at 1, 2 4, 8, and 16 threads as well as a test with max threads which maps out the performance depending on thread count in 3DMark. The 7950X tops the max threads end of the chart with its 16 cores and 32 threads but the 13900K was behind it there but ahead in the 1-8 thread tests.
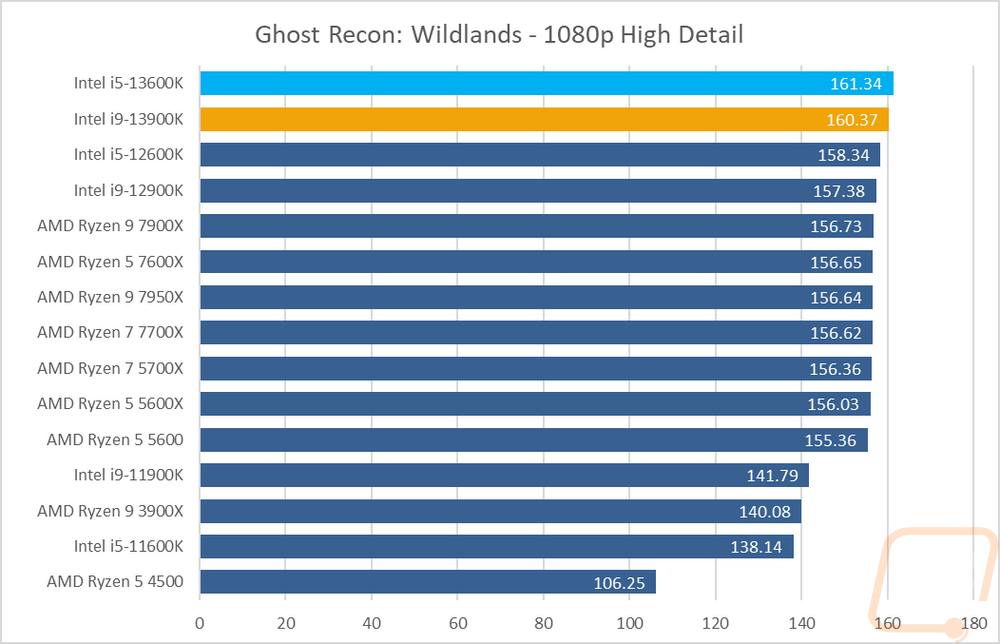
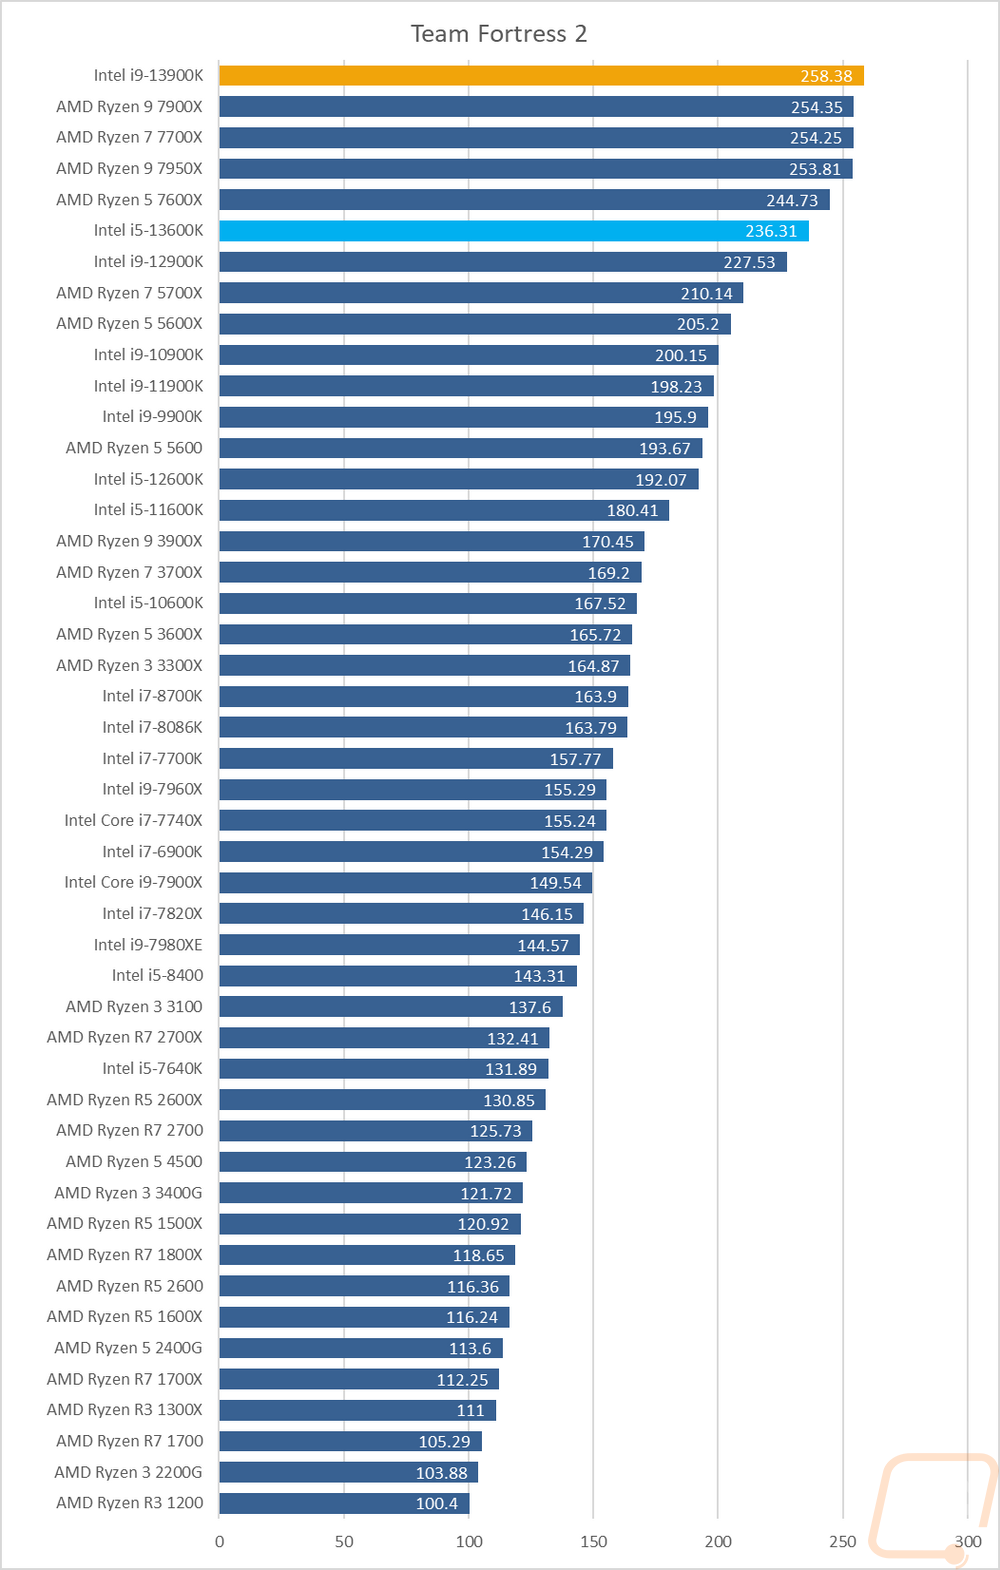
For in-game performance testing, I ran them through a variety of new and old games. TF2 for example is a very old game at this point but is also extremely CPU dependent which makes it a good option to check out for older source-based games. Game results for the i9-13900K had it at the top of our graphs in 5 out of the 9 tests and with it being 1 FPS off in Shadow of the Tomb Raider to the 7950X and 1 FPS off from the 13600K in Ghost Recon Wildlands. That result especially is interesting because the 12600K performed similarly against the 12900K as well last year with the mid-range CPUs gaining 1 FPS over the flagship. In Dirt 5 and Metro Exodus the new Ryzen CPUs were all out ahead of the 13th Gen CPUs and there were a lot of tests where all four of the new Ryzen CPUs came in just ahead of the i5-13600K but overall in all of the gaming tests, Intel’s new CPUs did well taking the crown back, of course, we don’t have the 5800X3D in the mix.
I did also run both CPUs through a few tests using AIDA64, specifically, I wanted to check out cache performance, memory performance, and how the CPUs handle single and double precision and different integers. It’s surprising to see how much faster the new 7000 Series Ryzen CPUs are compared to the new 13th Gen CPUs when it comes to L1 performance and L3 to a lesser extent but the 13900K does catch back up with its larger L2 cache, but not enough to pass the 7950X. Another interesting result is in the memory performance with the new Ryzen CPUs having noticeably lower memory latency but the 13th Gen Intel being faster with memory read speeds and Ryzen a little faster on Memory write speeds.
|
AIDA64 |
L1 Cache Read |
L1 Cache Write |
L1 Cache Latency |
L2 Cache Read |
L2 Cache Write |
L2 Cache Latency |
L3 Cache Read |
L3 Cache Write |
L3 Cache Latency |
|
|
GB/s |
GB/s |
ns |
GB/s |
GB/s |
ns |
GB/s |
GB/s |
ns |
|
AMD Ryzen R7 2700X |
999.43 |
502.5 |
1 |
978.03 |
495.12 |
2.8 |
414.95 |
417.71 |
8.8 |
|
AMD Ryzen R5 2600X |
768.13 |
388.05 |
1 |
729.37 |
366.01 |
2.9 |
429.09 |
323.83 |
9.1 |
|
Ryzen 5 2400G |
485.01 |
238.29 |
1 |
459.8 |
232.2 |
3.1 |
222.96 |
181.6 |
9.6 |
|
Ryzen 3 2200G |
460.55 |
227.41 |
1.1 |
352.84 |
177.56 |
3.3 |
137.3 |
171.2 |
10.2 |
|
Intel i7-8700K |
1595.6 |
803.65 |
0.9 |
640.37 |
397.14 |
2.6 |
337 |
213.67 |
11 |
|
Intel i5-8400 |
1417.2 |
710.79 |
1 |
543.81 |
352.9 |
3.1 |
270.89 |
186.82 |
13 |
|
Intel Core i9-7980XE |
3758.3 |
1896.7 |
1.1 |
1671.7 |
1069.9 |
5.6 |
229.61 |
118.4 |
21 |
|
Intel Core i9-7960X |
3532.3 |
1785.2 |
1 |
1571.6 |
1003.5 |
5.1 |
220.22 |
121.04 |
19.8 |
|
Intel Core i7-7820X |
1969.9 |
995.02 |
1 |
884.63 |
574.74 |
5.6 |
114.4 |
103.57 |
19.2 |
|
Intel Core i5-7640X |
1044.8 |
31888 |
1 |
397.26 |
247 |
2.9 |
228.31 |
163.86 |
11.1 |
|
Intel Core i9-7900X |
2418.5 |
709.16 |
1 |
1037.3 |
521.94 |
5.2 |
124.16 |
106.78 |
21.2 |
|
Intel Core i7-7740X |
1102.7 |
561.25 |
0.9 |
424.55 |
304.3 |
2.7 |
287.01 |
186.67 |
21.2 |
|
Intel i7-6900K |
1963.9 |
999.59 |
1 |
710.28 |
310.34 |
4.1 |
243.96 |
195.41 |
14.6 |
|
Intel i7-7700K |
1114.6 |
560.82 |
0.9 |
415.45 |
285.97 |
2.7 |
234.5 |
188.7 |
10.4 |
|
Intel i7-5960X |
1748.5 |
874.6 |
1.2 |
623.08 |
272.77 |
3.5 |
260.72 |
184.92 |
15.3 |
|
AMD Ryzen R7 1800X |
917.46 |
460.16 |
1.1 |
831.95 |
446.37 |
4.7 |
388.18 |
386.01 |
12.4 |
|
AMD Ryzen R7 1700X |
867.89 |
435.33 |
1.2 |
809.29 |
419.38 |
5 |
369.75 |
350.31 |
12.9 |
|
AMD Ryzen R7 1700 |
793.9 |
398.12 |
1.3 |
742.92 |
389.73 |
5.4 |
334.36 |
332.12 |
14.2 |
|
AMD Ryzen R5 1600X |
689.47 |
345.95 |
1.1 |
630.99 |
334.93 |
4.7 |
386.48 |
326.86 |
12.3 |
|
AMD Ryzen R5 1500X |
446.84 |
224.01 |
1.1 |
306.82 |
211.58 |
11.8 |
306.82 |
211.58 |
11.8 |
|
AMD Ryzen R5 2600 |
685.38 |
344.05 |
1 |
669.28 |
333.5 |
3.1 |
381.16 |
320.56 |
9.8 |
|
AMD Ryzen R7 2700X |
849.91 |
426.09 |
1 |
837.76 |
418.75 |
3 |
357.51 |
356.71 |
9.4 |
|
Intel i7-8086K |
1596.4 |
803.56 |
0.9 |
623.36 |
423.53 |
2.6 |
380.04 |
243.73 |
10.9 |
|
Intel i9-9900K |
2375.6 |
1195.4 |
0.8 |
907.65 |
626.34 |
2.4 |
302.01 |
221.1 |
11 |
|
AMD Ryzen 9 3900X |
3098.6 |
1551.4 |
0.9 |
1545.3 |
1416.8 |
2.8 |
1014.4 |
836.39 |
11.5 |
|
AMD Ryzen 7 3700X |
2133.2 |
1072.9 |
0.9 |
1069.1 |
993.49 |
2.8 |
611.53 |
573.21 |
10.2 |
|
AMD Ryzen 5 3600X |
1547.4 |
779.24 |
1 |
777.62 |
745.3 |
2.8 |
584.93 |
538.45 |
10.4 |
|
AMD Ryzen 3 3400G |
508.97 |
253.87 |
1 |
490.26 |
247.04 |
3 |
233.57 |
193.62 |
9.3 |
|
AMD Ryzen 3 3300X |
1080.5 |
541.5 |
0.9 |
541.84 |
530.5 |
2.7 |
322.13 |
321.33 |
11.1 |
|
AMD Ryzen 3 3100 |
965.85 |
484.67 |
1 |
485.55 |
460.71 |
3.1 |
374.11 |
343.53 |
11.8 |
|
Intel i5-10600K |
1676.6 |
840.87 |
0.8 |
662.98 |
452.67 |
2.5 |
361.35 |
238.47 |
10.5 |
|
Intel i9-10900K |
3162.1 |
1586.7 |
0.8 |
1201.8 |
759.97 |
2.4 |
407.66 |
245.94 |
11.4 |
|
AMD Ryzen 5 5600X |
1721.4 |
869.69 |
0.9 |
851.89 |
831.97 |
2.6 |
276.24 |
298.84 |
11 |
|
Intel i9-11900K |
4542.8 |
2299.3 |
1 |
1413.2 |
691.62 |
2.5 |
330.32 |
213.28 |
11.4 |
|
Intel i5-11600K |
3412.3 |
1724.9 |
1 |
960.91 |
526.76 |
2.7 |
319.1 |
198.57 |
11.4 |
|
Intel i9-12900K |
2310 |
1438.7 |
1 |
1233.5 |
562.72 |
2.9 |
678.84 |
418.11 |
19.8 |
|
Intel i5-12600K |
1461.1 |
971.78 |
1.1 |
846.4 |
360.51 |
3.2 |
598.86 |
292.09 |
21.4 |
|
AMD Ryzen 5 4500 |
1561.9 |
784.1 |
1 |
785.34 |
751.61 |
2.9 |
350.05 |
571.19 |
10.5 |
|
AMD Ryzen 5 5600 |
1646.6 |
831.24 |
0.9 |
832.43 |
767.22 |
2.7 |
445.8 |
437.73 |
11.9 |
|
AMD Ryzen 7 5700X |
2267.8 |
1157.8 |
0.9 |
1147.6 |
1026.1 |
2.6 |
501.53 |
526.11 |
11.5 |
|
AMD Ryzen 7 7700X |
2722.9 |
1381 |
0.7 |
1361.1 |
1305.1 |
2.7 |
887.95 |
901.2 |
10.1 |
|
AMD Ryzen 5 7600X |
1996.3 |
1019.3 |
0.7 |
1020.9 |
999.93 |
2.6 |
847.43 |
847.61 |
10.5 |
|
AMD Ryzen 9 7950X |
5252.2 |
2685 |
0.7 |
2615.6 |
2588.4 |
2.6 |
1293.7 |
1357.3 |
9.9 |
|
AMD Ryzen 9 7900X |
4042.4 |
2051.4 |
0.7 |
2008.5 |
1956.3 |
2.5 |
1278.6 |
1394.1 |
9.8 |
|
Intel i9-13900K |
2005.7 |
872.39 |
0.9 |
2280.2 |
851.63 |
3.7 |
1729.2 |
619.38 |
18.3 |
|
Intel i5-13600K |
3218.4 |
1472.5 |
1.1 |
1156 |
479.87 |
4.5 |
907.63 |
406.76 |
14.9 |
|
AIDA64 |
Memory Read |
Memory Write |
Memory Latency |
Single-Precision FLOPS |
Double Precision FLOPS |
AES-256 |
24-bit Integer IOPS |
32-bit Integer IOPS |
64-bit Integer IOPS |
|
|
MB/s |
MB/s |
ns |
GFLOPS |
GFLOPS |
MB/s |
GIOPS |
GIOPS |
GIOPS |
|
AMD Ryzen R7 2700X |
50214 |
48578 |
65 |
507.9 |
253.9 |
70514 |
127.7 |
127.7 |
64.22 |
|
AMD Ryzen R5 2600X |
50273 |
48346 |
65.5 |
383.2 |
191.4 |
51932 |
95.82 |
95.82 |
48.15 |
|
Ryzen 5 2400G |
45967 |
47850 |
66.6 |
235.9 |
117.8 |
32388 |
58.94 |
58.98 |
29.67 |
|
Ryzen 3 2200G |
35567 |
36240 |
118.4 |
225.8 |
112.6 |
27603 |
56.32 |
56.32 |
28.3 |
|
Intel i7-8700K |
38421 |
40175 |
57.9 |
825 |
412.5 |
29406 |
370 |
370 |
51.55 |
|
Intel i5-8400 |
38096 |
40549 |
59.8 |
728.8 |
364.5 |
25192 |
323.5 |
323.5 |
45.55 |
|
Intel Core i9-7980XE |
77004 |
68888 |
73.4 |
1831 |
915.5 |
69377 |
821.2 |
821.3 |
121.6 |
|
Intel Core i9-7960X |
79416 |
71554 |
74.9 |
1681 |
840.6 |
65409 |
754 |
753.9 |
114.7 |
|
Intel Core i7-7820X |
76049 |
73759 |
71.6 |
944.9 |
472.5 |
36420 |
423.7 |
423.7 |
63.85 |
|
Intel Core i5-7640X |
30786 |
31888 |
68.5 |
536.5 |
268.2 |
18547 |
238.1 |
138.1 |
33.53 |
|
Intel Core i9-7900X |
76856 |
72856 |
72.8 |
1148 |
574.5 |
45506 |
515.1 |
515 |
79.76 |
|
Intel Core i7-7740X |
38455 |
40596 |
53.2 |
575.4 |
287.8 |
20503 |
258.1 |
258 |
35.97 |
|
Intel i7-6900K |
66786 |
68130 |
61.9 |
1023 |
511.7 |
36340 |
255.9 |
255.9 |
63.96 |
|
Intel i7-7700K |
38498 |
40448 |
52.7 |
575.7 |
287.9 |
20519 |
258 |
258 |
35.98 |
|
Intel i7-5960X |
66108 |
49545 |
62.8 |
895.5 |
447.7 |
31783 |
223.9 |
223.9 |
55.97 |
|
AMD Ryzen R7 1800X |
44031 |
43425 |
81.8 |
472.4 |
236.2 |
64016 |
118.1 |
118.1 |
59.03 |
|
AMD Ryzen R7 1700X |
44493 |
43749 |
78.3 |
446.8 |
223.4 |
61730 |
111.7 |
111.7 |
55.84 |
|
AMD Ryzen R7 1700 |
45343 |
43777 |
82.6 |
408.5 |
204.3 |
56811 |
102.1 |
102.1 |
51.05 |
|
AMD Ryzen R5 1600X |
44452 |
43918 |
83.7 |
354.9 |
177.5 |
49340 |
88.74 |
88.73 |
44.34 |
|
AMD Ryzen R5 1500X |
44289 |
43746 |
83.1 |
229.8 |
114.8 |
31983 |
57.43 |
57.45 |
28.72 |
|
AMD Ryzen R5 2600 |
50385 |
48499 |
66.5 |
351 |
175.4 |
48939 |
88.03 |
88.02 |
44.01 |
|
AMD Ryzen R7 2700 |
50088 |
48343 |
65.9 |
434.3 |
217.2 |
60336 |
108.6 |
108.6 |
54.68 |
|
Intel i7-8086K |
39069 |
40675 |
56.2 |
824.9 |
412.5 |
29397 |
369.9 |
369.9 |
51.55 |
|
Intel i9-9900K |
39682 |
41015 |
51.1 |
1226 |
613 |
45542 |
550 |
549.8 |
79.79 |
|
AMD Ryzen 9 3900X |
53981 |
52271 |
70.7 |
1546 |
772.1 |
106943 |
385.7 |
385.7 |
96.57 |
|
AMD Ryzen 7 3700X |
51498 |
28739 |
67.3 |
1078 |
537.8 |
74474 |
271 |
271.2 |
67.77 |
|
AMD Ryzen 5 3600X |
50769 |
28736 |
68.9 |
799.5 |
400 |
55456 |
198.6 |
198.6 |
49.64 |
|
AMD Ryzen 3 3400G |
49936 |
53502 |
67.1 |
257.2 |
128.5 |
35736 |
64.16 |
64.16 |
32.25 |
|
AMD Ryzen 3 3300X |
51435 |
28743 |
66.4 |
551.6 |
276.1 |
38176 |
138.7 |
138.7 |
34.65 |
|
AMD Ryzen 3 3100 |
50246 |
28734 |
71.1 |
497.6 |
248.7 |
34946 |
124.4 |
124.4 |
31.09 |
|
Intel i5-10600K |
43340 |
43430 |
48.2 |
863.8 |
431.9 |
30782 |
387.2 |
386.9 |
53.99 |
|
Intel i9-10900K |
44972 |
43808 |
50.5 |
1632 |
815.7 |
58163 |
731.3 |
731.2 |
102 |
|
AMD Ryzen 5 5600X |
50972 |
28772 |
59.2 |
891.9 |
445.8 |
61623 |
709.6 |
709.7 |
55.72 |
|
Intel i9-11900K |
44919 |
43343 |
51.8 |
1068 |
534.2 |
164966 |
547 |
547 |
182.7 |
|
Intel i5-11600K |
43953 |
43468 |
55.6 |
838.7 |
419.4 |
123767 |
429.3 |
429.3 |
143.4 |
|
Intel i9-12900K |
71418 |
72395 |
82 |
695.7 |
247.9 |
140499 |
400.6 |
400.6 |
166.2 |
|
Intel i5-12600K |
65416 |
71336 |
87.8 |
432.5 |
216.2 |
86470 |
252.7 |
252.7 |
96.22 |
|
AMD Ryzen 5 4500 |
52683 |
53191 |
82.8 |
806 |
402.6 |
56578 |
201.5 |
201.3 |
50.35 |
|
AMD Ryzen 5 5600 |
48444 |
28753 |
70.9 |
853.2 |
426.2 |
107839 |
675.8 |
679.6 |
53.38 |
|
AMD Ryzen 7 5700X |
47858 |
28760 |
68.2 |
1158 |
577.9 |
137459 |
919.1 |
912.9 |
74.38 |
|
AMD Ryzen 7 7700X |
58755 |
80120 |
70 |
1392 |
694.6 |
192730 |
1205 |
1205 |
602.4 |
|
AMD Ryzen 5 7600X |
54720 |
80771 |
69.5 |
1046 |
523.1 |
147661 |
912.5 |
912.5 |
456.4 |
|
AMD Ryzen 9 7950X |
67342 |
76712 |
69 |
2735 |
1364 |
379510 |
2370 |
2370 |
1184 |
|
AMD Ryzen 9 7900X |
68064 |
78123 |
67.7 |
2062 |
1029 |
288134 |
1792 |
1789 |
895.4 |
|
Intel i9-13900K |
76006 |
68902 |
86.1 |
2238 |
1116 |
157028 |
831.4 |
831.4 |
270.6 |
|
Intel i5-13600K |
64721 |
62311 |
97.2 |
1294 |
647 |
86637 |
509.5 |
509.4 |
136.4 |
Onboard Video Performance
Onboard performance isn’t something that you think about when it comes to high-end CPUs because I think the expectation is that you will be adding a dedicated GPU but there are situations where a dedicated GPU isn’t needed or you may need to run the integrated graphics while waiting on your video card to come in or be replaced. So I do still want to check out the performance of both the i9-13900K and the i5-13600K when it comes to integrated GPU performance. For that, I have run a few basic tests with a mix of older and newer games and benchmarks. Integrated GPUs aren’t anywhere near the performance of even the lowest-end GPUs but it is still interesting to see what they can do. To start that I went with the older Cinebench R15 which has an OpenGL benchmark showing basic rendering performance. The 7000 series of Ryzen CPUs are still at the top in Cinebench but the i9-13900K did get very close to catching back up with its score of just under 101 FPS. The 13600K improved by 4 FPS over the 12600K which put it 2 FPS behind the 12900K.
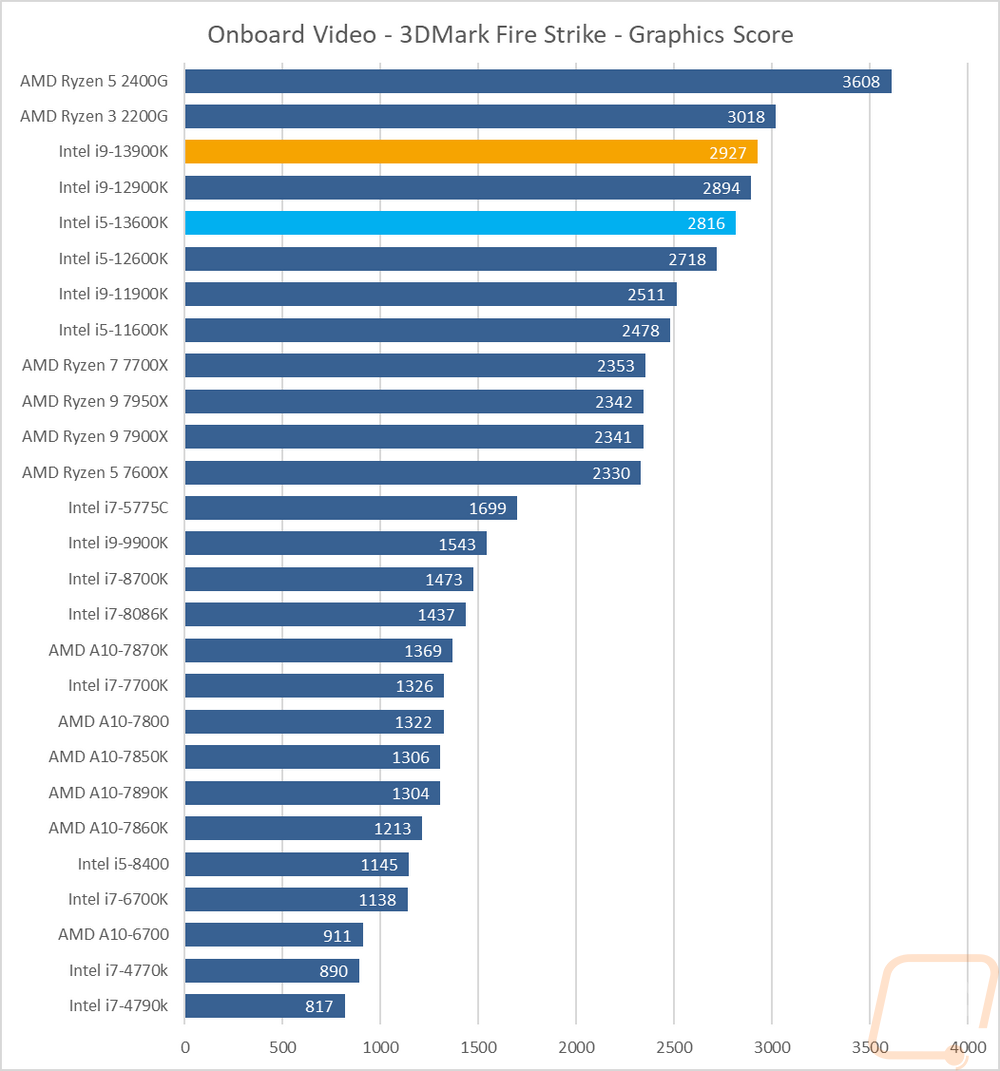
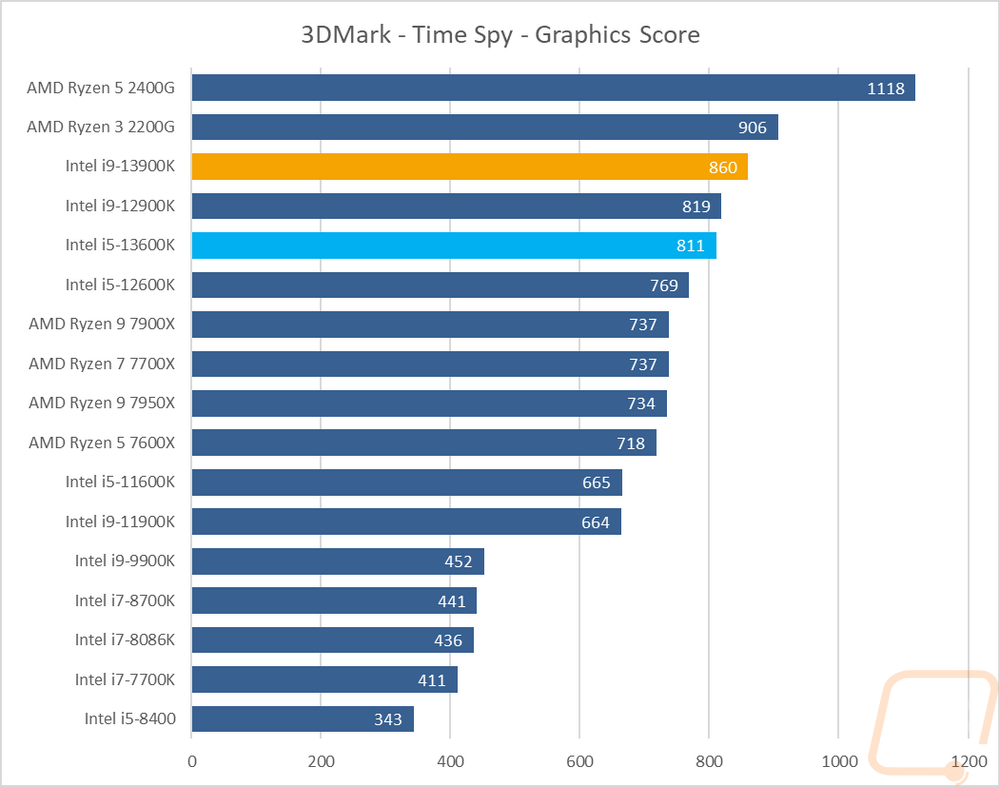
Next, I defaulted to the always consistent 3DMark with both the older Fire Strike benchmark and the newer Time Spy which is DX12. I only used the graphics score, not the total score to take the CPU performance out of the equation as much as possible. The CPU clock speed improvements and the small iGPU clock speed improvement didn’t translate to much of a change in the graphics score in Fire Strike for the 13900K compared to the 12900K but the 13600K on the other hand saw a larger jump ahead of the 13600K. In Time Spy however, the 13900K saw a larger jump and the 13600K is nearly caught up to the graphics score of the 12900K.
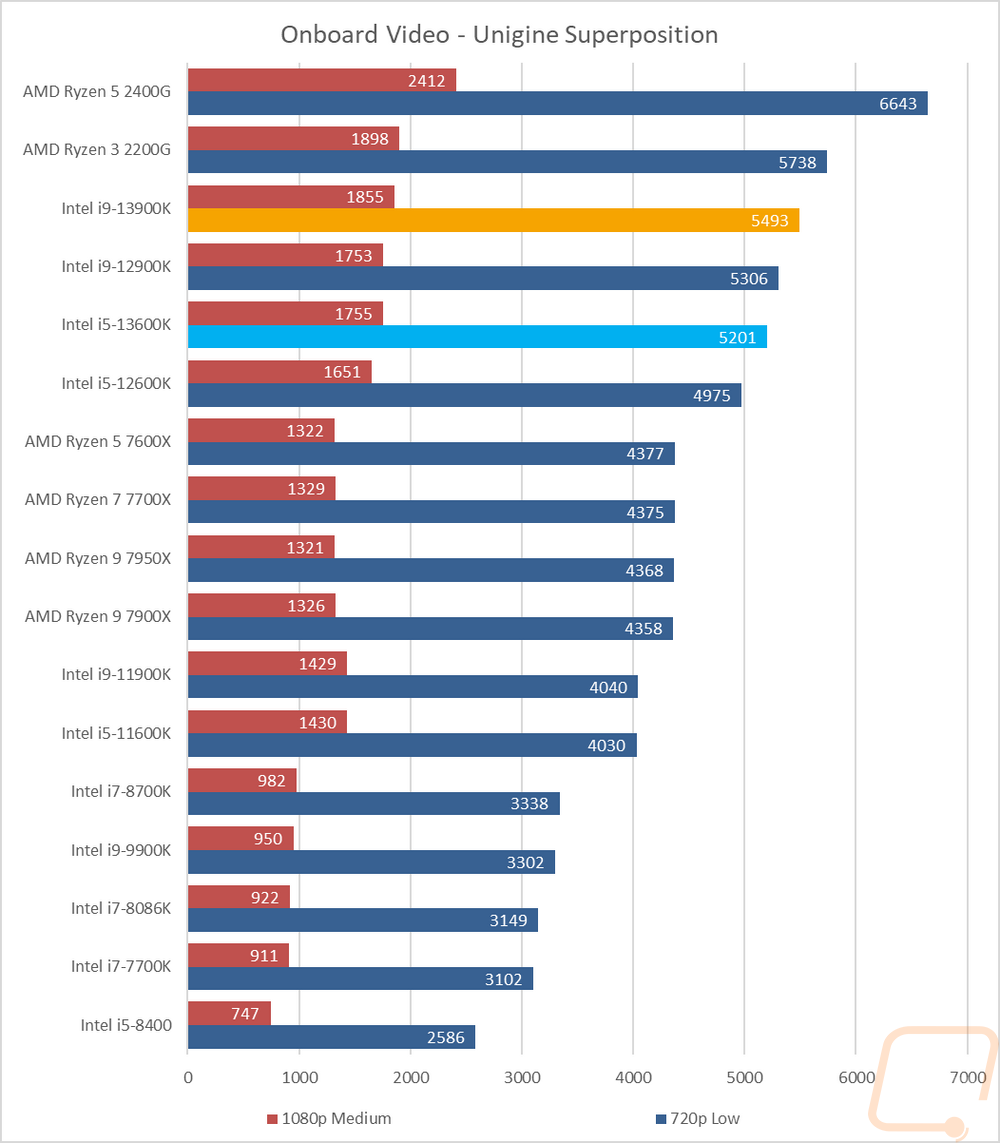
In Unigine Superposition I ran the 1080p medium detail and 720p low detail tests. The 13900K saw a decent performance improvement over the 12900K but it wasn’t enough to catch up to the older Ryzen APUs. The 13600K on the other hand saw an even bigger improvement which put it over the 12900K at 1080p Medium detail and closed in the 720p low detail test as well.
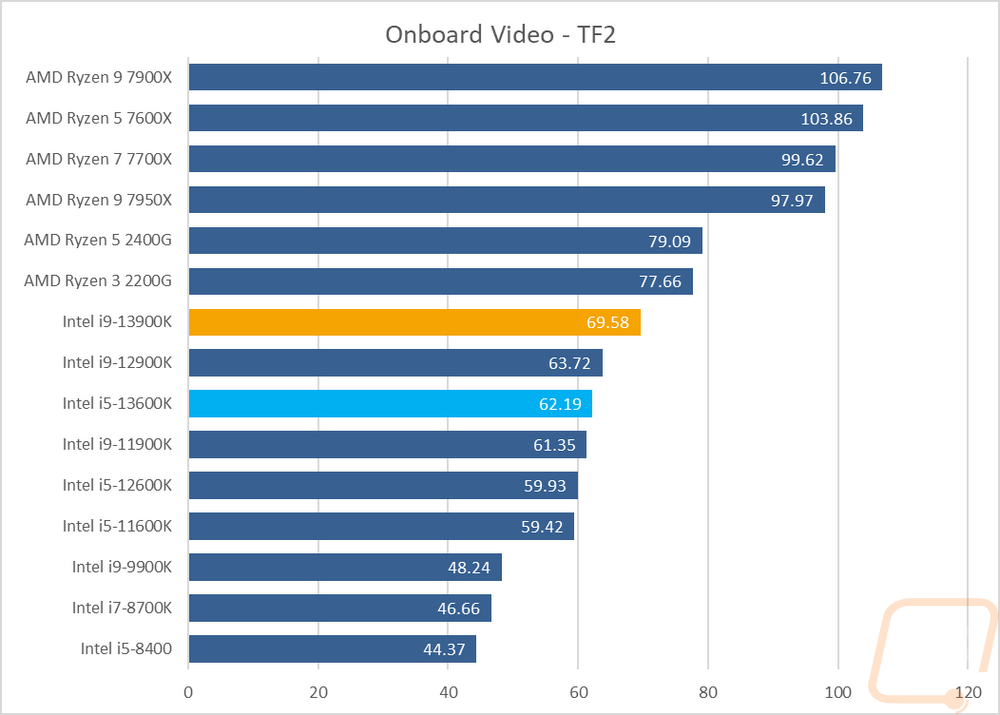
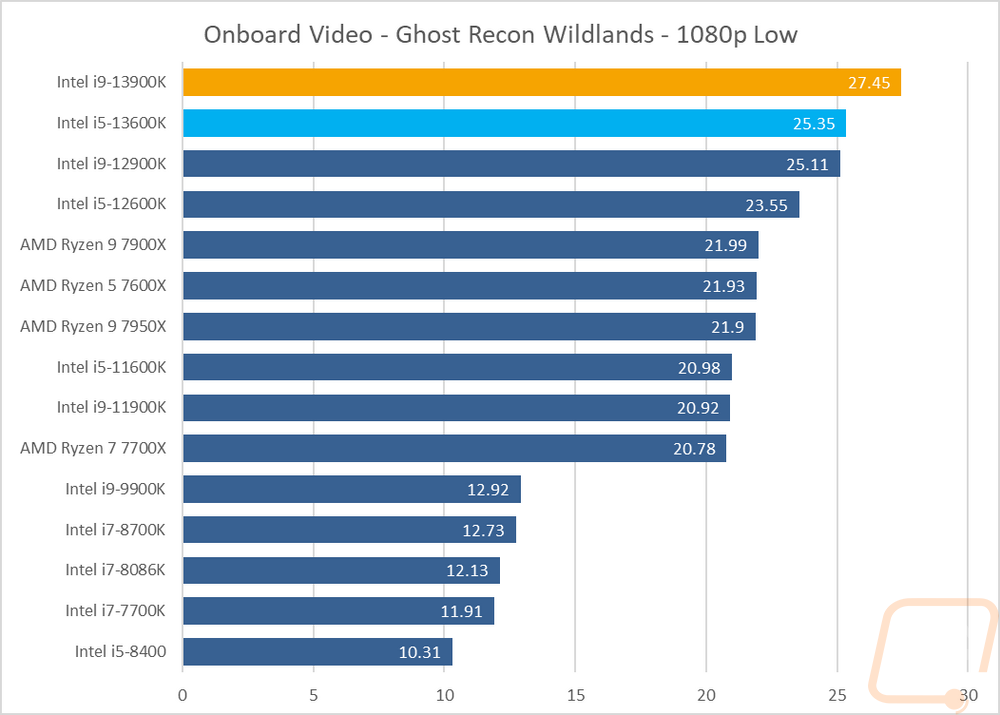
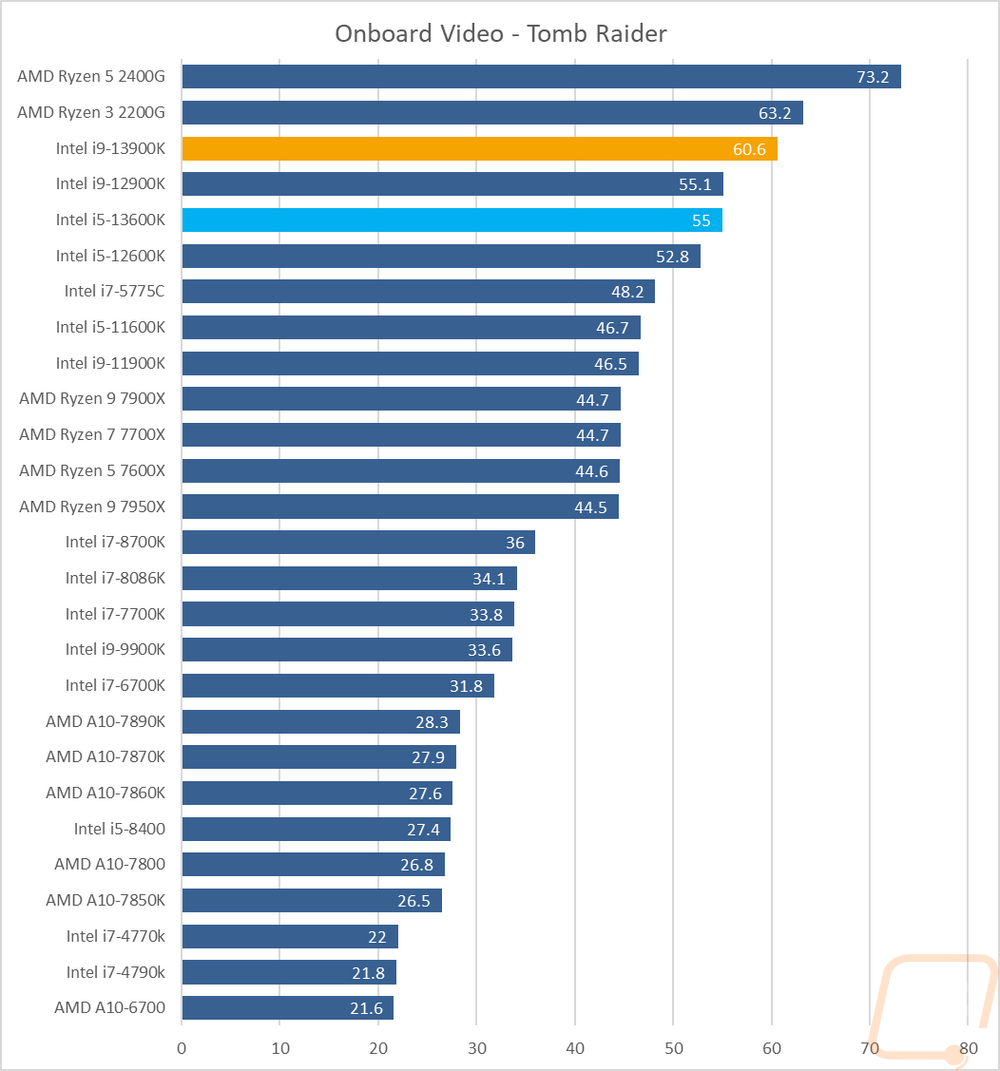
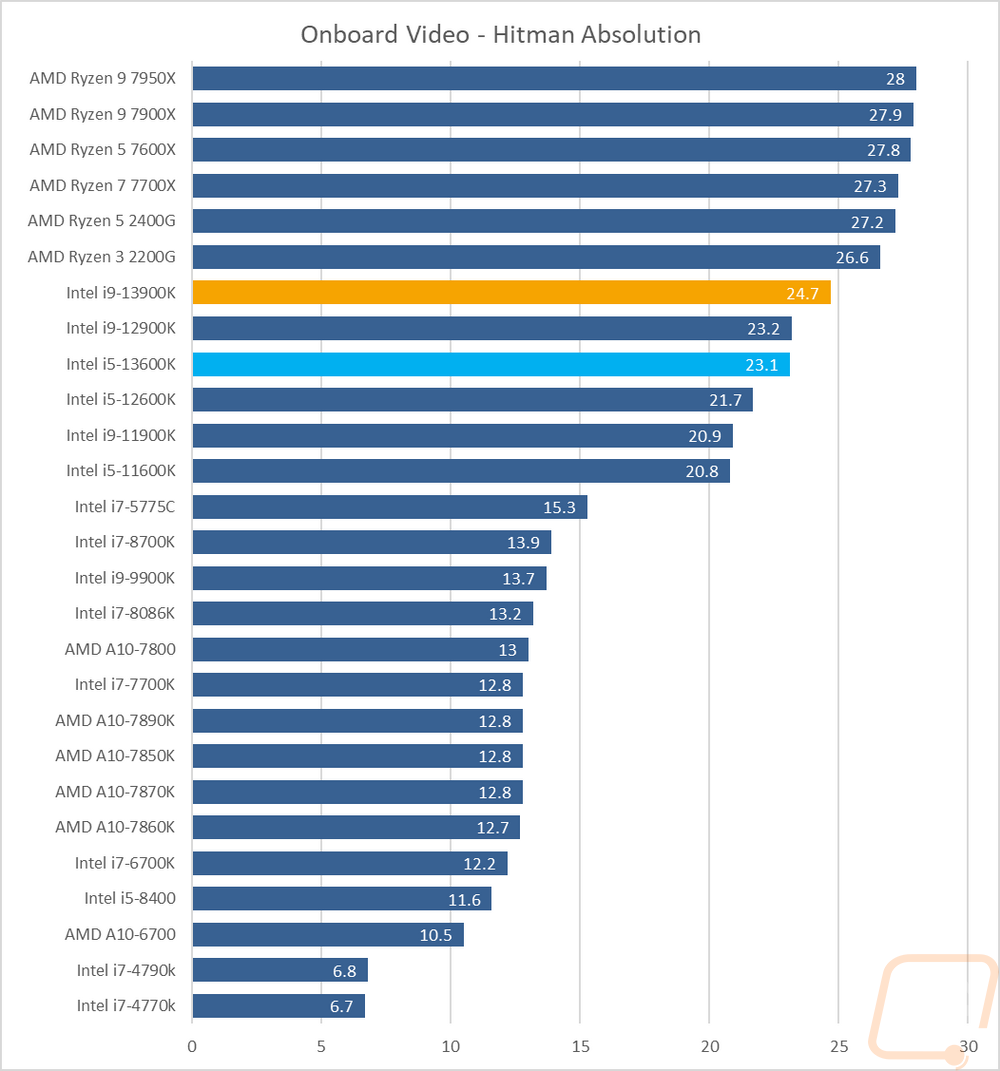
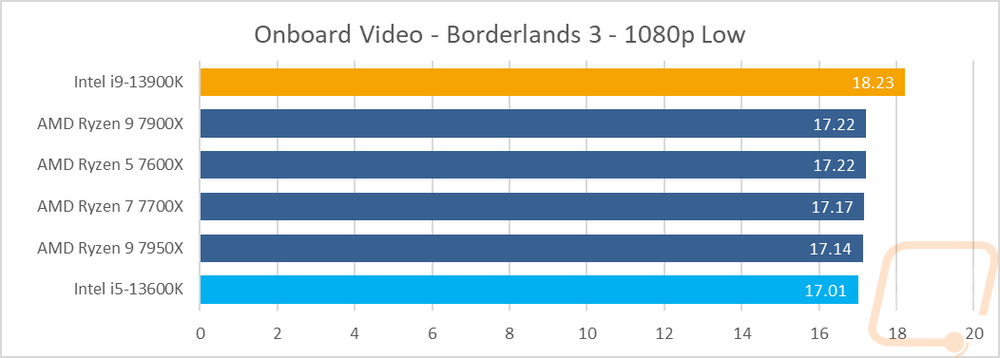
Then from there on, I jumped into game tests. Some of our tests are older games but I did also add in a few newer games as well to get an idea of newer games when tested at 1080p and low or medium settings. Both of the 13th Gen CPUs managed to improve on the performance seen in the 12th gen CPUs with both CPUs having higher iGPU clock speeds but the same UHD770 graphics. That combined with the faster CPU performance helped in all of the games. In TF2 it wasn’t enough to catch up to what AMD has going on but in Ghost Recon Wildlands both 13th gen CPUs were at the top. In Shadow of the Tomb Raider and Hitman Absolution the 13th Gen CPUs didn’t surpass the Ryzen performance but at least in SotTR the 13900K was closer at 21 FPS to 23 FPS on all four of the new 7000 Series Ryzen CPUs.
Power Usage and Temperatures
For some people, performance is the only thing important, but for others, power usage and temperatures also play a role so we do take a look at both of those as well. This is especially important in SFF or even just smaller mid-sized builds and it affects the components you need to get for your system as well as your PSU and cooler. To take a look at power usage I ran three different tests. I noted the idle power draw of our entire system then I took a look at the load wattage of the system using two different workloads. One was wPrime and the second was AIDA64 using their FPU workload which is extremely demanding. At idle the testbench with the 13900K was running at 68.2 watts which were a little better than the 12900K did at idle. The 13600K dropped a few more watts to 65.9 watts. Turning the wPrime workload on put the test bench with the 13900K on it at 197 watts and the bench with the 13600K at 124. This is a lot more than with the 12900K but this seems to be more related to changes that have the 13900K doing a little more work in wPrime. A better representation is the tests with AIDA64’s FPU workload which can fully load the dual-core type design. For that test, the system with the 13900K pulled 334 watts, and the 13600K pulled 261 watts. This was a little under the 12900K which may be a surprise but I can explain and this was basically on pair with the 7950X.
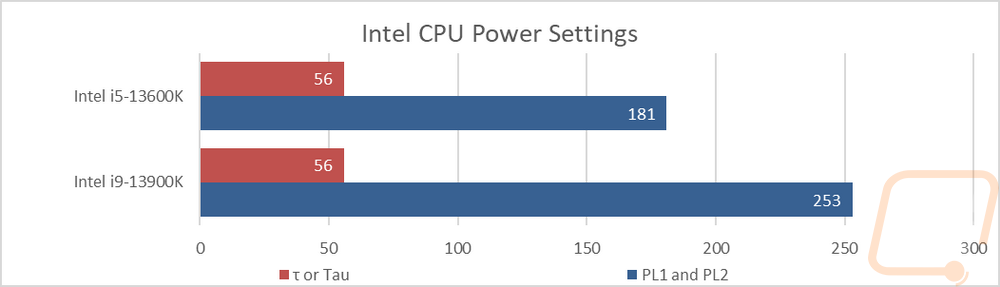
So I mentioned it earlier but because power testing is so dependent on this I did want to cover it again. Like with the 12th Gen Intel launch there are some specifics to how we set the test bench up that affect the power usage and temperatures along with performance. If you install either of these CPUs into your motherboard and just run it most boards are set up to let their PL1 and PL2 power settings run wild so we have those setup with the 13900K and 13600K set to what the Intel specifications call for. Both have the Tao set to 56 and then the 13900K has its PL1 and PL2 set to 253 and 181 for the 13600K. Beyond that, the ICCMax by default can go crazy as well and Intel has suggested 200A for the 13600K and 307A for the 13900K so both of those are set up that way for ALL of the testing. It’s important to also note that this is different than how AMDs suggested settings were for the 7000 Series CPUs which are designed to let run wild. The Icc limit does also help explain why the 12900K pulled more wattage than the 13900K when using the AIDA64 FPU workload. For some motherboards like MSI, the PL1/PL2 settings are what is changed when you ask what cooling solution you are running.
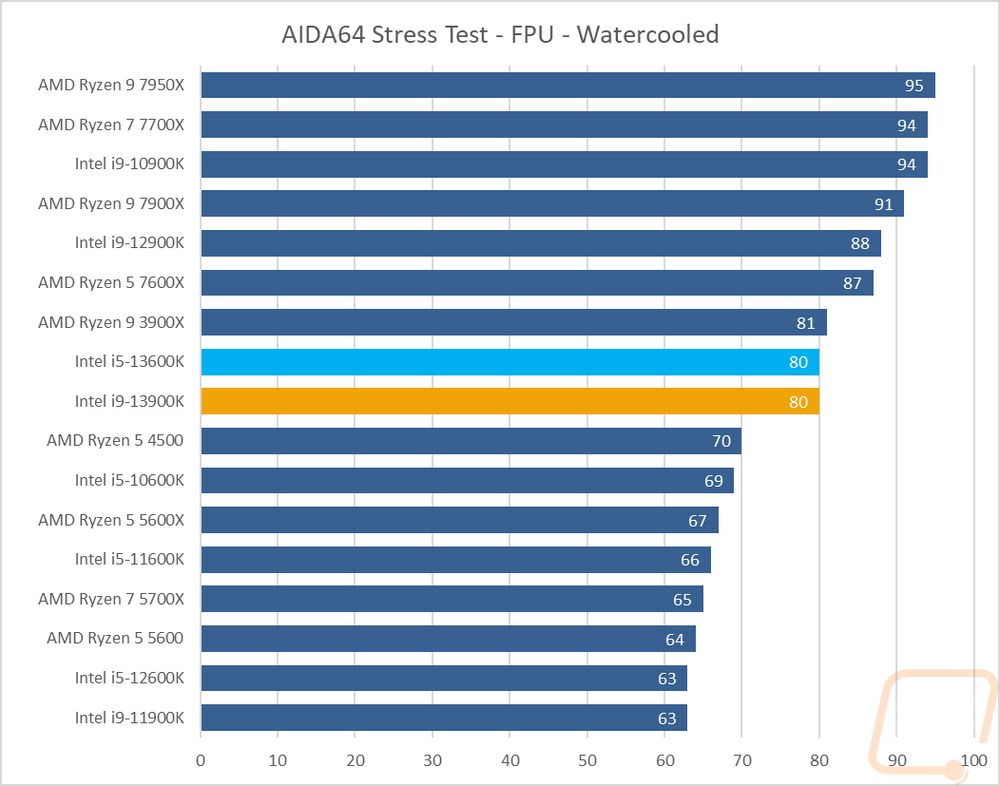
Now that we have that established we can now talk about the cooling performance. With the AMD 7000 series CPUs because of those settings they would run up to the 90-95c range no matter what cooler you are running and these would do the same if running the default settings with most motherboards that will auto overclock them. But with the suggested settings both CPUs ended up leveling off in our testing while running AIDA64 at 80c. That isn’t cool by any means the 13600K especially is running warmer than the 12600K did in the same test. But overall it is better than the current generation of AMD CPUs. That said, with both CPUs you do want to get as much cooling as you can. This testing was done with a 240mm AIO for reference.
Overall and Final Verdict
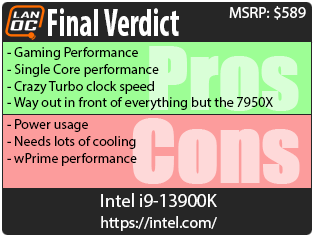
Well, the hits keep on coming, Intel has managed to push the limits even further now with the 13th Gen CPUs, especially with the i9-13900K which has a crazy max turbo speed of 5.8 GHz. In all of our single-core and single-thread tests, the 13900K took back the crown from AMD after their 7000 Series launch with a few of the tests even putting the 13600K ahead of those same CPUs as well in the single-core tests. That single-core performance and the crazy clock speeds helped with the in-game performance. Altogether the i9-13900K took the lead back from Intel in a majority of the tests by a small margin. The Ryzen 9 7950X did still come out ahead in the tests that were the most multi-threaded, while both CPUs have the same thread count the mixed core types of Intel’s CPUs were held back there, especially in wPrime which while there was a big improvement over last years 12900K the 13900K still struggled.
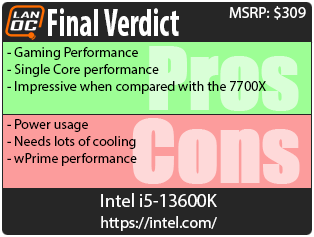
The i5-13600K on the other hand may not have been at the top of the charts, it did perform well above its weight class getting a lot closer to last year's 12900K in some tests than I would have expected. More importantly, it was consistently ahead of AMD's new Ryzen 7 7700X which has a higher MSRP making the i5-13600K very promising for the upper mid-range builds. Both the i9-13900K and the i5-13600K both do demand a lot of power when under heavy loads which is something to keep in mind when picking out your power supply. They also have high cooling demands, running them within Intel’s recommended PL1/PL2 and TccMax settings helped keep the temperatures well under what the AMD 7000 series CPUs were doing, but I still wouldn’t consider them cool running by any means. A large air cooler is possible, but water cooling is highly recommended, and the bigger the better.
As for pricing, the i9-13900K has an MSRP of $589 which for comparison the Ryzen 9 7900X is $549 and the 7950X is $699. The i9-13900K performance wise runs with the 7950X in some tests and comes in behind it in others but is consistently well above the 7900X which is closer in performance and I would say that getting close to the performance of the $699 7950X for $110 less (and being faster in single core applications) isn’t too bad. The i5-13600K on the other hand has an MSRP of $309 and as I have already mentioned was consistently ahead of the Ryzen 7 7700X which AMD has priced at $399, $90 more than the 13600K, making it a good value compared to the competition. The 13600K did go up in price by $20 compared to the 12600K where the 12900K and 13900K stayed the same price, but that doesn’t take away from its value compared to the 7700X. Intel also has the option to go with a DDR4-based motherboard where the 7000 Series of Ryzen is locked in with DDR5 and while DDR5 pricing has come down, a cheap 32GB kit is still going to cost you $50 more right now.

Live Pricing: HERE

Live Pricing: HERE


