
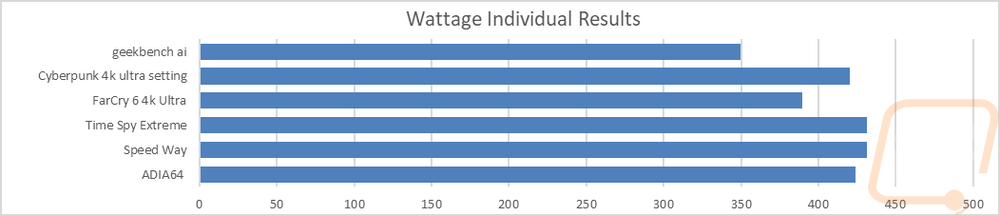
For my last few tests, rather than focusing on in game performance, I like to check out other aspects of video card performance. These are also the most important ways to differentiate the performance between cards that have the same GPU. To start things off I took a look at power usage.
For this, our test setup utilizes the Nvidia-designed PCat v2 along with cables to handle both traditional 6 or 8-pin connections as well as 12VHPWR. The PCat also utilizes a PCIe adapter to measure any power going to the card through the PCIe slot so we can measure the video card wattage exclusively, not the entire system as we have done in the past. I test with a mix of applications to get both in game, synthetic benchmarks, and other workloads like GeekbenchAI and AIDA64. Then everything is averaged together for our result. I also have the individual results for this specific card and I document the peak wattage result. The RTX 5080 Vanguard SOC does pull more power than the stock-clocked Founders Edition. It averaged 407 watts whereas the Founders Edition was 18 watts lower at 389 watts. For peak power, the RTX 5080 Vanguard SOC pulled 431 watts whereas the Founders Edition peaked at 422. That said the difference wasn’t enough to split the two cards apart in the chart. They are both still behind the RX 7900 XT and ahead of the RTX 3080. More importantly, for comparison to cards they compete with. The 7900 XT averaged 435 watts, the 4080 SUPER averaged 248 watts, and the 4090 averaged 456 watts.

With having exact peak wattage numbers when running Time Spy Extreme I was also able to put together a graph showing the total score for each watt that a card draws which gives us an interesting look at overall power efficiency in the popular and demanding benchmark. The RTX 5080 Vanguard SOC had a score of 32.3 points per watt, the Founders Edition with its lower power usage was more efficient and up closer to the top of the chart with a 38.4. The RTX 5080 Vanguard SOC did still come in ahead of the RX 7900 XTX but the 4080 SUPER and the 4090 are both up higher as well. This is one of the big tradeoffs with overclocked cards, you get better performance but you trade off some of the power efficiency.

My next round of tests were looking at noise levels. These are especially important to me because I can’t stand to listen to my PC whirling. Especially when I’m not in game and other applications are using the GPU. For my testing, though I first tested with the fan cranked up to 100% to get an idea of how loud it can get, then again at 50% to get an idea of its range. The RTX 5080 Vanguard SOC came in right in the middle of the pack on the 50% fan speed result which was lower than the Founders Edition by .9 of a decibel. With the fans cranked all the way up on the other hand that flipped. The RTX 5080 Vanguard SOC came in at 59.9 dB which was 1.5 higher than the Founders Edition. The fan RPM chart is interesting, but we do have to keep in mind there are three fans, not two. The RTX 5080 Vanguard SOC is in the middle of the chart for fan RPM and typically we would see the noise levels be similar on the noise chart.


I also take a look at noise performance while under load. For that when running AIDA64’s stress test I wait until the temperature of the card has leveled off and then measure how loud things are when the card is at its worst-case scenario with the stock fan profile. The RTX 5080 Vanguard SOC is right at the bottom of our chart. A majority of the cards tested have been the reference or Founders Edition versions, but there are other aftermarket cards in the mix as well. The 34.2 dB result for the RTX 5080 Vanguard SOC is impressive, especially compared to the 39.7 dB from the Founders Edition in the same situation. The 100% fan speed results were a little scary but none of that matters if it never needs to turn the fans up and clearly that is the case here. It only ran the fans at 36% fan speed when under load.


To finish up my testing I of course had to check out the cooling performance. To do this I ran two different tests. I used AIDA64’s Stress Test run for a half-hour each to warm things up (on everything except the 5090 which was tested on a similarly matched OCCT workload). Then I documented what temperature the GPU leveled out at with the stock fan profile and then again with the fans cranked up to 100%. With the stock profile, the RTX 5080 Vanguard SOC came in at 63c which is in the middle of our chart and is 3c lower than the Founders Edition. As we saw just a minute ago, this is because the fans were only running at 36% while under load. For memory temps in that same test, they were a little cooler at 60c. Cranking the fans up to 100% the RTX 5080 Vanguard SOC’s cooling performance changed significantly. It dropped down to 45c which is a delta of 18c. That is a huge performance difference that shows there is a lot of headroom in the cooler over what MSI has the stock fan profile set to do. This is the Silent BIOS on the BIOS switch which is how the card shipped. I would bet that gaming switch is a little more aggressive here. That said, the stock fan profile temps weren’t bad. If I were changing the fan profile I might only adjust things down slightly if at all and enjoy the card being quiet while knowing that if needed there was plenty of room to keep things running cool and safe.


While running the stock fan profile testing I also took the time to get a few thermal images so we could see what is going on. Given how cool the RTX 5080 Vanguard SOC ran, it's no surprise that the card was cool as well. The fan side of the card had its hottest spot at 31.8c which was behind the left fan. The other two were in the mid 20’s at the hottest spots behind the fans. Up on the top edge, the hottest spot is in the center where the PCB was visible and that was running at 46.5c, the rest of the heatsink that is visible on the top edge was at 38.5c and 31.9c. On the back the backplate has most of the temps evened out but it is warmer in the bottom right running at 48c. The rest of the back plate on that side was 38c. The hotspot was one of our power cables. As it turns out, when running a long thermal test you should make sure the cable isn’t sitting right in the blow-through area up against the card. In addition to the heat that the power going through the cables can do when under load for a long time, the heat from the cooler added even more. You can see it's just the one cable. The 73c reading is most likely a little wrong because it is a glossy finish. It didn’t feel that hot, it was warm though.


