
Yesterday I took a look at Nvidia’s RTX 5080 Founders Edition and today both the RTX 5080 and RTX 5090 hit stores. Along with the sale embargo, we can finally take a look at the overclocked aftermarket cards as well. MSI has a wide variety of RTX 5080 card designs, with 21 different SKUs. Some of those are different variations on product lines that we have seen MSI have in the past like the Shadow line, Gaming Trio, Ventus, and my favorite, the Suprim lineup. There were two new lines though with the Inspire line and the Vanguard line. MSI ended up sending over their RTX 5080 Vanguard SOC in the Launch Edition packaging so we get a chance to see what that new lineup is all about. Let’s dive in and see what features the card has, how it performs, and how it compares with the Founders Edition as well.
Product Name: MSI RTX 5080 Vanguard SOC Launch Edition
Review Sample Provided by: MSI
Written by: Wes Compton
Amazon Affiliate Link: HERE
What is new?
Nvidia announced a lot with this one so let’s try to touch on as much as we can. They of course had a few hardware announcements for the 50-Series. They have announced four cards, the RTX 5090, the RTX 5080, the RTX 5070 Ti, and the RTX 5070. That is the new 50-series RTX family. The slides below include their focus on them. The 5090 for example is targeted at 4k 240 Hz and the other three are targeted at 2k or 1440p performance. They all have GDDR7 VRAM with the flagship RTX 5090 having 32 GB and a 512-bit interface. The RTX 5080 cuts that in half to 16 GB, the RTX 5070 Ti also has 16GB, and then the RTX 5070 has 12 GB.


The new GPUs are based on the Blackwell architecture and they do have new updated RT and Tensor cores with that being the 4th gen for the RT Cores and 5th gen for Tensor cores. The new tensor cores can now also handle floating point (FP) 4 along with FP8 and FP16. They also have introduced an AMP processer which is the AI Management Processor to help schedule AI tasks alongside of graphics rendering. They have increased the number of NV encoders and decoders, it now depends on the card model and isn’t a flat number of them across the entire generation of cards. They have also moved to PCIe Gen 5 and DisplayPort 2.1b including UHBR20. For pricing the RTX 5090 comes in at $1999, the RTX 5090 is half that (just like its memory) at $999. The RTX 5070 Ti is $749 and the RTX 5070 is $549.


Some of the main goals with Blackwell were to optimize the neural workloads and reduce the memory footprint. No big surprises there. Memory is one of the more expensive parts of the cards and anyone who has been paying attention knows that neural workloads and AI have been where Nvidia has been seeing the biggest improvements. Combining those things they have brought AI into shaders with neural shaders. The example of this they show is a hair being rendered with ray tracing and how using spheres rather than triangles helps use less data which means less VRAM and higher frame rates.


Nvidia announced Transformer which replaces CNN as the model they use with Super Resolution. They have improved the design significantly to get better detail when scaling this up. On top of that, they announced DLSS 4 which has improved on the frame generation that they introduced with DLSS 3. It is now Multi Frame Generation. Where before they were able to generate every other frame, they can now do x3 or x4. This gets interesting once they add in DLSS Super Resolution as well because that is already rendering ¾ of the image. With both, they are rendering 15 of 16 pixels using AI. Of course how well this works then depends a lot on how good the renders are. But it gives huge improvements in performance and with frame generation, we know that those improvements still happen even if you are PCU limited for example. The example they show has DLSS off at 27 FPS, turning on Super Resolution it goes to 71 FPS. DLSS 3.5 gets you to 140 FPS and DLSS 4 is 248 FPS. DLSS is already supported by a LOT of games and Nvidia is saying that DLSS 4 will have 75 games and apps supporting DLSS 4 at Day 0. Some of those will be by using the Nvidia App, which can override the DLSS settings on some games. It is also important to note that some of these features will go back and work with legacy cards as well. Specifically, DLAA is going to work back to the 20 series of cards, same with the improved DLSS Super Resolution. The new multi-frame generation however only works with 50 series cards.


They also introduced a new Nvidia Reflex. Reflex helps improve responsiveness to get lower latency through the entire pipeline. Were Reflex offered 50% faster responsiveness the new Reflex 2 gets you 75% by using frame warp. They say that is coming first to 50 series and will be available in games like Valorant soon.


Below I have the specifications for the RTX 5090 as well as the last two xx90 cards. We can see that the number of GPCs hasn’t changed from the 4090 to the 5090 but they did increase the SMs from 128 to 170. The CUDA core SM count is still the same but there are now 21760 CUDA cores to the previous 16384, a 32% increase. We still have 4 Tensor SMs but the new 5th gen design has 680 cores now. For clock speed, the RTX 5090 is set lower than the RTX 4090 with a clock speed of 2407 MHz. There are 32% more RT cores which is a 32$ increase but the RT FLOPS has jumped up 66% with the new RT design. The memory has increased from 24 GB up to 32GB and it now uses GDDR7. They have also increased the memory interface up to 512-bit from 384-bit which the 3090 and 4090 both had. The memory data rate has gone from 21 Gbps up to 28 Gbps and the bandwidth increased with that and the larger pipeline from 1008 GB/sec up to 1792 GB/sec a 77% increase. The cache has increased in side with the L1 cache going from 16384 KB up to 21760 KB and the L2 increasing as well from 73728 KB up to 98304 KB. The TGP also had a big jump going from 450 watts on the RTX 4090 to 575 watts here on the RTX 5090. This is an even bigger gap when you include the RTX 3090 which was 350 watts. The manufacturing process is still the TSMC 4nm 4N process so no changes there I mentioned it earlier but all of the 50 series cards moved to PCIe gen 5 and the RTX 5090 is no different. For pricing, it has an MSRP of $1999 which is $400 more than the RTX 4090 but is similar to the RTX 3090 Ti which also launched at $1999 back in 2022.
|
Specifications |
|
|
Model Name |
G5080-16VGSL |
|
Graphics Processing Unit |
NVIDIA® GeForce RTX™ 5080 |
|
Interface |
PCI Express® Gen 5 |
|
Core Clocks |
Extreme Performance: 2745 MHz (MSI Center) Boost: 2730 MHz (GAMING & SILENT Mode) |
|
CUDA Cores |
10752 Units |
|
Memory Speed |
30 Gbps |
|
Memory |
16GB GDDR7 |
|
Memory Bus |
256-bit |
|
Output |
DisplayPort x 3 (v2.1b) HDMI™ x 1 (As specified in HDMI™ 2.1b: up to 4K 480Hz or 8K 120Hz with DSC, Gaming VRR, HDR) |
|
HDCP Support |
Yes |
|
Power consumption |
360W |
|
Power connectors |
16-pin x1 |
|
Recommended PSU |
850W |
|
Card Dimension (mm) |
357 x 151 x 66 mm |
|
Weight (Card / Package) |
1945 g / 3991 g |
|
DirectX Version Support |
12 Ultimate |
|
OpenGL Version Support |
4.6 |
|
Maximum Displays |
4 |
|
G-SYNC® technology |
Y |
|
Digital Maximum Resolution |
7680 x 4320 |
Before getting into testing I also ran GPUz to double-check that our clock speeds match up with the specifications. The RTX 5080 Vanguard was clocked at 2730 MHz for our testing which matches the boost speed for both the gaming and silent BIOS modes for the card. It’s an overclock of 113 MHz over the Founders Edition. I tested the Vanguard using the same 572.02 Beta driver provided by Nvidia ahead of the launch to press.

Packaging
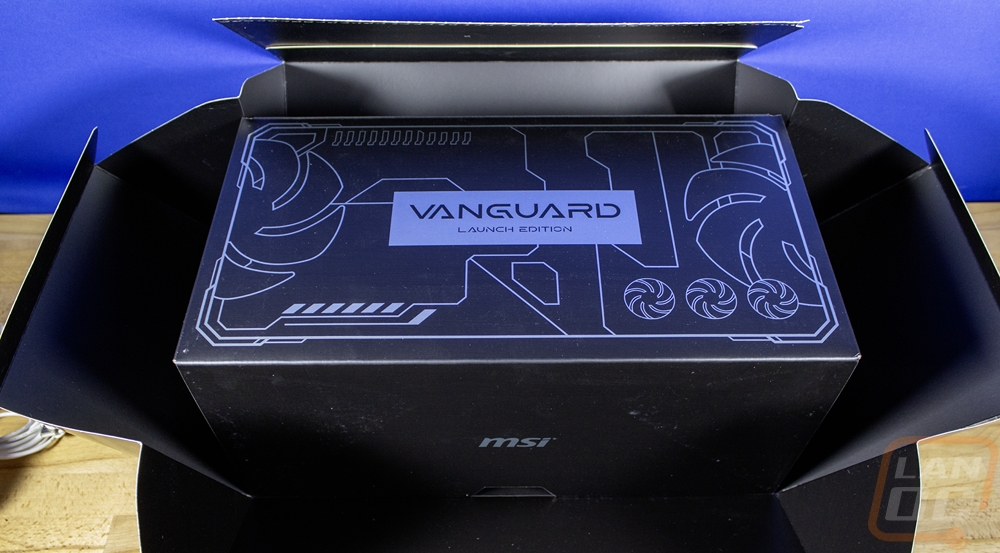
The box for the RTX 5080 Vanguard SOC was huge, that was partially because MSI sent over the Launch Edition which is a special edition celebrating the launch of the Vanguard lineup. The front of the box has a black background with the Vanguard Launch Edition in the center with a reflective finish and the SOC sticker in the top right corner. The black background has a design printed on it with a glossy black that includes drawings of Lucky their dragon mascot as a photographer and an investigator. The 5080 branding is on the black and green wrap-around that all Nvidia cards have to have so it's clear what card you are getting here. The box opens up with a pull tab on top, the top does have the 5080 model name and an MSI dragon logo up there. Then around on the back of the box, they use the large box space to include a picture of the RTX 5080 Vanguard SOC in the background. Next to that, they list out a few of the card’s features. The Nvidia wrap-around lists out Nvidia-specific features and has a base specification listing for the 5080 itself. Sadly there isn’t a full specification listing, if shopping in a store it would be good to know at least the card dimensions, display connections, and power requirements. The clock speeds would be good as well, but I can understand why that wouldn’t be included given that there is an SOC and non-SOC model. The back also has a box that talks about the Blind Box of Lucky which shows that the Launch Edition comes with a Lucky the Dragon figurine. This is the Around the World Series and there are 10 versions in total, 9 are standard and there is one secret rare Lucky as well.


Some video card boxes have a slide on outer packaging but for the RTX 5080 Vanguard SOC Launch Edition the entire outside of the box unfolds and shows the box inside. It’s a cool design but because you use the pull tab on top to open the outer box it doesn’t go back together for storage at all which I don’t like. The inside box is flat black and has more line drawings on it like the front of the outer box did. This time though the print is in silver. It has the Vanguard Launch Edition on top in the center and some of the fans are drawn on the box as well. The lid flips up and you have black and white drawings of the 9 standard Luckys. Inside is a thick foam panel which has the Lucky figurine on the left and on the right some of the documentation and accessories. The foam insert comes out and under it, you will find more documentation and the RTX 5080 Vanguard SOC itself which is wrapped up in a static protective bag and in a second foam tray. One thing is for sure, with the amount of foam and the huge box the RTX 5080 Vanguard SOC isn’t going to get damaged in shipping unless it is run over by a forklift.


For documentation, you get two things. Up on top of the packaging you get this card for the Lucky Around the World blind box and it has pictures of the nine standard Luckys. On the back, it is a welcome message that invites people to try to collect them all. The other documentation that was down in the bottom half with the card is MSI’s graphics card quick start guide. This is a generic manual, not anything specific to the RTX 5080 Vanguard SOC, but if you are new it does have enough information to help you get going as well as a QR code on the front to help as well.


Like with the Founders Edition, the RTX 5080 Vanguard SOC does come with a 12VHPWR adapter cable for those who don’t have a power supply that supports it. It adapts from three PCIe 8-pin power connections down to the one 12VHPWR plug. MSI ships it bagged up and the bag has a large warning sticker across it. This asks that you use individual PCIe cables on each plug, not the daisy-chained plugs, and shows how to make sure the connection is seated all of the way. Like with the Founders Edition MSI has made changes here to help make sure the connection is secure to avoid the melted connections that some people had happen last generation. MSIs solution is an interesting one. The plug is black but the pin area is all bright yellow, if you see yellow then you aren’t plugged all the way in. It's surprisingly simple but effective. Beyond that, their adapter is just like the adapters used last generation. The Founders Edition adapter with its longer and more flexible cables and individual sleeving isn’t used here, I would love to see both be combined, getting the bright plug design on the rest of the cable that Nvidia used would be perfect.


Along with the adapter cable, you also get an MSI-branded metal sag prevention support. This has rubber on both ends for grip and it unscrews to get longer to adjust to the height you need for your card, nearly doubling in height.


Last up, we have the Lucky Around the World figurine. Would I get lucky and get the secret 10th design? NOPE! I got guard Lucky with its British guard hard and jacket. His wings stick out the back and he is carrying a triple fan video card. It comes with a card and the MSI branded stand to stick him on.


Card Layout and Photos
With the addition of the Vanguard cards into MSIs lineup, it does make you wonder what the goal was with the new lineup. From what I can see the goal was to take the cooling performance seen in the Suprim lineup but to cover it in a more traditional “gaming” themed cooler. Part of that is taking the fan shroud and using more plastic in its design. More plastic means they can have more intricate or aggressive designs and with that add in more lighting as well. The RTX 5080 Vanguard SOC has a triple fan design and while the new design uses plastic for all of the black areas there are three pieces of aluminum as well, those are the dark grey panels. With plastic, they were able to put the deep groves on the bottom right corner and up under the aluminum panels above and below the far left fan. There is also some carbon fiber mixed in as well. In the end, it feels like a mix between the Suprim line and the Carbon motherboard line. The card itself is very large. It is 357 mm long, 151 mm tall, and 66 mm thick. That thickness puts it as a 3 ½ slot card. For comparison with the Founders Edition card I took a look at yesterday, that card was 304 mm long, 137 mm tall, and 40 mm thick.


The RTX 5080 Vanguard SOC has MSI’s Hyper Frozr thermal design which starts with their three Stormforce fans. Each fan is near 105 mm wide and in a 110 mm wide hole. They have seven blades and an axial design that blows down into the cooler. They have what MSI calls a claw texturing which you can see near the outside end of each blade and an outer ring that gives the blades more strength. Each of the fans has a double ball bearing design to help with fan life. They blow down into the heatsink which has horizontal sheet aluminum fins. You can see it through the fans but they have what they call the wave curved 4.0 design which each fin has waves in it and they are staggered to help with airflow and to cut down on turbulence. There are square-shaped heatpipes that get the best possible contact with the vapor chamber that sits on the GPU and VRAM and to prevent turbulence they have heatsink fins that cover the square core pipes. The PCB itself uses 2 oz of copper which should help with heat dissipation as well.


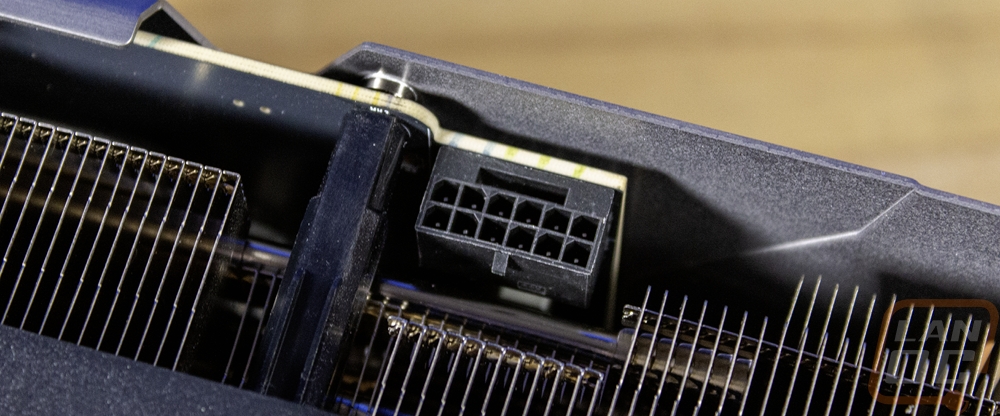
The top edge of the RTX 5080 Vanguard SOC has a few things going on. For starters, there are two areas where the rear backplate wraps around to the top here including where they have the GeForce RTX branding printed on it black. Most of the top edge of the card has the heatsink exposed for airflow but above the third fan the front shroud wraps around and the card has a clear plate with the MSI logo and dragon etched inside, this is backlit with lighting and has a carbon fiber like finish behind it. Also here just behind the front of the card are groves which if you look closely have diffused lighting inside of each grove. At the center of the card, right at the end of the PCB is the power connection. It is recessed down just slightly. I would prefer to see this plug being angled, similar to on the Founders Edition, given how tall the card is you want any help you can get to get that connection turned without putting strain on the connection and this design is going to have some strain on it. As far as the connection goes, MSI doesn’t have any information on whether this is the same 12VHPWR as before or is using the 12V-2x6 connection that has changed the pin lengths inside to get a better connection and to pick up if you aren’t plugged in better.


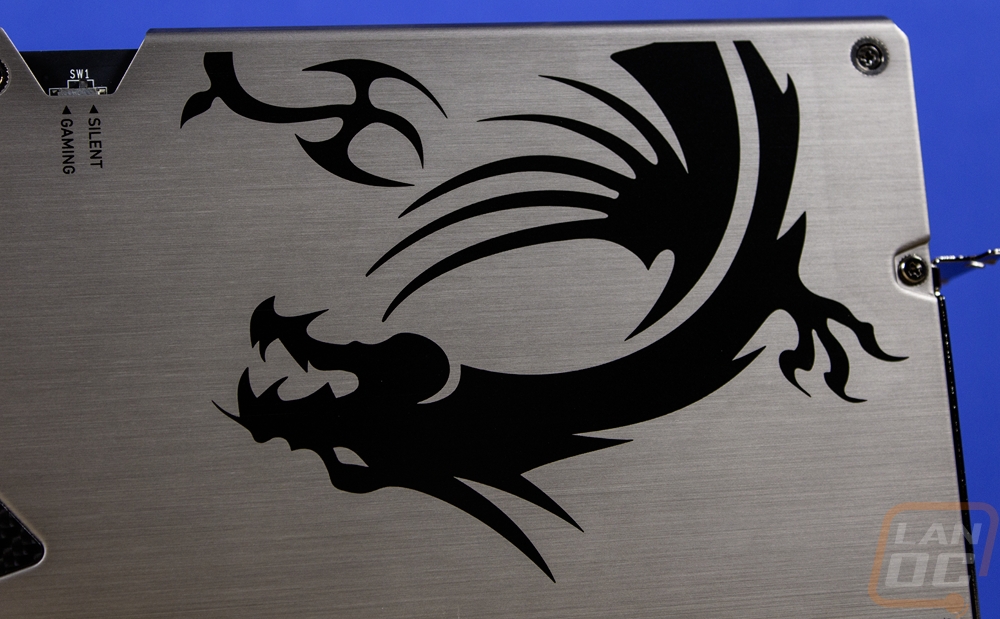
The back of the RTX 5080 Vanguard SOC has an aluminum backplate that runs the full length of the card including down at the end where they have the blow-through cooler. It has a silver brushed finish and on the PCI bracket end of the card, it has a large black dragon on it and the GeForce RTX branding which is upside down to make it readable when installed in a case. Near the dragon up on the top edge, the card has a BIOS switch that switches between gaming and silent modes. This doesn’t change the clock speeds however. Near the center, there are two angled accents stamped into the aluminum and MSI has put a carbon fiber accent in those along with the MSI branding. Then past that the backplate has three large holes cut out as well as cutouts at the top and bottom that help allow for airflow on the end of the card that doesn’t have any PCB to block airflow through the card.


Looking around at the edges of the card confirms some of what I already mentioned. From the top and bottom of the card, the backplate and the fan shroud wrap around slightly but for the most part, the top and bottom are open to airflow. That gives us a good look at the horizontal heatsink layout. It also lets us see how tightly MSI was able to keep it up against the components and how at the halfway point of the card the PCB ends and the other half of the card is a blow-through design. In that area, the heatsink is noticeably thicker. The bottom view gives us a good look at the vapor chamber over top of the GPU and VRAM and we can see how the heatpipes curve down and run across that to get the best heat transfer. Also on the bottom to handle the three fans and all of the lighting, there is a big bundle of cables. Then on the end of the card, the shroud wraps around here and is completely capped. The end has another crystal accent with the MSI Gaming dragon etched in it. We can see a side profile of a lot of the aggressive shapes from the front of the card here and there are three screw holes to mount the card for cases that have anti-sag mounting built into them.


For display connections, the RTX 5080 Vanguard SOC has the same configuration as the Founders Edition with three DisplayPort 2.1b ports and one HMDI 2.1b as well down at the bottom. The PCI bracket has a tinted finish but isn’t blacked out like I would like to see. The rest of the bracket is covered in large ventilation holes which is interesting, not just because the fans blow down but you can see through the holes that a majority of it is blocked off anyhow. The bracket itself is a 2 slot but they could have gone with a three-slot for a little more support given the cards size.

If you were curious how the RTX 5080 Vanguard SOC compares to the Founders Edition 5080 I did get pictures with them next to each other. The Founders Edition isn’t a small card when it comes to its length and height and even still the RTX 5080 Vanguard SOC manages to make it look small in that side profile picture. The top down is even crazier, the RTX 5080 Vanguard SOC wouldn’t look as bad if the Founders Edition was still a triple slot card but with it being a dual slot now it shows how big the Vanguard is.


Before getting into testing I did get a few shots of the RTX 5080 Vanguard SOC with the lighting on. Where the RTX 5080 Founders Edition just had white lighting MSI has given this their Mystic RGB lighting. On the fan side, the carbon fiber strip has its recessed lighting up under both the top and bottom edges all the way across the card. What I didn’t expect was that lighting would also light up inside of the card and light up the heatsink in areas. The wave curved 4.0 edges are really visible with the lighting on and it looks good. Up on the top of the card, the crystal MSI logo is all lit up, and next to that each of the groves has lighting behind it as well.


Test Rig and Procedures
Test System
CPU: AMD Ryzen 7 9800X3D – Live Pricing
Motherboard: ASUS ROG Crosshair X870E Hero – Live Pricing
Cooling: Enermax LIQMAXFLO 360mm Liquid CPU Cooler - Live Pricing
Noctua NT-H2 Thermal Paste - Live Pricing
Memory: G.SKILL Trident Z5 Neo RGB Series (2x16GB) 6000MT/s CL28-36-36-96 – Live Pricing
Storage: Viper VP4300 Lite 4TB – Live Pricing
Power Supply: be quiet! Dark Power Pro 13 1600W- Live Pricing
Case: Primochill Wetbench - Live Pricing
OS: Windows 11 Pro 64-bit - Live Pricing
|
Our Testing Procedures |
|
|
3DMark |
All 3DMark-based tests are done using the most recent version. We test using all three versions of Fire Strike, Both Time Spy and Time Spy Extreme, Speed Way, and Steel Nomad. Tests to look at ray tracing performance are done with Port Royal when supported and for Nvidia cards that support DLSS, the DLSS subtest is also done at 4k with the performance setting tested at all DLSS versions that the card supports. AMD cards are tested with the FSR test at 4k and at all detail levels. |
|
Cyberpunk 2077 |
Tested using the built-in benchmark at medium and ultra detail levels. This is run at 1080p, 1440p, and 4k resolutions. All tests are run with Super Sampling off and then tested again with SS on with whatever the card supports. |
|
Borderlands 3 |
Built-in benchmark testing with the ultra detail setting and medium detail setting, done at full screen with default settings at 1080p, 1440p, and 4k on DX11. |
|
Metro Exodus |
Using built-in benchmark, testing at ultra and normal details at 1080p, 1440p, and 4k. |
|
Watch Dogs: Legion |
Built-in benchmark testing at ultra and high details. Tested at 1080p, 1440p, and 4k. I also do RTX and DLSS testing on Nvidia cards at 4K using the Ultra detail settings as a base as well. |
|
Ghost Recon Breakpoint |
Built-in benchmark tested at 1080p, 1440p, and 4k with the Ultra and Medium detail settings. Texture quality is always set to high to keep tests consistent between cards. |
|
Far Cry 6 |
Built-in benchmark tested at 1080p, 1440p, and 4k with the Ultra and Medium detail settings. |
|
Total War: Pharaoh Medium |
Built-in benchmark using the Battle Benchmark setting. Tested at 1080p, 1440p, and 4k at both high and ultra detail settings |
|
S.T.A.L.K.E.R. 2: Heart of Chornobyl |
Tested using a frameview capture while walking around outside. Tests are done at medium and epic details at 1080p, 1440p, and 4k resolutions. |
|
GeekbenchAI |
GeekbenchAI tested using the ONNX DirectML setting. |
|
Procyon |
AI Image Generation Benchmark - Stable Diffusion XL |
|
Blender |
Using the standard Blender Benchmark I run the test using the Blender 4.3.0 version which tests using the Monster, Junkshop, and Classroom tests. |
|
Passmark Performance Test 11 |
Test using the GPU Compute Score |
|
V-Ray 5.02 and 6 |
V-Ray 5 benchmark us run with CUDA and RTX settings on cards that support it |
|
Power Testing |
Using a PCat v2 to monitor power between the PCIe slot and the card as well as power through the power cables I test the peak power when running ADIA64, 3DMark Speed Way, 3DMark Time Spy Extreme, FarCry 6 at 4k and Ultra Detail, Cyberpunk 2077 at 4K and Ultra detail, GeekbenchAI, and Procyon's AI Image Generation Benchmark - Stable Diffusion XL test. The results are then averaged for one result and the highest result is noted as well. |
|
Watt per Score |
The 3DMark Time Spy Extreme score is divided by the card's average power wattage result to give us an overall power efficiency to performance score. |
|
Noise Testing |
Our Noise testing is done using a decibel meter 18 inches away from the video card on the bottom/fan side of the card. We test at 50% and 100% fan speeds as well as a third test while under load using AIDA64's stress test. This is done using a Protmex PT02 Sound Meter that is rated IEC651 type 2 and ANSI S1.4 type 2. Tests are done set weighted to A and set to a slow response using the max function. The ambient noise level in the testing area is 33.3 decibels. |
|
Temperature Testing |
Using AIDA64, the GPU stress test is run for 30 minutes or until the result has leveled off. The test is run twice, once with the stock fan profile and a second time with 100% fan speed. During this, I also document the 100% fan speed RPM and document the delta between the fan profile and 100% fan speed as well as get thermal images. GPU hotspot and memory temps are also documented if the card has sensors for them |
|
Temperature Delta |
The 100% fan speed temperature result is deducted from the stock fan profile temperature result to get the delta between the two. |
Synthetic Benchmarks
As always I like to start my testing with a few synthetic benchmarks. 3DMark especially is one of my favorites because it is very optimized in both Nvidia and AMD drivers. It's nice to not have to worry about it being favored too much either way and the repeatability of the results makes it a nice chance to compare from card to card, especially when comparing with the same GPU. For the RTX 5080 Vanguard SOC, I want to keep an eye on how it compares to the stock RTX 5080 Founders Edition, in addition to that we will keep an eye on the RTX 4080, RTX 4080 SUPER, and the RTX 4090 from Nvidia and the RX 7900 XTX from AMD. The RTX 5080 Vanguard SOC is overclocked and has a clock speed of 2730 MHz which is 113 MHz faster than stock. Not a significant overclock but with a much larger cooler MSI can also be more aggressive on their power profile so it will be interesting to see how much of a difference it makes.
The first round of tests were done in the older Fire Strike benchmark which is a DX11 test. There are three detail levels, performance, extreme, and ultra. The RTX 5080 Vanguard SOC scored 81836 compared to the Founder Editions 79045 in the base Fire Strike which is a 3.5% increase and pushed it up just a hair past the RTX 4090. In Fire Stike Extreme it didn’t pass the 4090 but did get a 5.1% increase in performance. For the Fire Strike Ultra test the improvement was smaller but still noticeable, going up 2.4% from 21262 up to 21777.


The next two were both based on the Time Spy benchmark. One is the standard test and then there is the extreme detail level. In the base Time Spy test, the RTX 5080 Vanguard SOC scored 33379 which was 2.2% over the Founders Edition with its 32642 score. This was still well below the RTX 4090 but 9.7% over the 7900 XTX and 17% over the 4080 SUPER. For Time Spy Extreme the RTX 5080 Vanguard SOC scored a 16961, 4.4% over the stock RTX 5080 but still well behind the 4090.


I did also test using the new 3DMark Speed Way which is one of their latest benchmarks and Port Royal as well. Speed Way is DX12 as well but combines more future-focused tech like Ray Tracing which up until its release where only used in feature tests, not full benchmarks. The RTX 5080 Vanguard SOC improved on the RTX 5080 Founder Edition’s performance by 1.4% in Speed Way, widening the gap between both cards and the RTX 4080 SUPER. Port Royal was similar with the RTX 5080 Vanguard SOC improving by 1.6% on the stock-clocked Founders Edition 5080 and is 24% over the RTX 4080 SUPER.


I also ran the newer 3Dmark Steel Nomad benchmark. Officially this is the replacement for the Time Spy benchmark. It is a DX12 benchmark and doesn’t include ray tracing but is updated to better take advantage of modern cards. The RTX 5080 Vanguard SOC improved on the 5080 Fes numbers by 1.9% here, once again both cards are sitting with a big gap between the RTX 4090 above them and a big gap between the RTX 4080 SUPER which sits below them.

Last up I did check out the DLSS performance on the RTX 5080 Vanguard SOC. For this, I ran the DLSS test in 3Dmark and I ran all four versions of DLSS on the cards that were capable of it. This gives a great look at the performance improvement that DLSS is capable of and is an example of why DLSS 4 is such a big deal for the new 50 Series cards which are the only cards that support Frame Generation x3 and x4. For the RTX 5080 Vanguard SOC, you see the base frame rate was 49.98, and using DLSS 1 improved that up to 89.83. DLSS kicked it up to 123.9 and DLSS 3 up to 171.54. That in itself is impressive but DLSS 4 then blows our chart up increasing the performance up to 299.91 FPS. This is a synthetic benchmark and because there isn’t any variance where you are moving around it is a best-case scenario, but a 500% improvement is crazy. Not to mention the new Transformer based models have improved the visual quality where DLSS 4 performance looks better than the older DLSS 3 quality settings.

Now we finally get into the in game performance and that is the main reason people pick up a new video card. To test things out I ran through our new benchmark suite that tests 8 games at three different resolutions (1080p, 1440p, and 4k). Most of the games tested have been run at the highest detail setting and a mid-range detail setting to get a look at how turning things up hurts performance and to give an idea of whether turning detail down from max will be beneficial for frame rates. Cyberpunk 2077 is also tested with Super Sampling (DLSS/FSR/XeSS). In total, each video card is tested 60 times and that makes for a huge mess of results when you put them all together. To help with that I like to start with these overall playability graphs that take all of the results and give an easier-to-read result. I have one for each of the three resolutions and each is broken up into four FPS ranges. Under 30 FPS is considered unplayable, over 30 is playable but not ideal, over 60 is the sweet spot, over 120 FPS is for high refresh rate monitors, and 240 helps show the performance ideal for the latest higher refresh displays.
So how did the RTX 5080 Vanguard SOC do? Well at 1080p all of the results were over 120 FPS with 14 of the 18 coming in over 240 FPS. For comparison, in the same tests, the Founders Edition came in at 12 and 6, so the performance improvement for the Vanguard was enough to bump the two up into new categories. At 1440p, which is the targeted resolution for the RTX 5080, the RTX 5080 Vanguard SOC had all results up over 120 FPS with half of those over 240. This was one result better than the Founders Edition which had 8 over 240 to the 9 here. Then at 4k, performance was still solid but there is a noticeable difference here with some of the results dropping down into the 60-119 FPS range. In the end, the RTX 5080 Vanguard SOC had 4 in that range, 12 in the 120-239 range, and 2 over 240 FPS, the same as the Founders Edition.


To get a better look at some of the cards that are the closest competition to the RTX 5080 Vanguard SOC including the RTX 4080, 4080 SUPER, 4090, and 7900 XTX. I didn’t miss the Founders Edition 5080 as well, it is there also. This gives us a better look at how the cards compare. The RTX 5080 Vanguard SOC improved on the stock RTX 5080 performance by 8.7 FPS at 1080p, 6.2 at 1440p, and 2.9 at 4k. That is an improvement of 2.9% at 1080p, 2.5% at 1440p, and 1.8% at 4k, more than I expected given the small clock speed improvement. This wasn’t enough to change the order of any of the other cards. Like in our Founders Edition review, this does highlight how the RTX 5080 outperforms the RTX 4090 at 1080p and 1440p but falls behind it at 4k. Like I said earlier, the 5080 is targeted at 1440p according to Nvidia and the VRAM for the RTX 5080 shows that. But even still 4k gaming is still very possible as you can see.
|
|
1080p |
1440p |
4k |
|
5080 Vanguard SOC |
303.0 |
257.8 |
165.7 |
|
RTX 5080 FE |
294.3 |
251.6 |
162.8 |
|
RTX 4090 |
280.9 |
245.9 |
170.7 |
|
RTX 4080 SUPER |
256.5 |
214.9 |
133.0 |
|
RTX 4080 |
254.0 |
210.5 |
130.0 |
|
RX 7900 XTX |
257.4 |
225.8 |
145.7 |
Of course, I have all of the actual in game results as well for anyone who wants to sort through the wall of graphs below. The RTX 5080 Vanguard SOC did improve on the performance of the RTX 5080, but there was only one result that pushed the 5080 up above any other card. One was in Ghost Recon Breakpoint high detail where it jumped over the 7900 XTX.


Another new addition to my testing was a few additional tests using Cyberpunk 2077. This is one of only a few games that support most of the tech from all three of the GPU companies. So I did tests at medium and ultra detail while having Super Sampling on for all of the cards. Using whatever the latest and greatest is supported. In this case, I tested with DLSS and I also have included a second batch of results with frame generation x4 on the cards that support it. Just a note here, the AMD cards only allowed FSR when running windowed mode whereas Nvidia only performed well in fullscreen mode. The performance improvements that the RTX 5080 Vanguard SOC got over the Founders Edition 5080 are seen here as well. Without frame generation x4 AMD edged out in front of both of the RTX 5080s at 1440p and 1080p but when you figure in the new DLSS 4 frame generation 4 (which the game adds in today) the performance difference is so significant that it isn’t even close. With ultra detail, the RTX 5080 Vanguard SOC comes in at 512 FPS at 1440p and 343 FPS at 4k.


Now some people don’t need a video card for gaming, they need the processing power for rendering or 2D/3D production, or in some cases, people who game also do work on the side. AI performance importance has increased quickly recently as well. So it is also important to check out the compute and AI performance on all of the video cards that come in. That includes doing a few different tests. To start off our AI tests I ran Geekbench AI, a cross-platform AI benchmark that uses real-world machine learning tasks giving three results, a full precision score, half precision score, and quantized score. The RTX 5080 Vanguard SOC improved compared to the RTX 5080 Founders Edition here in all three of the results. Overall though it was a .8% improvement when all of the results were combined.

Blender is always my favorite compute benchmark because the open-source 3D rendering software is very popular and it isn’t a synthetic benchmark. With the latest version of Blender, they redid the benchmark so we now have a new test that runs three different renderings and gives each a score. I have all three stacked together so we can see the overall performance. The RTX 5080 Vanguard SOC is once again out in front of the RTX 5080 Founders Edition and behind the RTX 4090 by a big margin. Overall the overclock helped gain a .9% improvement, not nearly as much as we have seen in all of the game benchmarks.

For CUDA-based cards, I also check out V-Ray Benchmark 5 to check out CUDA and RTX performance in the 3D rendering and simulation software. The RTX 5080 Vanguard SOC edged out in front of the RTX 5080 Founders Edition once again here with just a small lead. The two cards sit with the 4090 way out in front and ahead of the RTX 4080 SUPER.

For my last few tests, rather than focusing on in game performance, I like to check out other aspects of video card performance. These are also the most important ways to differentiate the performance between cards that have the same GPU. To start things off I took a look at power usage.
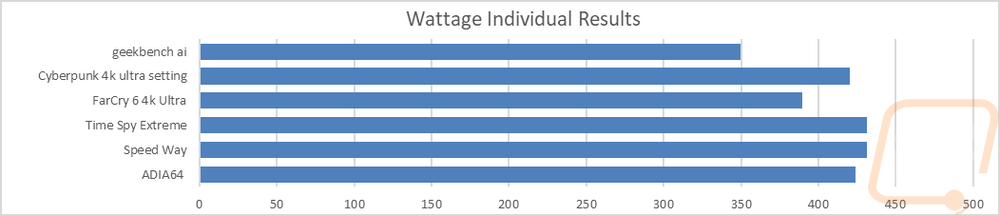
For this, our test setup utilizes the Nvidia-designed PCat v2 along with cables to handle both traditional 6 or 8-pin connections as well as 12VHPWR. The PCat also utilizes a PCIe adapter to measure any power going to the card through the PCIe slot so we can measure the video card wattage exclusively, not the entire system as we have done in the past. I test with a mix of applications to get both in game, synthetic benchmarks, and other workloads like GeekbenchAI and AIDA64. Then everything is averaged together for our result. I also have the individual results for this specific card and I document the peak wattage result. The RTX 5080 Vanguard SOC does pull more power than the stock-clocked Founders Edition. It averaged 407 watts whereas the Founders Edition was 18 watts lower at 389 watts. For peak power, the RTX 5080 Vanguard SOC pulled 431 watts whereas the Founders Edition peaked at 422. That said the difference wasn’t enough to split the two cards apart in the chart. They are both still behind the RX 7900 XT and ahead of the RTX 3080. More importantly, for comparison to cards they compete with. The 7900 XT averaged 435 watts, the 4080 SUPER averaged 248 watts, and the 4090 averaged 456 watts.

With having exact peak wattage numbers when running Time Spy Extreme I was also able to put together a graph showing the total score for each watt that a card draws which gives us an interesting look at overall power efficiency in the popular and demanding benchmark. The RTX 5080 Vanguard SOC had a score of 32.3 points per watt, the Founders Edition with its lower power usage was more efficient and up closer to the top of the chart with a 38.4. The RTX 5080 Vanguard SOC did still come in ahead of the RX 7900 XTX but the 4080 SUPER and the 4090 are both up higher as well. This is one of the big tradeoffs with overclocked cards, you get better performance but you trade off some of the power efficiency.

My next round of tests were looking at noise levels. These are especially important to me because I can’t stand to listen to my PC whirling. Especially when I’m not in game and other applications are using the GPU. For my testing, though I first tested with the fan cranked up to 100% to get an idea of how loud it can get, then again at 50% to get an idea of its range. The RTX 5080 Vanguard SOC came in right in the middle of the pack on the 50% fan speed result which was lower than the Founders Edition by .9 of a decibel. With the fans cranked all the way up on the other hand that flipped. The RTX 5080 Vanguard SOC came in at 59.9 dB which was 1.5 higher than the Founders Edition. The fan RPM chart is interesting, but we do have to keep in mind there are three fans, not two. The RTX 5080 Vanguard SOC is in the middle of the chart for fan RPM and typically we would see the noise levels be similar on the noise chart.


I also take a look at noise performance while under load. For that when running AIDA64’s stress test I wait until the temperature of the card has leveled off and then measure how loud things are when the card is at its worst-case scenario with the stock fan profile. The RTX 5080 Vanguard SOC is right at the bottom of our chart. A majority of the cards tested have been the reference or Founders Edition versions, but there are other aftermarket cards in the mix as well. The 34.2 dB result for the RTX 5080 Vanguard SOC is impressive, especially compared to the 39.7 dB from the Founders Edition in the same situation. The 100% fan speed results were a little scary but none of that matters if it never needs to turn the fans up and clearly that is the case here. It only ran the fans at 36% fan speed when under load.


To finish up my testing I of course had to check out the cooling performance. To do this I ran two different tests. I used AIDA64’s Stress Test run for a half-hour each to warm things up (on everything except the 5090 which was tested on a similarly matched OCCT workload). Then I documented what temperature the GPU leveled out at with the stock fan profile and then again with the fans cranked up to 100%. With the stock profile, the RTX 5080 Vanguard SOC came in at 63c which is in the middle of our chart and is 3c lower than the Founders Edition. As we saw just a minute ago, this is because the fans were only running at 36% while under load. For memory temps in that same test, they were a little cooler at 60c. Cranking the fans up to 100% the RTX 5080 Vanguard SOC’s cooling performance changed significantly. It dropped down to 45c which is a delta of 18c. That is a huge performance difference that shows there is a lot of headroom in the cooler over what MSI has the stock fan profile set to do. This is the Silent BIOS on the BIOS switch which is how the card shipped. I would bet that gaming switch is a little more aggressive here. That said, the stock fan profile temps weren’t bad. If I were changing the fan profile I might only adjust things down slightly if at all and enjoy the card being quiet while knowing that if needed there was plenty of room to keep things running cool and safe.


While running the stock fan profile testing I also took the time to get a few thermal images so we could see what is going on. Given how cool the RTX 5080 Vanguard SOC ran, it's no surprise that the card was cool as well. The fan side of the card had its hottest spot at 31.8c which was behind the left fan. The other two were in the mid 20’s at the hottest spots behind the fans. Up on the top edge, the hottest spot is in the center where the PCB was visible and that was running at 46.5c, the rest of the heatsink that is visible on the top edge was at 38.5c and 31.9c. On the back the backplate has most of the temps evened out but it is warmer in the bottom right running at 48c. The rest of the back plate on that side was 38c. The hotspot was one of our power cables. As it turns out, when running a long thermal test you should make sure the cable isn’t sitting right in the blow-through area up against the card. In addition to the heat that the power going through the cables can do when under load for a long time, the heat from the cooler added even more. You can see it's just the one cable. The 73c reading is most likely a little wrong because it is a glossy finish. It didn’t feel that hot, it was warm though.


Overall and Final Verdict
With all of our testing out of the way, we can step back and process everything that we saw in our testing. The RTX 5080 Vanguard SOC visually is in a lot of ways the opposite of what the RTX 5080 Founders Edition was that I took a look at yesterday. Nvidia has worked towards making that card design a little more compact, though it is still large. But the RTX 5080 Vanguard SOC is a giant card, like a lot of the higher-end aftermarket cards for the last few generations. Not only is it a 3 ½ slot wide card but it is longer and taller than the Founders Edition as well. Where the Founders Edition’s styling is simple MSI has a much more aggressive styling here. Unlike MSI’s Suprim line which is very similar to the Vanguard, they have a lot of layers, textures, and lighting. It is a lot like the MSI Gaming Trio but it has turned things up to 11. This is the highest-end “gaming” styling-focused card in the lineup. It’s going to depend a lot on what you like in a card, I know for me I would still prefer the Suprim, but a younger me would have preferred this.
Beyond the styling, even though this design does have plastic in the fan shroud where the MSI Suprim cards don’t. MSI did still utilize aluminum designs on the fan shroud and the card has a full coverage aluminum backplate on the back as well. The RGB lighting wasn’t overboard, most of the lighting is hidden away and used as underglows for some of the different overhands on the cards shroud. That looks a lot better than just random lighting all over the place. MSI did use a similar 12VHPWR adapter design to what we saw last year and I would have preferred it to be a little more like Nvidia’s new design. But MSI’s design did impress me with a really simple way to help users make sure they know they have it plugged in all of the way. The connection is bright yellow but won't be visible unless you don’t have it plugged in completely. It’s a simple but effective solution. That said, the power connection does still point directly up, and because the card is so tall a lot of cases are going to have that power connection up against the side panel. An angled plug would make a huge difference there to help avoid issues with the power connection like the 40 Series saw.
The large card design also means a large cooler and that cooler showed off in our testing. Our stock fan profile temperature testing had it in the middle of the pack. But that is because the card comes set to the silent BIOS. More testing showed just how capable the cooler can be when you start to turn the fans up. Even with the stock fan profile, however, it outperformed the Founders Edition and it did that by running nearly silent and with the three fans running at just 36% while running under load for a half hour. The overclock as well as the cooling translated to a surprisingly good improvement in in-game performance in my testing. Most overclocked cards get you a percent at most. What I ended up seeing was 2.9% at 1080p, 2.5% at 1440p, and 1.8% at 4k. The RTX 5080 Vanguard SOC, just like the Founders Edition still outperforms the RTX 4090 at 1080p and 1440p but falls behind at 4k because of its smaller VRAM and memory interface. DLSS 4 adds another dimension as well. DLSS in general is a great tool but with DLSS 4 Nvidia has significantly improved the visual quality while also adding in Frame Generation x3 and x4. You can see improvements up to 500% from no DLSS to DLSS 4 and while Nvidia has the RTX 5080 targeted at 1440p gaming, that makes high refresh rate 4k gaming just as possible, as long as the games you want to play support it. The overclock for the RTX 5080 Vanguard SOC did translate to more power usage and the performance improvements weren’t enough to make up for it dropping the RTX 5080 Vanguard SOC in our power efficiency charts.

As for pricing, I’m writing this ahead of the launch but from what I have seen the RTX 5080 Vanguard SOC is going to be launching at $1229.99. If that is the case, that is a big jump up over the $999 MSRP of the RTX 5080 Founders Edition. But typically it isn’t long before those MSRP cards are hard to come by. Once that is the case is this the card to go with? Well, the higher price certainly has dropped the card down in our score per $ charts. Right now a majority of the cards are a better value so this isn’t a value buy but the RTX 5080 Vanguard SOC is an impressive card assuming you can fit it into your PC.

Live Pricing: HERE
