Cooling Noise and Power
For my last few tests, rather than focusing on in game performance, I like to check out other aspects of video card performance. These are also the most important ways to differentiate the performance between cards that have the same GPU. To start things off I took a look at power usage.
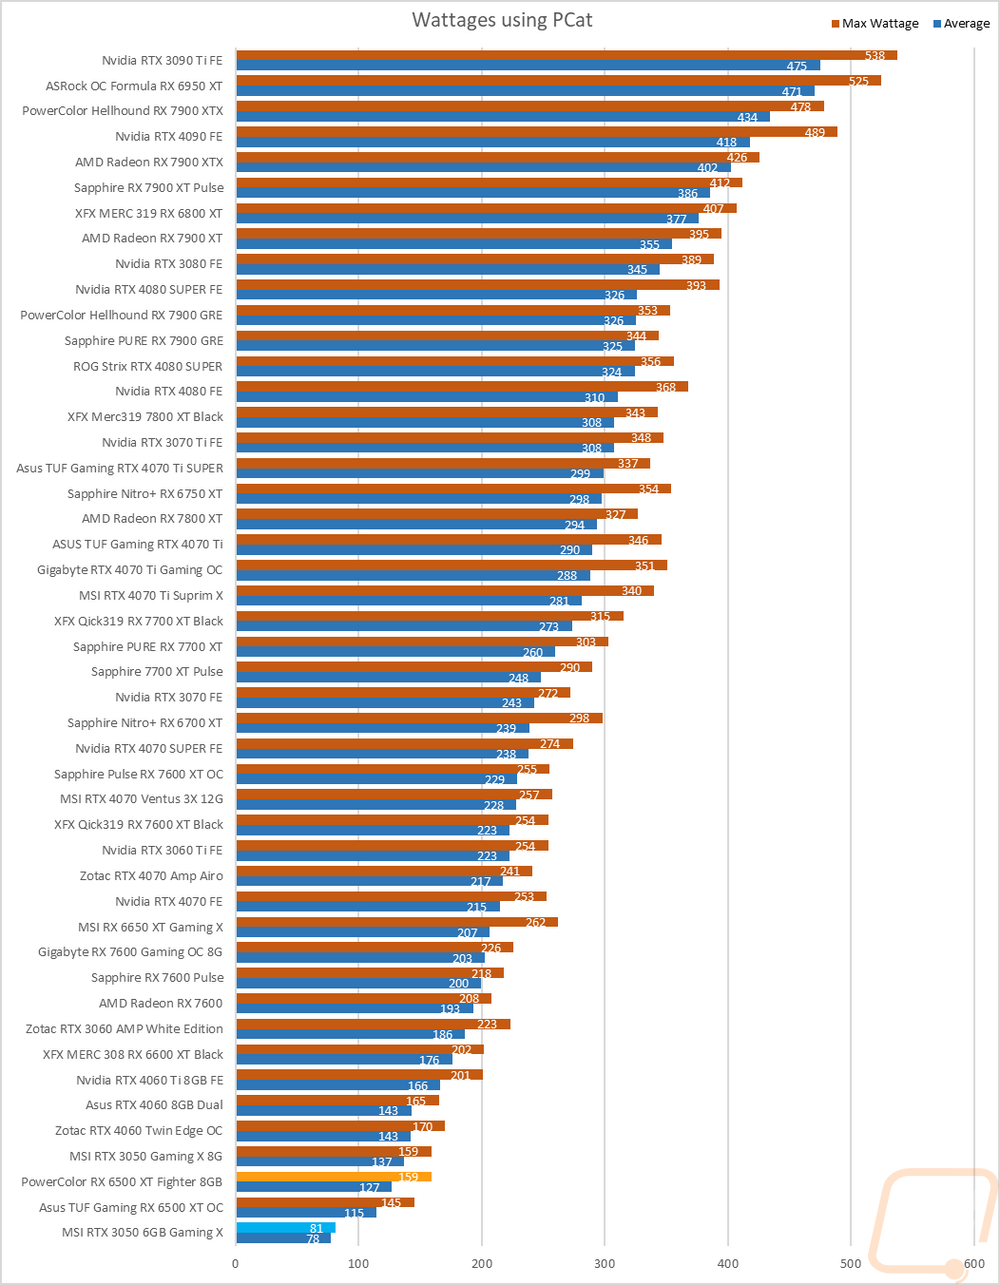
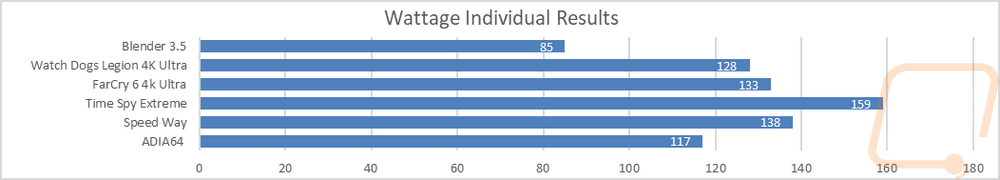
For this, our new test setup utilizes the Nvidia-designed PCat v2 along with cables to handle both traditional 6 or 8-pin connections as well as the new 12VHPWR. The PCat also utilizes a PCIe adapter to measure any power going to the card through the PCIe slot so we can measure the video card wattage exclusively, not the entire system as we have done in the past. I test with a mix of applications to get both in game, synthetic benchmarks, and other workloads like Blender and AIDA64. Then everything is averaged together for our result. I also have the individual results for this specific card and I document the peak wattage results as well which is almost always Time Spy Extreme. The PowerColor RX 6500 XT Fighter 8GB peaked at 159 watts which surprisingly was higher than the overclocked TUF 6500 XT 4GB. The RTX 3050 6GB on the other hand was down at the bottom of the chart. As a whole Nvidia’s cards have been more power efficient and with that not being an overclocked card where our original 3050 8GB was overclocked and pulled a lot more wattage. The averaged power numbers for the PowerColor RX 6500 XT Fighter 8GB were lower at 127 watts which wasn’t too bad as well.
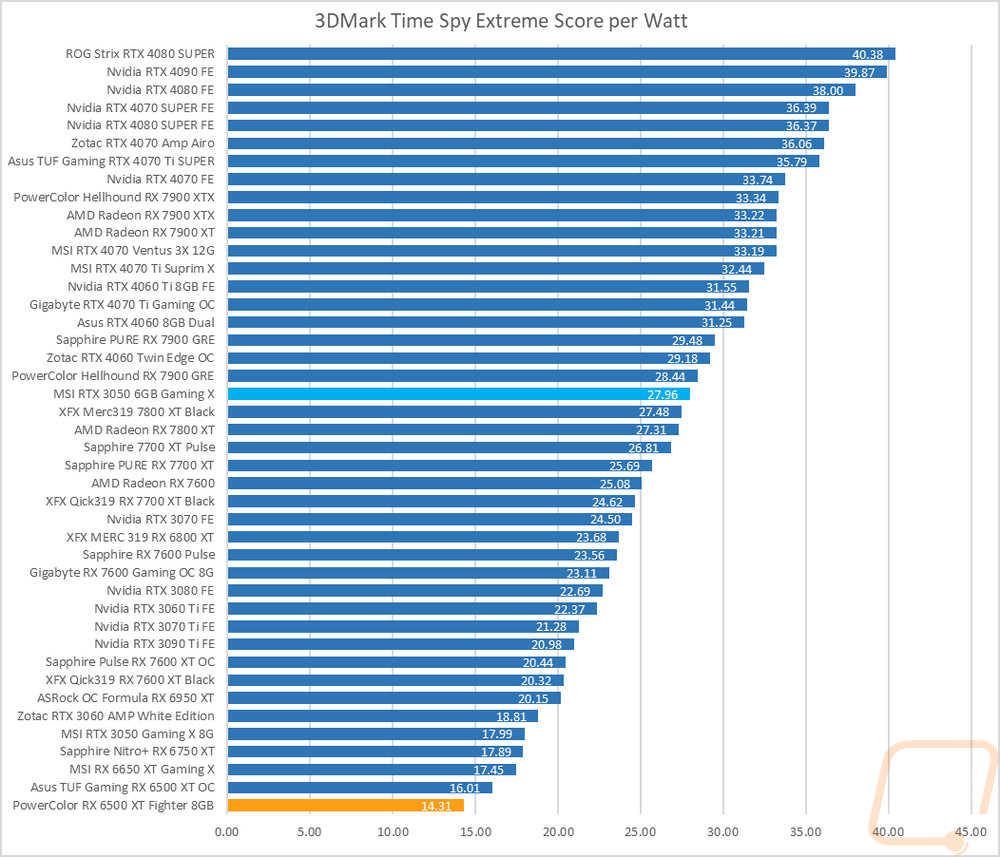
With having exact peak wattage numbers when running Time Spy Extreme I was also able to put together a graph showing the total score for each watt that a card draws which gives us an interesting look at overall power efficiency in the popular and demanding benchmark. This is in line with what we saw in the other power numbers but the PowerColor RX 6500 XT Fighter 8GB didn’t do well in overall efficiency, especially when compared to the RTX 3050 6GB which doesn’t have a PCIe power connection.
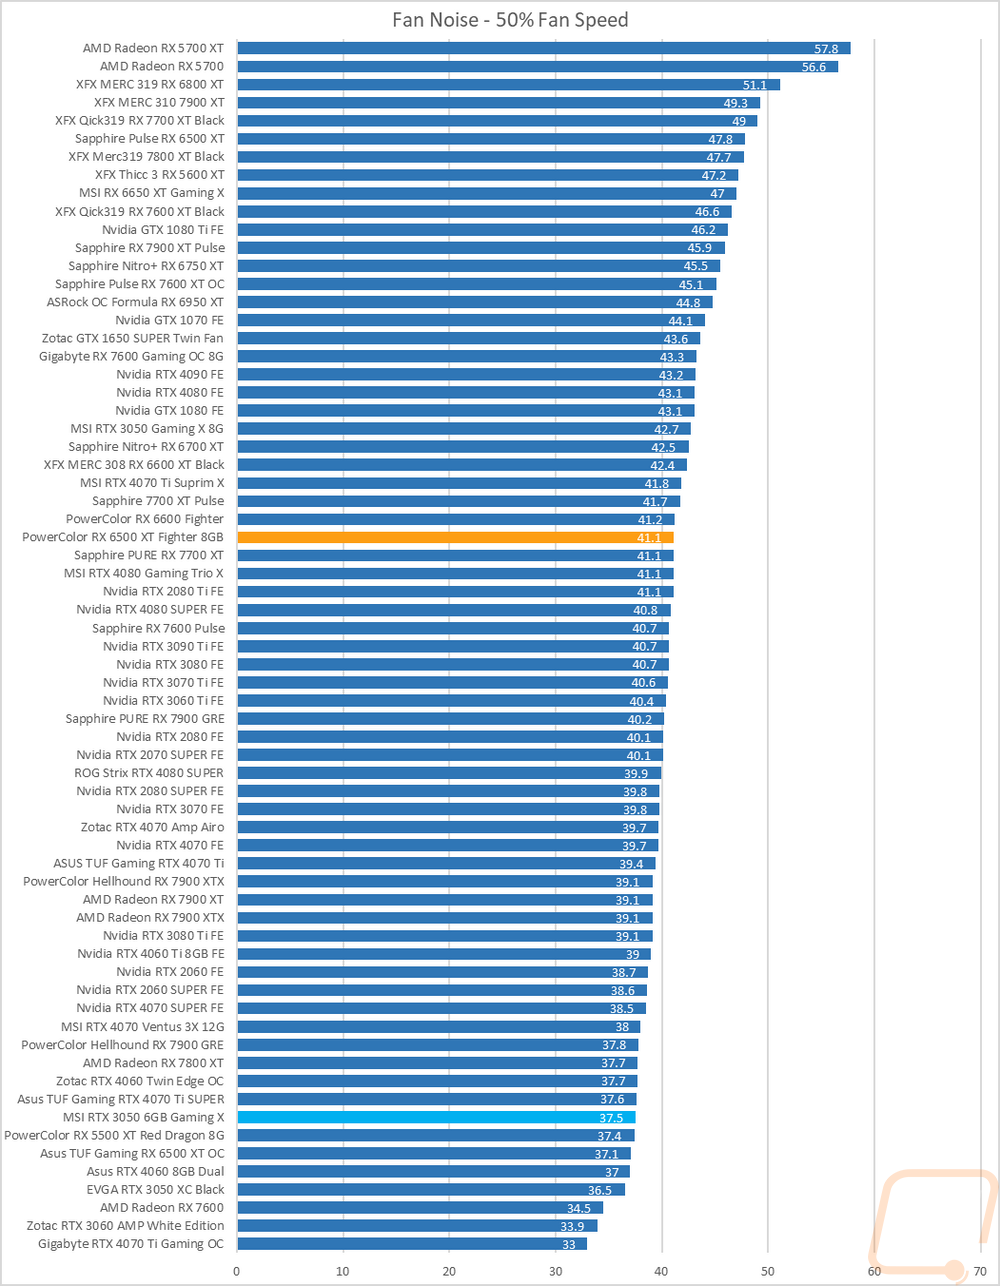
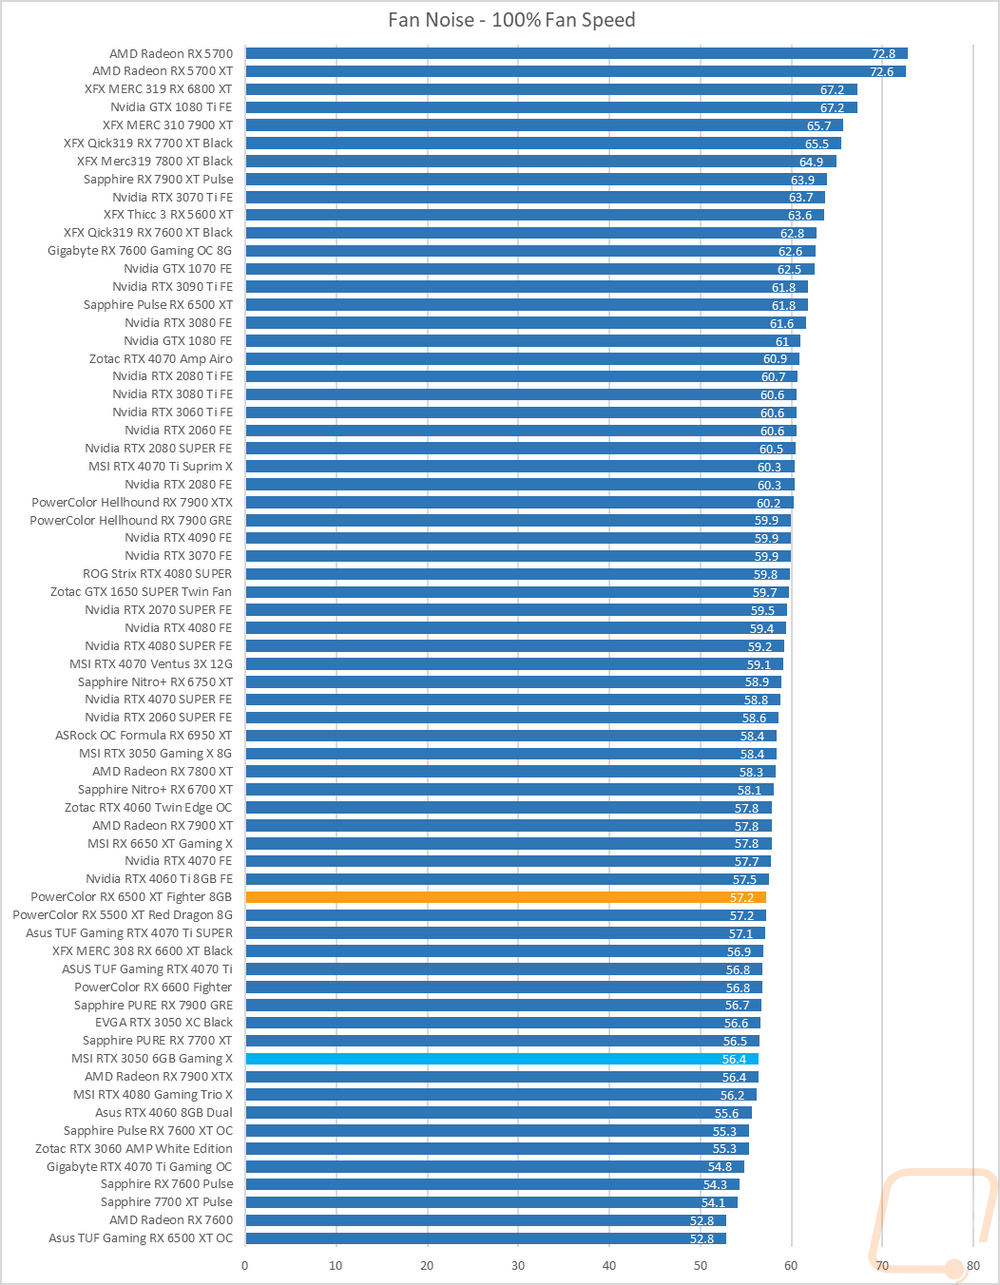
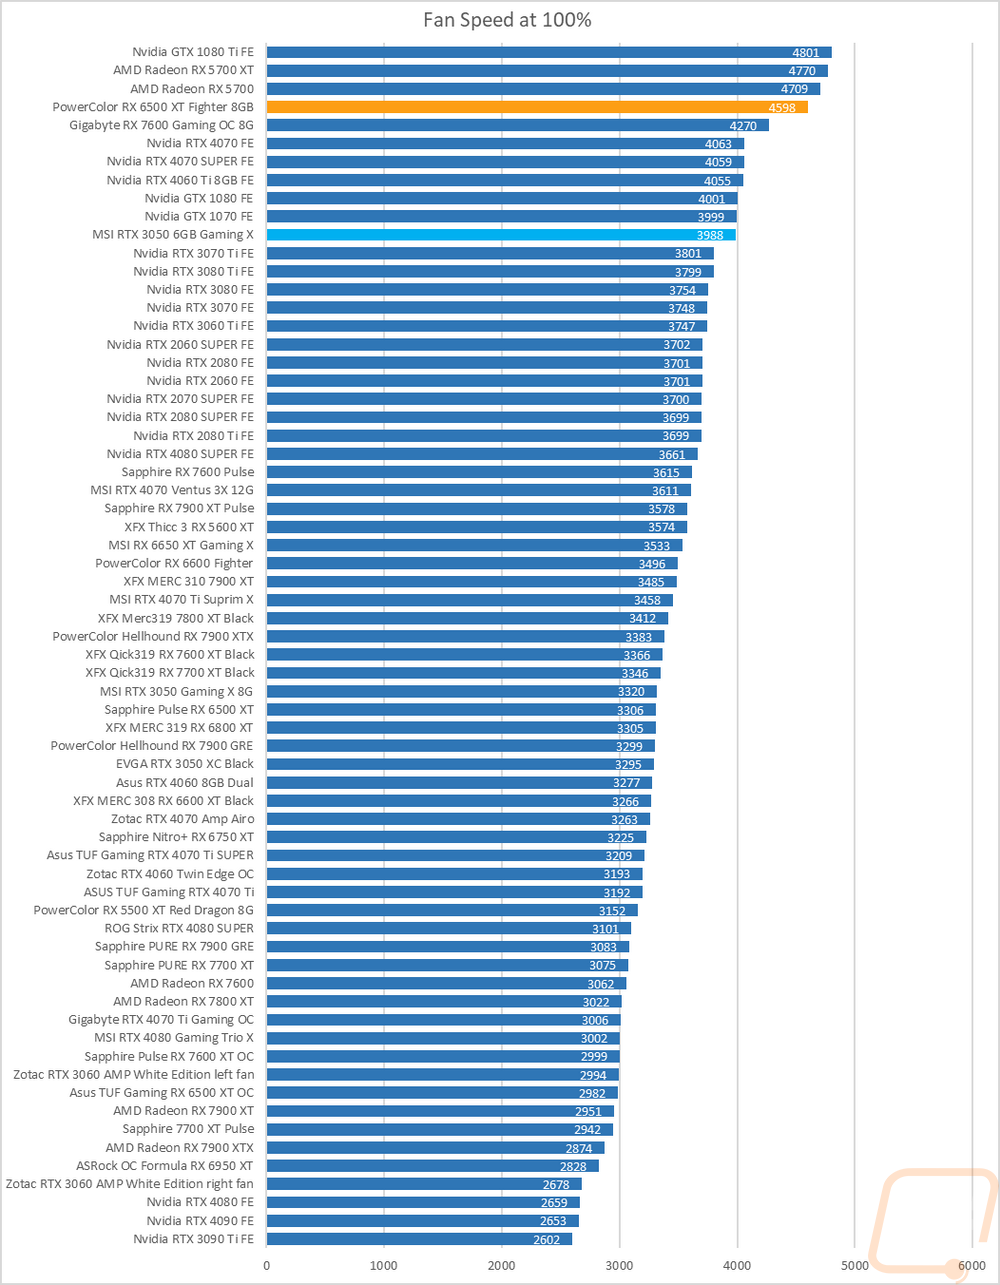
My next round of tests were looking at noise levels. These are especially important to me because I can’t stand to listen to my PC whirling. Especially when I’m not in game and other applications are using the GPU. For my testing, though I first tested with the fan cranked up to 100% to get an idea of how loud it can get, then again at 50% to get an idea of its range. The PowerColor RX 6500 XT Fighter 8GB was in the middle of the pack at 50% fan speed but with the dual fans cranked up it did well and is in the bottom 1/3 of our chart at 57.2 dB. This is impressive because as you can see in the third chart the PowerColor RX 6500 XT Fighter 8GB is up near the top of the chart in overall fan speed.
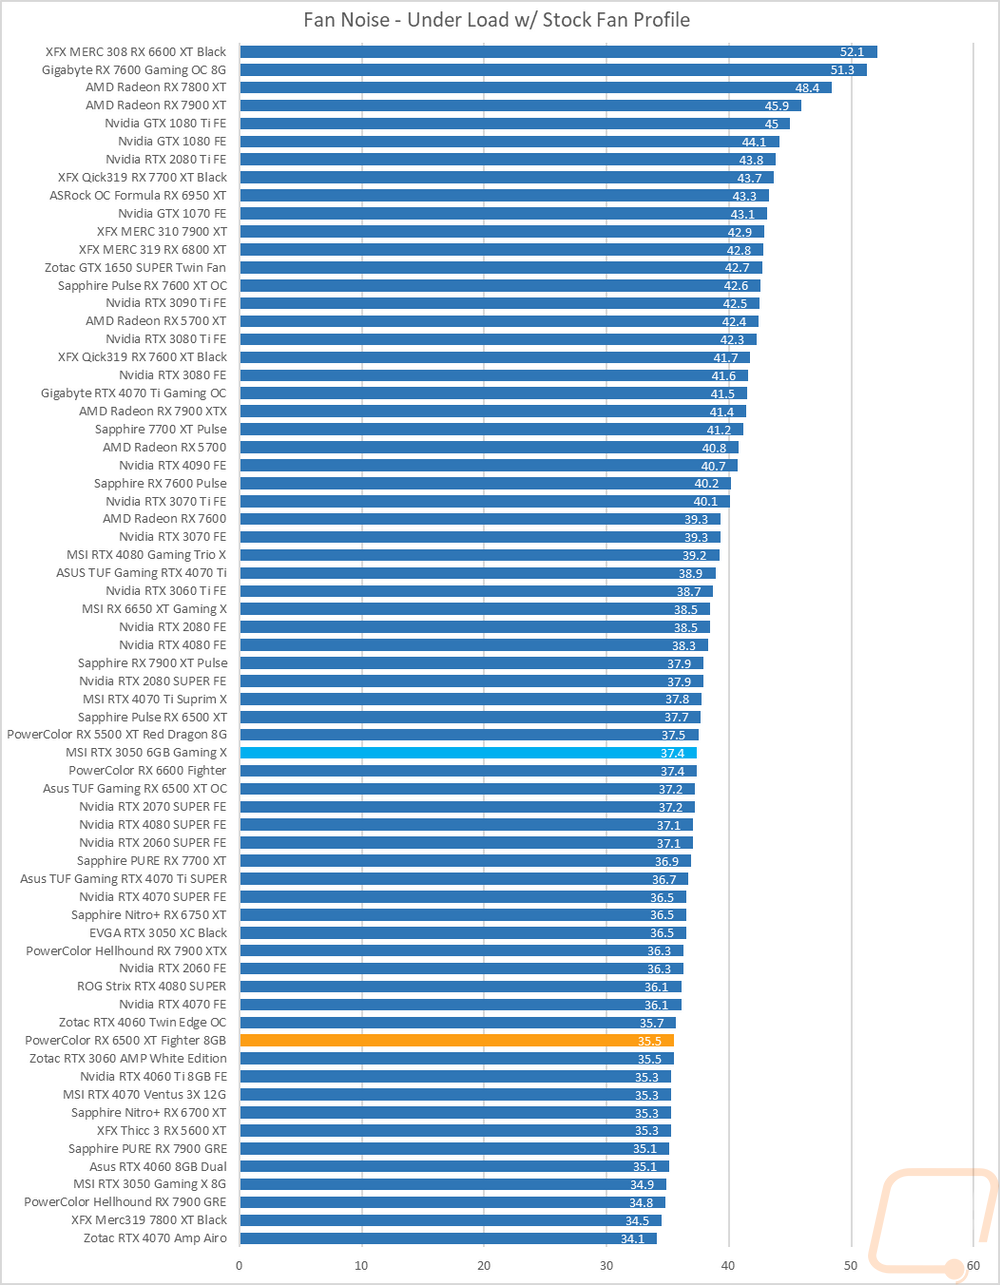
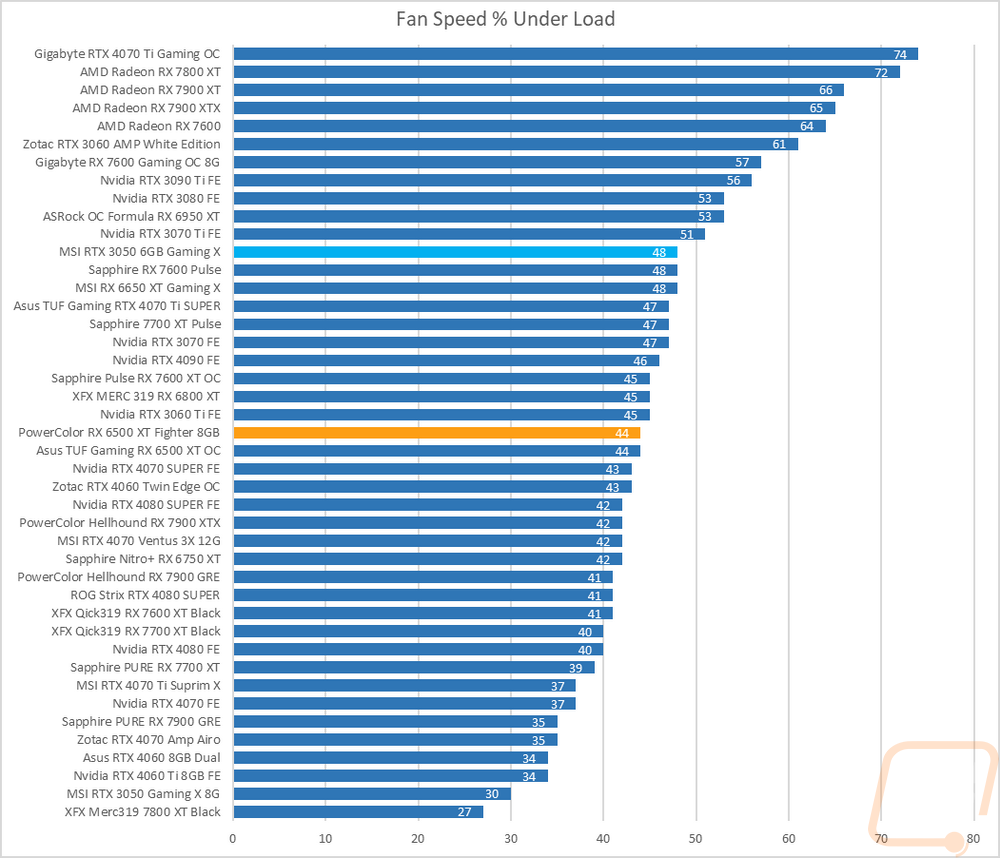
I also take a look at noise performance while under load. For that when running AIDA64’s stress test I wait until the temperature of the card has leveled off and then measure how loud things are when the card is at its worst-case scenario with the stock fan profile. Here the PowerColor RX 6500 XT Fighter 8GB did well sitting at 35.5 dB when under load. For comparison, the MSI RTX 3050 6GB which was quieter in some of the other tests is 2 dB higher here. The chart showing where each card was sitting for fan speed percentage matches this with the PowerColor RX 6500 XT Fighter 8GB running at 44% of its fan speed when under load whereas the RTX 3050 6GB was at 48%.
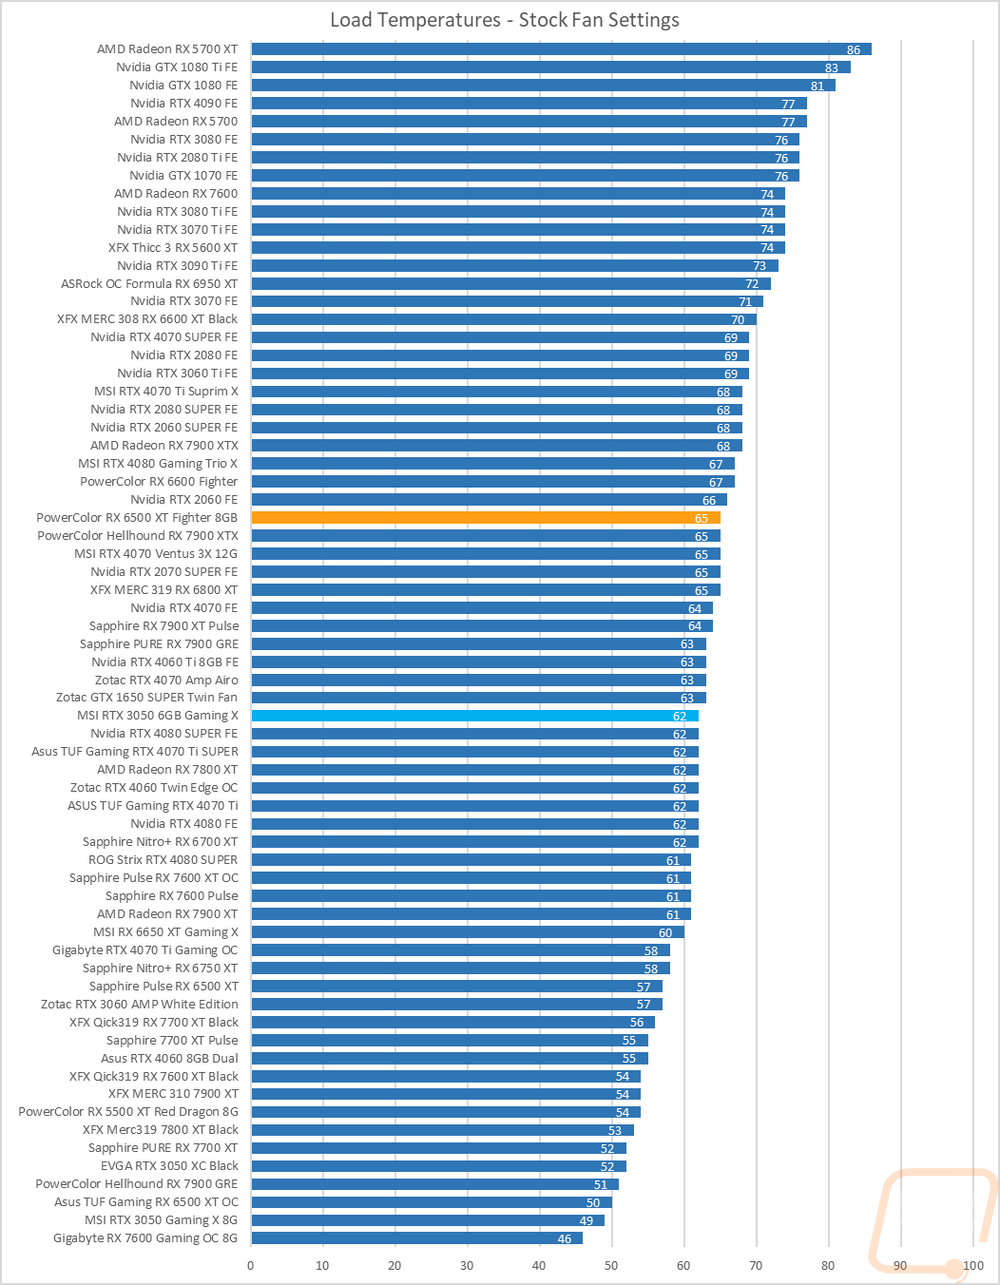
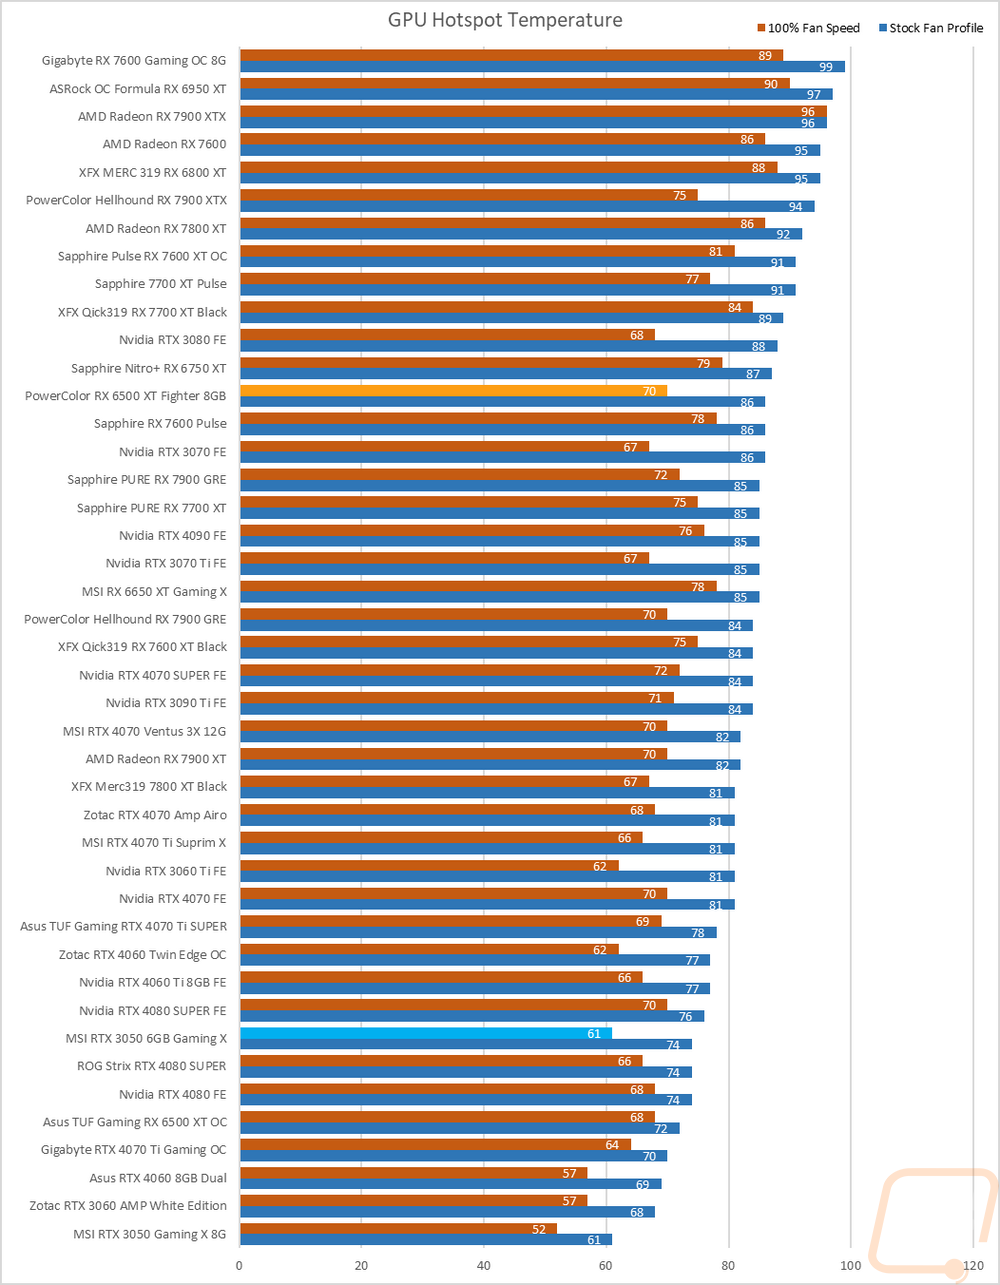
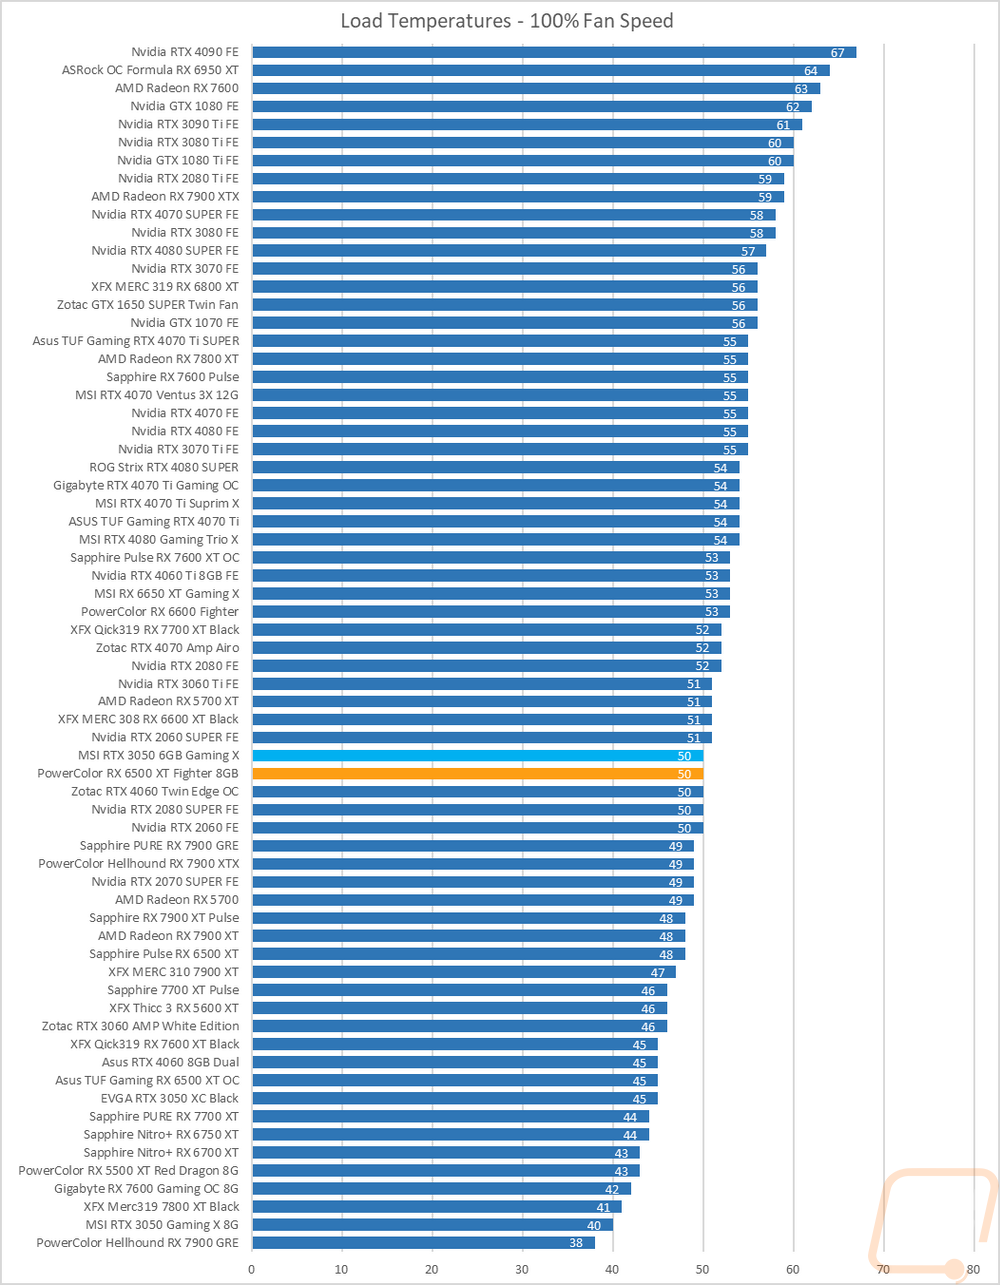
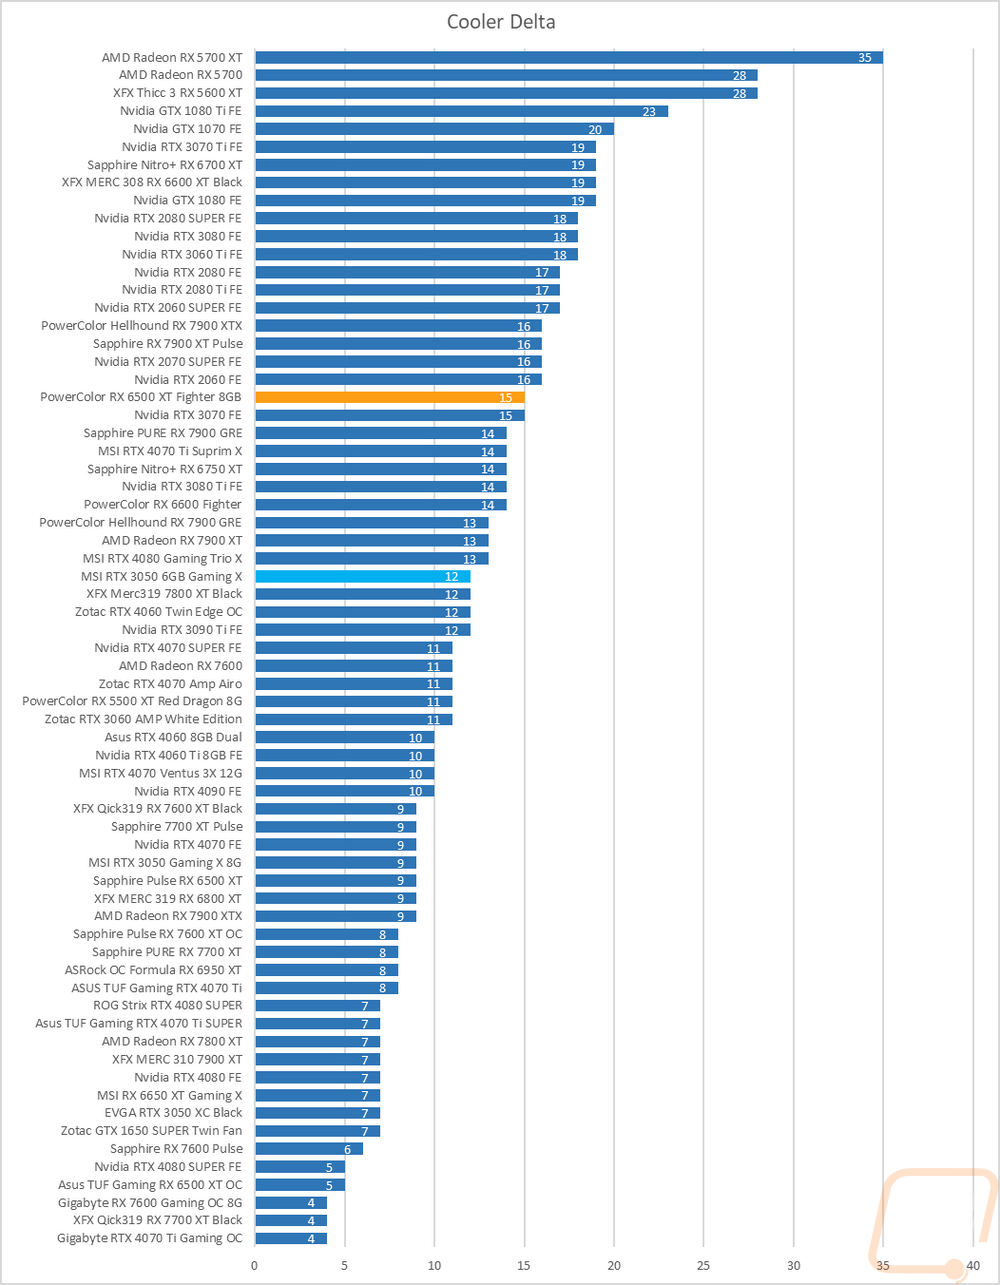
To finish up my testing I of course had to check out the cooling performance. To do this I ran two different tests. I used AIDA64’s Stress Test run for a half-hour each to warm things up. Then I documented what temperature the GPU leveled out at with the stock fan profile and then again with the fans cranked up to 100%. With the stock profile, the PowerColor RX 6500 XT Fighter 8GB was running at 65c which was 3 degrees above the RTX 3050 6GB. Its GPU Hotspot was running at 86c vs the 3050 was lower at 74c. Then with the fans cranked up, the PowerColor RX 6500 XT Fighter 8GB dropped down significantly to 50c. This matched up exactly with the RTX 3050 6GB as well. This was a delta of 15c between the two results which is bigger than I normally see but this does also explain why its noise performance while under load was a little better.
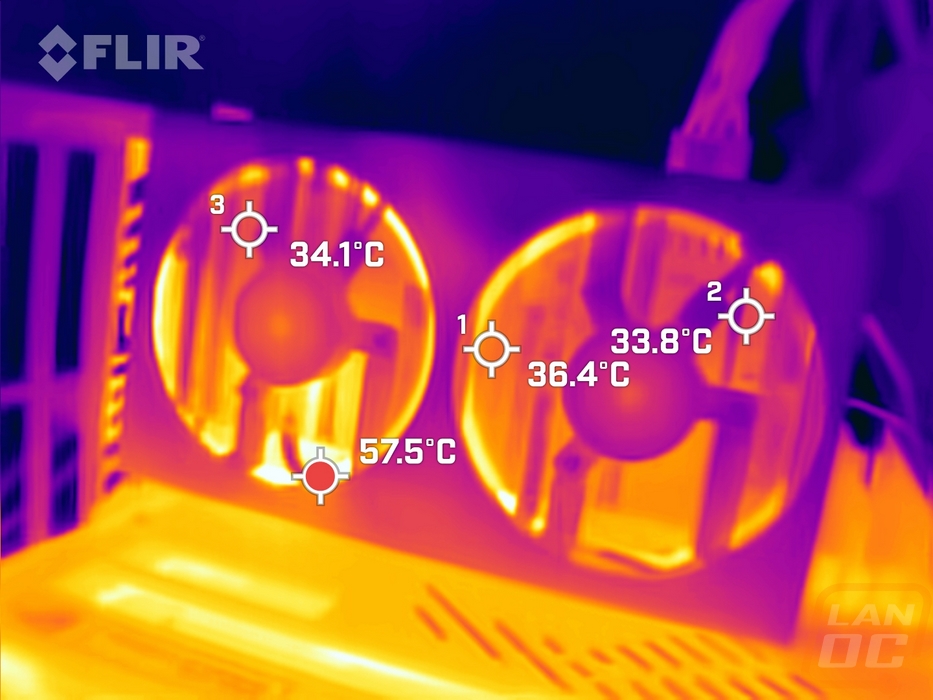
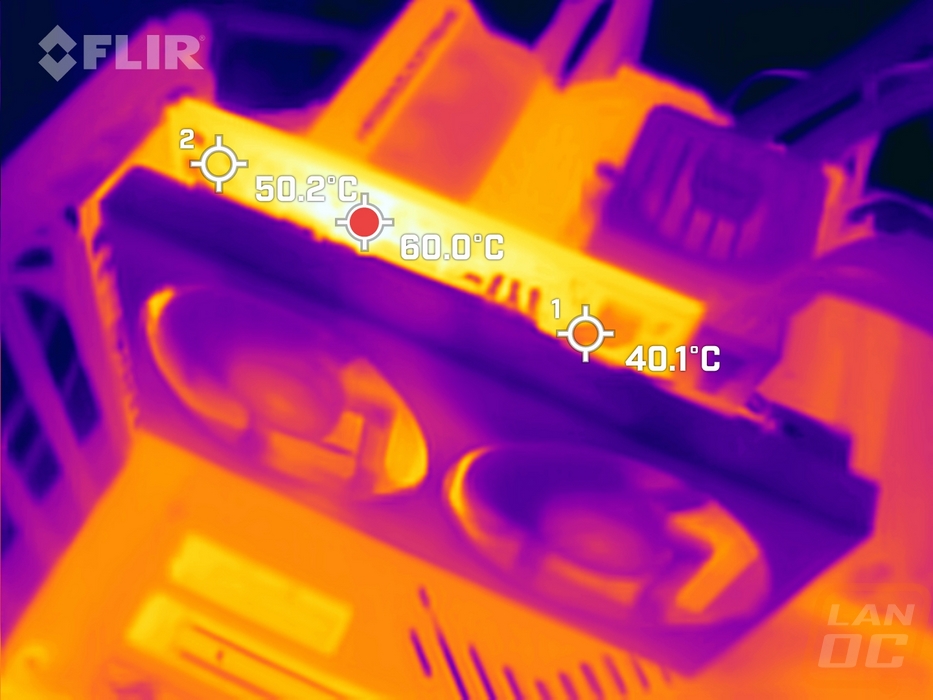
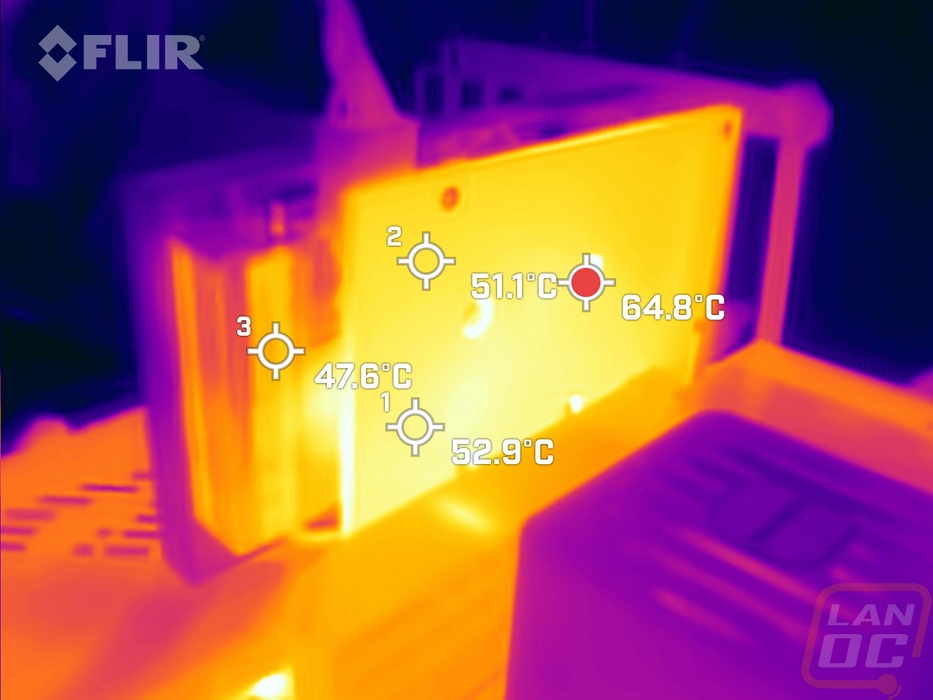
While running the stock fan profile testing I also took the time to get a few thermal images so we could see what is going on. On the fan size, there are a few areas that pick up at 57.5, those are below the heatsink on the exposed PCB and the heatpipes that wrap around on the bottom. But you can also see that outside of behind the fans it does get noticeably warmer on the cooler as well. Up on the top edge, you don’t have the heat blowing out the top but we can see the PCB directly so there are still hot spots there, especially near the center above the GPU, it is a lot cooler down towards the end of the card. The back is mostly consistent with the backplate covering everything but at 52c to 64c it is toasty warm with the part of the heatsink that extends past the PCB running cooler at 47c.