In-Game Benchmarks
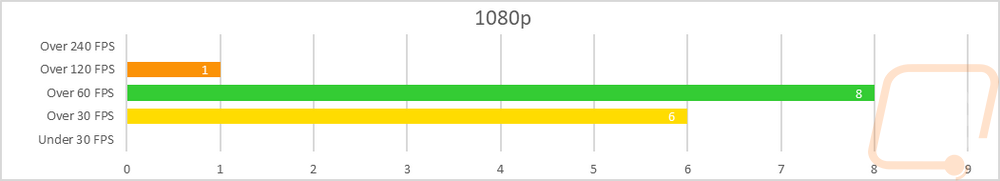
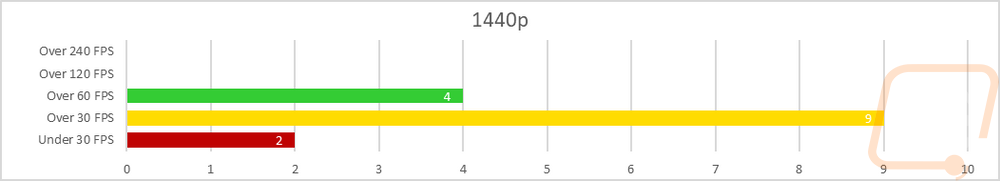
Now we finally get into the in game performance and that is the main reason people pick up a new video card. To test things out I ran through our new benchmark suite that tests 8 games at three different resolutions (1080p, 1440p, and 4k). Most of the games tested have been run at the highest detail setting and a mid-range detail setting to get a look at how turning things up hurts performance and to give an idea of if turning detail down from max will be beneficial for frame rates. In total, each video card is tested 42 times and that makes for a huge mess of results when you put them all together. To help with that I like to start with these overall playability graphs that take all of the results and give an easier-to-read result. I have one for each of the three resolutions and each is broken up into four FPS ranges. Under 30 FPS is considered unplayable, over 30 is playable but not ideal, over 60 is the sweet spot, and then over 120 FPS is for high refresh rate monitors.
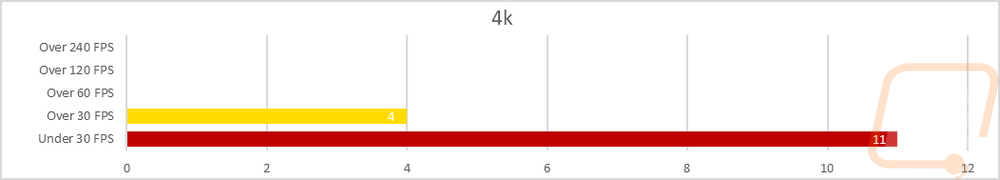
So how did the PowerColor RX 6500 XT Fighter 8GB do? Well, this is a 1080p-focused card, so it isn’t a surprise that at 4k a majority of the results were below 30 FPS. At 1440p though some results weren’t too bad with 4 results averaging over 60 FPS and 9 that were playable but not smooth in that 30 to 60 FPS range. At 1080p though all of our tests were playable. There were 6 results in that 30 to 60 FPS range where I would still consider playing with the detail settings to get up over 60 FPS. But a majority of the results were between 60 and 119 FPS with 8 results there and there was one up over 120 FPS as well.
To get a better look at how the PowerColor RX 6500 XT Fighter 8GB compares with the 6GB RTX 3050 I did average out all of the results at all three resolutions. I included the overclocked 6500 XT Asus TUF card. At 1080p the PowerColor RX 6500 XT Fighter 8GB leads here with over 4 FPS average over the RTX 3050 6GB but the really interesting part is seeing how the overclocked 6500 XT 4GB had multiple results even at 1080p where its lower VRAM held it back putting it 11 FPS behind the PowerColor RX 6500 XT Fighter 8GB. At 1440p the gap between the 3050 and the PowerColor RX 6500 XT Fighter 8GB is closer but still has the 6500 XT ahead. Then at 4k, the 3050 jumps ahead, even with having 2GB less VRAM.
|
|
1080p |
1440p |
4k |
|
Asus TUF Gaming RX 6500 XT OC |
61.5 |
34.5 |
16.5 |
|
MSI RTX 3050 6GB Gaming X |
68.2 |
46.3 |
23.2 |
|
PowerColor RX 6500 XT Fighter 8GB |
72.9 |
47.9 |
21 |
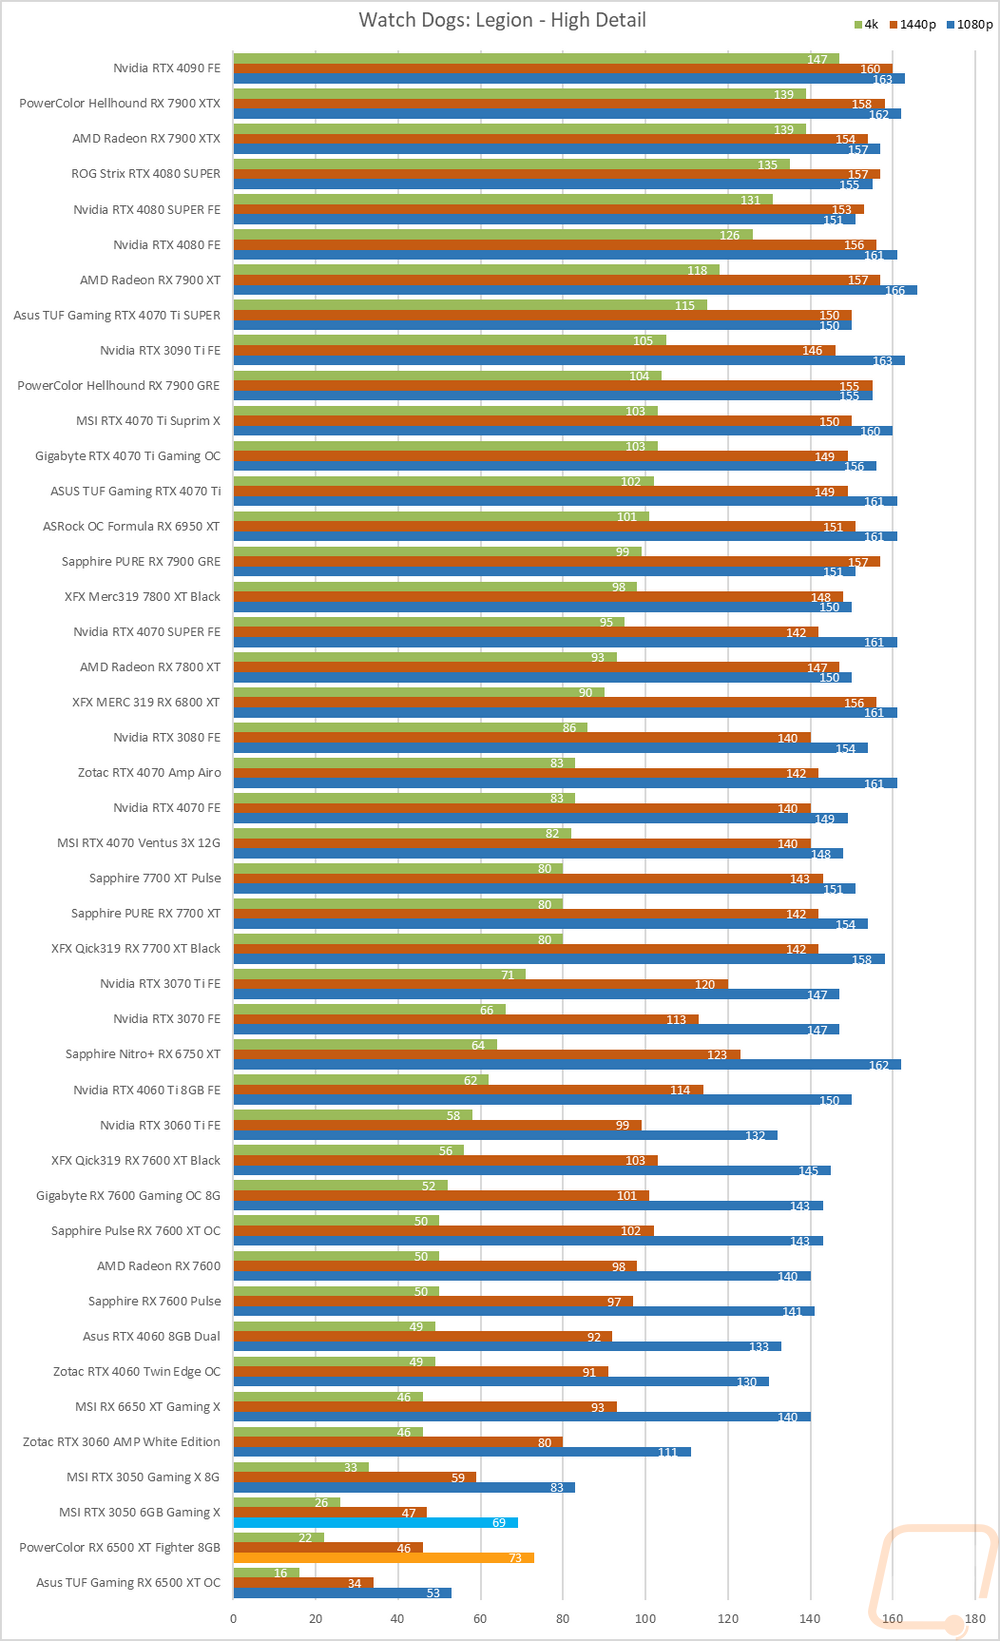
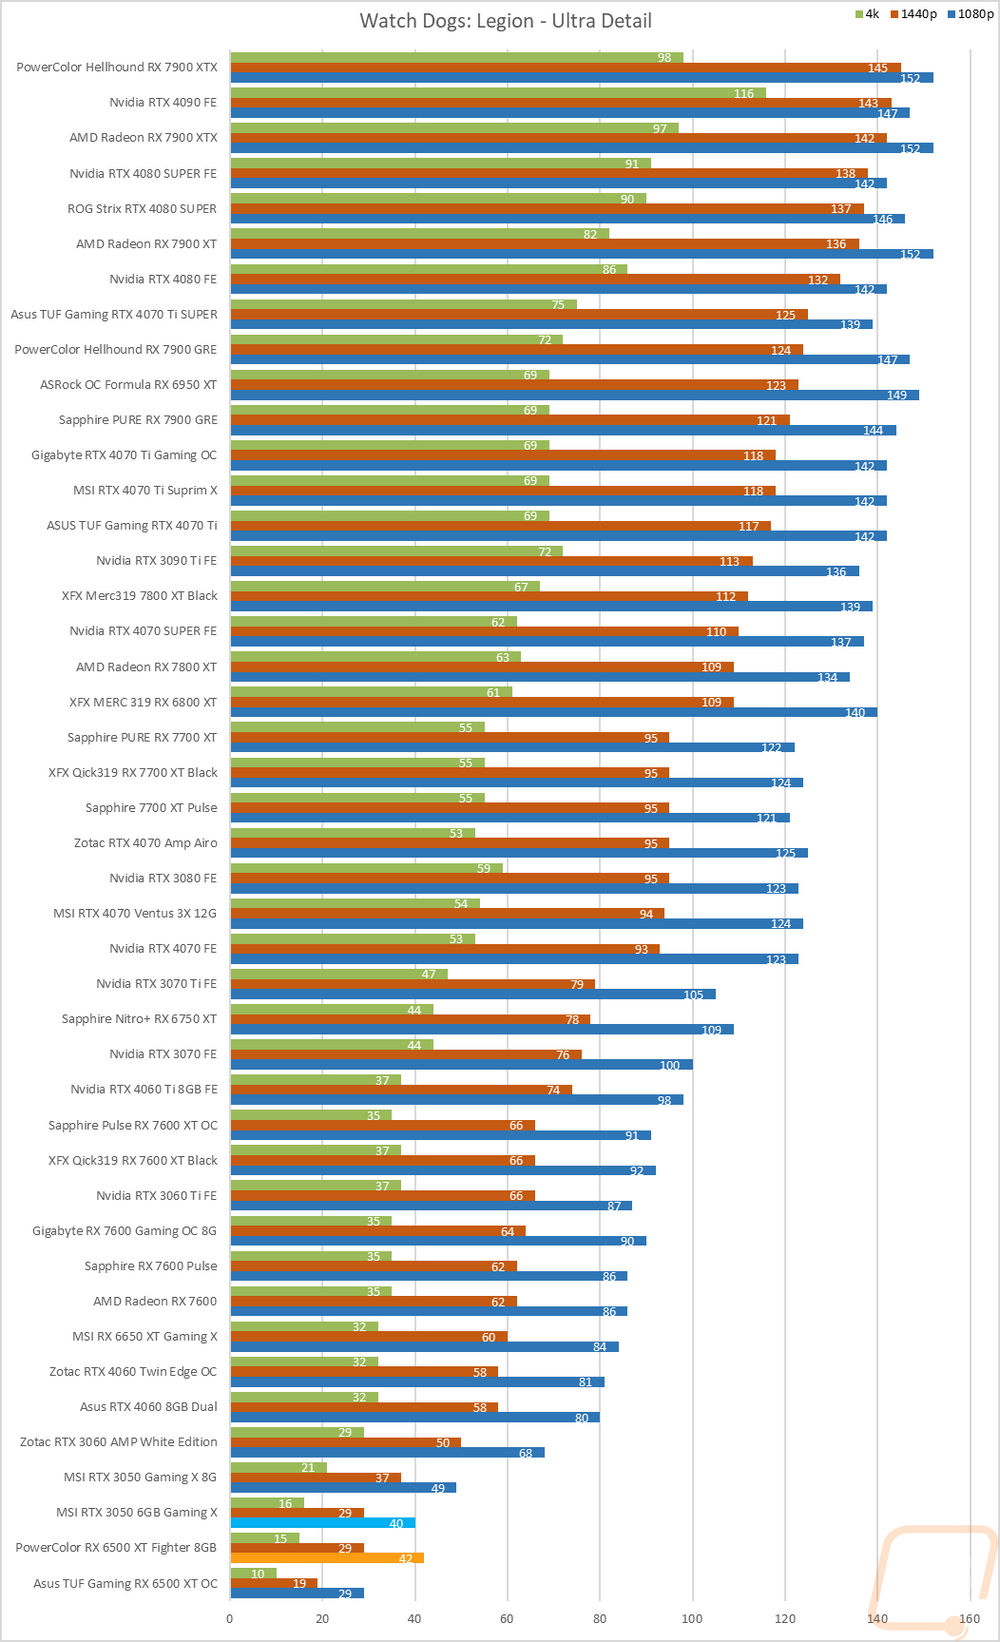
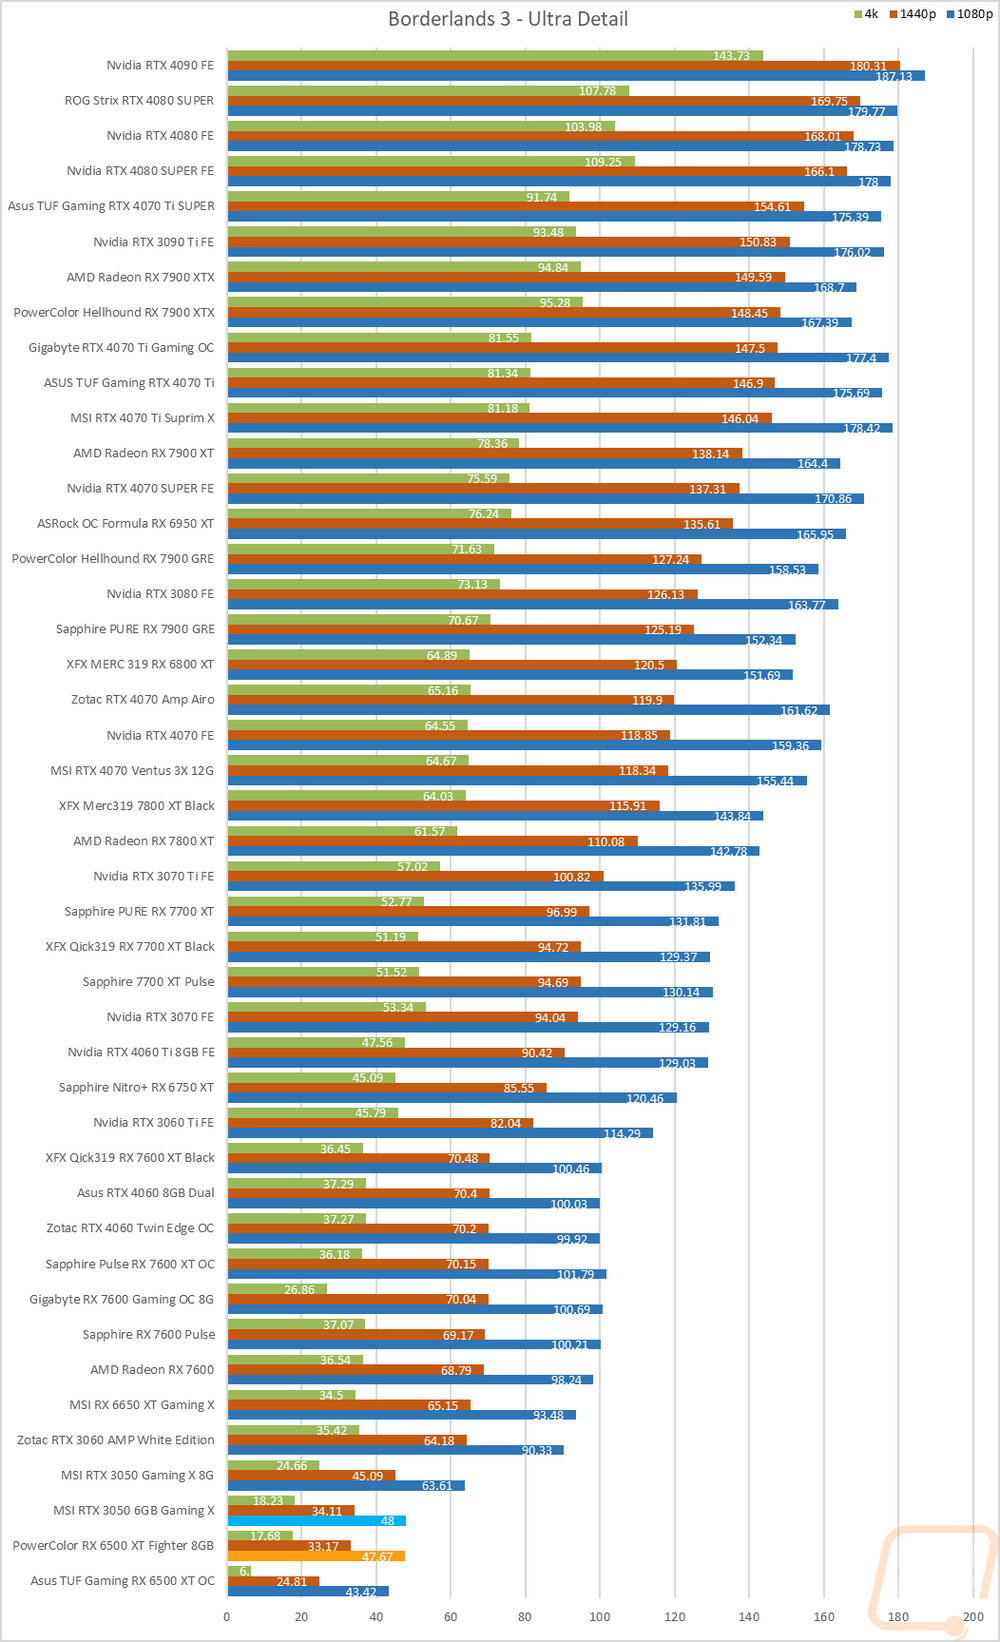
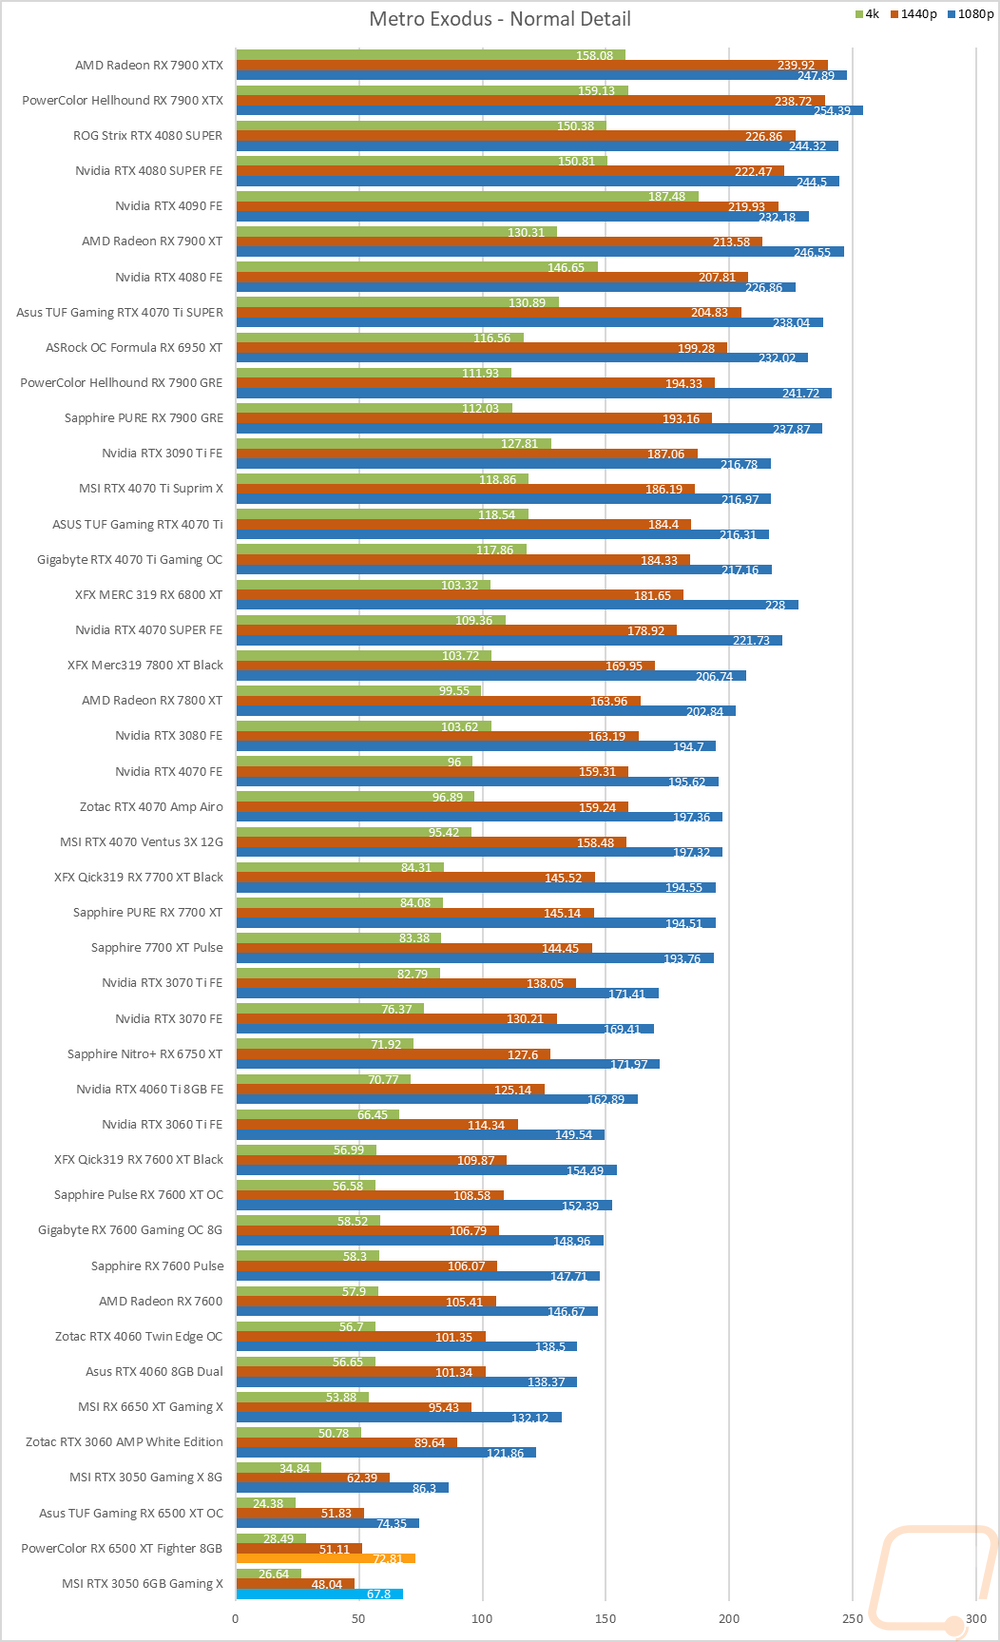
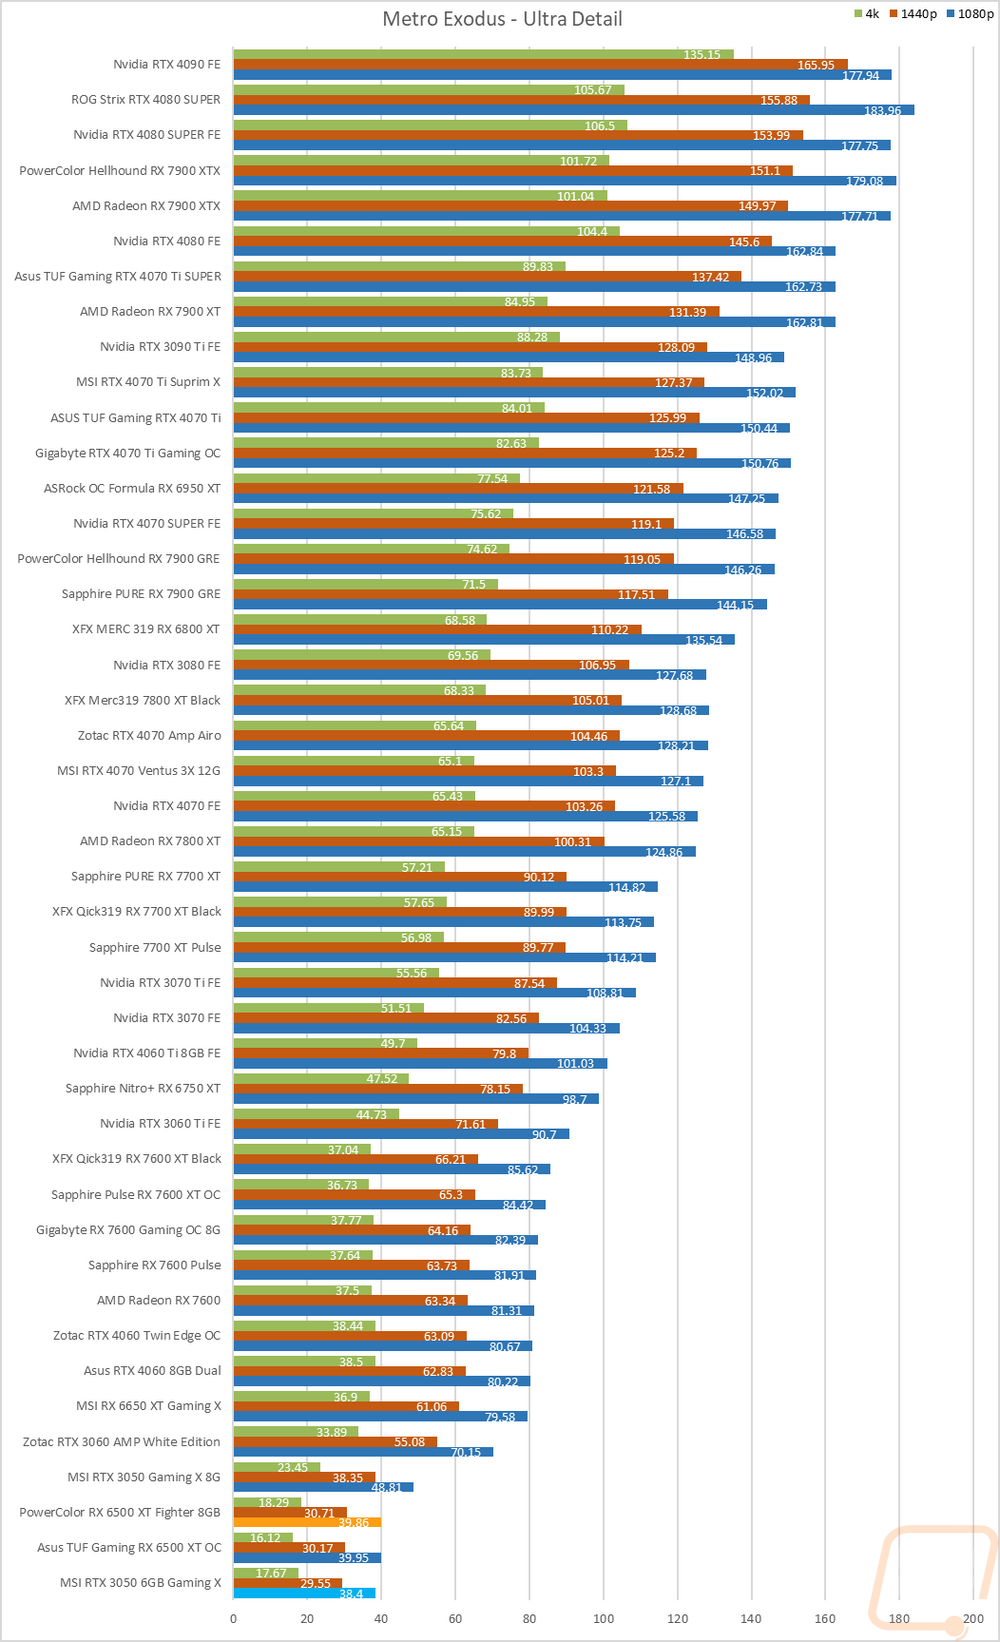
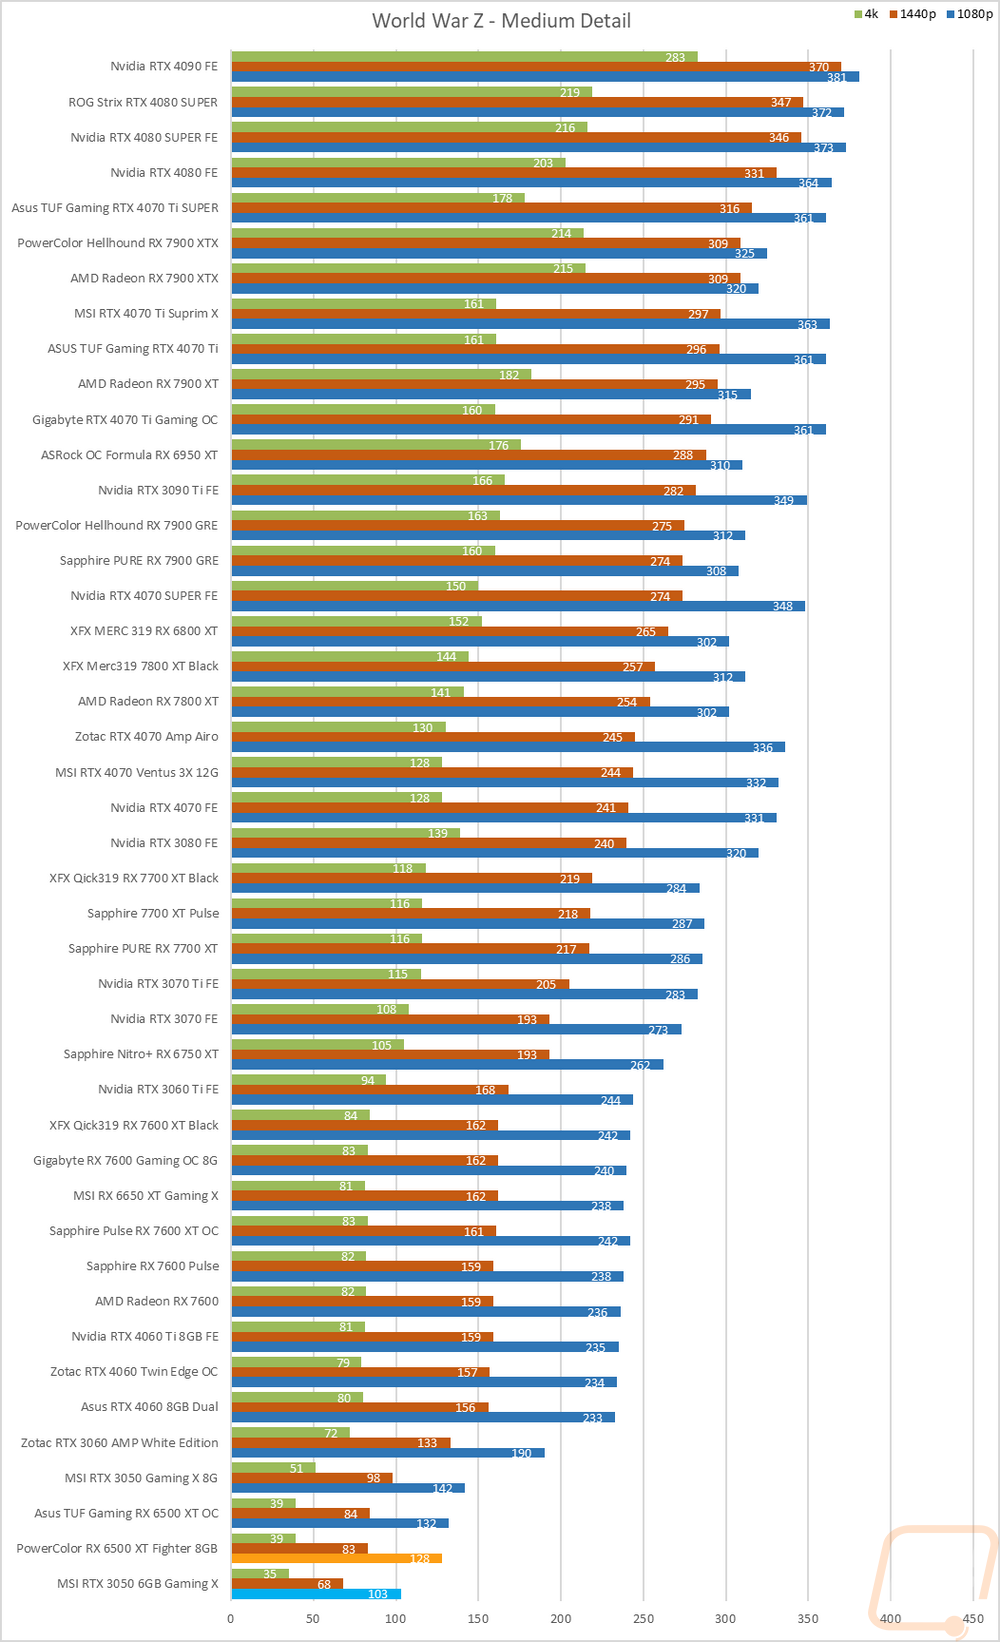
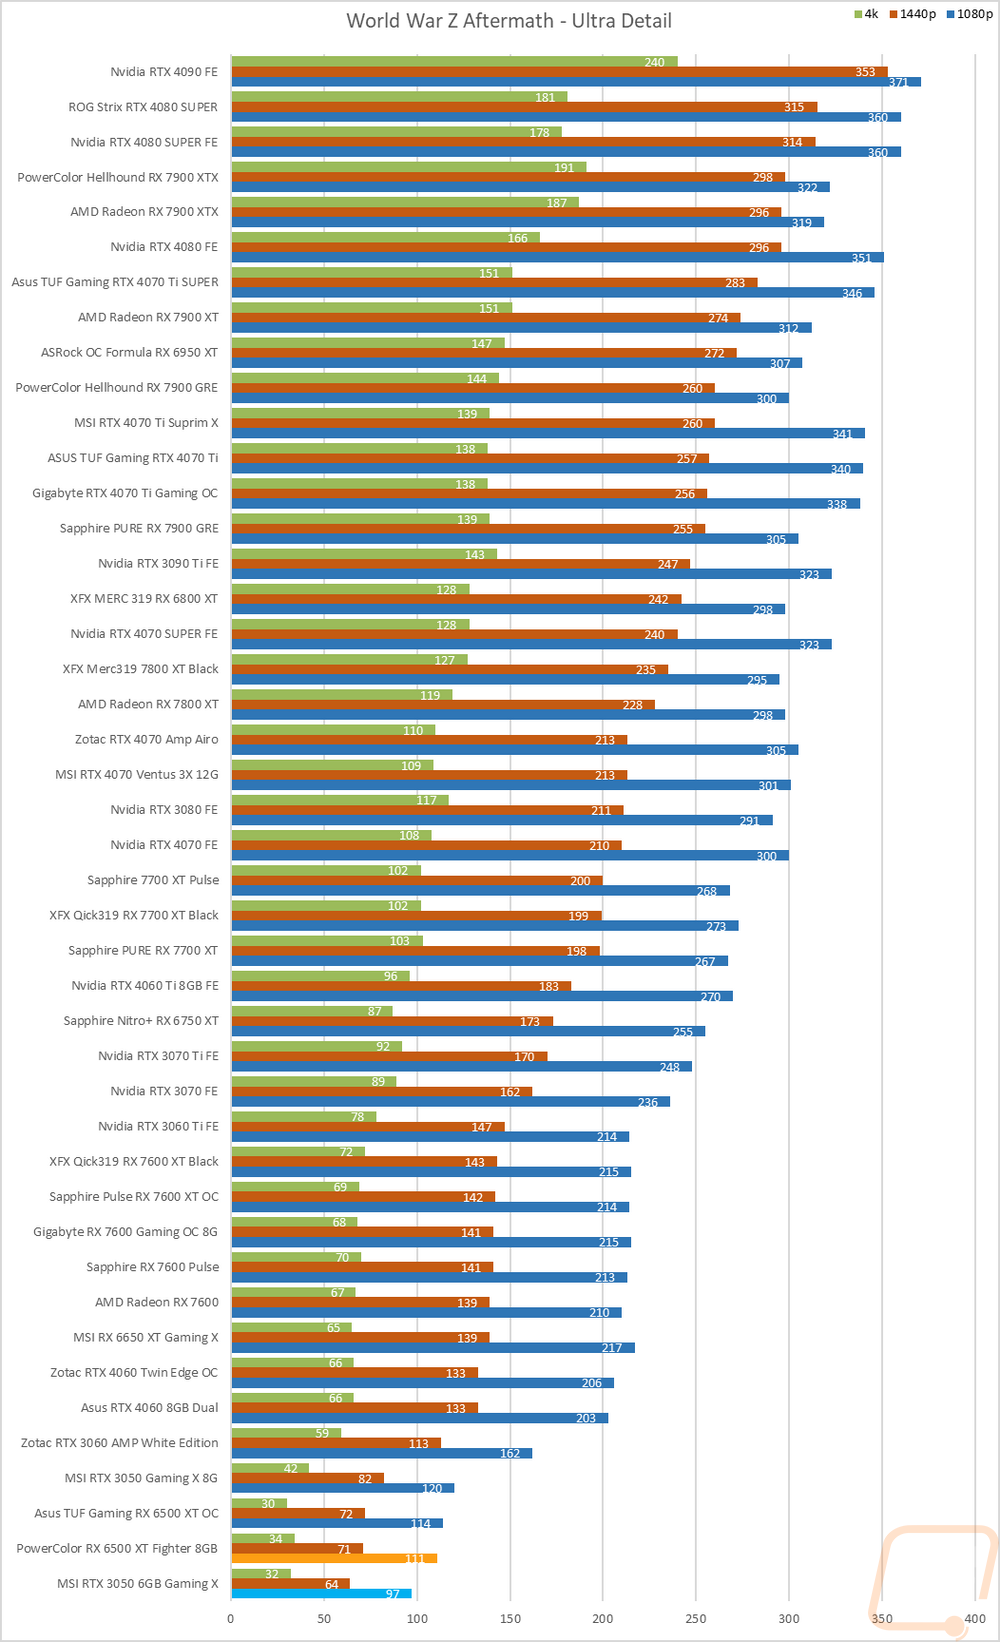
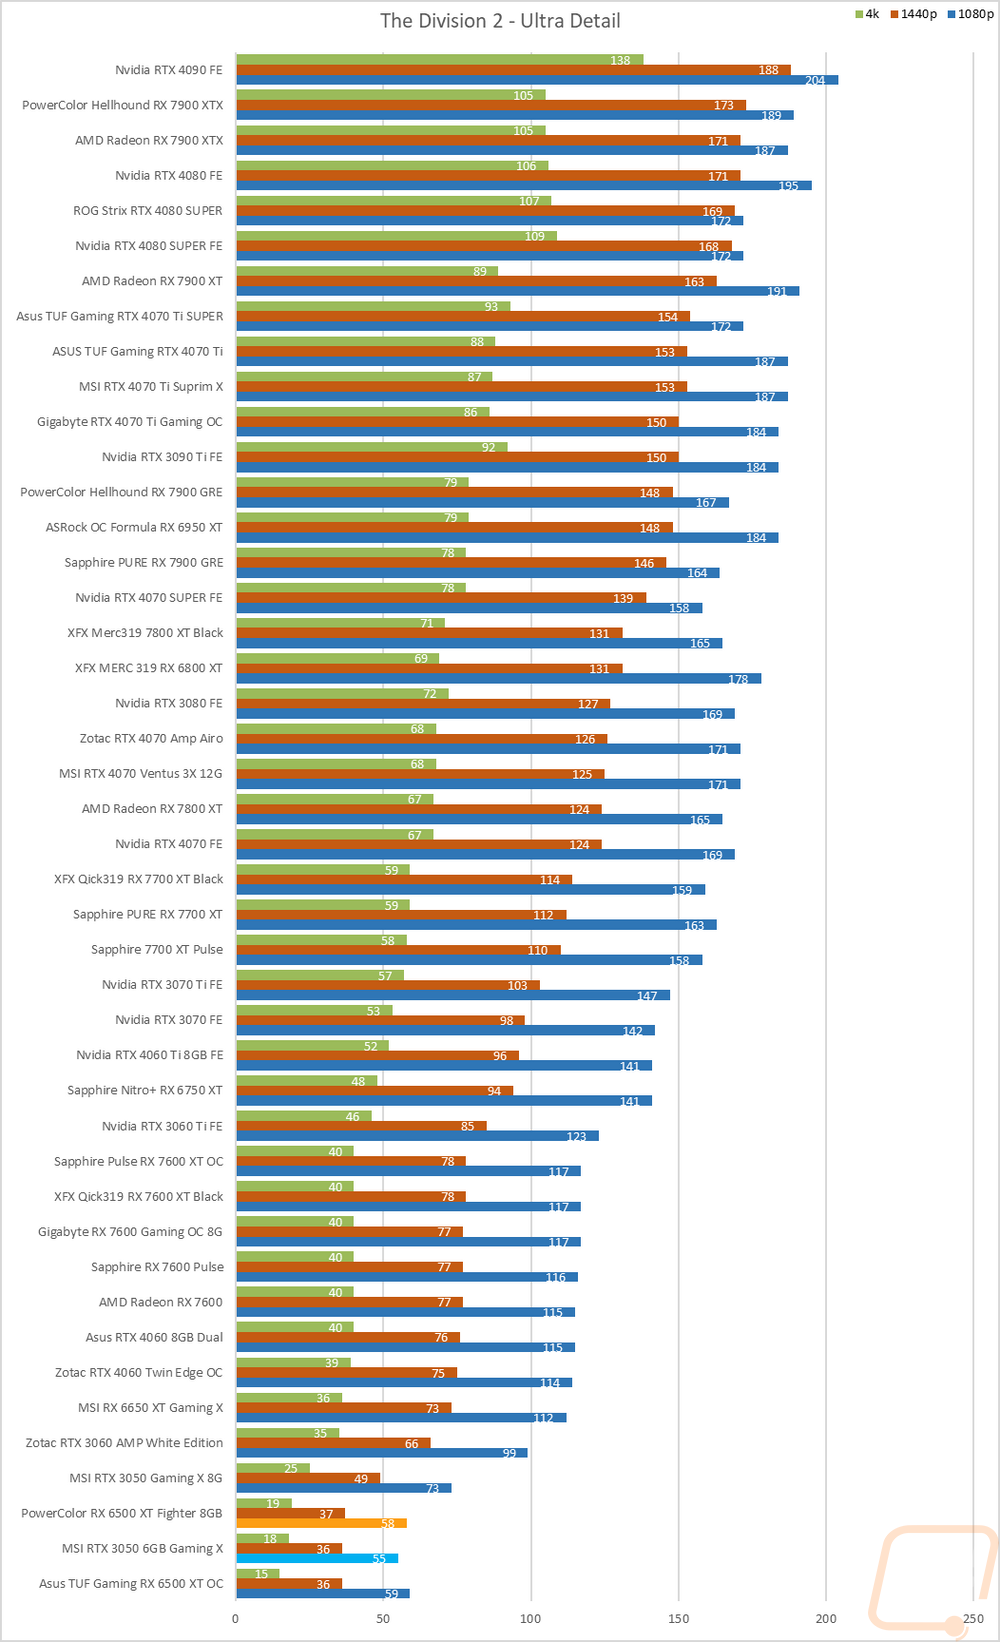
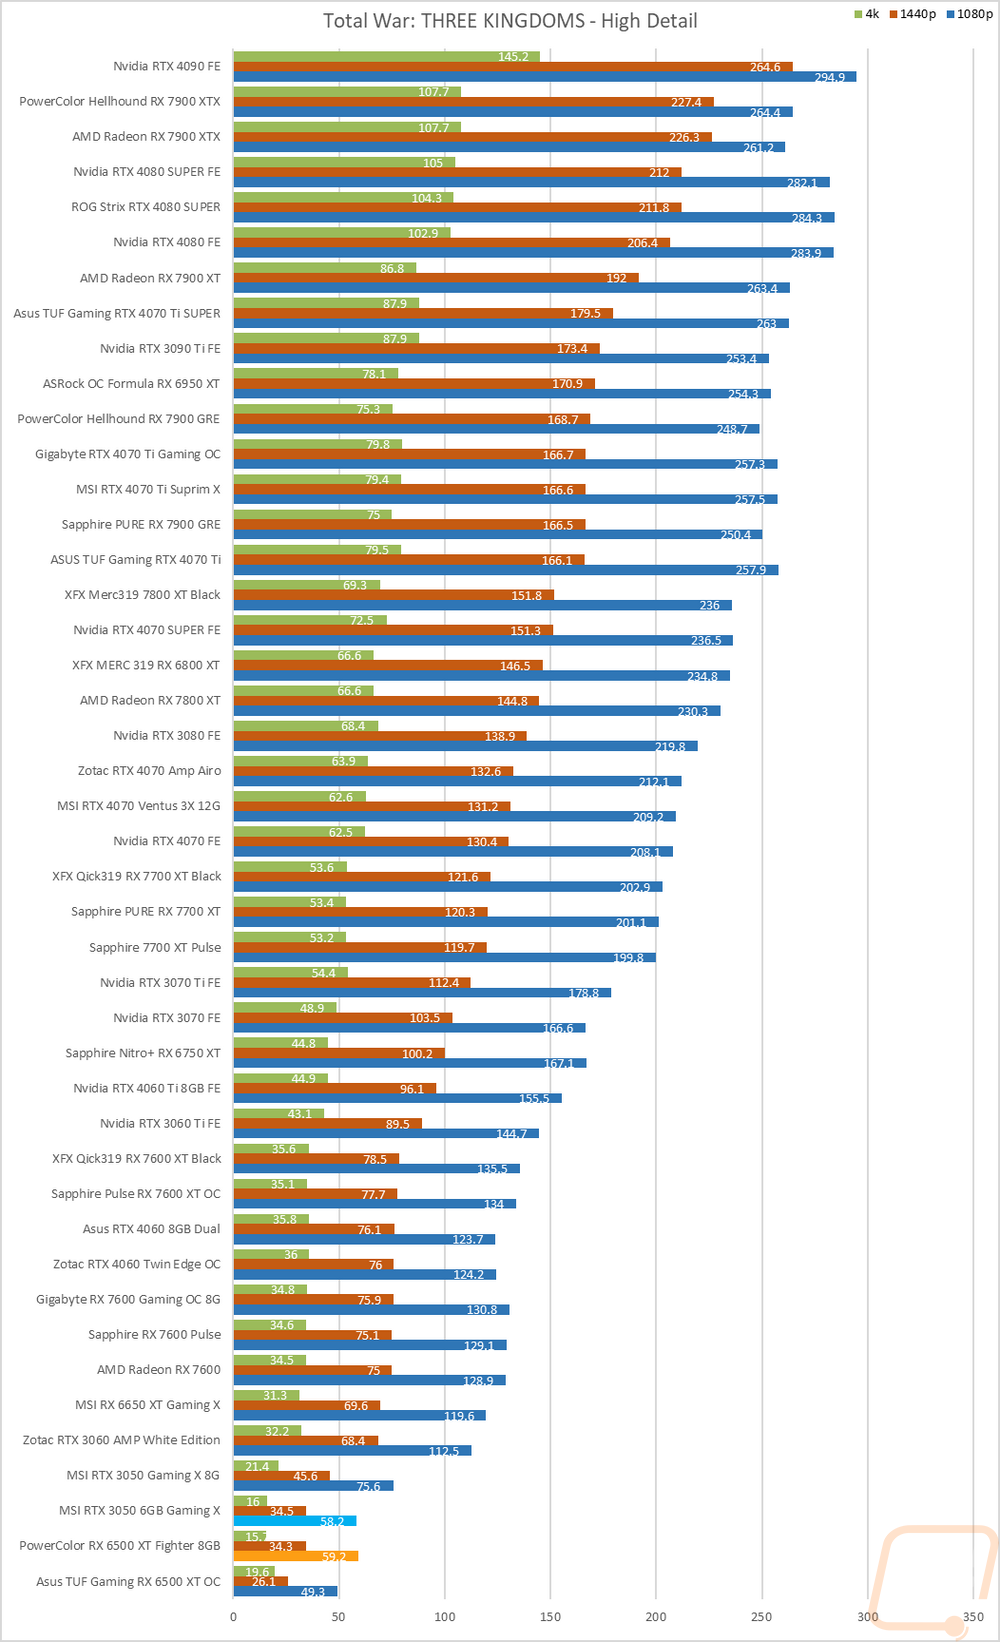
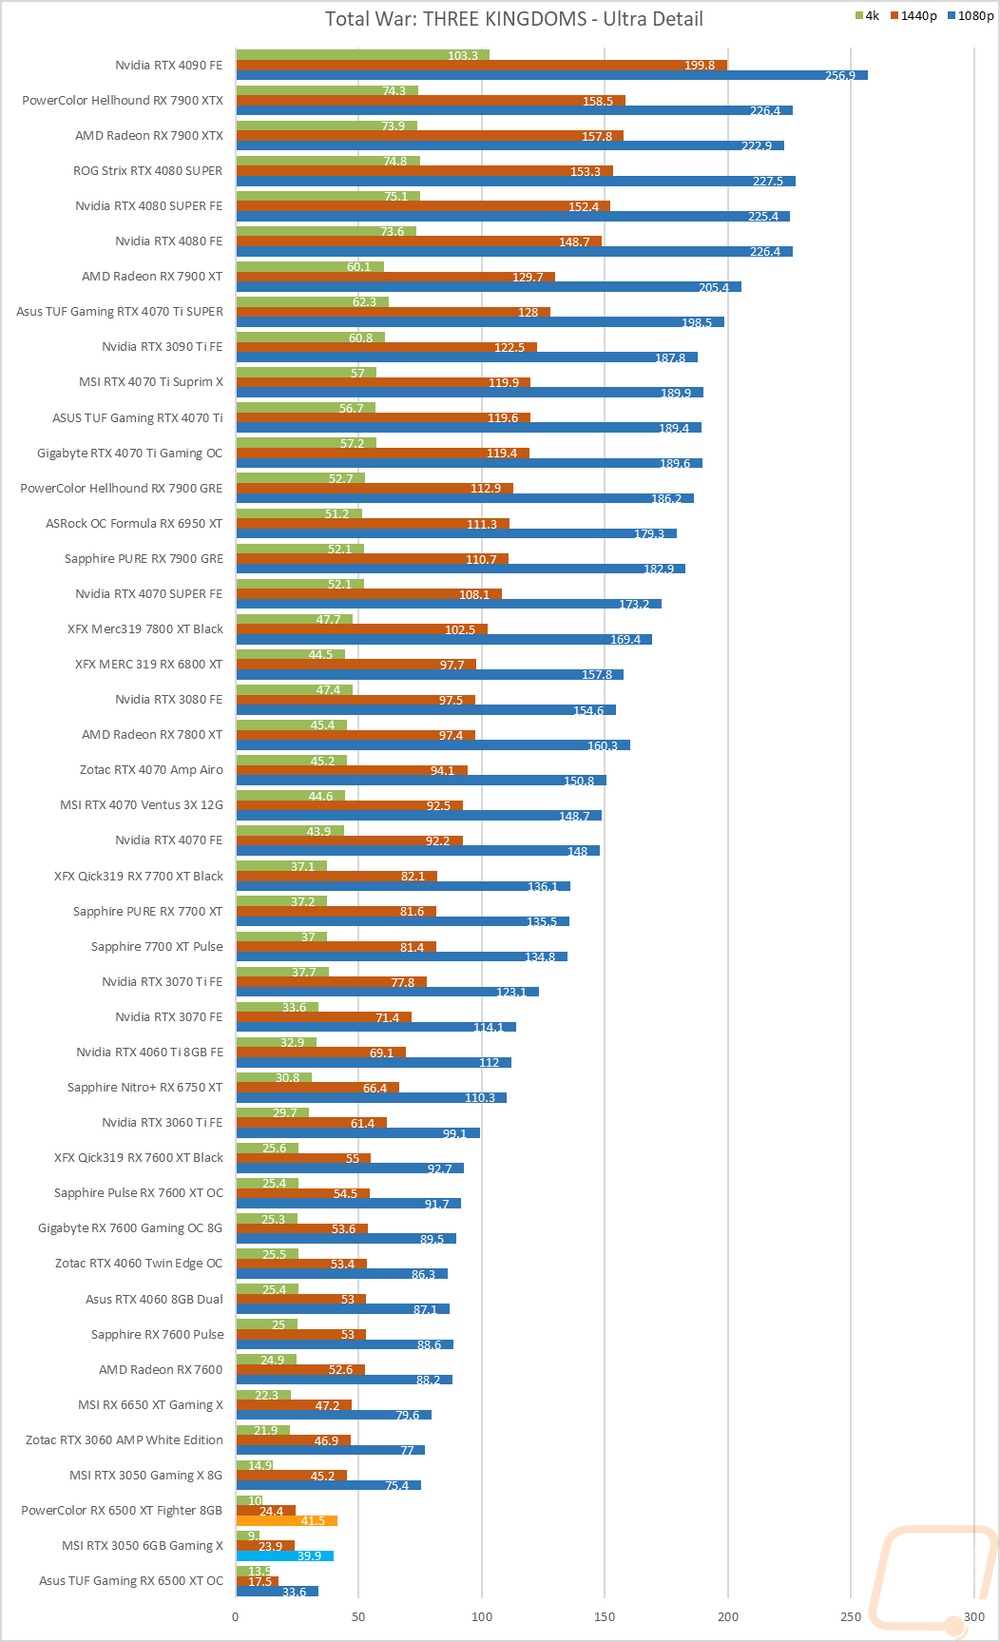
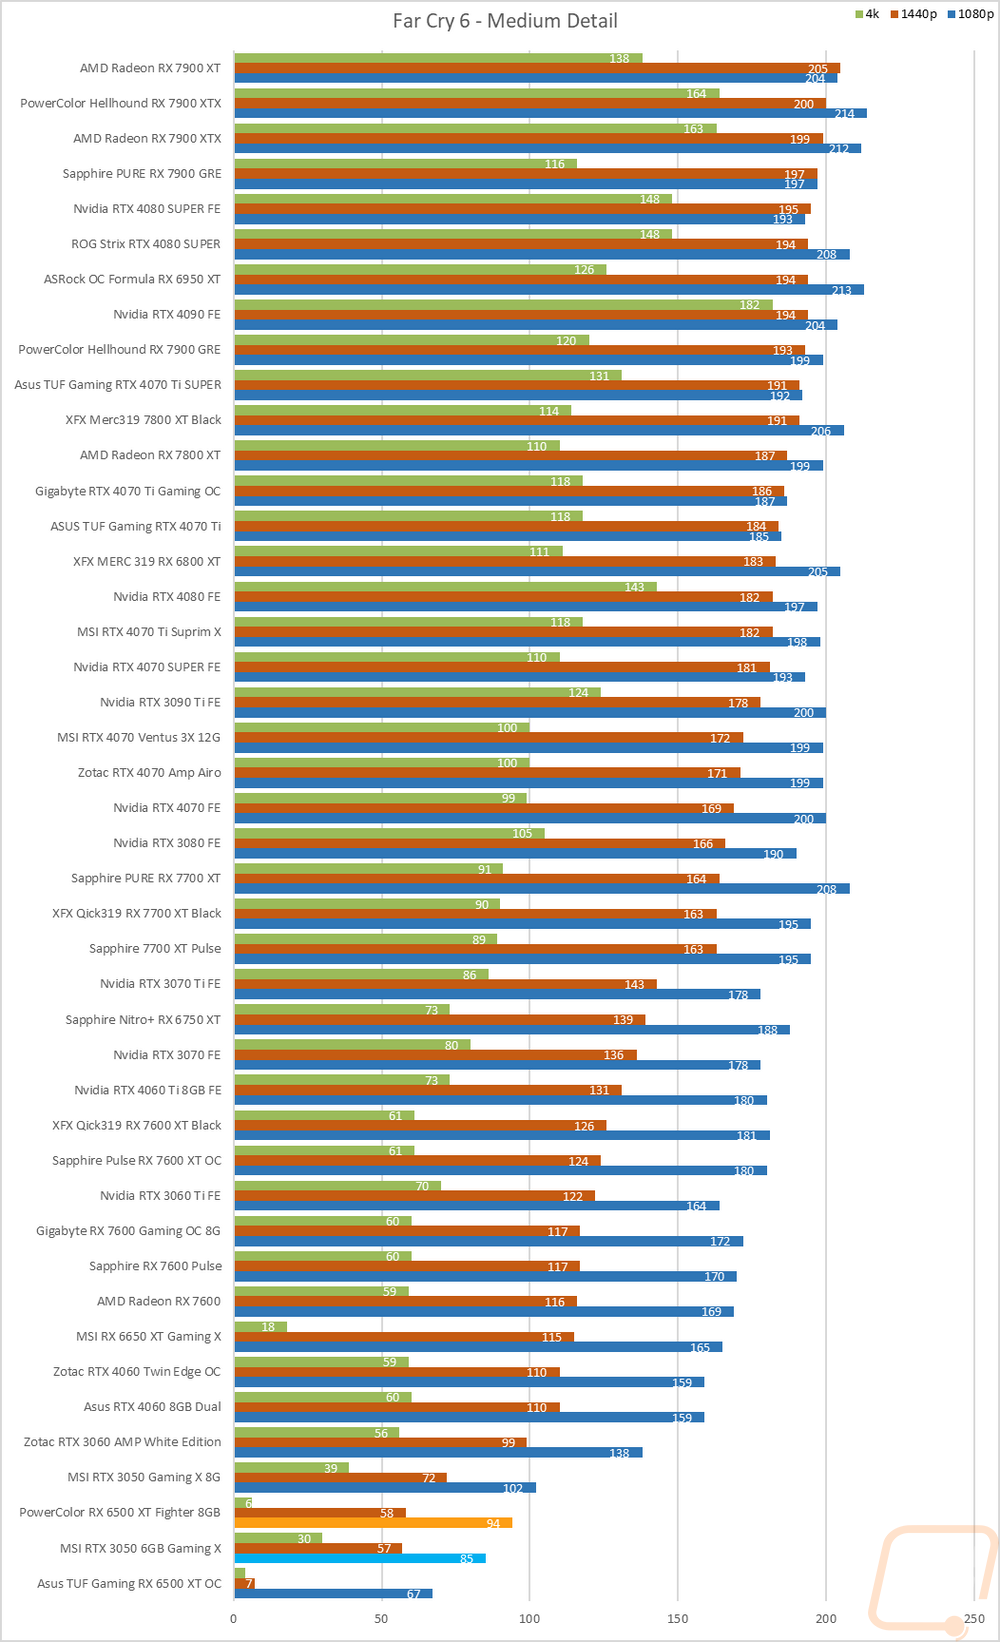
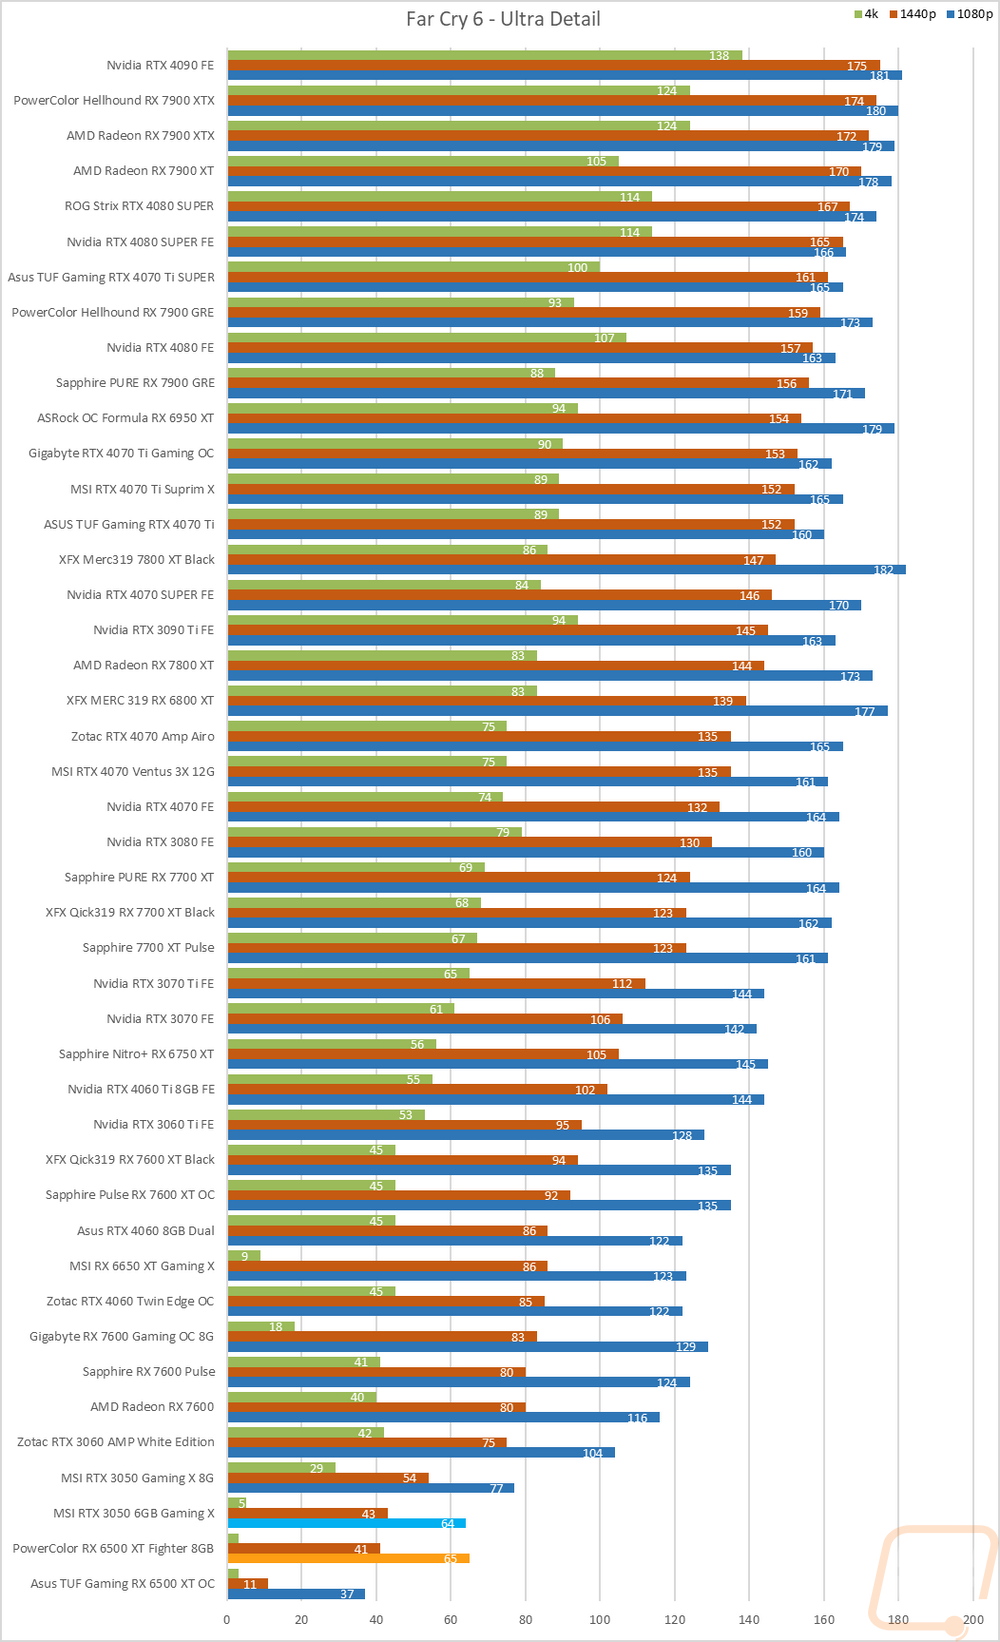
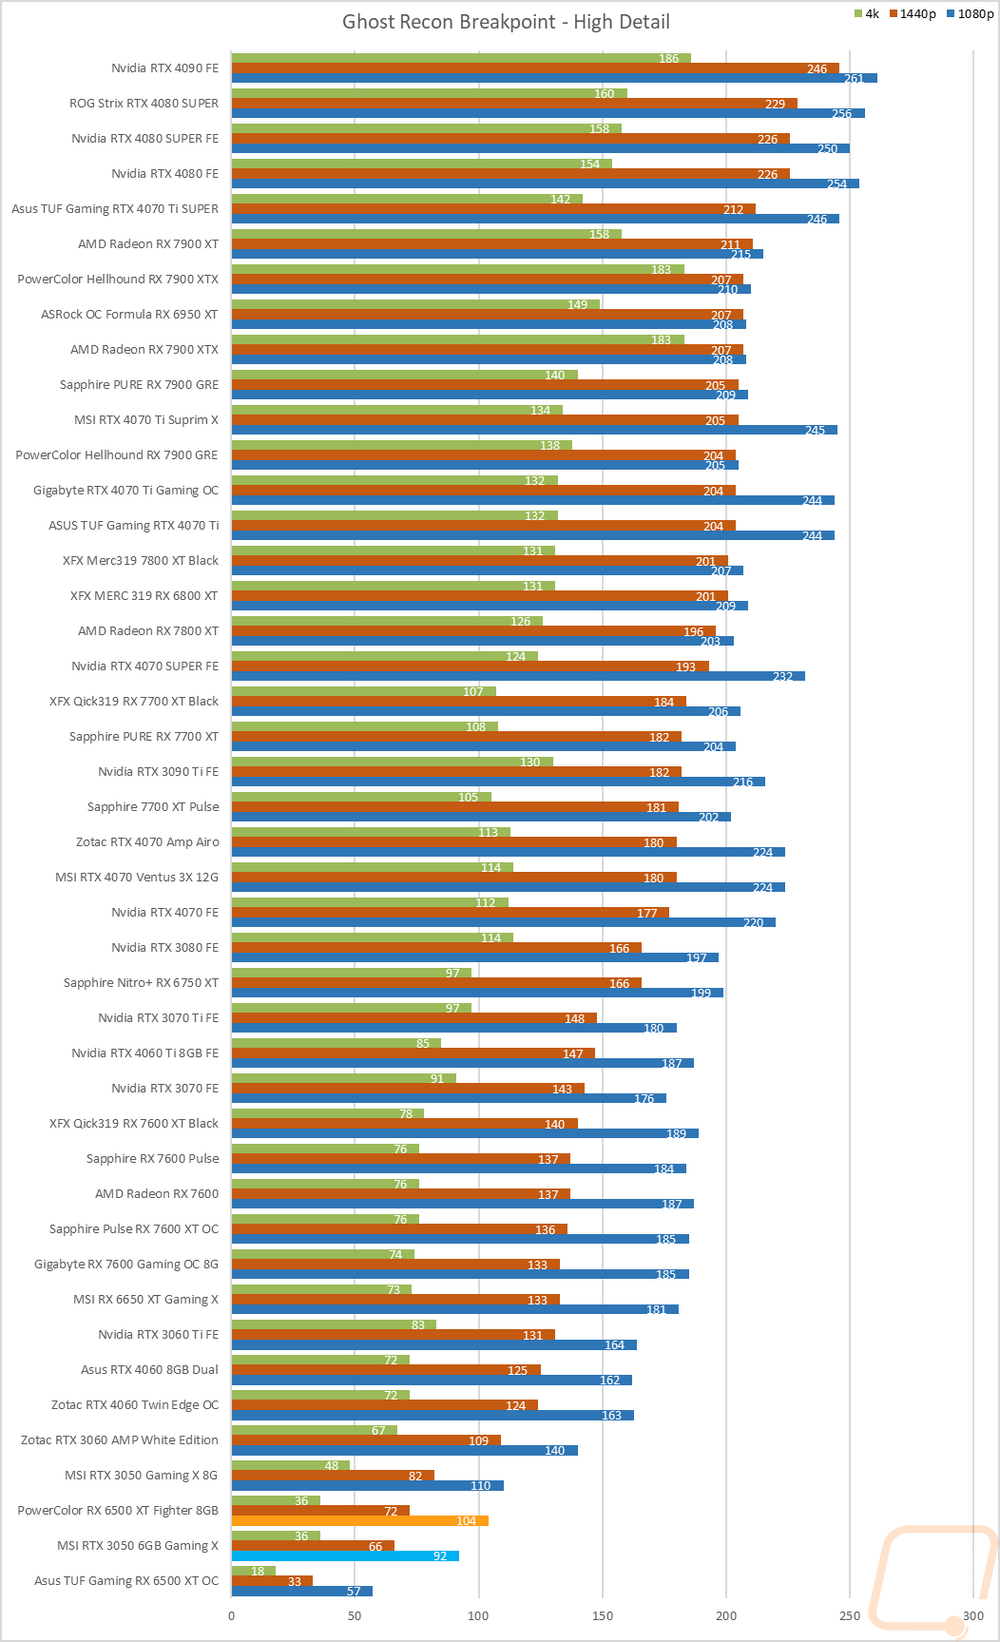
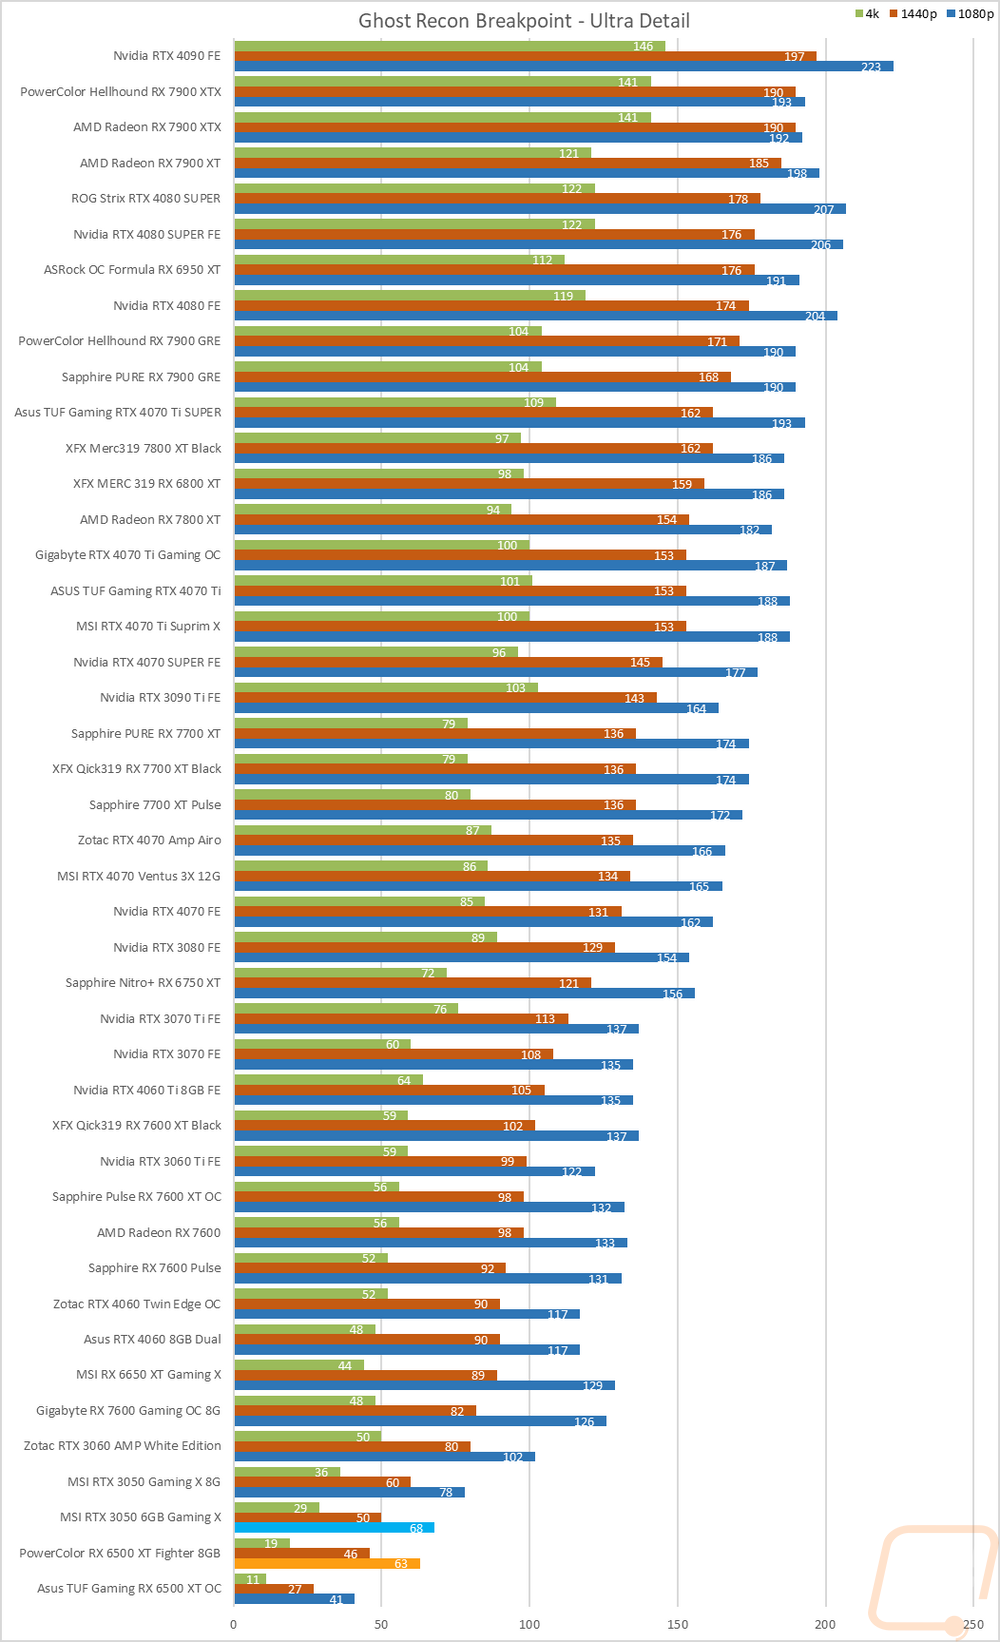
Of course, I have all of the actual in game results as well for anyone who wants to sort through the wall of graphs below. None of these results will be a surprise if you already saw the averaged numbers in the table above.