Synthetic Benchmarks
As always I like to start my testing with a few synthetic benchmarks. 3DMark especially is one of my favorites because it is very optimized in both Nvidia and AMD drivers. It's nice to not have to worry about it being favored too much either way and the repeatability of the results makes it a nice chance to compare from card to card, especially when comparing with the same GPU. For the Sapphire Pulse RX 7600 XT OC this is the second 7600 XT that I have tested so I am excited to see how it will compare with the XFX Qick319 RX 7600 XT Black as well. They both have the same boost clock of 2810 MHz but the XFX card is noticeably larger. Beyond that, I’m keeping an eye on how the Pulse RX 7600 XT OC compares with the original 7600 and the 6650 XT as well as the RTX 4060 and RTX 4060 Ti from Nvidia.
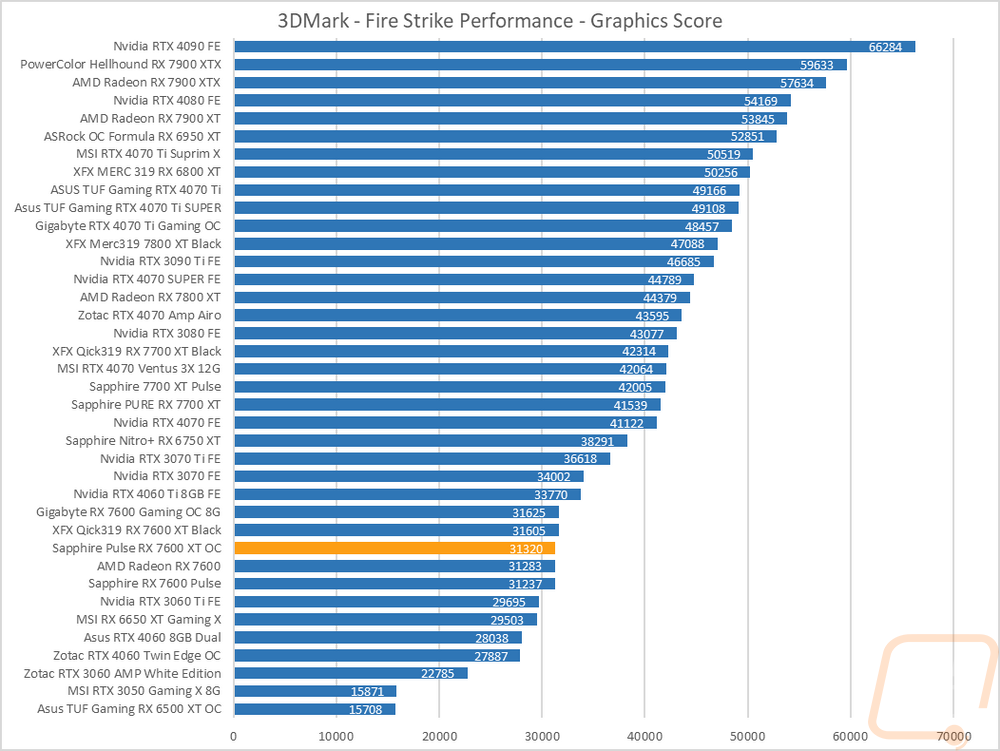
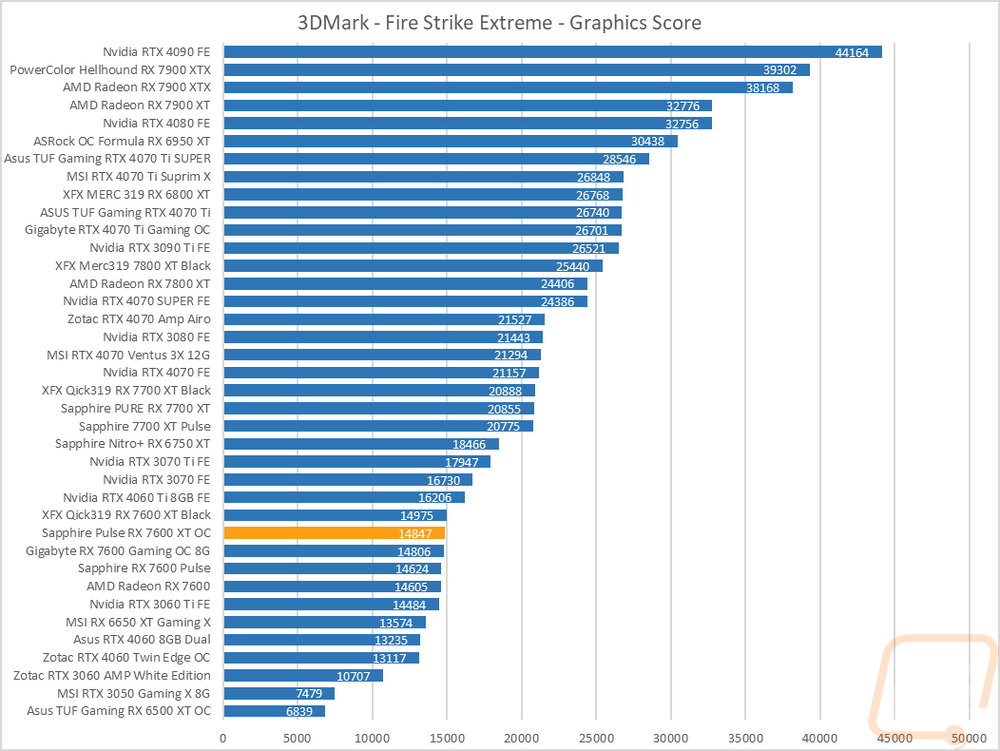
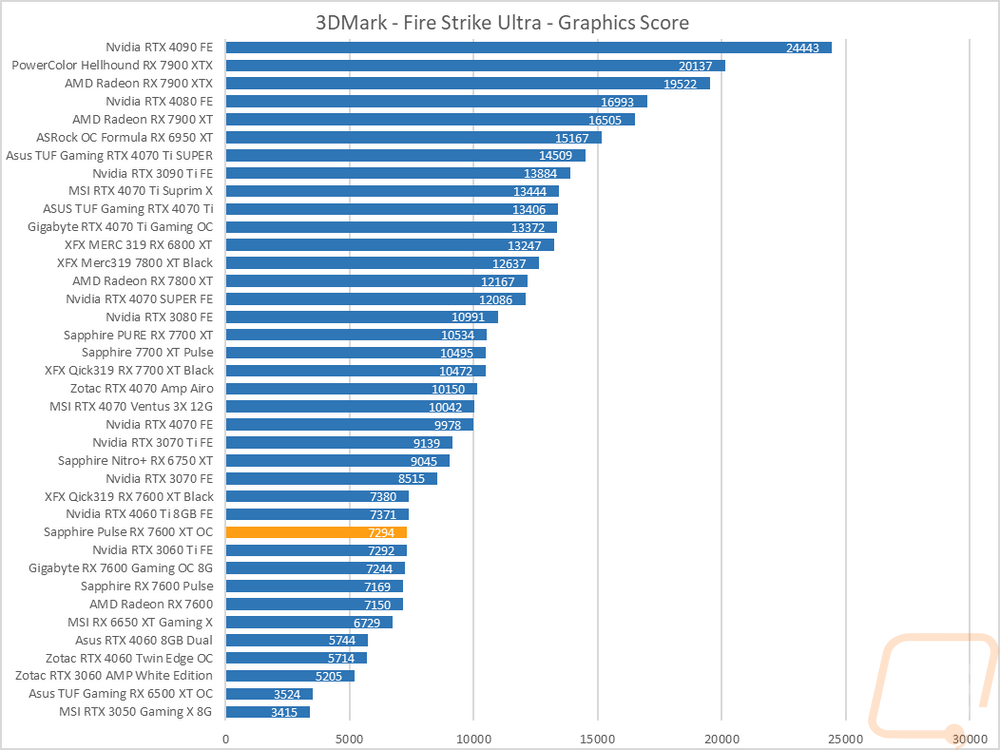
The first round of tests were done in the older Fire Strike benchmark which is a DX11 test. There are three detail levels, performance, extreme, and ultra. The Pulse RX 7600 XT OC is in a big group of cards with basically the same score that includes the XFX 7600 XT, the original RX 7600, and the 3060 Ti. In Fire Strike Ultra that also includes the 4060 Ti as well. I’m not a big fan of the 7600 XT running the same as the RX 7600 here but we did see this in our previous review, seeing it outperform the RTX 4060 though is good to see.
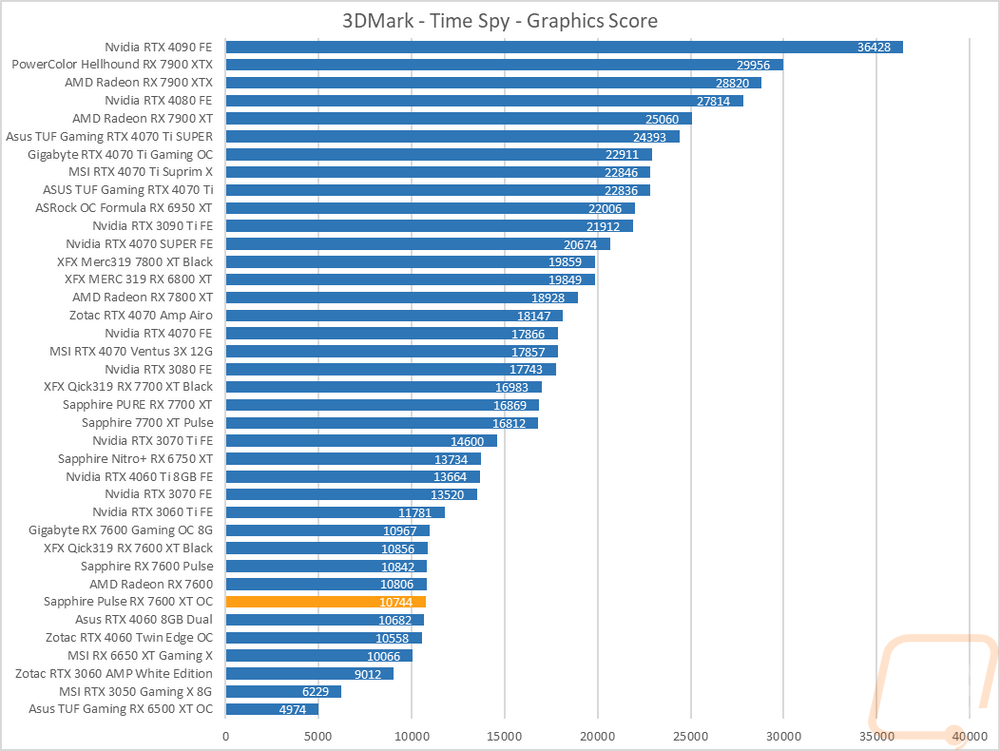
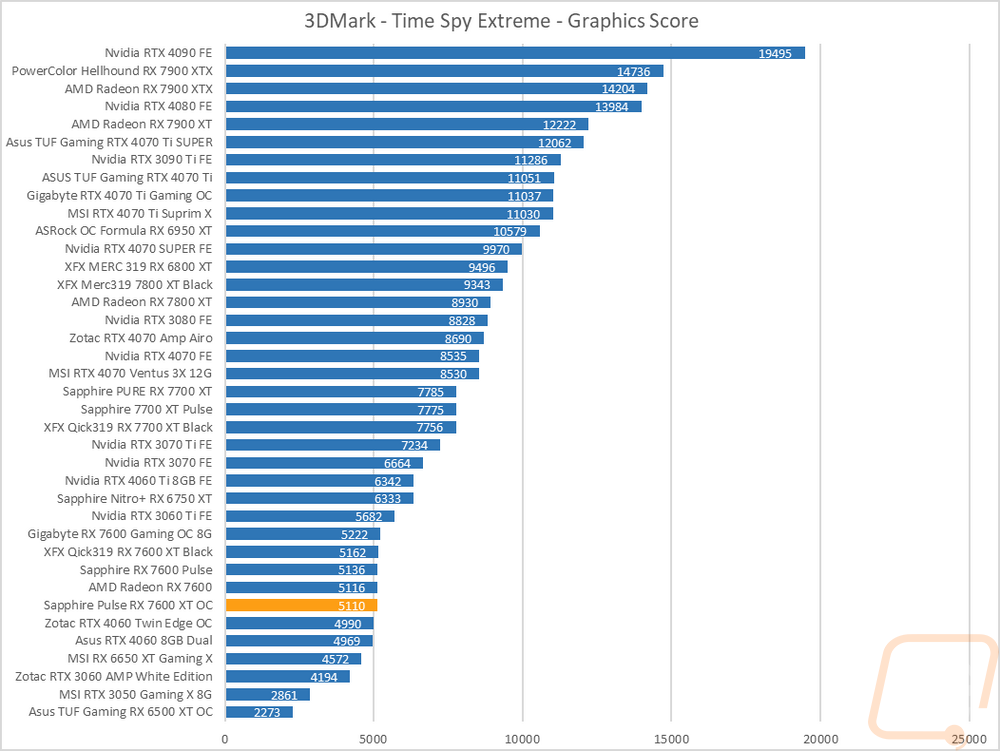
The next two were both based on the Time Spy benchmark. One is the standard test and then there is the extreme detail level. These are both DX12 and you can see the Nvidia cards move up slightly here. The Pulse RX 7600 XT OC is once again in a big clump of cards which includes the previous RX 7600 cards tested and this time the RTX 4060 is there as well but still slightly below it.
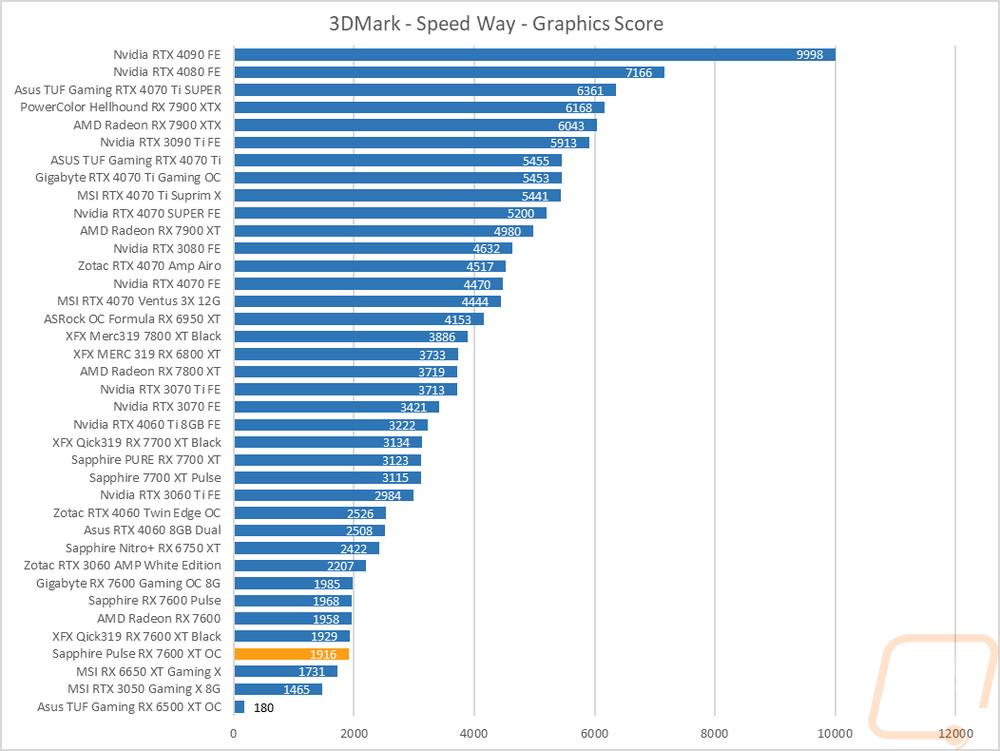
For ray tracing performance, I ran both the 3DMark Port Royal test which is ray tracing focused as well as the new 3DMark Speed Way test which tests all future-looking features including ray tracing. In Speed Way, the Pulse RX 7600 XT OC is right with the 7600 XT but behind just a few points, both cards are still right with the original RX 7600 however. In this test, the 4060 and even the older 3060 are way up ahead with much better ray tracing capabilities. The Pulse RX 7600 XT OC did better in Port Royal but is still behind the XFX and both are much closer but still behind the RTX 4060.

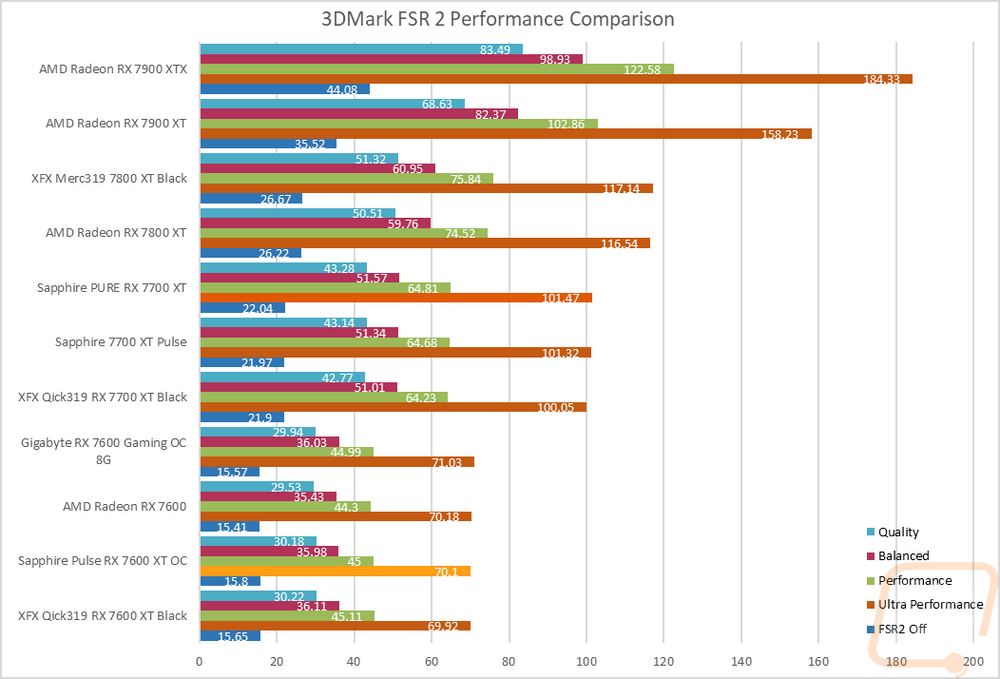
While in 3Dmark I did also take a look at the FSR 2 performance using the comparison tool. For this, I ran the Pulse RX 7600 XT OC with FSR 2 off and then on with each of the different detail levels. This gives us a look at what FSR 2 can do for a performance improvement. We went from 15.8 FPS, doubling that up to 30.18 on the quality setting. Balanced and Performance were at 35.98 FPS and 45 FPS but the ultra performance setting was impressive taking that original 15.8 all the way up to 70.1 FPS. The Pulse RX 7600 XT OC did edge out in front of the XFX card here as well.
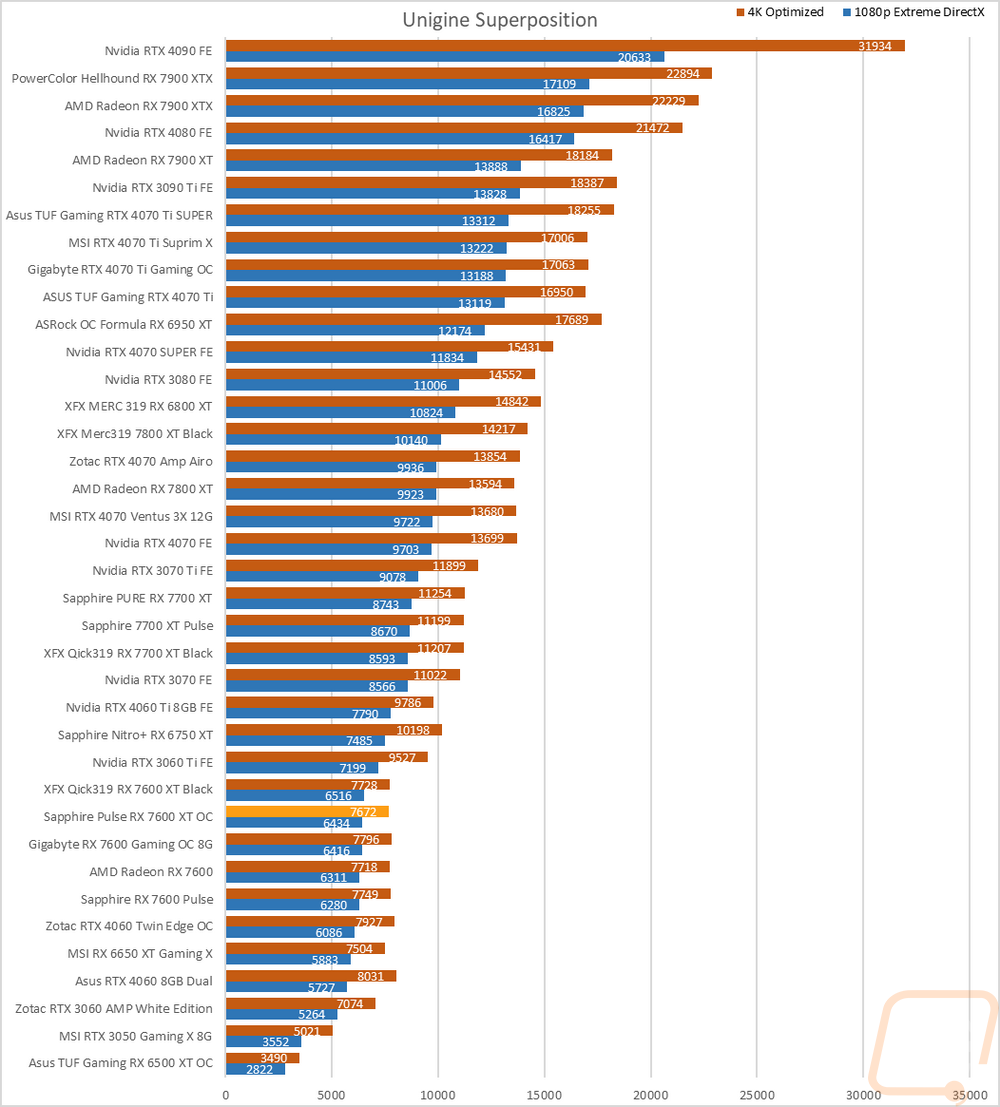
The last test was using the Unigine-based Superposition benchmark and I tested at 1080p with the extreme detail setting as well as the 4K optimized setting. In the extreme detail setting the Pulse RX 7600 XT OC scored a 6434 which was with but just behind the XFX 7600 XT but this did at least put it out in front of the RX 7600 and the RTX 4060.