Cooling Noise and Power
For my last few tests, rather than focusing on in game performance, I like to check out other aspects of video card performance. These are also the most important ways to differentiate the performance between cards that have the same GPU. To start things off I took a look at power usage.
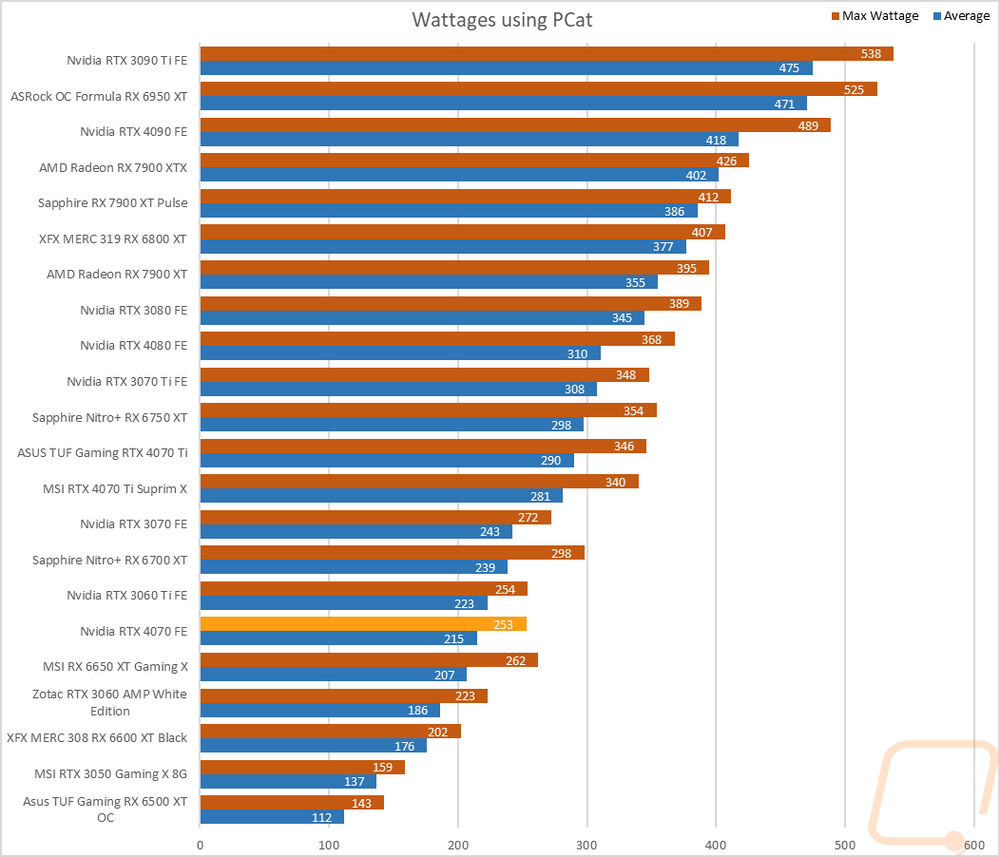
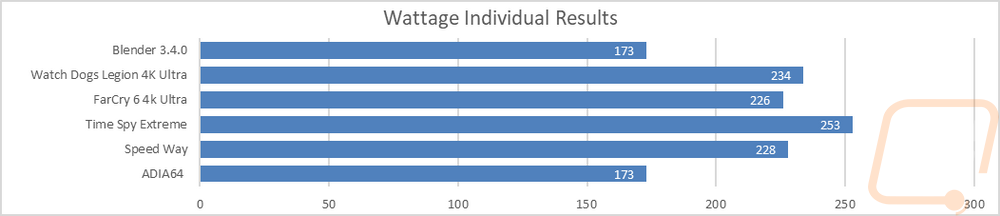
For this, our new test setup utilizes the Nvidia-designed PCat v2 along with cables to handle both traditional 6 or 8-pin connections as well as the new 12VHPWR. The PCat also utilizes a PCIe adapter to measure any power going to the card through the PCIe slot so we can measure the video card wattage exclusively, not the entire system as we have done in the past. I test with a mix of applications to get both in game, synthetic benchmarks, and other workloads like Blender and AIDA64. Then everything is averaged together for our result. I also have the individual results for this specific card and I document the peak wattage result as well which is almost always Time Spy Extreme. For the RTX 4070 Founders Edition, its max wattage was 253 and averaged an impressive 215 watts across all of the tests. This put it right with the RTX 3060 Ti for the peak wattage result but sits 8 watts lower than that with the average. For comparison the RTX 3080 which the 4070 performed similarly averaged 345 watts and peaked at 389 watts. The RTX 4070 is impressively power efficient.
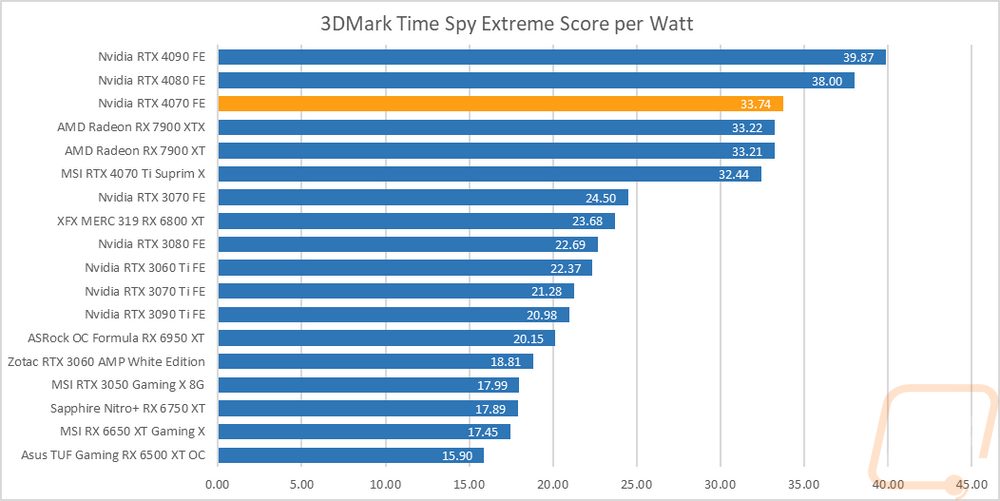
With exact peak wattage numbers when running Time Spy Extreme I was also able to put together a graph showing the total score for each watt that a card draws which gives us an interesting look at overall power efficiency in the popular and demanding benchmark. This reinforces what I was saying before about the RTX 4070’s overall power efficiency with it running up near the top of the chart only behind the 4080 and 4090 in score per watt.
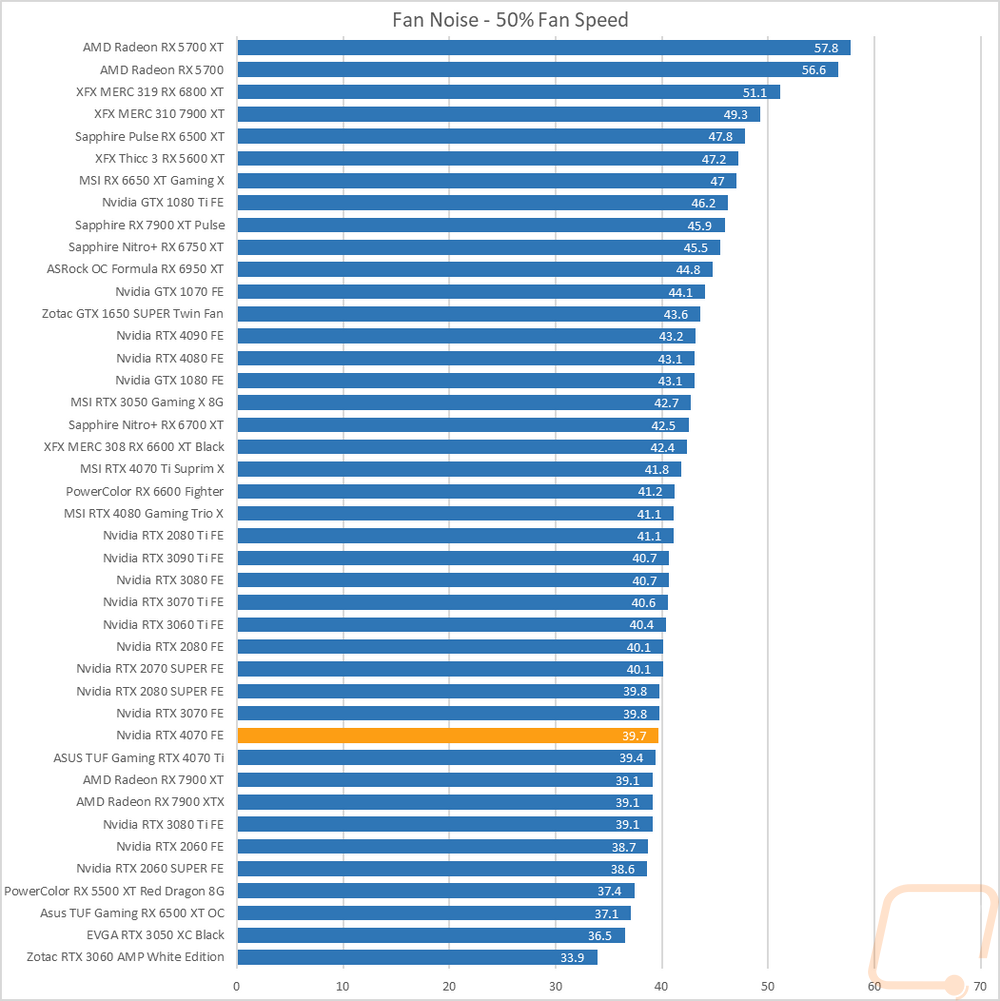
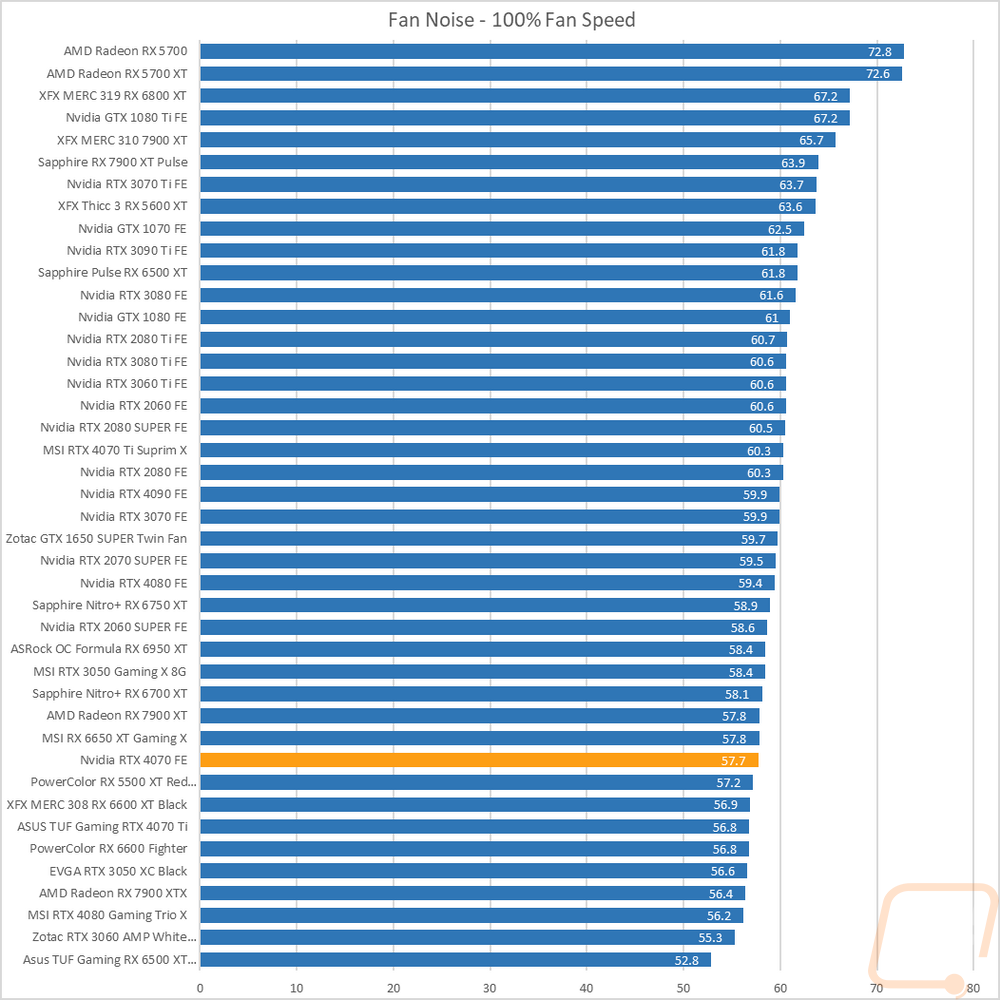
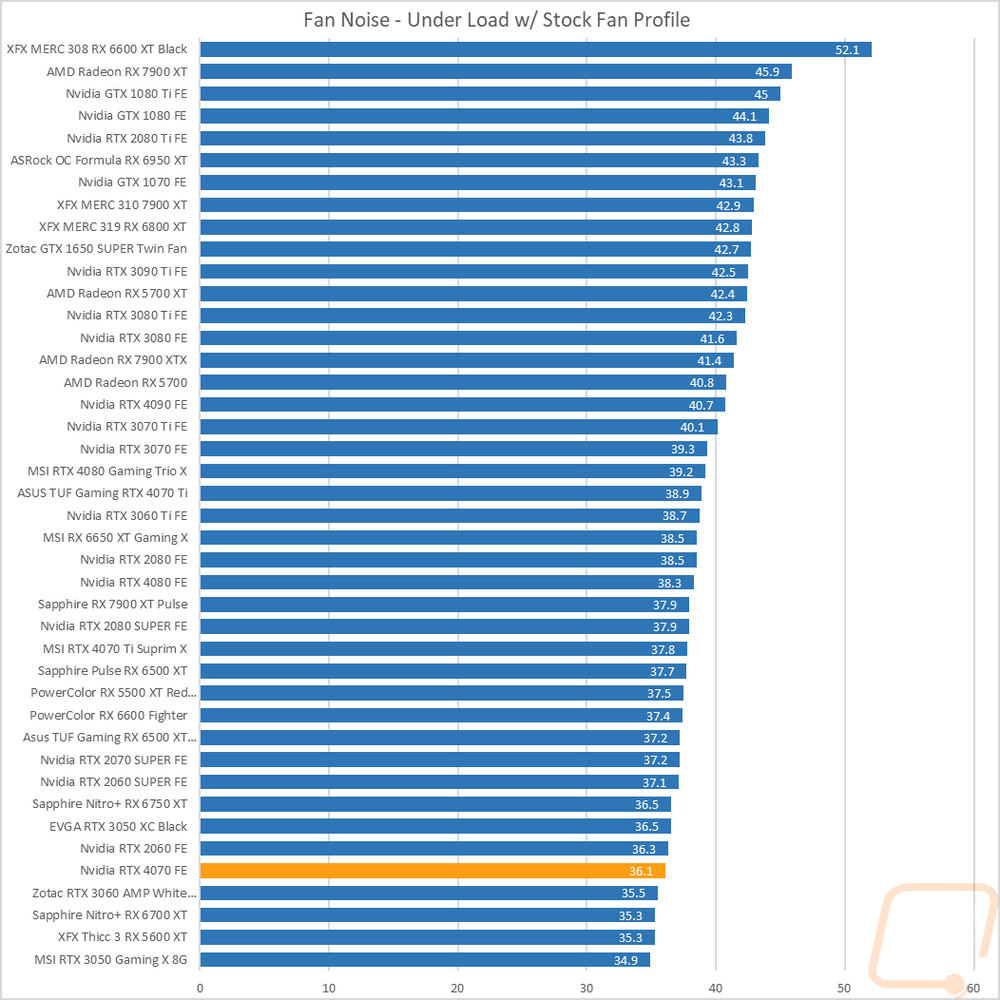
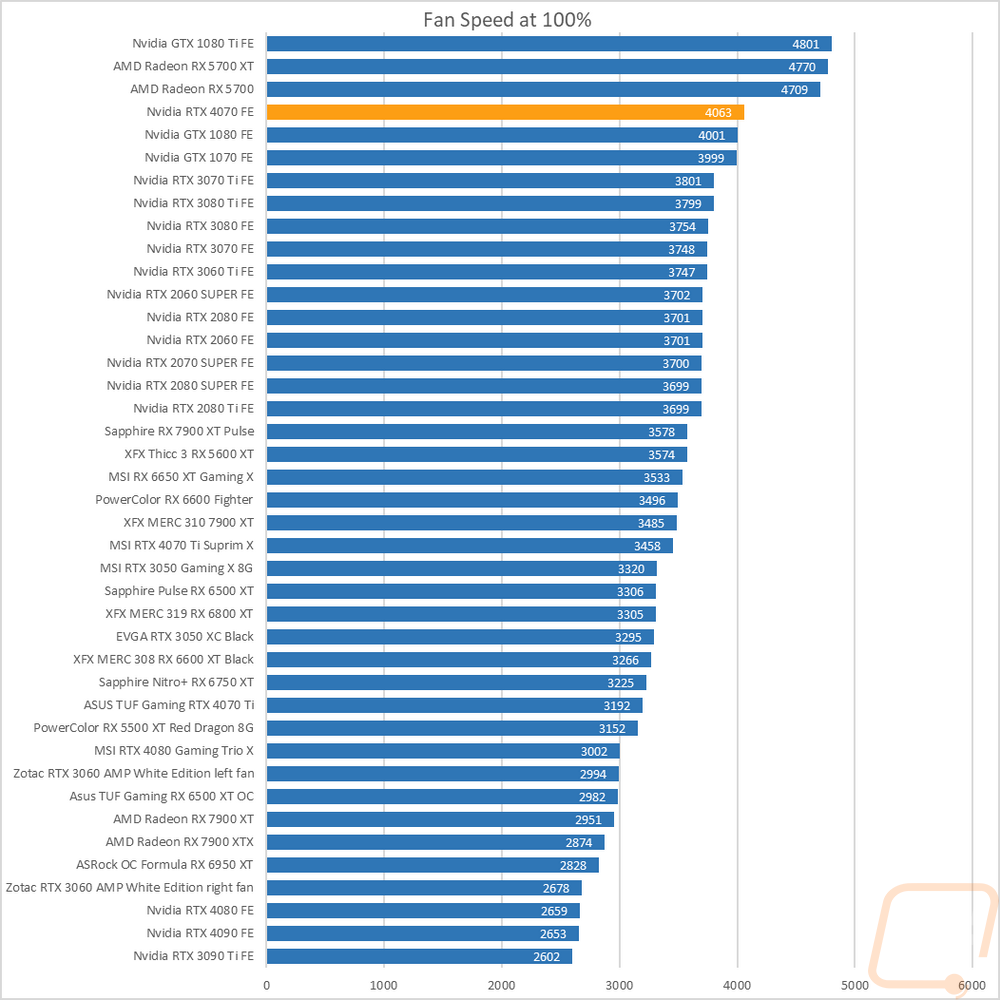
My next round of tests were looking at noise levels. These are especially important to me because I can’t stand to listen to my PC whirling. Especially when I’m not in game and other applications are using the GPU. For my testing, though I first tested with the fan cranked up to 100% to get an idea of how loud it can get, then again at 50% to get an idea of its range. The RTX 4070 Founders Edition did well in both tests with the card running down in the bottom ¼ of our charts in both results. This is surprising when we also check out the max fan RPM chart where the 4070 Founders Edition is near the top with its two fans running at 4063 RPM. Typically the overall RPM matches up with the noise levels but Nvidia has done a great job with the design to keep that down. I also take a look at noise performance while under load. For that when running AIDA64’s stress test I wait until the temperature of the card has leveled off and then measure how loud things are when the card is at its worst-case scenario with the stock fan profile. Here the RTX 4070 Founders Edition is again down at the bottom of the chart at 36.1 decibels, running with the lowest-end GPUs.
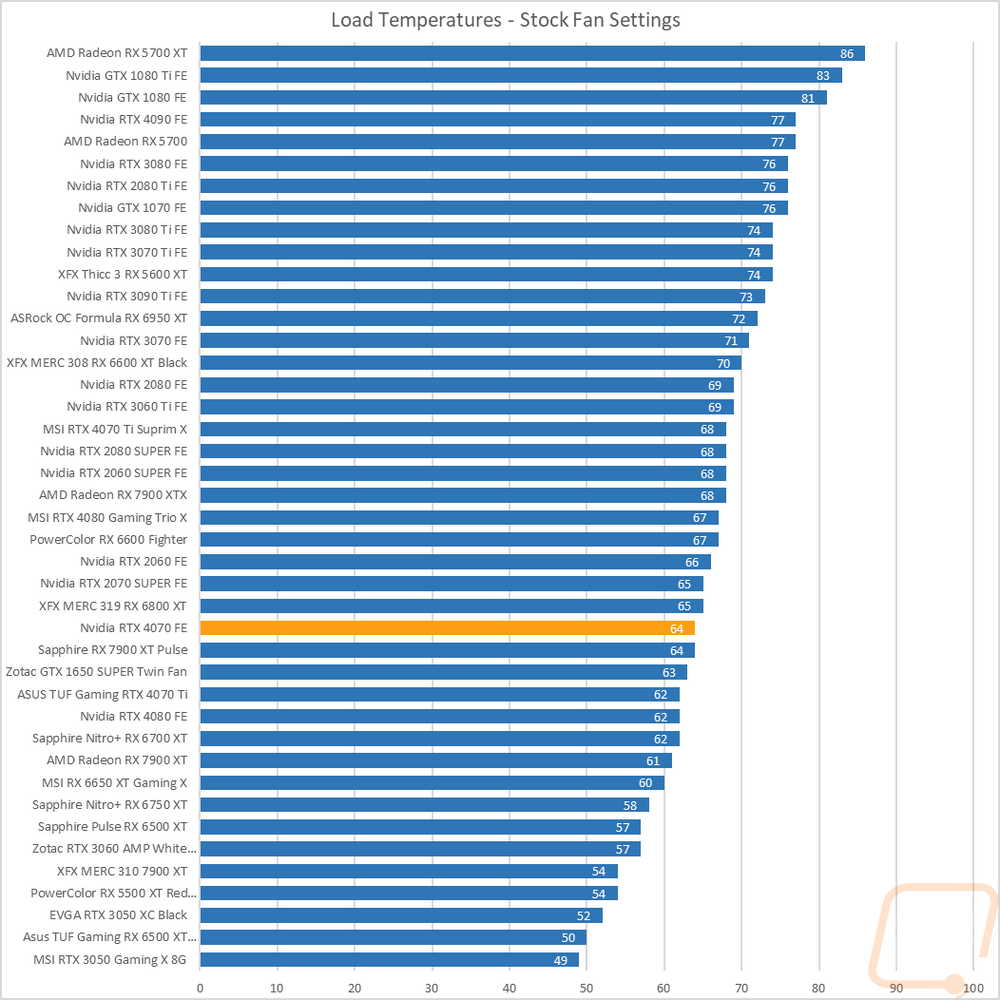
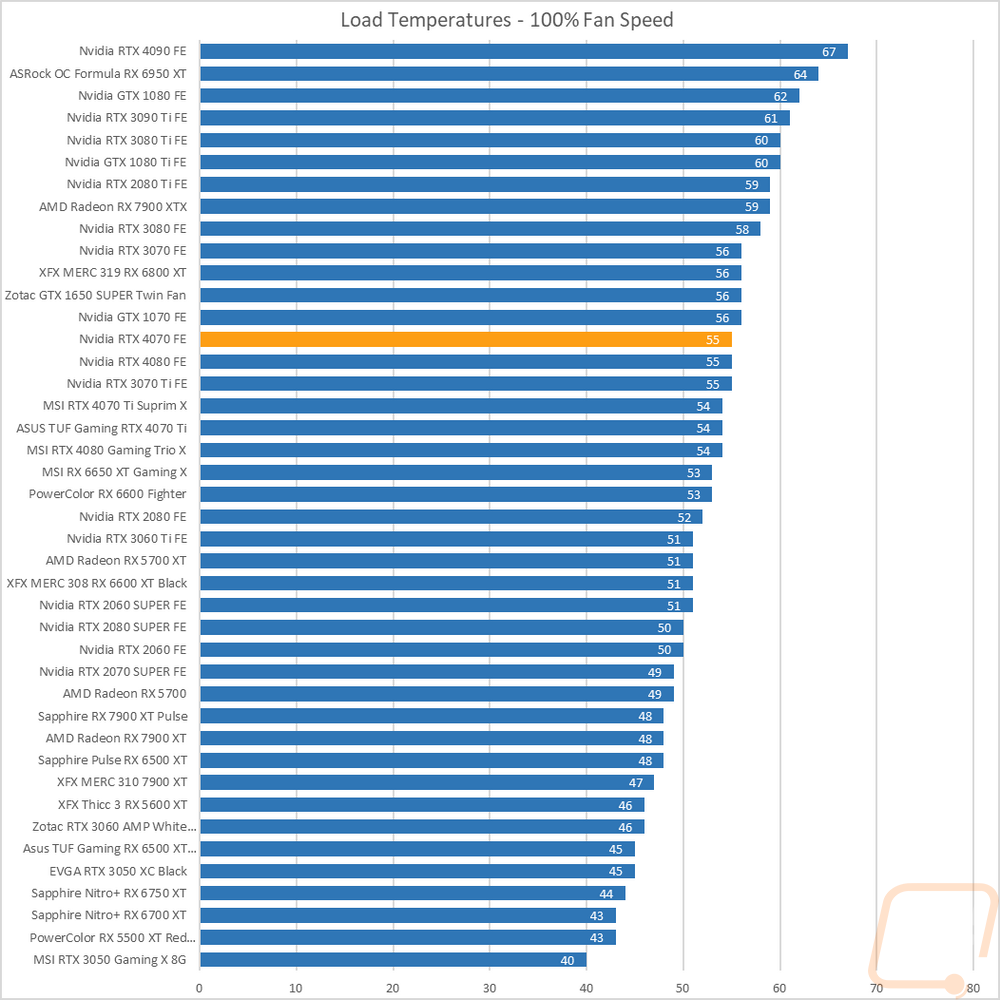
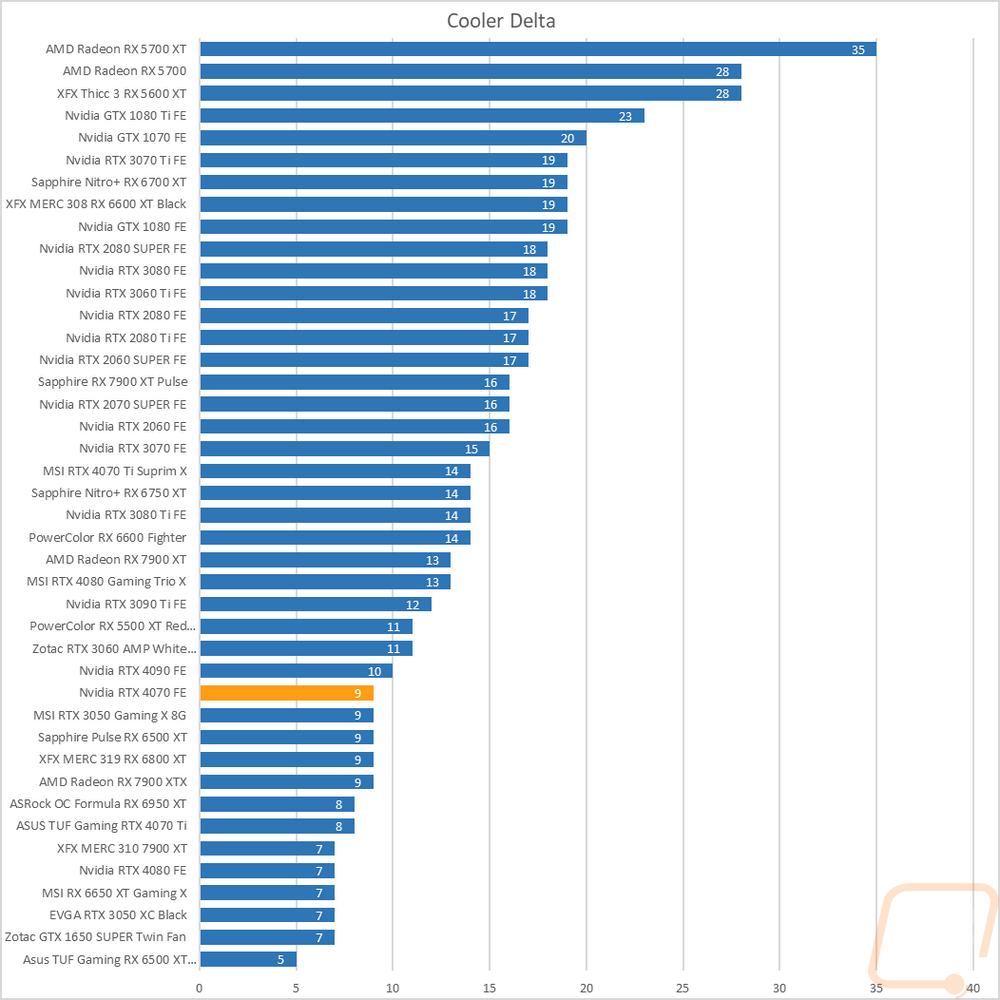
To finish up my testing I of course had to check out the cooling performance. To do this I ran two different tests. I used AIDA64’s Stress Test run for a half-hour each to warm things up. Then I documented what temperature the GPU leveled out at with the stock fan profile and then again with the fans cranked up to 100%. With the stock profile, the RTX 4070 Founders Edition peaked at 64 degrees which was in the bottom 1/3 of the chart. Given its lower TDP, this isn’t too big of a surprise but with the more compact cooler design used for this card, I was worried it wouldn’t be the case. Then with the fans cranked up, the 4070 Founders Edition dropped down to 55 degrees for a delta between the two of 9 degrees. This wasn’t as great and is farther up in the chart with a lot of the aftermarket cards having a lot more headroom. Overall though it looks like Nvidia got their fan profile spot on with it running quiet and cool and not leaving too much headroom left but if you needed to overclock to get a touch more performance there is still room.
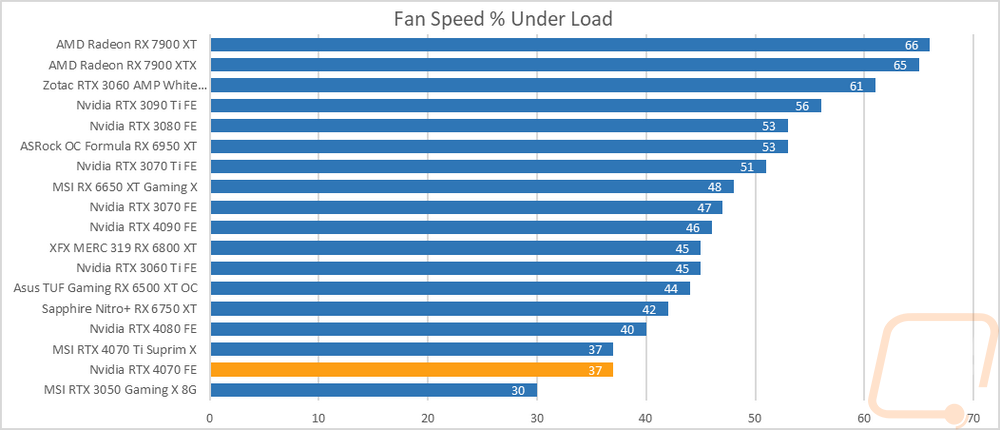
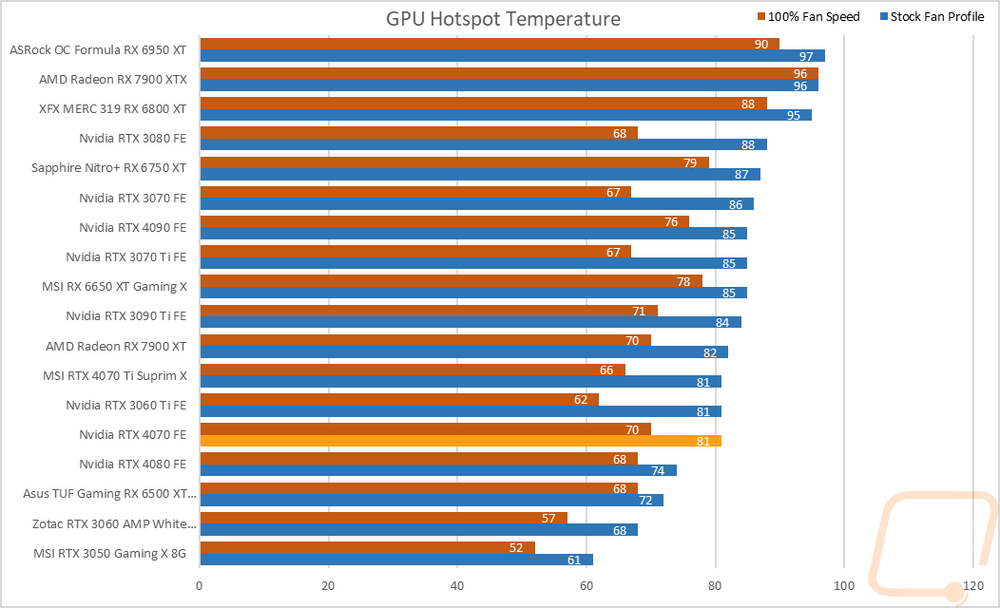
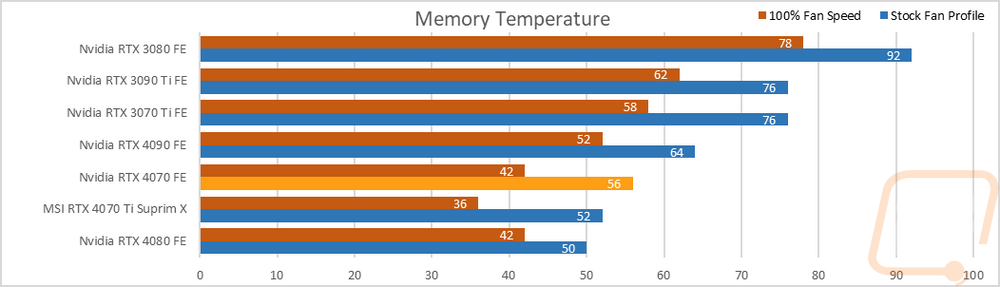
While testing I did also include a few other results while doing the same AIDA64 workload with the stock fan profile and 100% fan speed. To start off I noted where the fan speeds were running when the temperatures leveled off in the stock fan profile test and for the RTX 4070 Founders Edition, the two fans were running at 37% fan speed to keep things running that cool. This is why the noise levels were so good as well with just one card running lower than that. I also noted the GPU Hotspot temperatures and the memory temperatures. The memory temperatures only apply to the cards that have that sensor which as of right now are just the highest-end 3000 Series Nvidia cards and all of the 4000 Series Nvidia cards to date. The 4070 Founders Edition had its GPU hotspot at 81c with the stock fan profile which was down near the bottom of the chart, with the fans at 100% it didn’t drop as much as some of the others running at 70c. Then for the memory, the stock fan profile had the memory running at 56c and cranking the fans up was 42c, again both near the bottom of the chart.
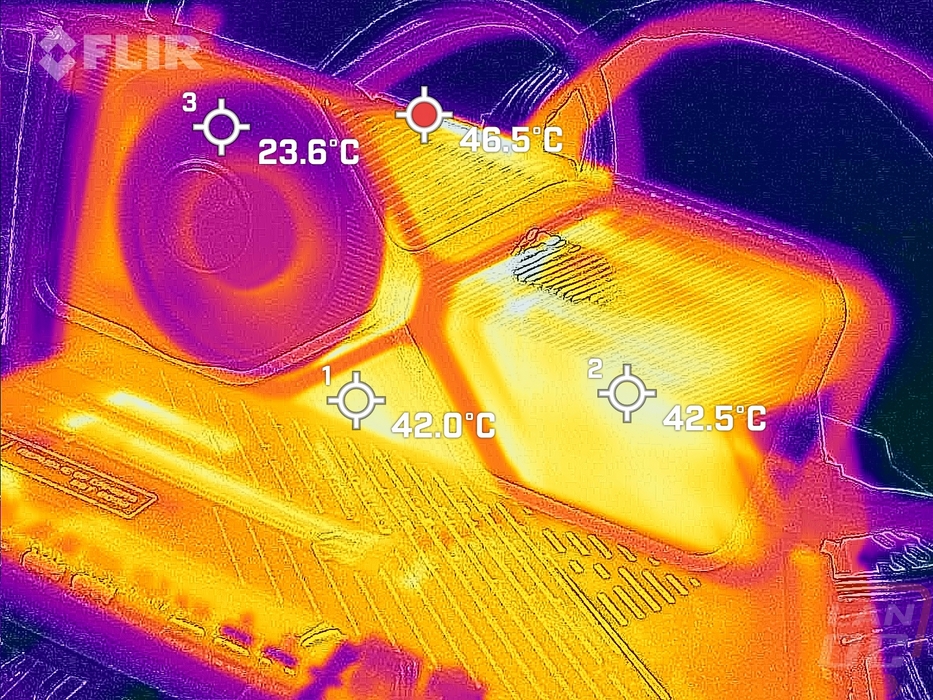
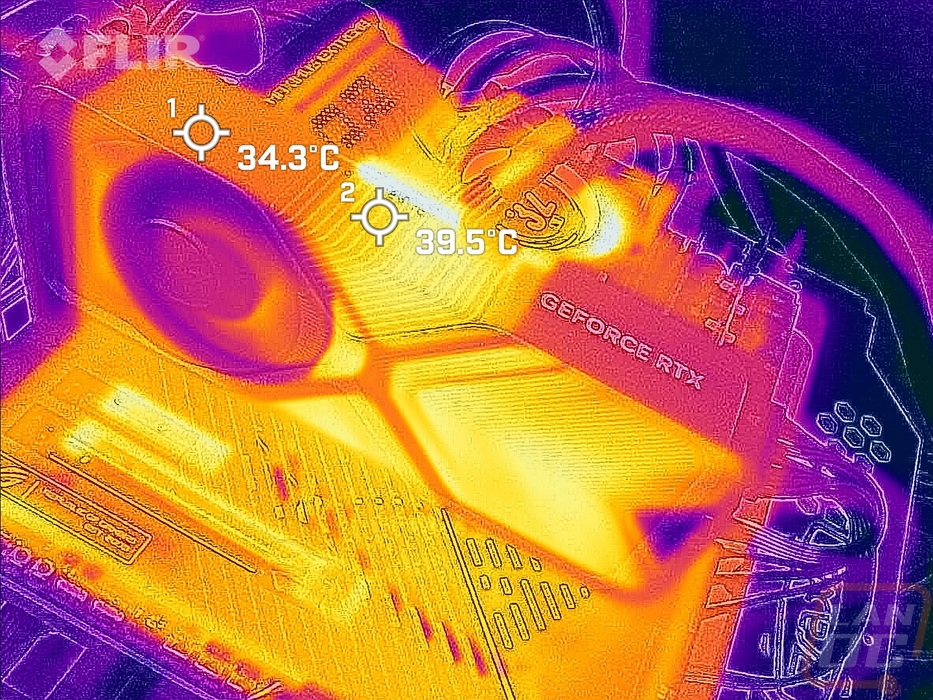
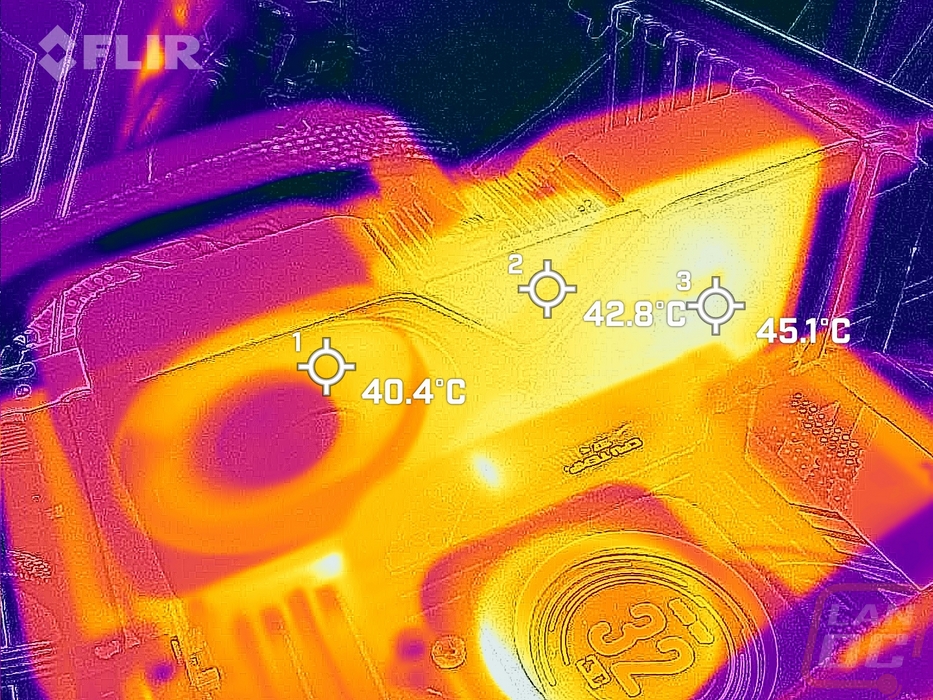
While running the stock fan profile testing I also took the time to get a few thermal images so we could see what is going on. The front side of the RTX 4070 Founders Edition is hottest up at the top edge but is also surprisingly warm on the exposed heatsink on the right side of the card where the blow-through fan is on the backside. Under the front fan, things are cool, however. The top edge has the most heat up against the PCB but even then nothing on the Founders Edition is running too hot. The metal backplate seems to be going a good job of transferring heat as well with this side warmer than the heatsink side of the card all across the backplate and the blow-through fan has the heatsink behind it warmer as well which we also saw when looking at the front.