In-Game Benchmarks
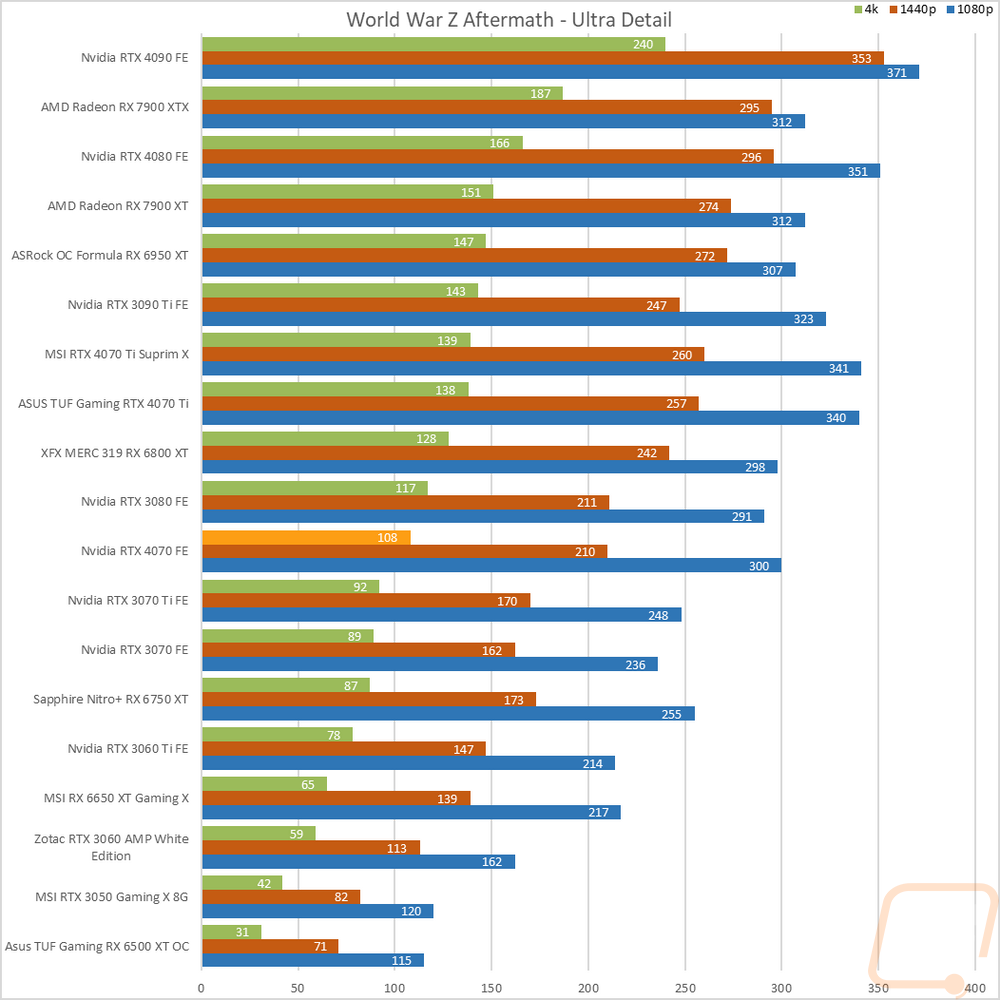
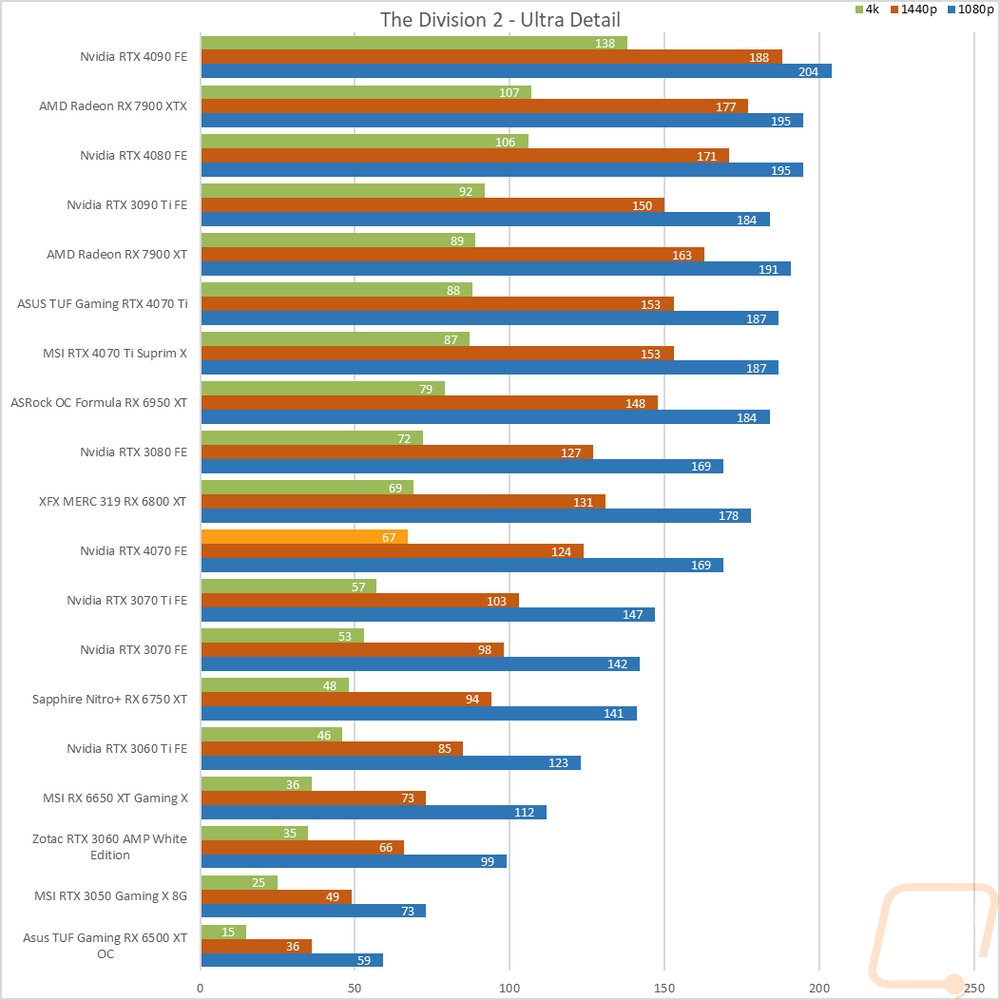
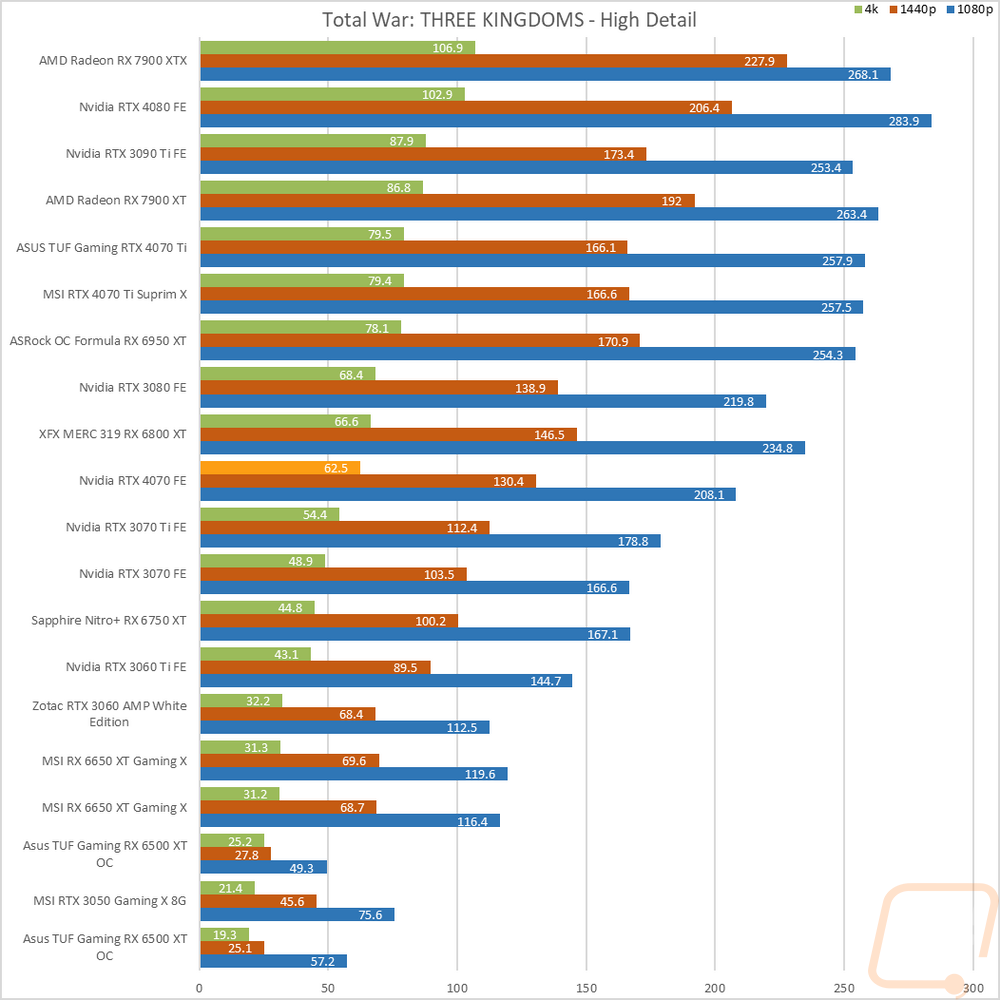
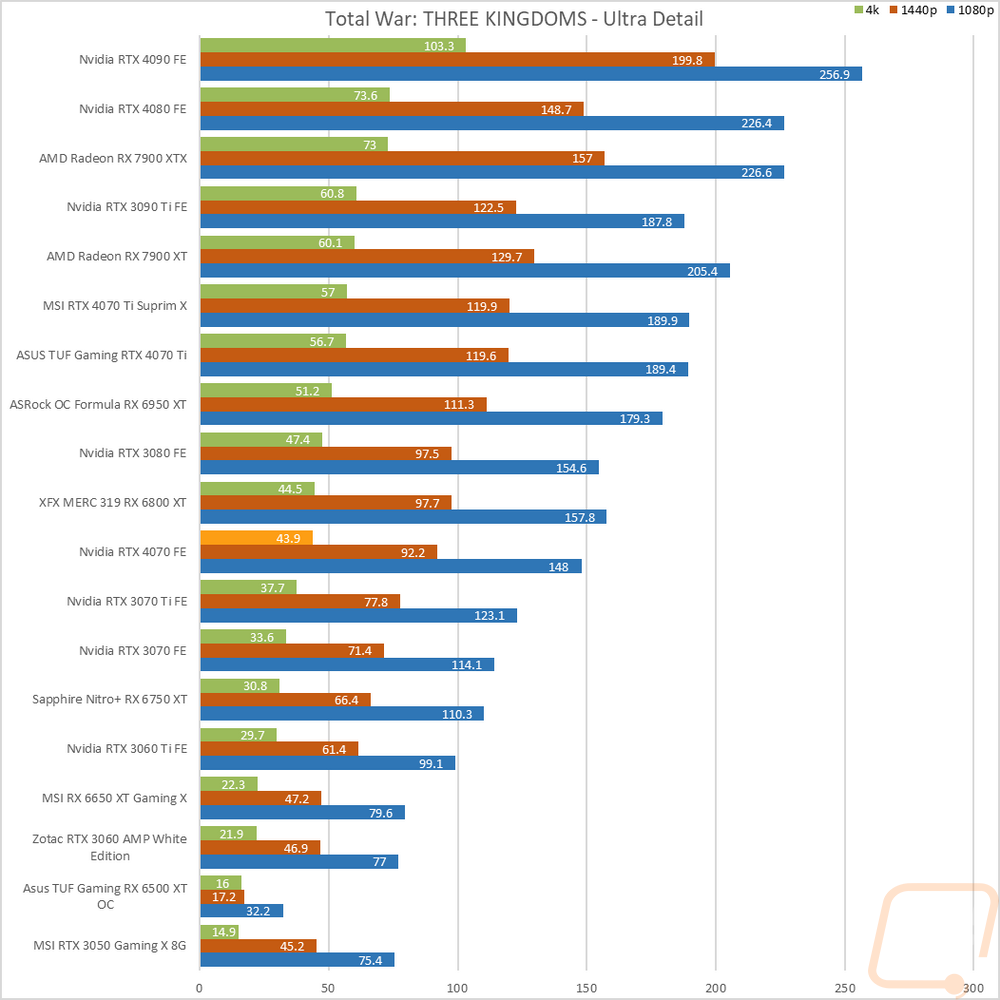
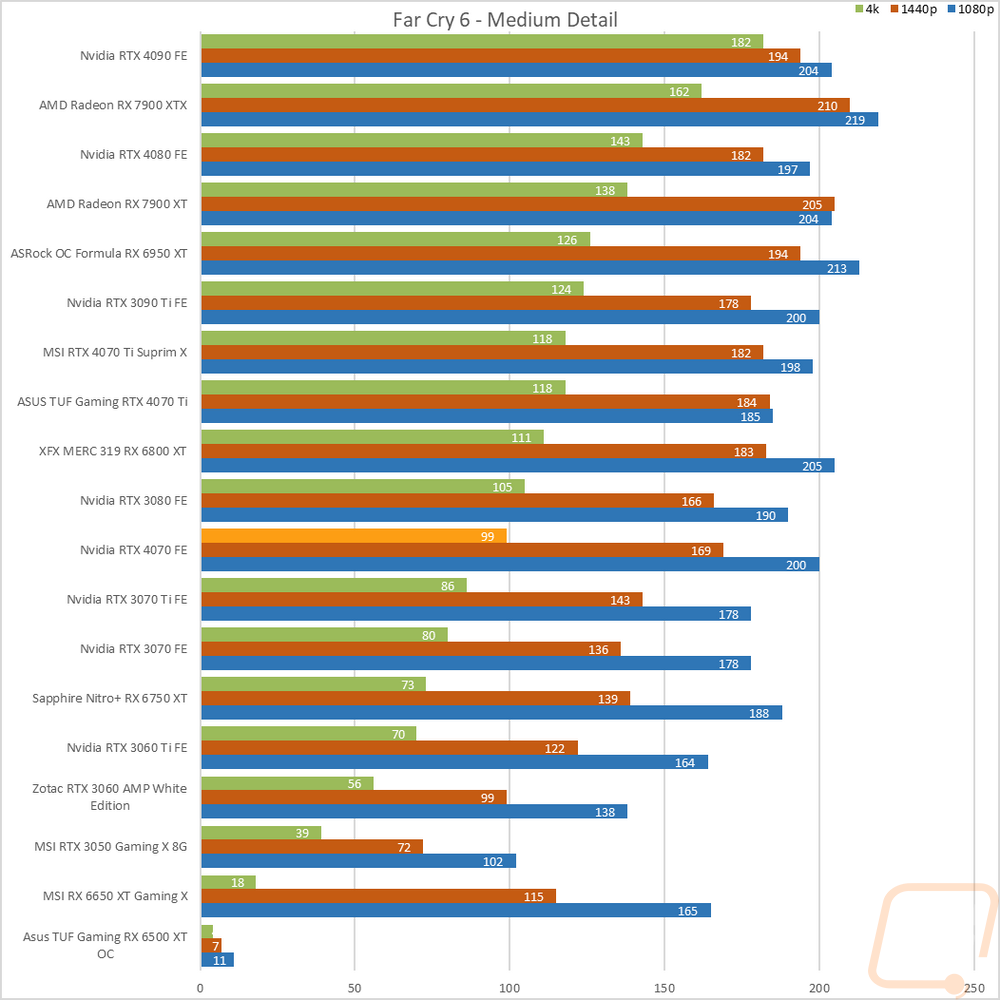
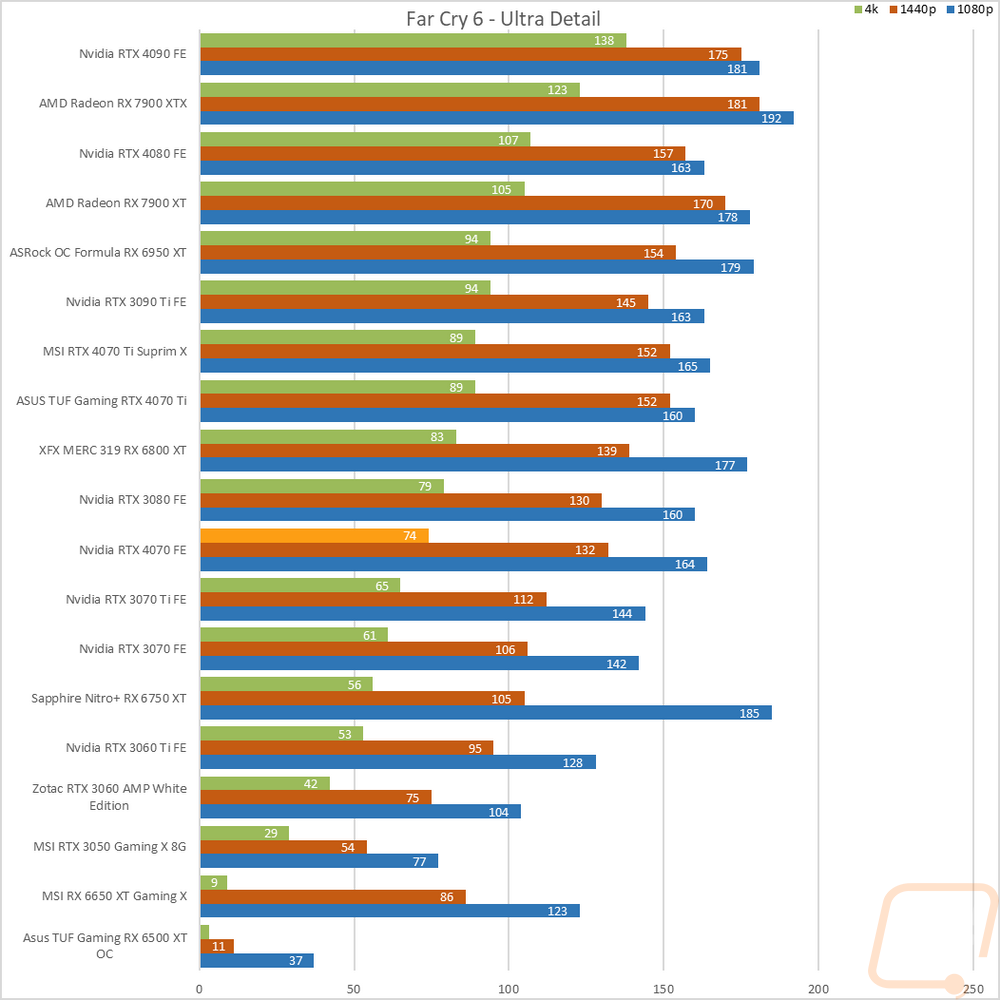
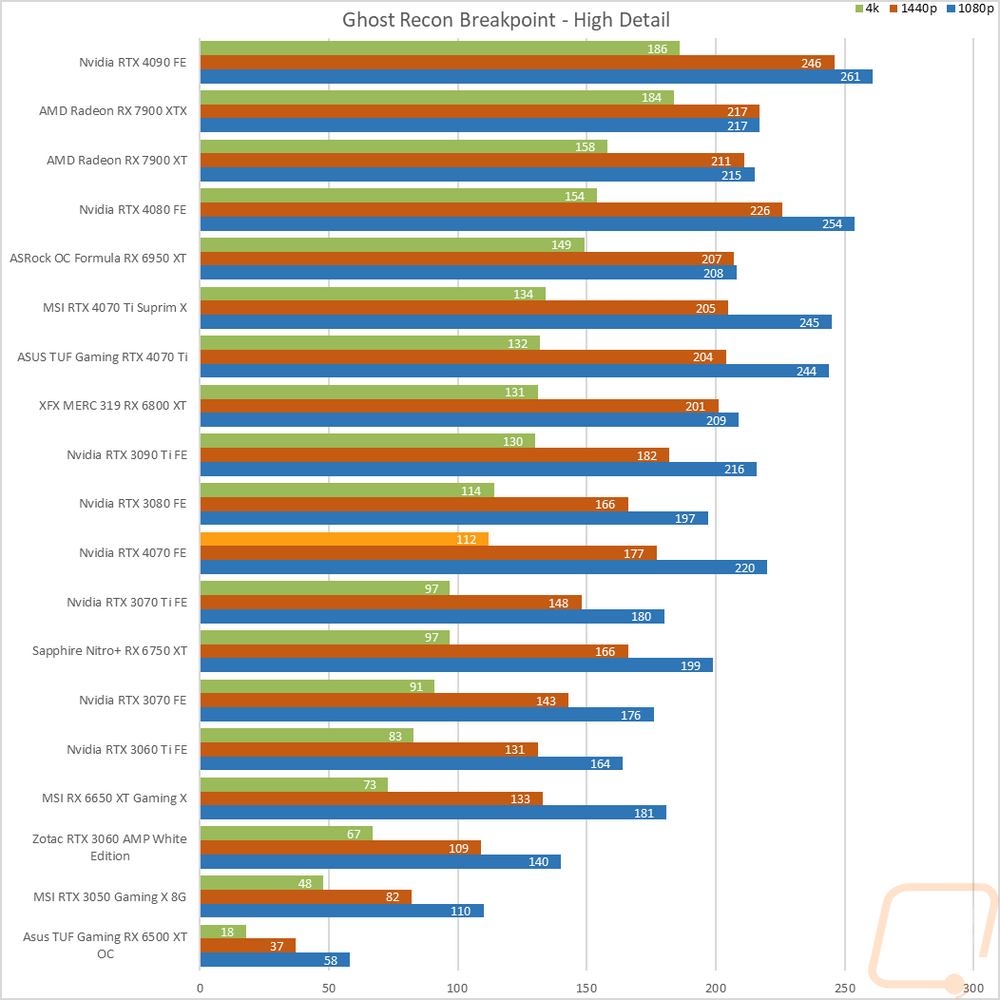
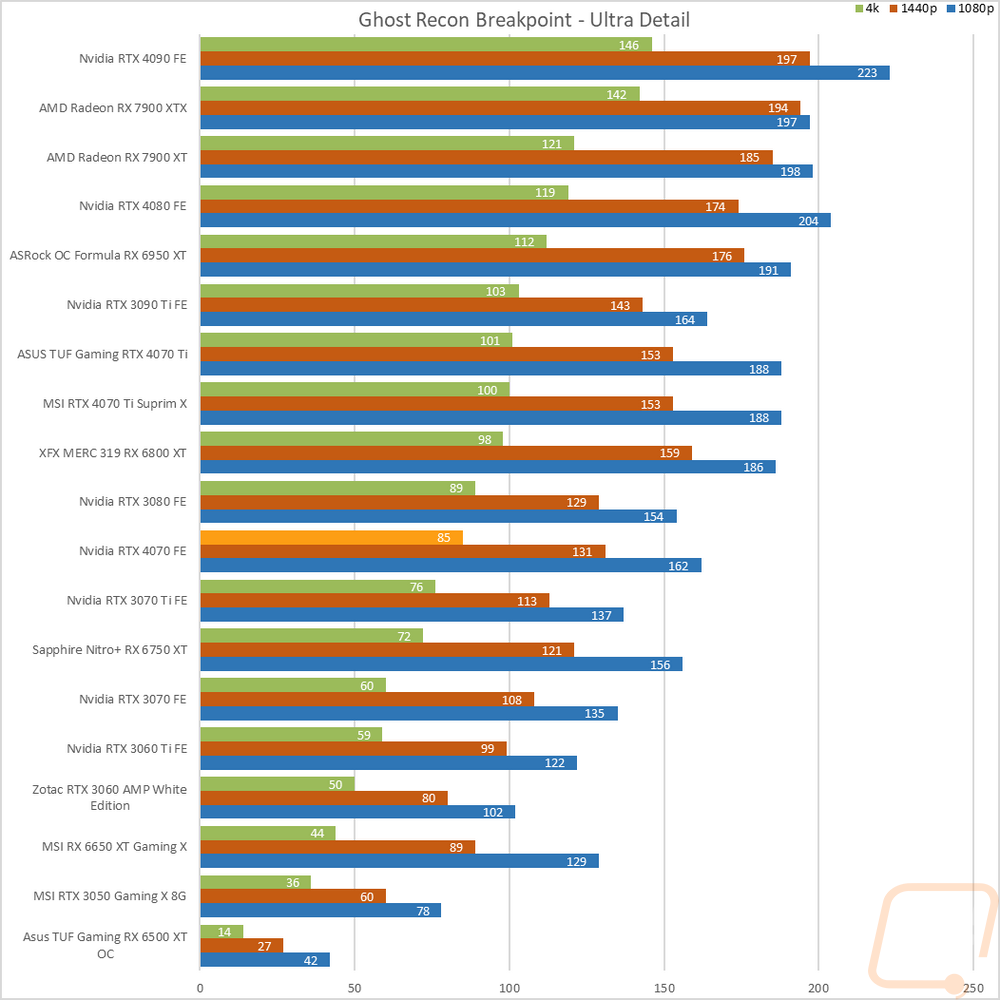
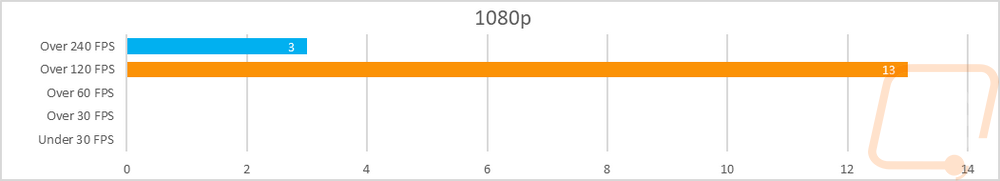
Now we finally get into the in game performance and that is the main reason people pick up a new video card. To test things out I ran through our new benchmark suite that tests 10 games at three different resolutions (1080p, 1440p, and 4k). Most of the games tested have been run at the highest detail setting and a mid-range detail setting to get a look at how turning things up hurts performance and to give an idea of if turning detail down from max will be beneficial for frame rates. In total, each video card is tested 54 times and that makes for a huge mess of results when you put them all together. To help with that I like to start with these overall playability graphs that take all of the results and give an easier-to-read result. I have one for each of the three resolutions and each is broken up into four FPS ranges. Under 30 FPS is considered unplayable, over 30 is playable but not ideal, over 60 is the sweet spot, and then over 120 FPS is for high refresh rate monitors.
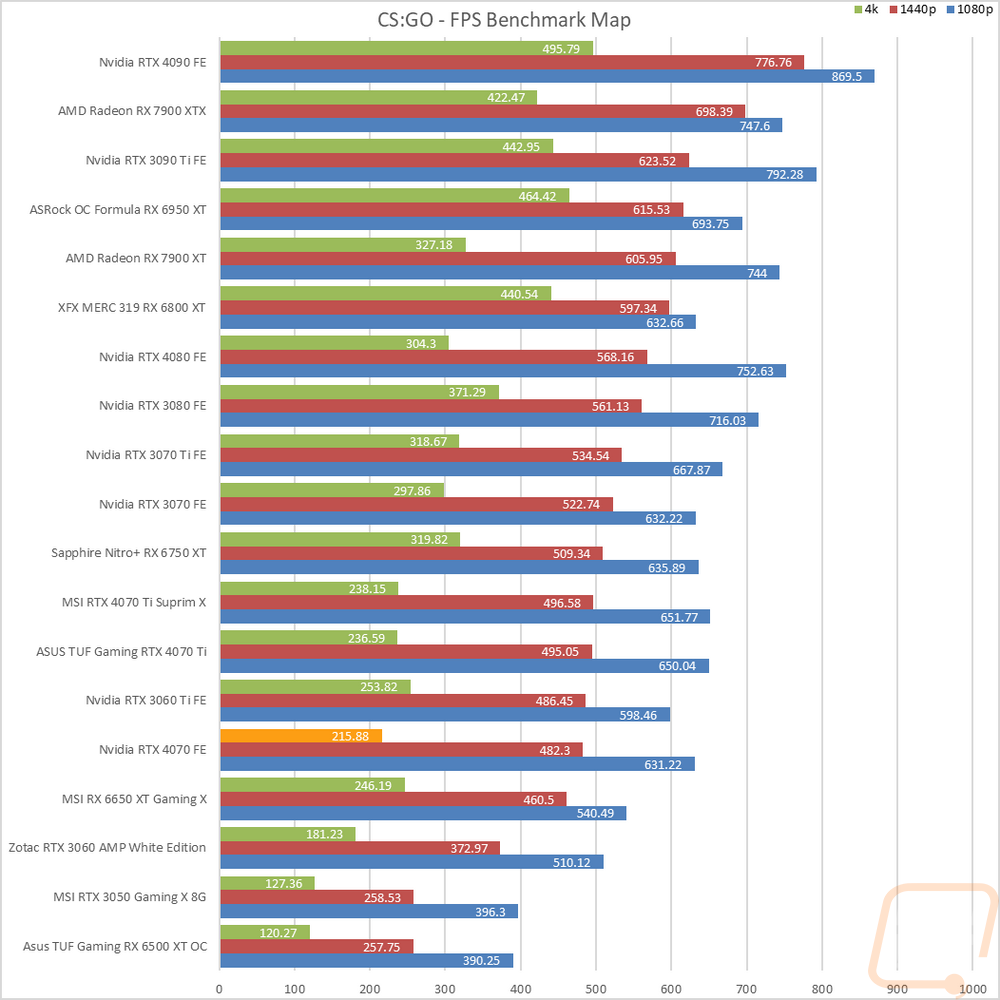
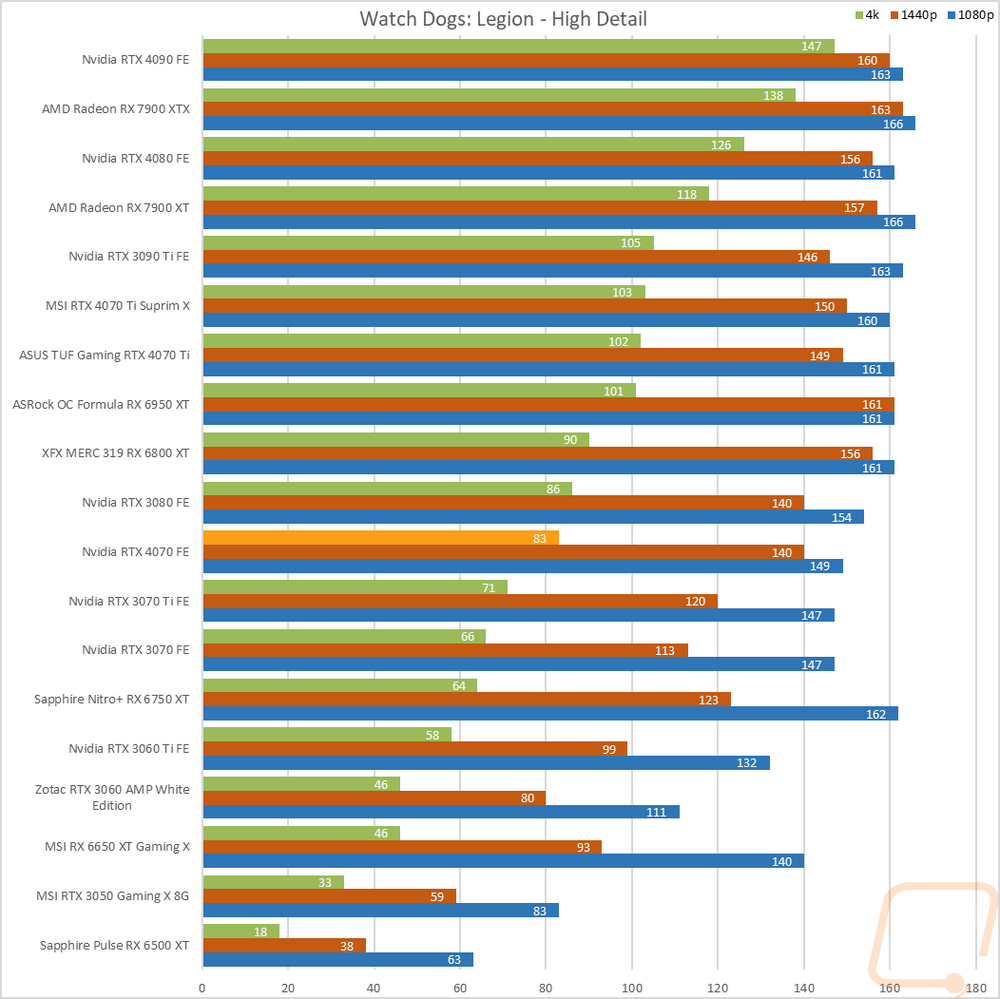
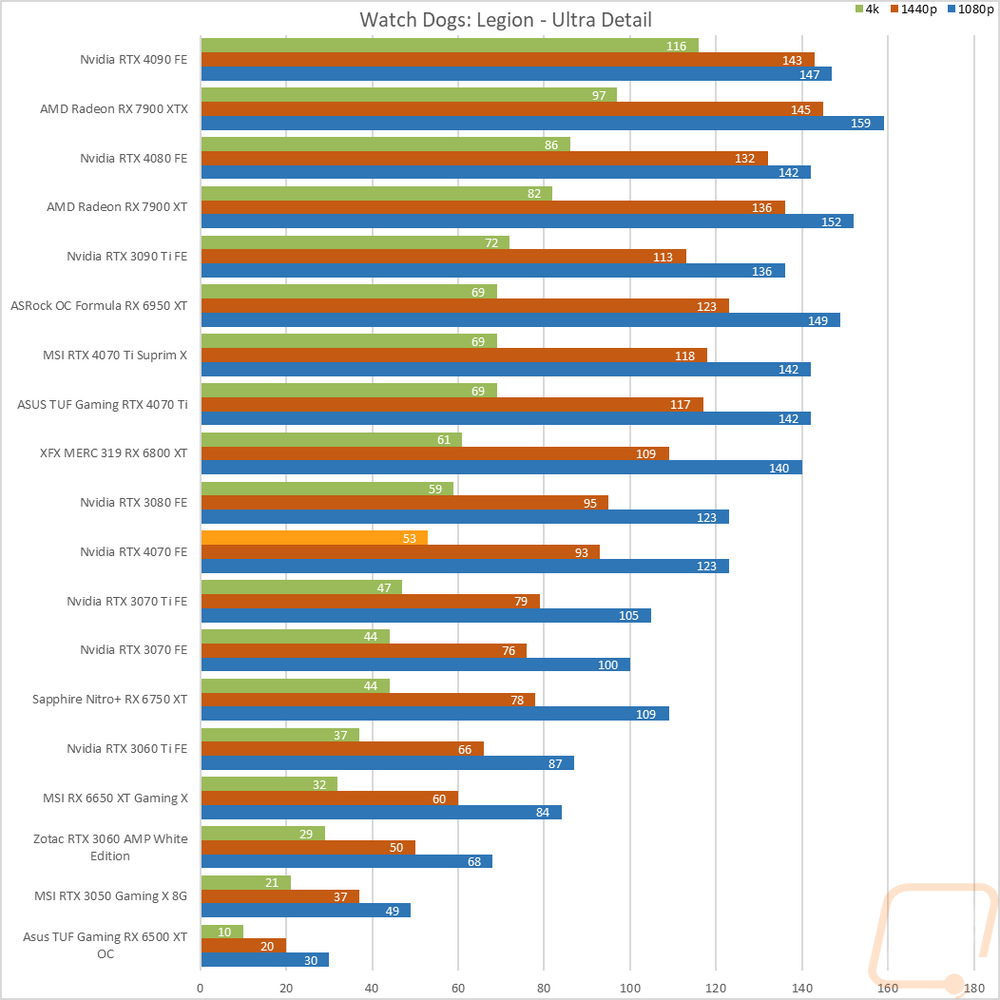
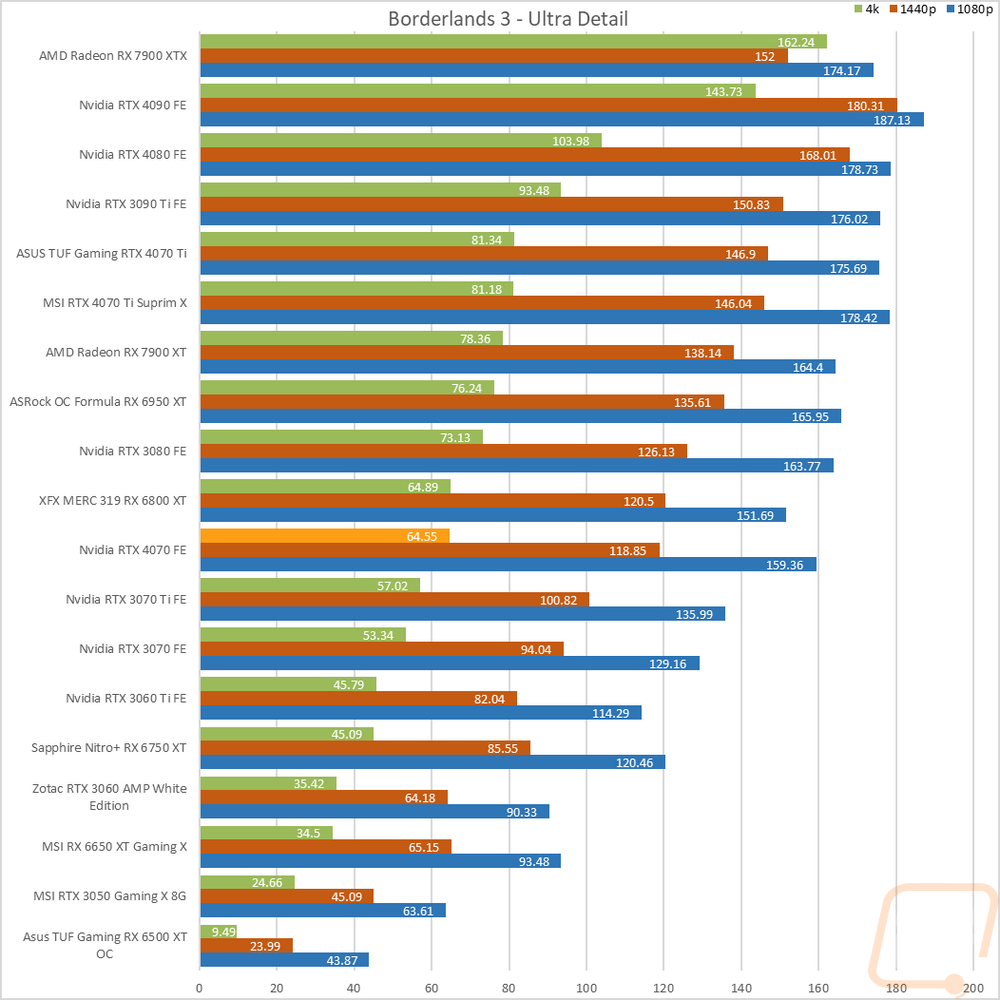
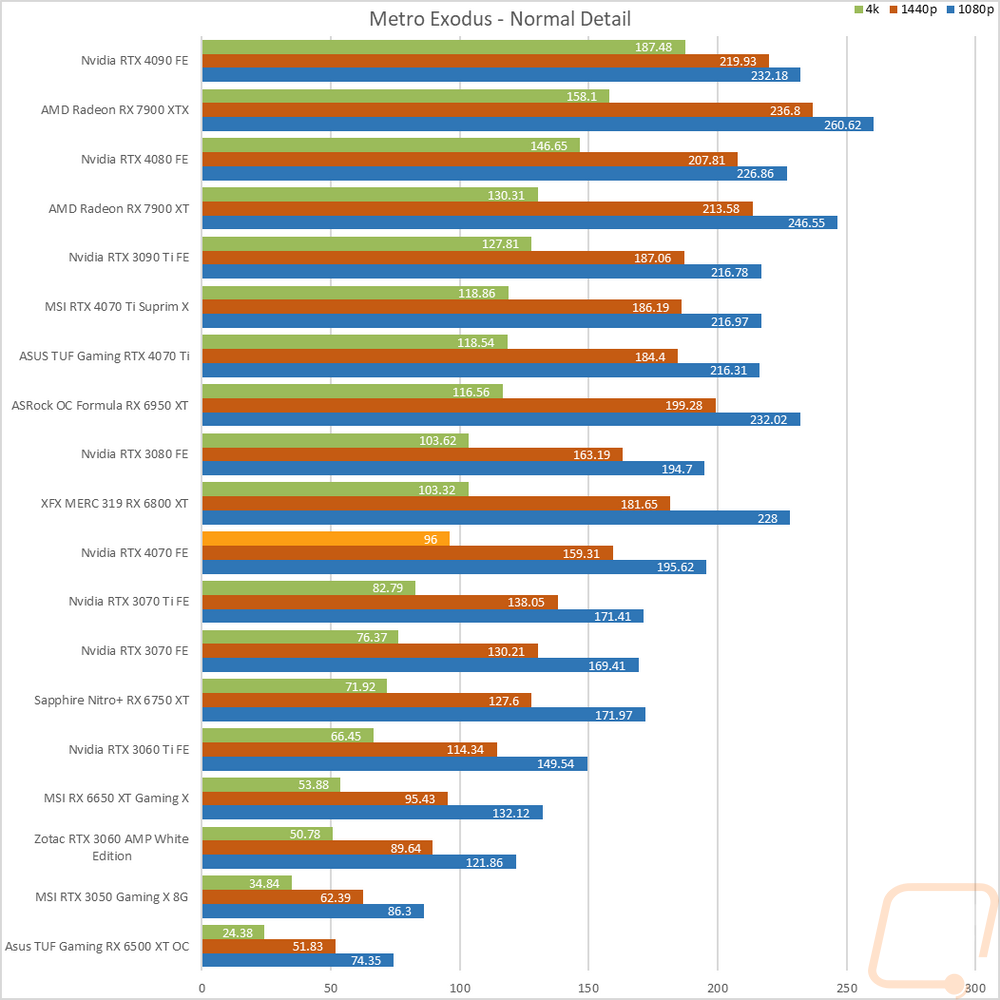
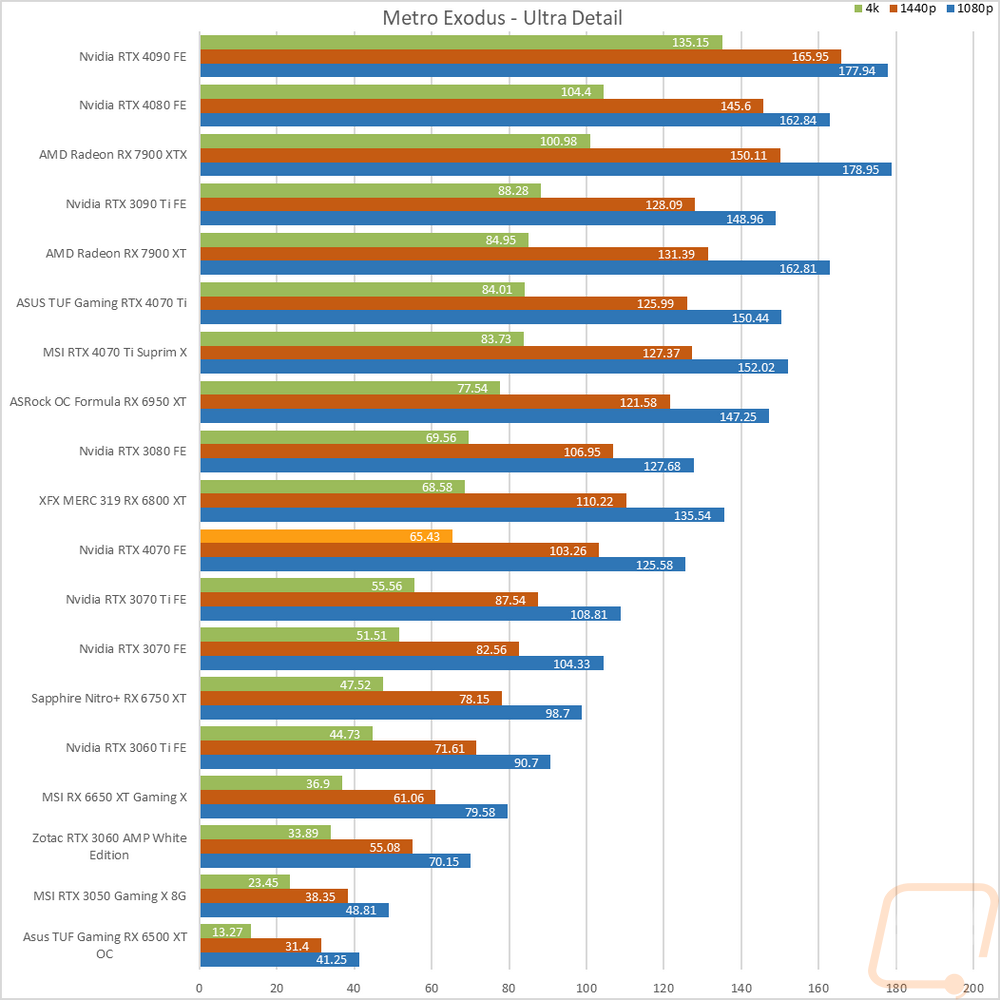
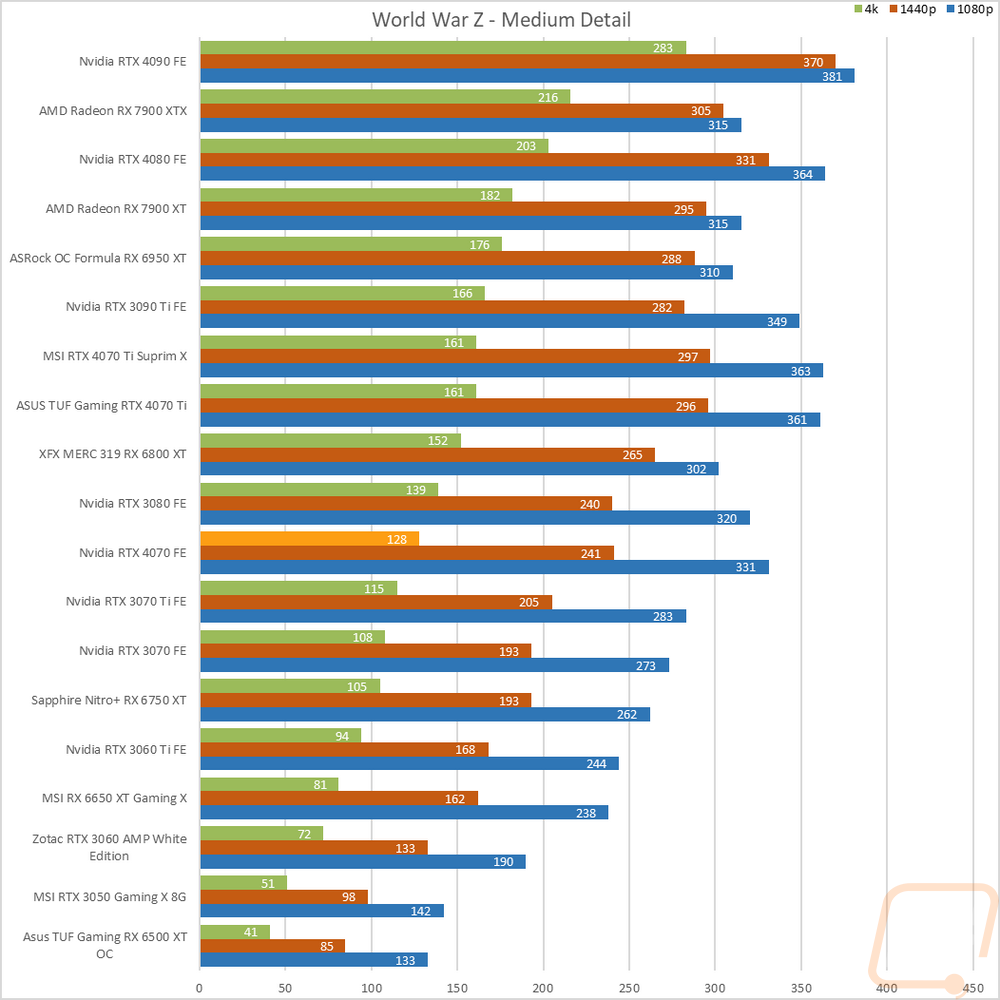
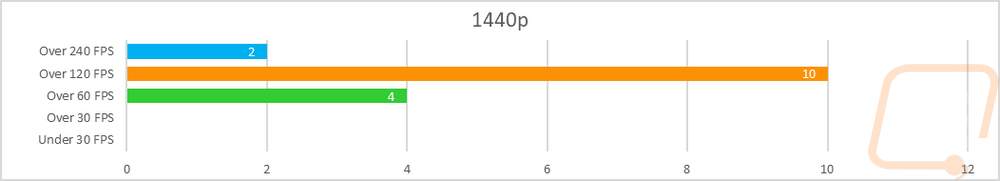
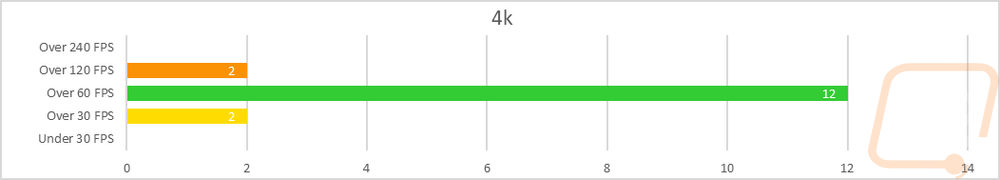
So how did the RTX 4070 Founders Edition do overall? Well at 1080p all of the results are over 12 FPS with three reaching up over 240 FPS as well. At 1440p everything is playable as well only this time four of the results are in the 60-119 FPS range. There are two still up over 240 FPS but a majority of the results, 10 in total, were in the 120-239 FPS range. Performance falls off a lot more at 4K which isn’t a big surprise, the 4070 has two games over 120 FPS. There are two under 60 FPS and then the majority, 12 in total, were in the green 60 FPS to 119 FPS range. Overall nearly everything thrown at the 4070 ended up being playable, but 1080p and 1440p is where the 4070 will work best.
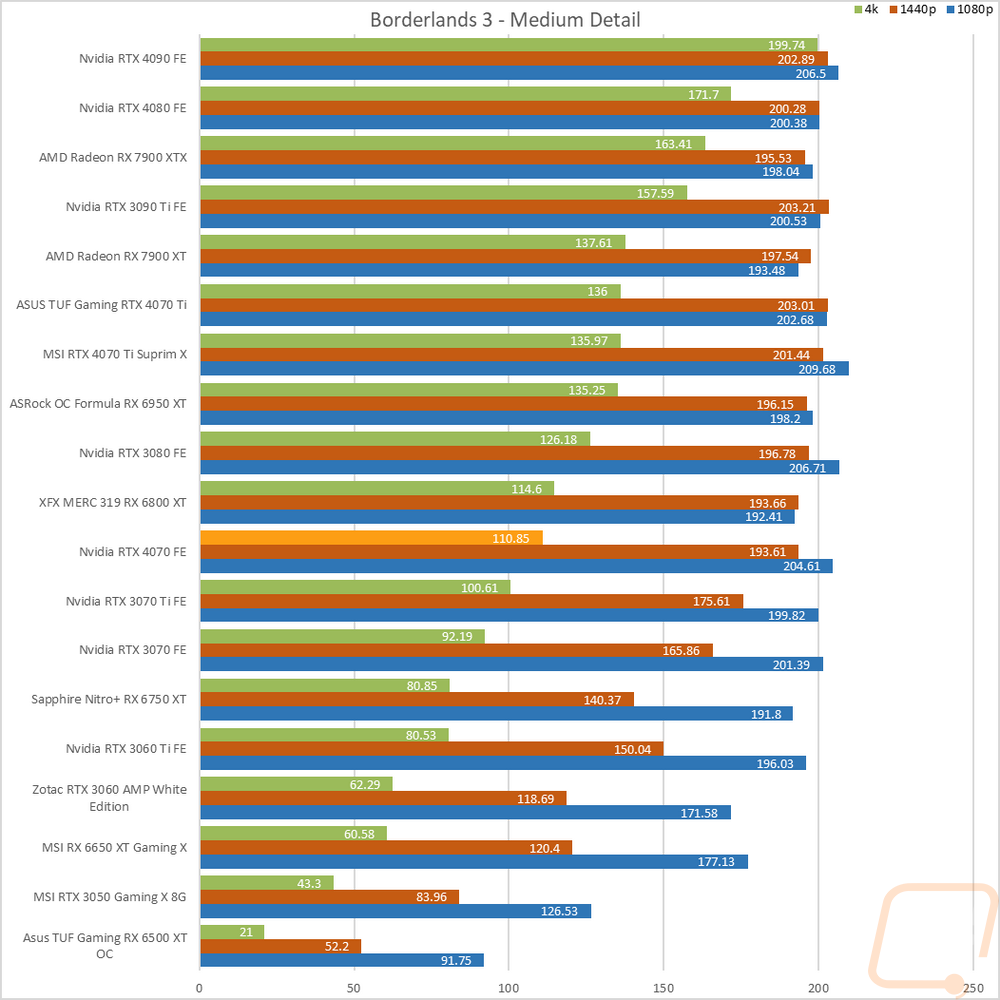
I averaged out the results from each of the three resolutions to get a look at the RTX 4070 compared to a few of the cards around in model number-wise and price-wise. I did remove CS:GO from the averages because of just how much the crazy high numbers can change the overall averages and I wanted to better show what you can expect in performance from a mix of medium/high/ultra detail benchmarks. The results are sorted by 1080p but switching that to 1440p or 4k would flip the 4070 and the 3080 around but they are very close in performance at 1080p and 1440p but the 3080 does pull away at 4K. Our game test suite doesn’t include any ray tracing or DLSS testing which as we saw in the synthetic tests is where Nvidia is able to pull away from AMD. So these are just pure raster performance and both the 6800 XT and 6950 XT did better, especially at 1440p and 4K. Digging into the individual graphs show the same thing as well and there weren’t any standouts other than that even with the 4070 we still see games being CPU limited at 1080p and sometimes 1440p like in Borderlands 3 with the medium detail. That’s even with all of our results being tested in an upgraded 13900K CPU and the latest drivers from AMD and Nvidia.
|
Average FPS (w/o CS:GO) |
1080p |
1440p |
4K |
|
RTX 3070 TI |
165.78 |
126.73 |
74.2 |
|
RTX 3080 |
188.35 |
148.9 |
89.9 |
|
RTX 4070 |
190.62 |
148.64 |
83.48 |
|
6800 XT |
197.08 |
162.35 |
92.37 |
|
6950 XT |
205.27 |
177.19 |
105.8 |
|
4070 Ti |
212.87 |
174.42 |
103.72 |