I know at least for my wife and myself, when shopping for our PC upgrades the highest-end cards are typically out of our budget and frankly that is fine because with our monitors we are also not normally gaming at 4k where those cards are needed. That’s why when new generations of cards start getting down into the middle of the product stack things start to get exciting and with tomorrow's launch of the Nvidia RTX 4070 we are starting to get into that range. So today I’m excited to check out the RTX 4070 Founders Edition to see how Nvidia’s new GPU performs. Before doing that I will dig into the specs to see what it has going on and then take a closer look at the card itself. So let’s dive in!
Product Name: Nvidia RTX 4070 Founders Edition
Review Sample Provided by: Nvidia
Written by: Wes Compton
Amazon Affiliate Link: HERE
RTX 4070 Details
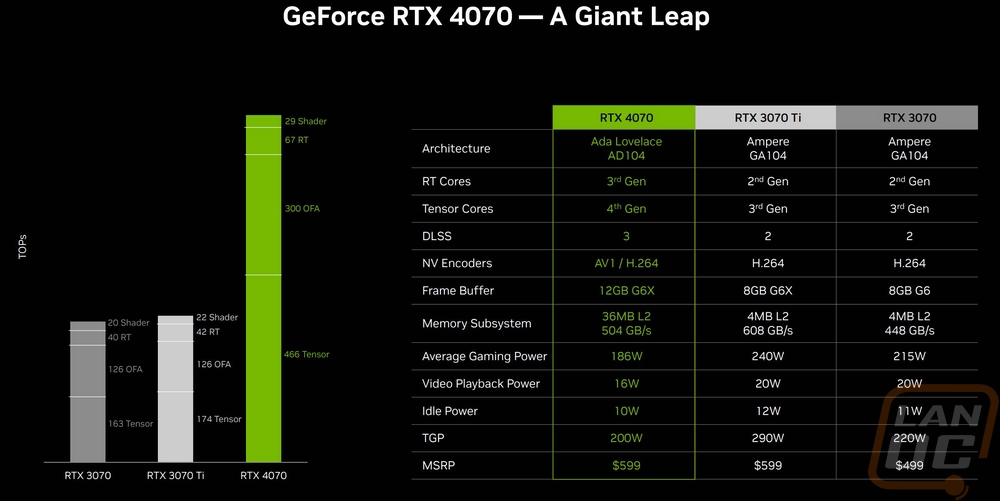
The Nvidia RTX 4070 is the next addition to their 4000 Series of cards and like the others, it is based on the same Ada Lovelace architecture. This means that it does have the same full support for DLSS 3 and the other changes that the other cards have like the new fourth-generation tensor AI-focused cores, third-generation ray tracing cores, and the AV1 encoders which will be huge for streamers and also a way to lower streaming bandwidth while improving quality. The 4070 sits below the 4070 Ti in the lineup but is based on the same AD104 GPU as the 4070 Ti and 4080 which is built on the 4N custom process by TSMC. The RTX 4070 may use the same AD104 GPU but Nvidia has cut it down slightly with 4 GPCs or graphics processing clusters to the 4070 Ti’s 5. Translates to 23 TPCs or texture processing clusters and 46 streaming multiprocessors. For CUDA cores the RTX 4070 has 5888 down from the 7680 of the 4070 Ti which is a 23% drop. The tensor core count is 184, the ray tracing core count is 46, and the texture units are 184 as well which are all a 30% drop from the 240/60/240 on the RTX 4070 Ti. The RTX 4070 also has a lower boost clock with it running at 2475 MHz to 2610 MHz but the memory is clocked the same and has the same 21 Gbps data rate. They also have the same 12 GB of GDDR6X which is notably an improvement over the last generations RTX 3070 which has 8GB but the memory interface for the 4070 is 192-bit which is a downgrade but does match the 4070 Ti. The cut down GPU and lower clock speeds did help with the overall TDP though which is now 200 watts compared to the 285 watts on the RTX 4070 Ti.
|
|
RTX 3070 |
RTX 4070 |
RTX 4070 Ti |
|
Graphics Processing Clusters |
6 |
4 |
5 |
|
Texture Processing Clusters |
23 |
23 |
30 |
|
Streaming Multiprocessors |
46 |
46 |
60 |
|
CUDA Cores |
5888 |
5888 |
7680 |
|
Tensor Cores |
184 (3rd Gen) |
184 (4th Gen) |
240 (4th Gen) |
|
RT Cores |
46 (2nd Gen) |
46 (3rd Gen) |
60 (3rd Gen) |
|
Texture Units |
184 |
184 |
240 |
|
ROPs |
96 |
64 |
80 |
|
Boost Clock |
1725 MHz |
2475 MHz |
2610 MHz |
|
Memory Clock |
1750 MHz |
1313 MHz |
1313 MHz |
|
Memory Data Rate |
14 Gbps |
21 Gbps |
21 Gbps |
|
L2 Cache Size |
4MB |
36 MB |
49 MB |
|
Total Video Memory |
8 GB GDDR6X |
12 GB GDDR6X |
12 GB GDDR6X |
|
Memory Interface |
256-bit |
192-bit |
192-bit |
|
Total Memory Bandwidth |
448.0 GB/sec |
504 GB/sec |
504 GB/sec |
|
Texture Rate (Bilinear) |
317.4 Gigatexels/sec |
455.4 Gigatexels/sec |
626 Gigatexels/sec |
|
Fabrication Process |
Samsung 8 nm 8N NVIDIA Custom Process |
TSMC 4N NVIDIA Custom Process |
TSMC 4N NVIDIA Custom Process |
|
Transistor Count |
17.4 Billion |
35.8 billion |
35.8 billion |
|
Connectors |
3 x DisplayPort 1 x HDMI |
3 x DisplayPort 1 x HDMI |
3 x DisplayPort 1 x HDMI |
|
Power Connectors |
1x12 pin (Dongle to 1x 8-Pin) |
2x PCIe 8-pin cables OR 300w or greater PCIe Gen 5 cable |
2x PCIe 8-pin cables OR 300w or greater PCIe Gen 5 cable |
|
Minimum Power Supply |
650 Watts |
650 Watts |
700 Watts |
|
Total Graphics Power (TGP) |
220 Watts |
200 Watts |
285 Watts |
|
Maximum GPU Temperature |
93° C |
90° C |
90° C |
|
PCI Express Interface |
Gen 4 |
Gen 4 |
Gen 4 |
|
Launch MSRP |
$499 |
$599 |
$799 |
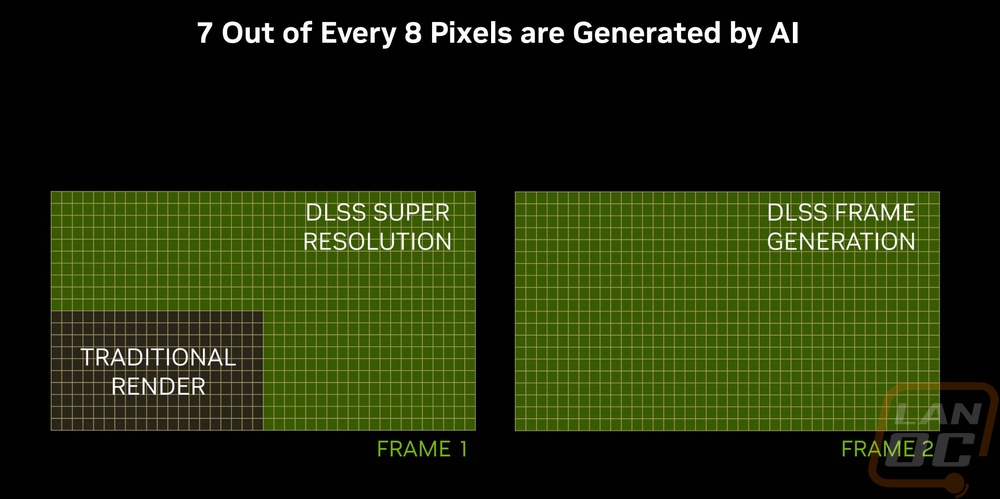
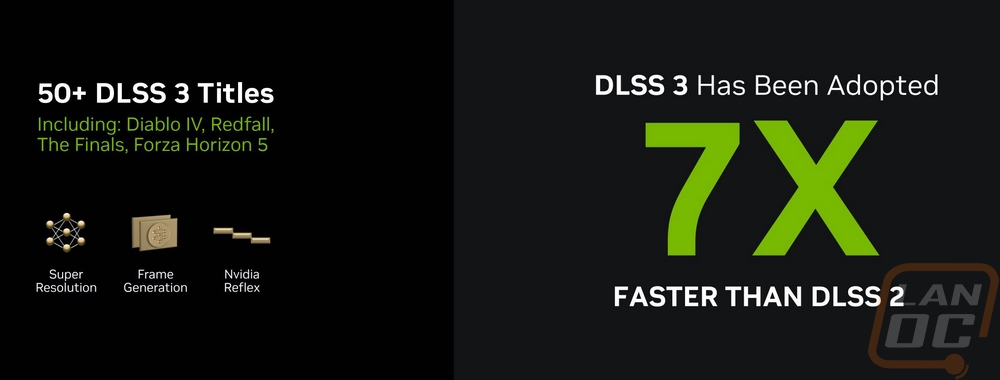
With the RTX 4070 having support for DLSS 3 it supports DLSS Frame Generation which I’ve tested in the past and has been a huge performance improvement, especially in games that are CPU limited. The combination of DLSS Super Resolution and frame generation mean that when both are on the card renders 1 out of 8 pixels with traditional rendering. Super Resolution scales that up and then frame generation can use AI to render an entire frame in between the traditional frames. This is also why they can improve performance even when CPU-limited. DLSS 3 is being adopted quicker than DLSS 2 at a rate of 7 times faster according to Nvidia. They do have a good list of titles going and they finally have one website put together that shows you all of the games that support ray tracing, DLSS 3, DLSS 2, and AI processing which makes it easier to see if the games you want to play are included, here is a link.
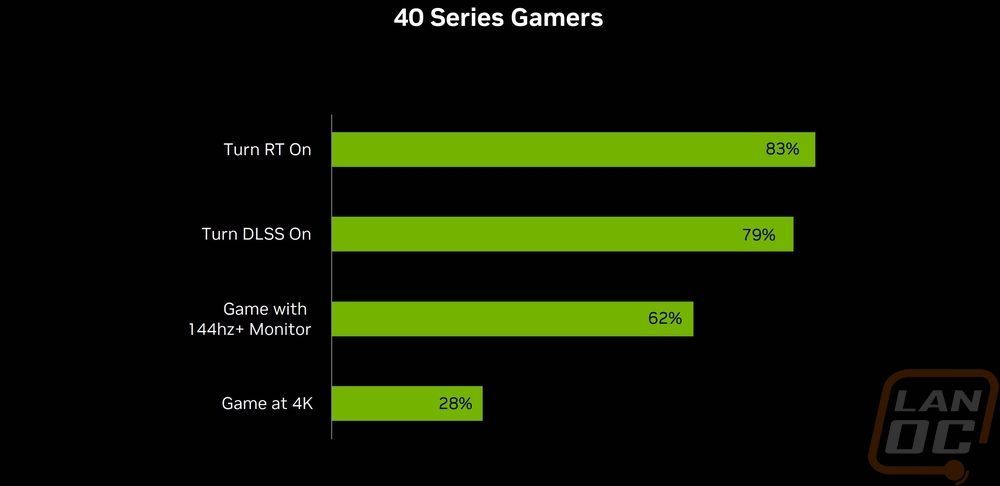
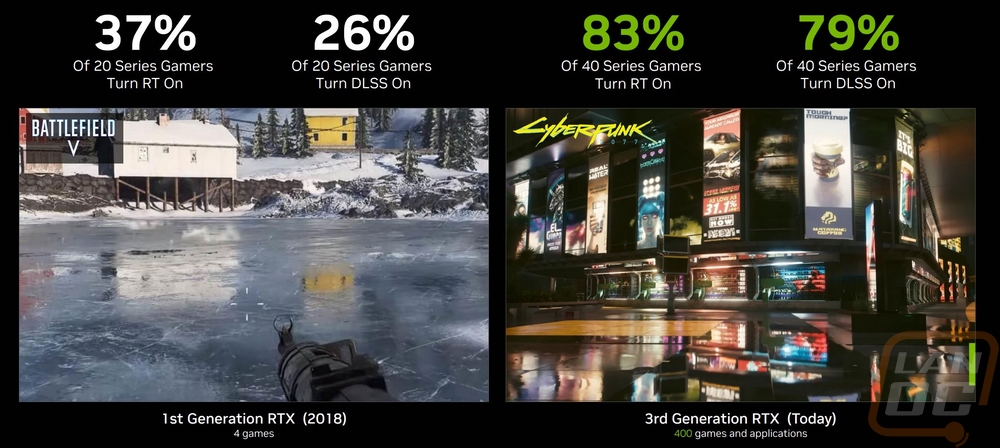
On the call about the 4070 Nvidia also showed some of the numbers that they are seeing as far as ray tracing and DLSS use for 4000 series card owners as well as percentages of people who have 144hz or higher monitors and people who are gaming at 4k. At 83% that is a big portion of the people who are buying 4000 series cards who are using it and DLSS was a little lower but not far at 79%. They also compared the same numbers with 2000 Series owners which was the first generation with RTX support and those numbers are significantly lower. It makes sense though, with the original 2000 Series only the highest ends cards were able to handle RTX and DLSS has improved a lot. Having DLSS 3 on the new cards helps open up ray tracing performance in situations where you might otherwise skip it for the performance.
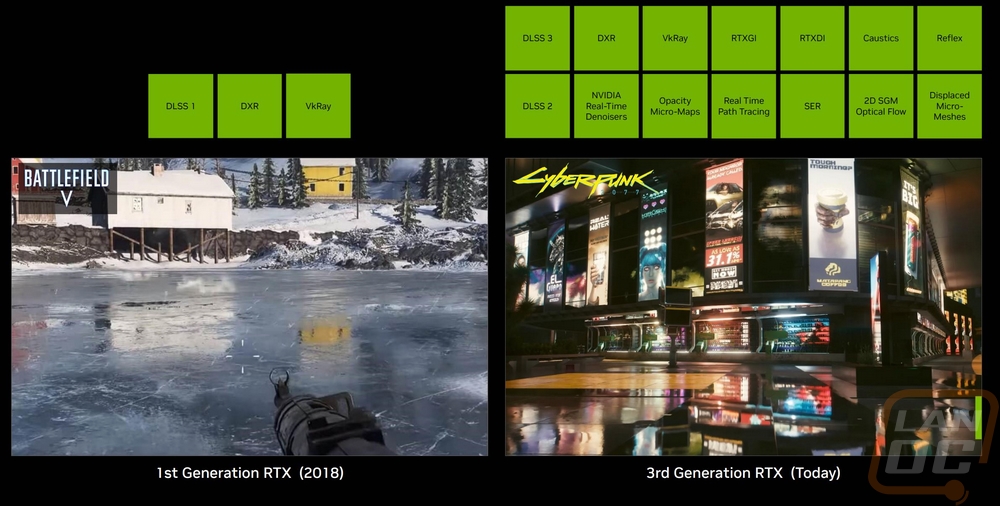
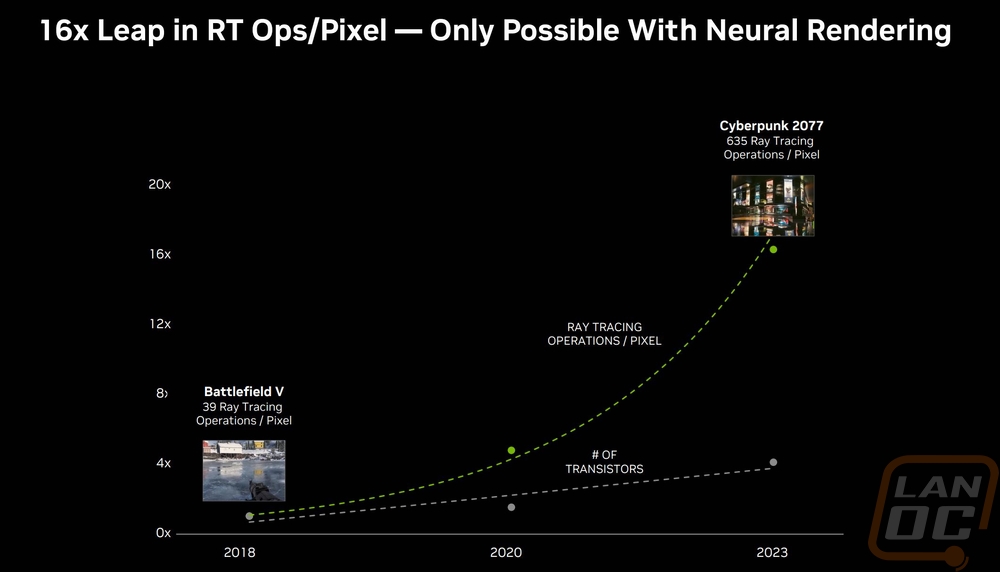
On that same note, they also showed just how much more RTX offers with today's offers whereas back in 2018 the cards were limited and games had to pick and choose which effects they wanted to utilize. This can really be seen when you see the change in ray tracing operations per pixel between Battlefield V and Cyberpunk 2077 with it going from 39 to 635. Nvidia also mapped out the number of transistors on their cards between then and now as well on the same graph. This does a great job of showing that while the cards have grown in processing power, the about of ray tracing operations per pixel has out scaled that by a huge amount.
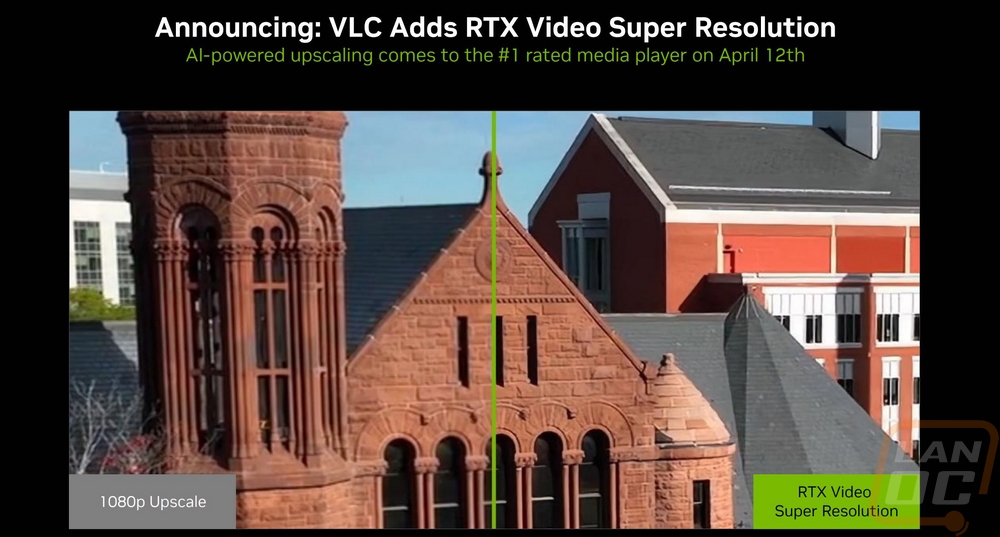
Another big announcement, at least for me was that VLC is adding RTX Video Super Resolution. This one hits home because I watch a lot of TV both in the living room and on my PC. In the living room I have an Nvidia TV which has had AI upscaling for a while now and I recently noticed that some of the video files that I have on the network were a lot lower in resolution than I thought when I want to watch them on VLC on my PC. I hadn’t noticed it on the TV. Video Super Resolution could do the same on VLC, improving the resolution of all of your movies/videos as you watch them.
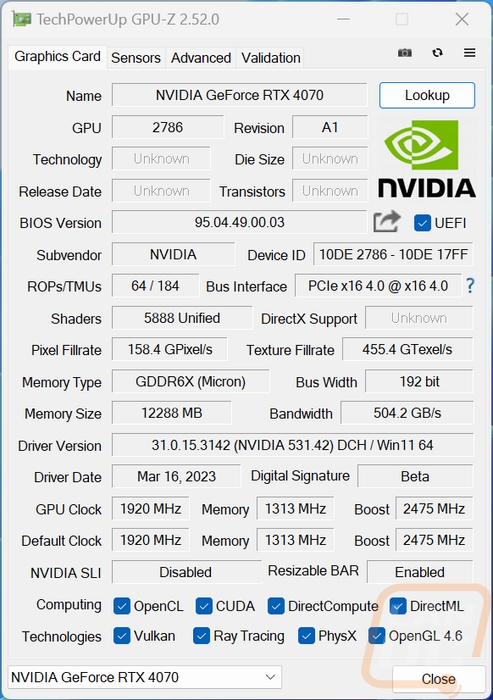
Before getting into testing I did also run GPUz to double-check that our clock speeds match up with the specifications. The RTX 4070 Founders Edition came in at 2475 MHz for the boost clock which matches the specifications and for the driver I used the 531.42 driver that Nvidia provided ahead of the launch. The board BIOS is also noted for future reference if needed.
Packaging
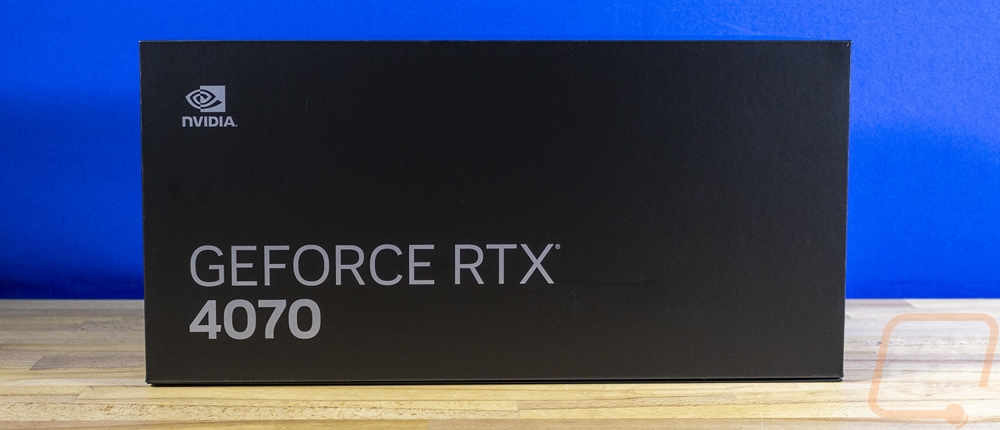
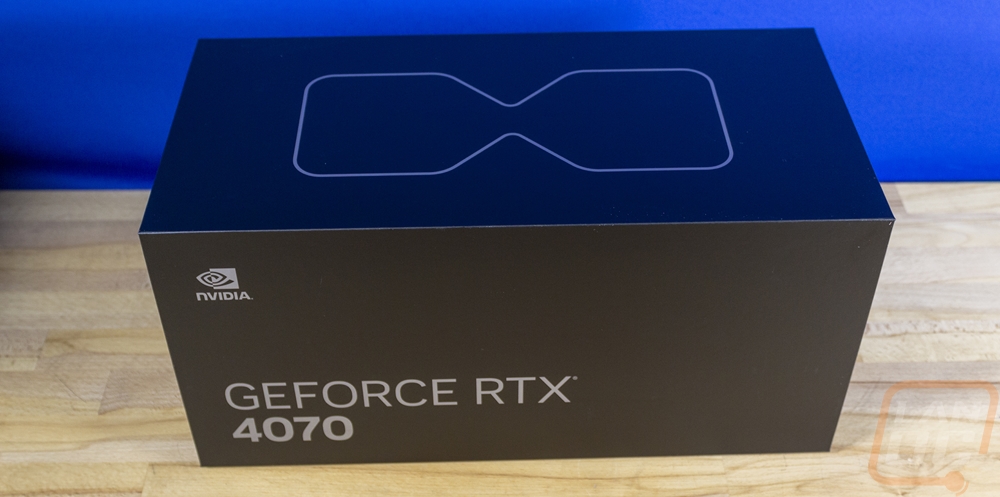
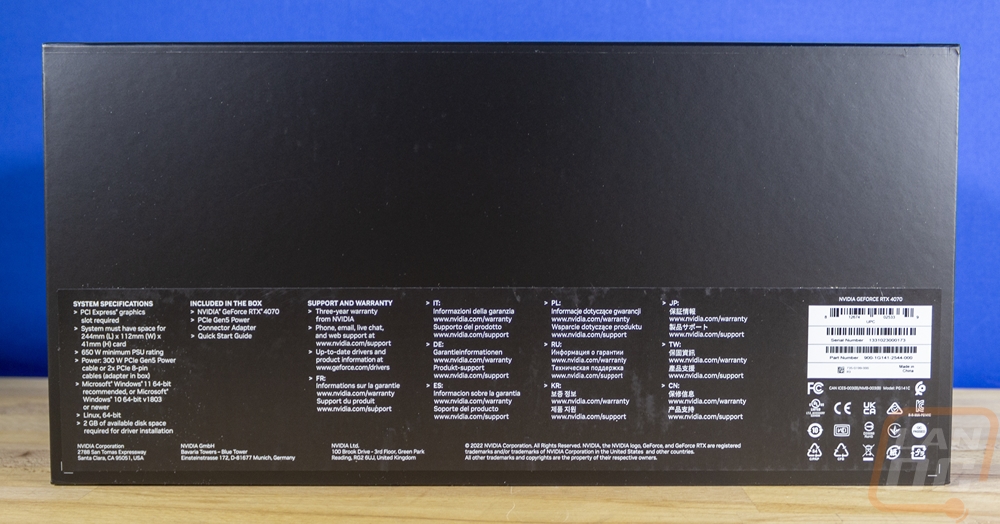
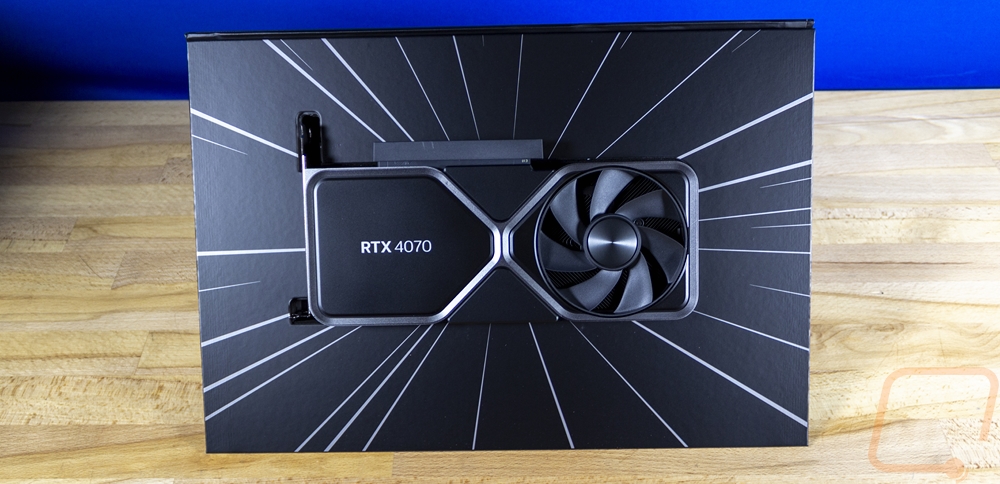
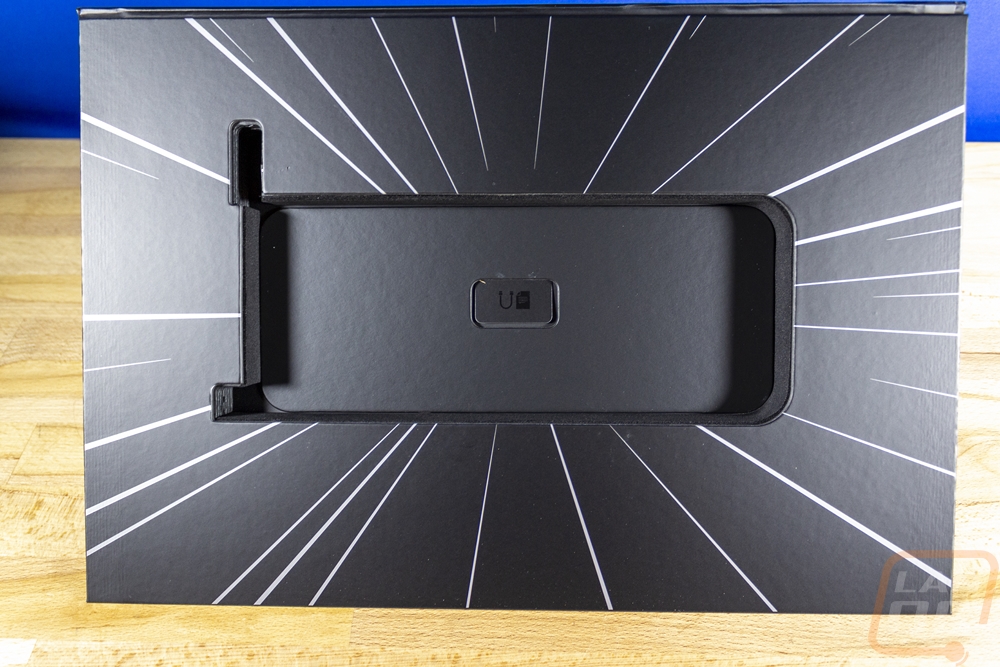
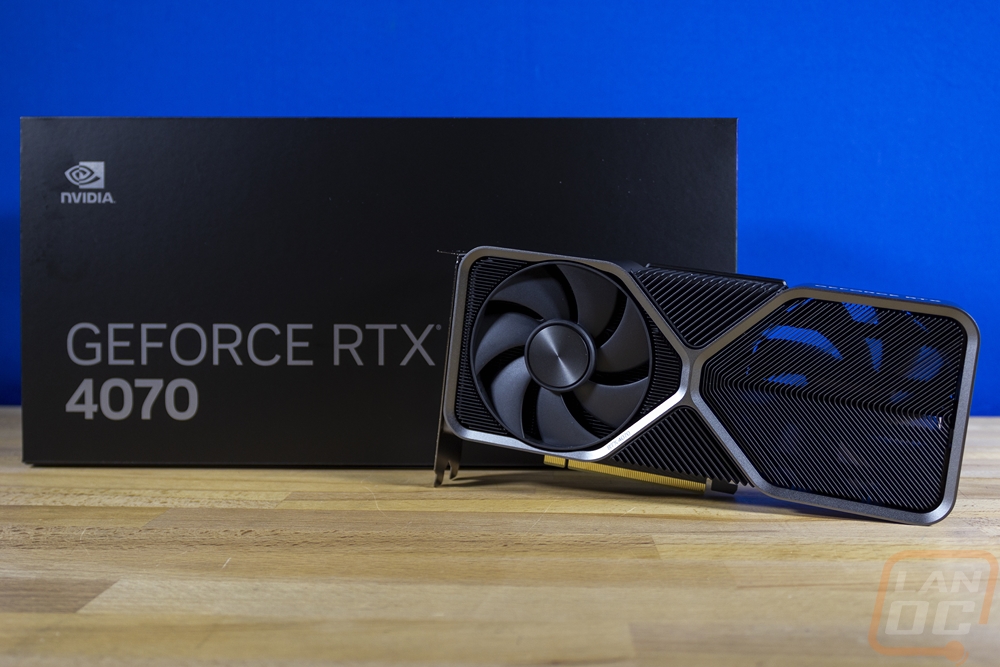
If you have been paying attention to any of the other Nvidia 4000 Series Founders Editon cards the packaging for the RTX 4070 Founders Edition isn’t going to be a surprise at all. But for those that haven’t seen the design before, it has to be the craziest video card packaging out there. The box is huge, especially considering the card size. Nvidia kept things simple for the front as well with the all-black background design and then just their logo and the model number on the front in large silver letters. The black background carries on to the top, bottom, and back as well. The top of the box has an hourglass shape giving a small hint of the card’s styling. Then around on the back, there is a sticker that has basic specifications, a list of what is inside the box, warranty information, and your serial number and UPC barcodes. The only downside to the simple design is that you don’t have a picture of the card at all but they do at least give you the card dimensions which a lot of cards don’t have on their box but should for retail shoppers.
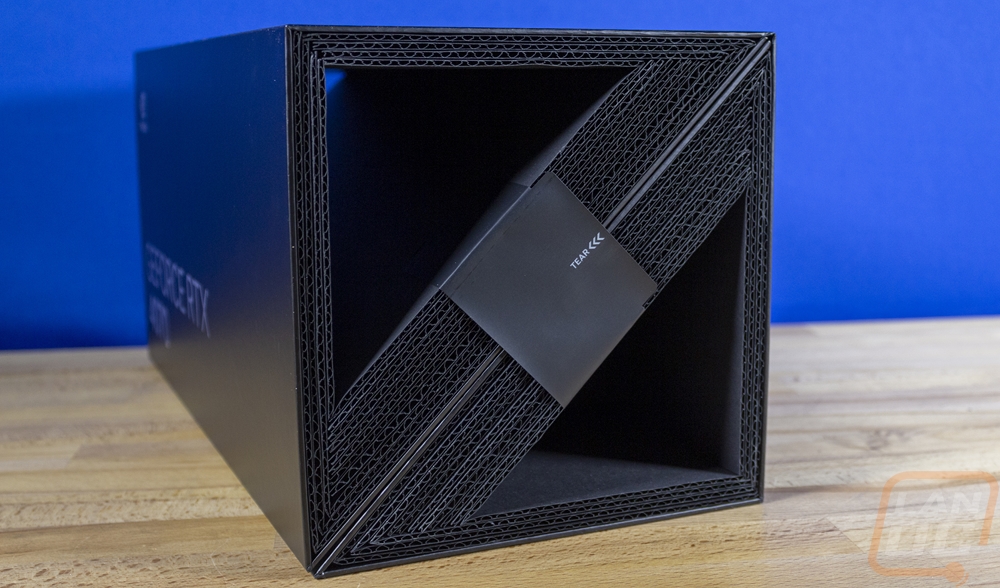
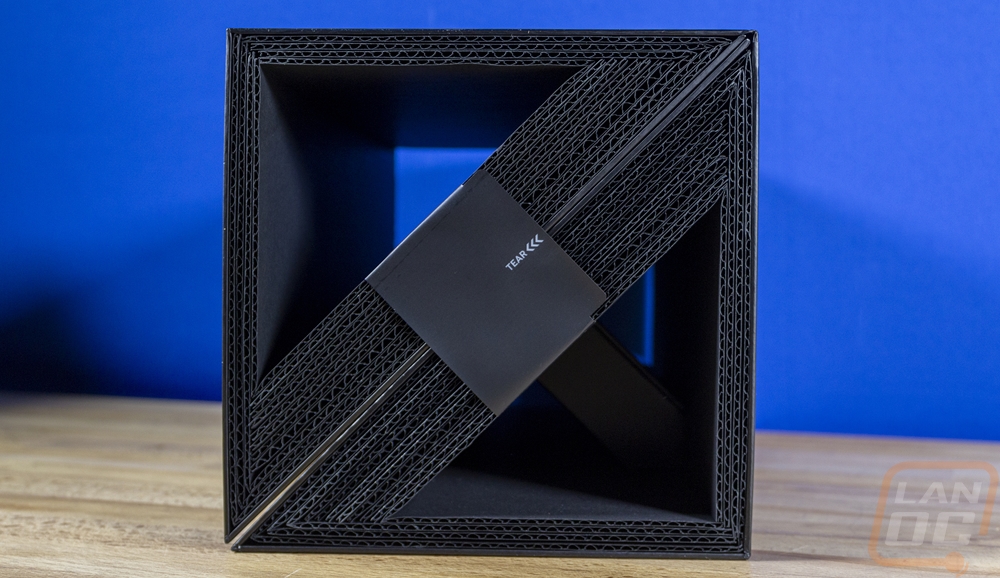
When you spin the box around to the sides though this is where the box stands out. You can see completely through the box with the triangle-shaped holes, two on each side. The side shows that the box is made of corrugated plastic and Nvidia has stickers that wrap around the middle on both ends that keep the box closed and function as a seal. They are perforated and you can pull them off to open the box up.
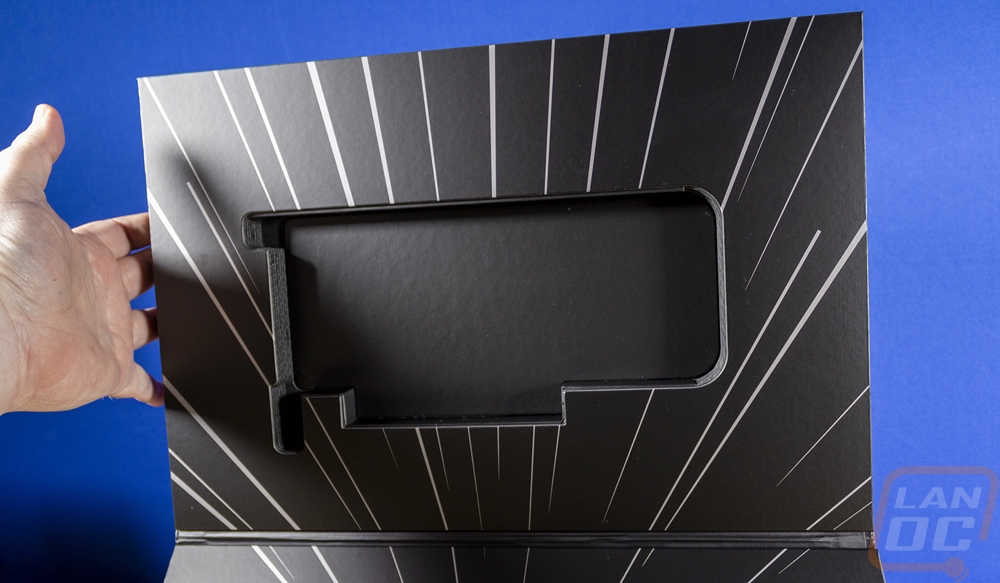
The box opens up like Pacman’s mouth and the inside has a black background but with silver stripes that give a traveling through space like effect. The top and bottom halves of the box then have cutouts that fit the shape of the card and opening the box up you get a full view of the card which sits in its cutout upside down so that the model name on the back is readable.
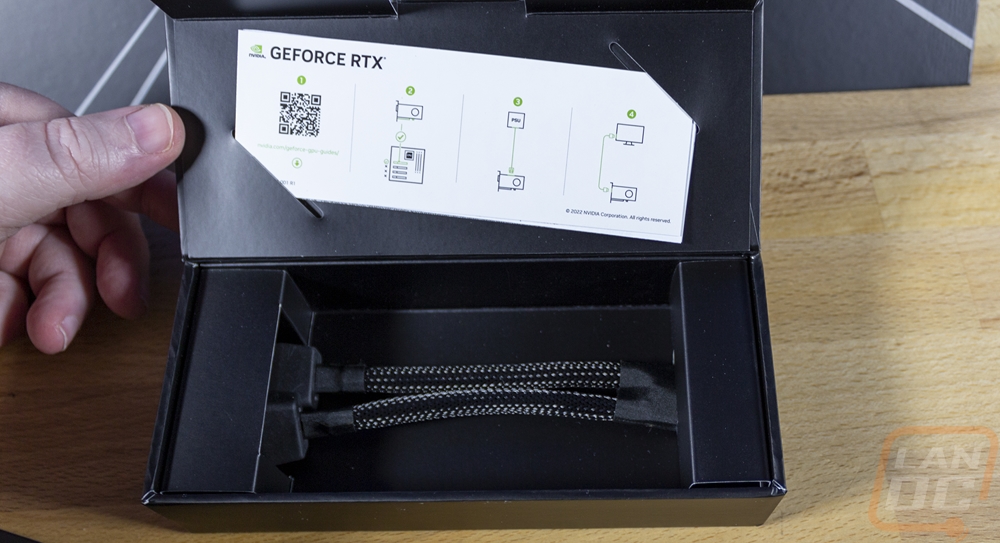
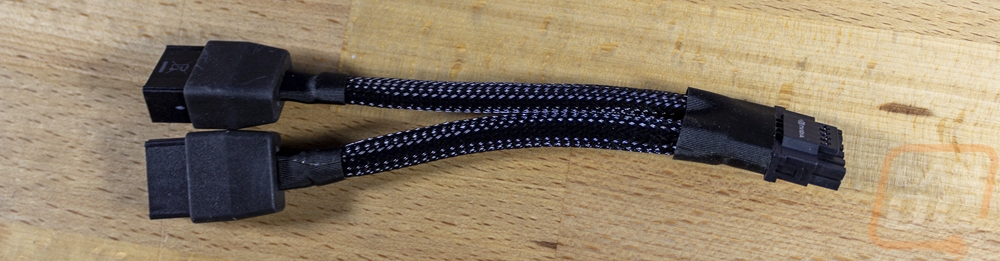
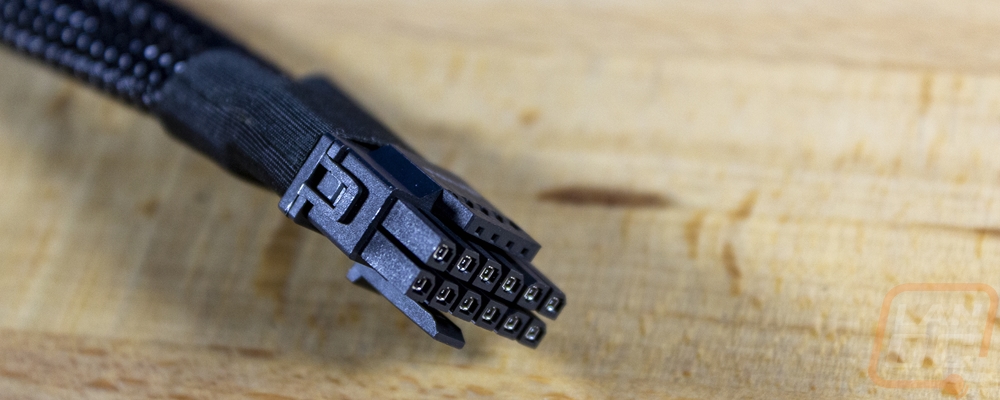
Once you pull the card out there is a card that sits behind it, pulling that out will show a small box. The box has a QR code for installation guides and then really simple line drawings are also on the card showing how to get things going. Under that, the 4070 Founders Edition also comes with a 12VHPWR adapter. It adapts from two 8-pin PCIe power connections down to the more compact 16-pin connection that is part of the new ATX 3.0 standard.
Card Layout and Photos
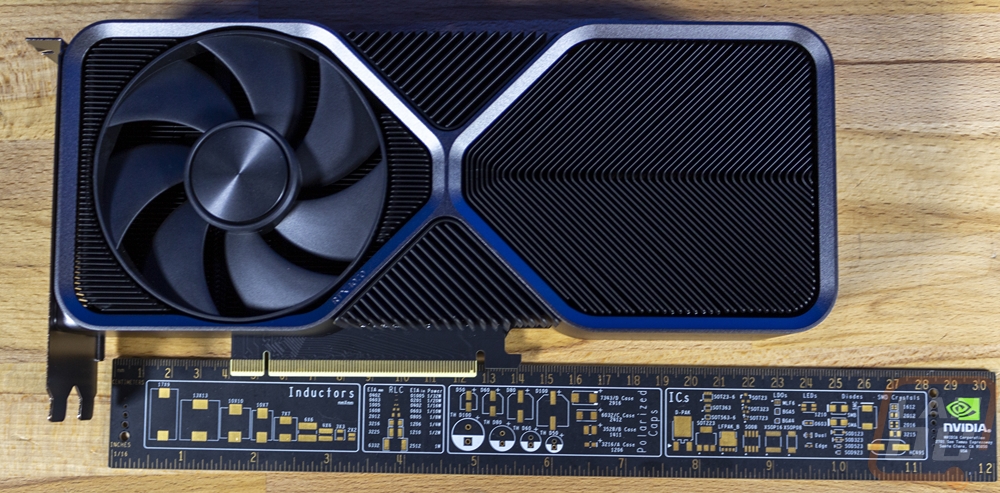
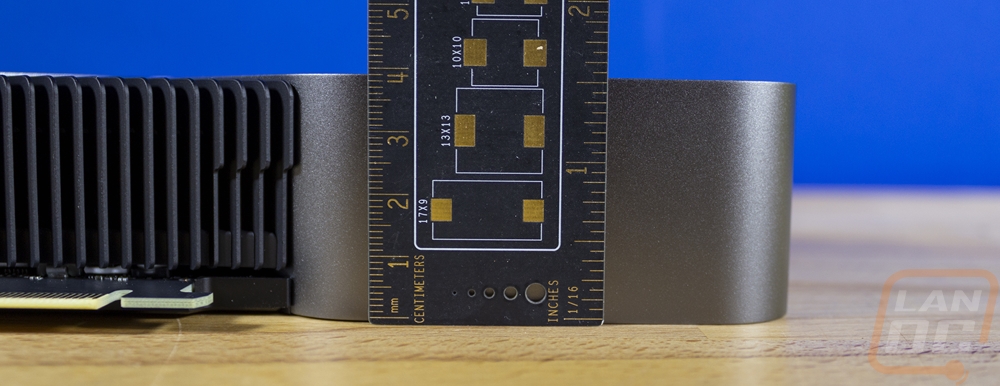
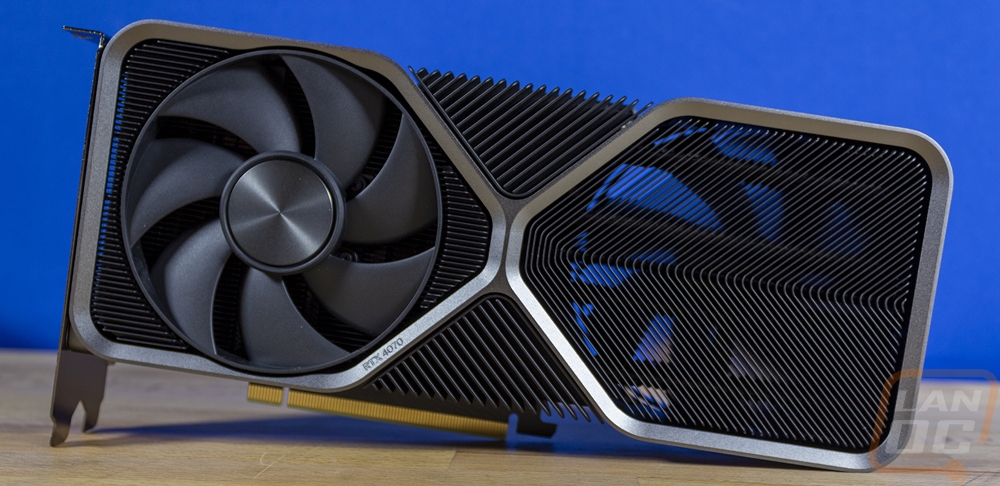
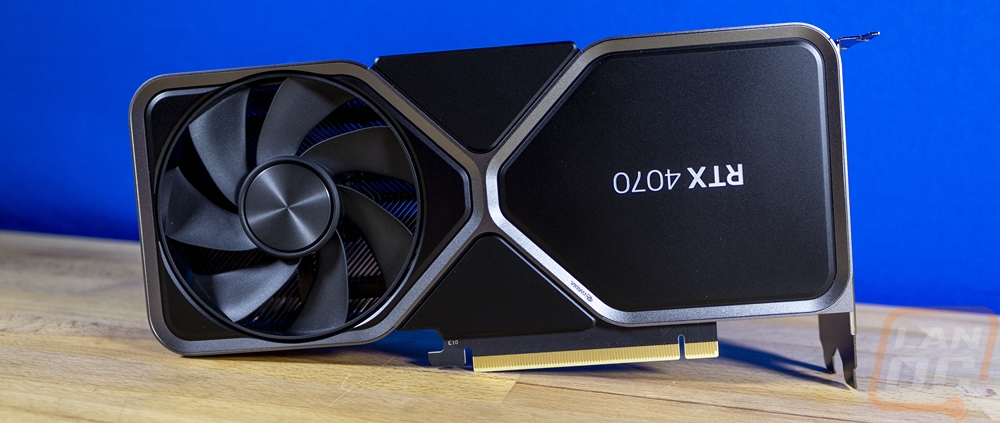
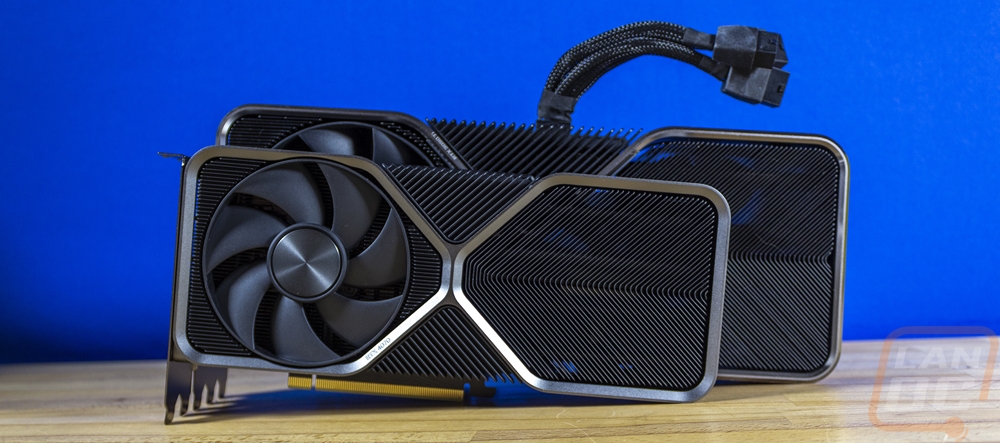
The Nvidia RTX 4070 Founders Edition follows the same styling that Nvidia used on all of the other 4000 Series cards as well as the 3000 Series Founders Editions as well but this is a new design. The other 4000 Series Founders Edition cards are all larger, similar to the 3090 and 3090 Ti from the 3000 Series and this is the first of their cards to go back to the smaller two-slot design and normal card height with it coming in at 244 mm long, 112 mm tall, and 41 mm wide. More than that it has the dark silver hourglass design that all of the cards have and all of the heatsink is exposed and has wider fin gaps like the other 4000 Series cards.
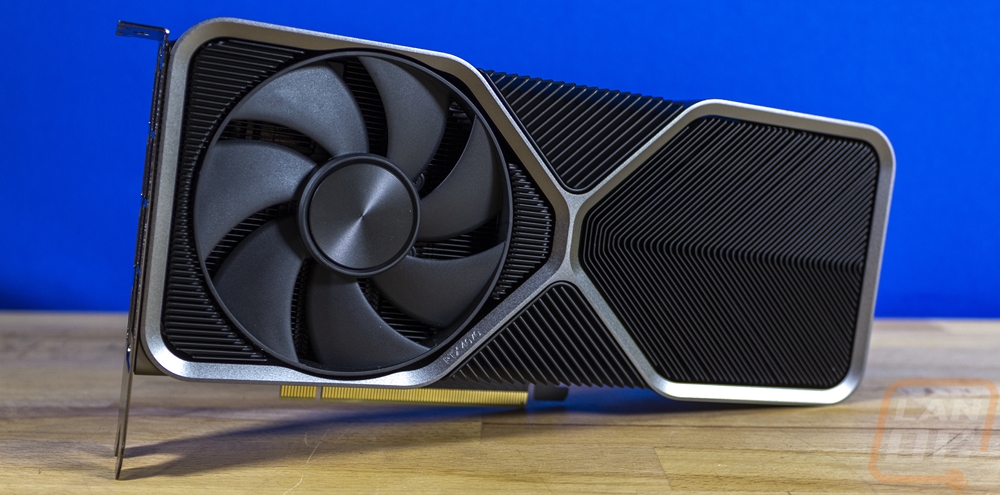
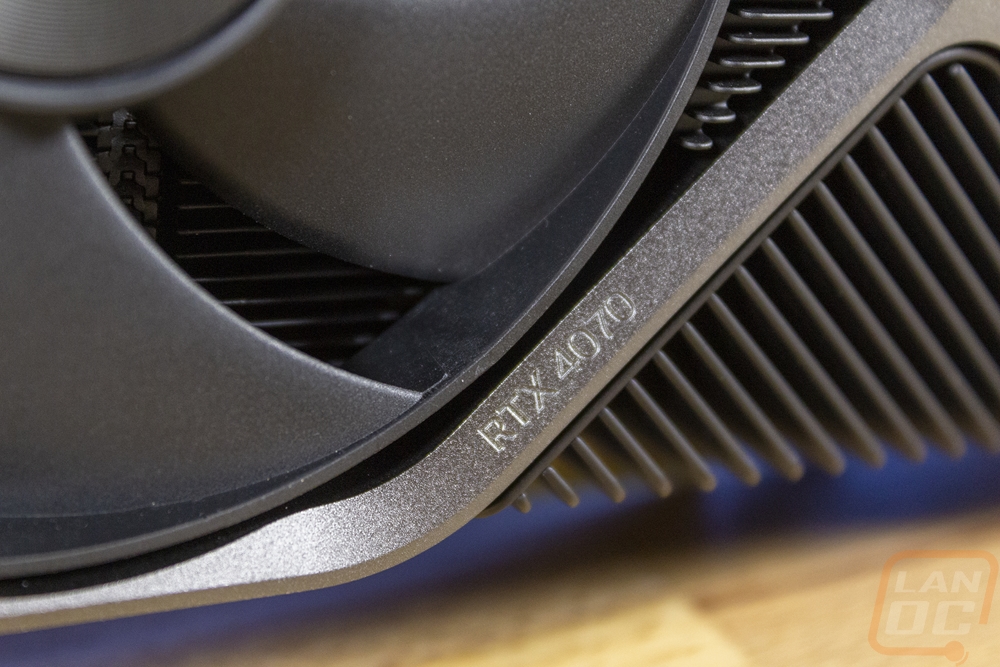
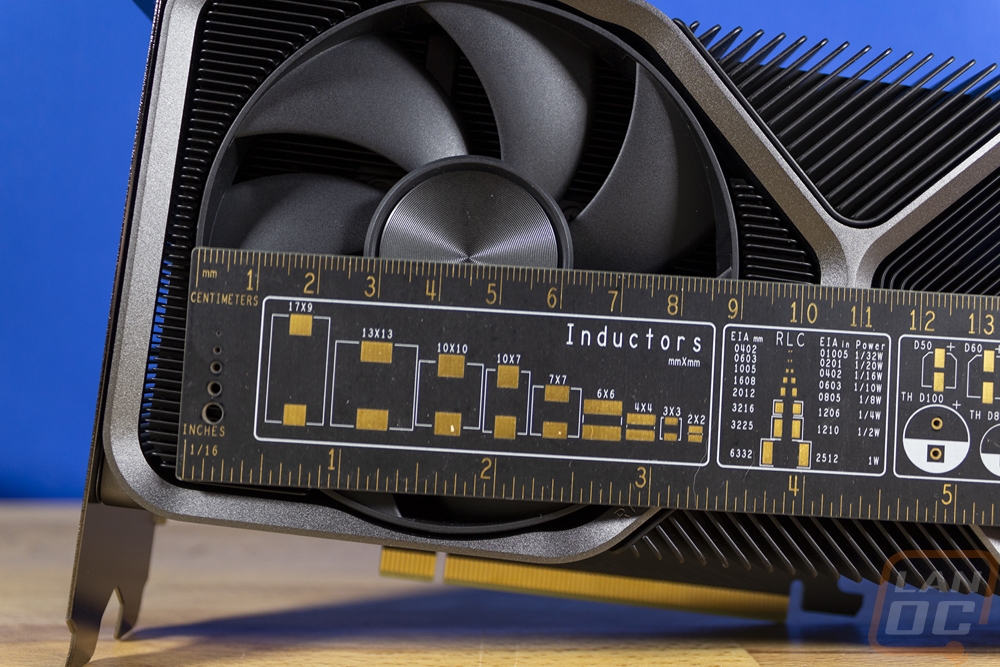
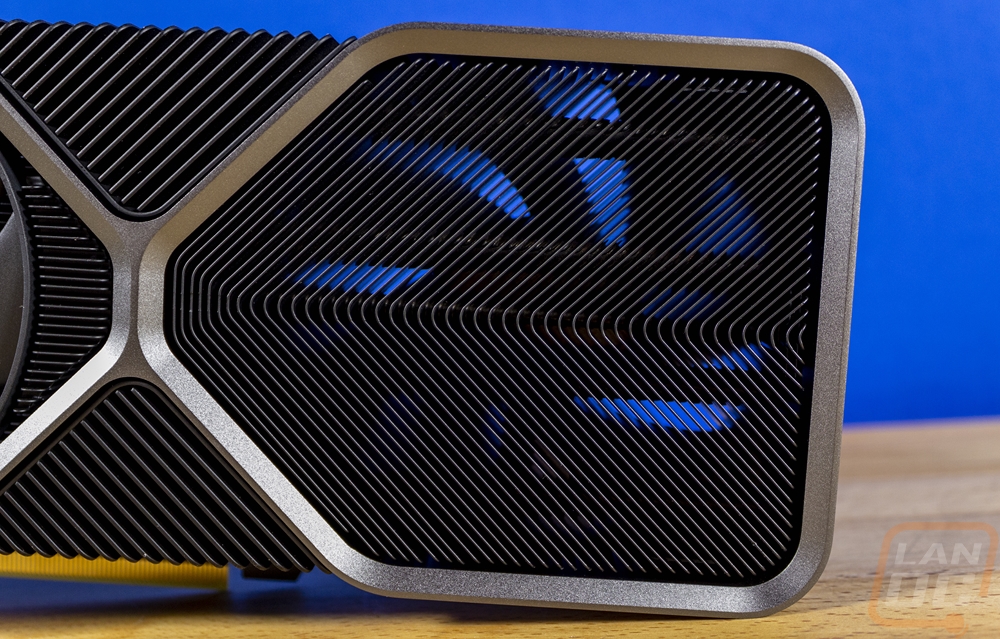
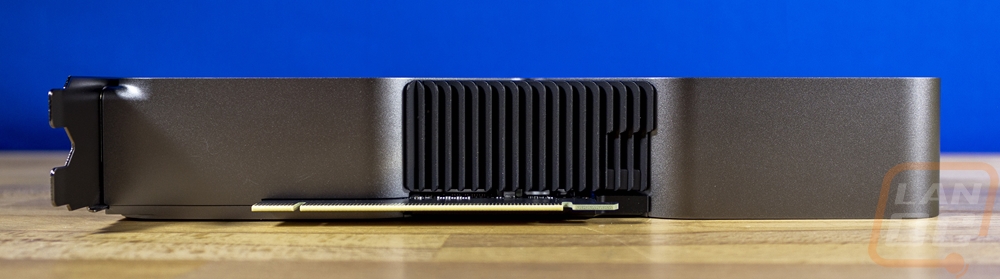
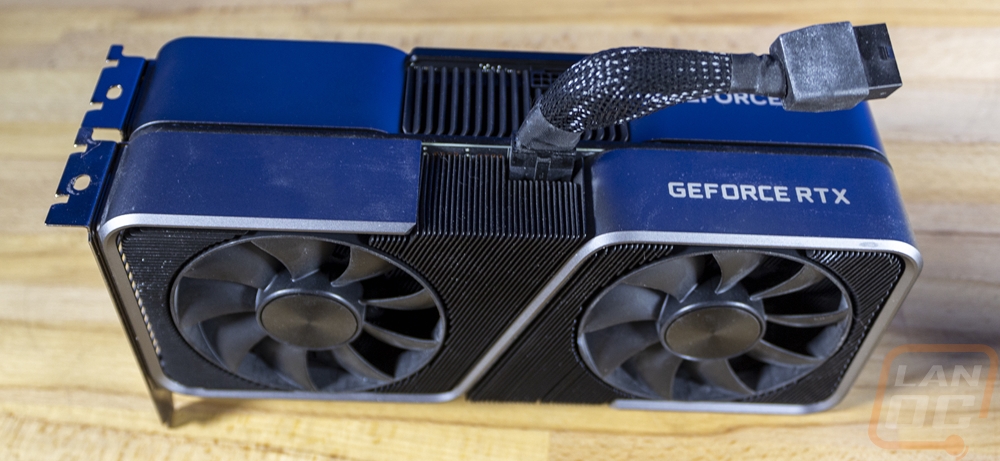
The traditional fan side of the card has just one fan on it, just like their other designs with that fan being on the left. The fan size is 90 mm and the design is an axial fan that blows down into the card not a blower style like the older FE and Reference cards used years ago. The fan has seven blades and an outer ringer that gives the blades even more strength that goes all the way around the outside. The center does have a cap on it and it has a dark spun-metal finish that goes perfectly with the all-metal cooler design. The hourglass shape is a little different from the other cards because of the more compact design. Where the other cards came together like an X in the center this has a taller X shape. They also do have the model name etched into the hourglass just under the fan which is subtle but cool. The area where a second fan would normally be is all heatsink which each fin has a V shape but when you look into the heatsink we can see that the PCB ends at the middle of the card (and has a V shape to its end as well). So this is a blow-through design and you can slightly see the fan on the back through the card.
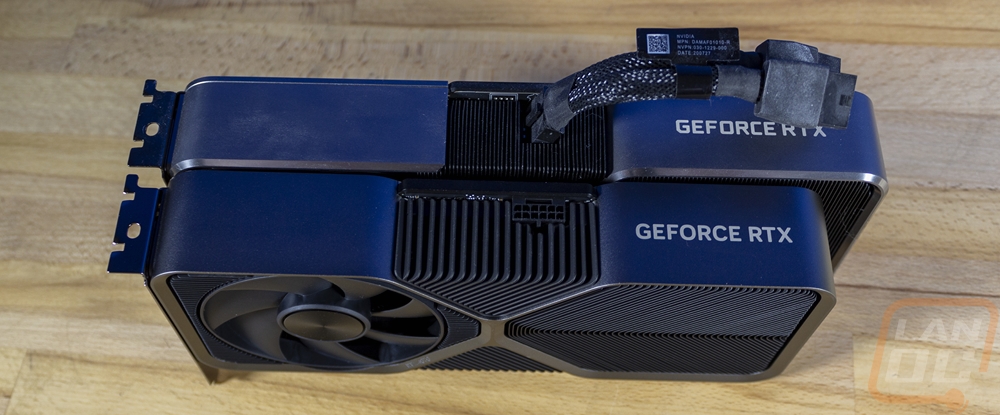
The back of the card doesn’t have any of the exposed heatsink fins like the front did but it does have that same hourglass shape outlining it and splitting the card up into sections. We have a second 90 mm fan on the left with a similar but different design. This has the same styling, the same outer ring, and the same center cap. But the blades are flipped around to spin in the same direction as the front fan and it is designed to pull air from the front side of the card and out the back not push air. The back side is mostly covered with the full metal backplate which integrates with the entire card design and matches the front of the card with black in the same areas as the fronts black heatsinks. It also has the RTX 4070 model name etched and painted in which is upside down so it is visible when installed in a traditional case.
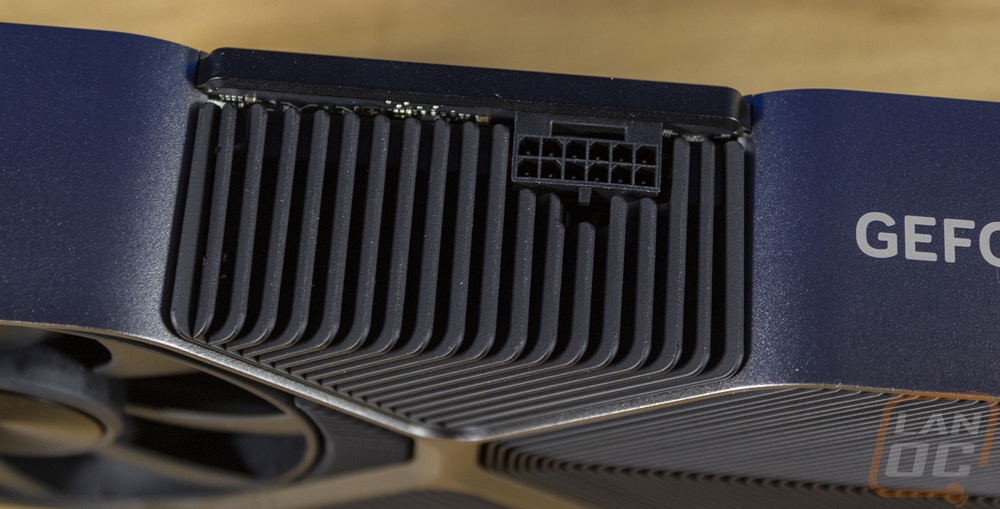
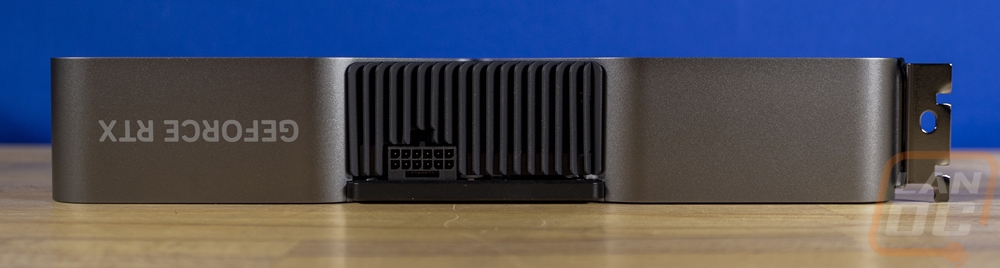
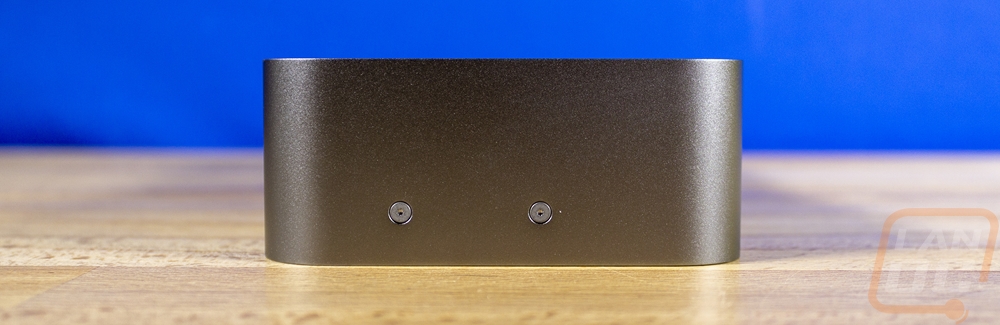
The thick heatsinks in the top go all the way out to the top edge of the card and are also where you will find the power connection. As the included adapter indicated the RTX 4070 Founders Edition uses a new 12VHPWR plug. Because the PCB doesn’t go to the end of the card the power connection is just past the center point on the top. This can make wiring a little harder which isn’t helped with this plug facing directly up where some of the 3000 series Founders Edition cards had theirs angled towards the end of the card. Thankfully the RTX 4070 Founders Edition is a normal card height, so you should have room to fit the adapter sticking up in most cases which is good because the connection did have early issues with people not getting them plugged in tight and having the connection tight up against side panels. The top edge also has the GeForce RTX branding on it as well. You can also see how the hourglass design dictates the color and shape of the top and bottom of the card. Those views also show that other than the small heatsink areas all of the cooling is focused on the sides. The end does also have two small screw holes for anti-sag mounting if needed.
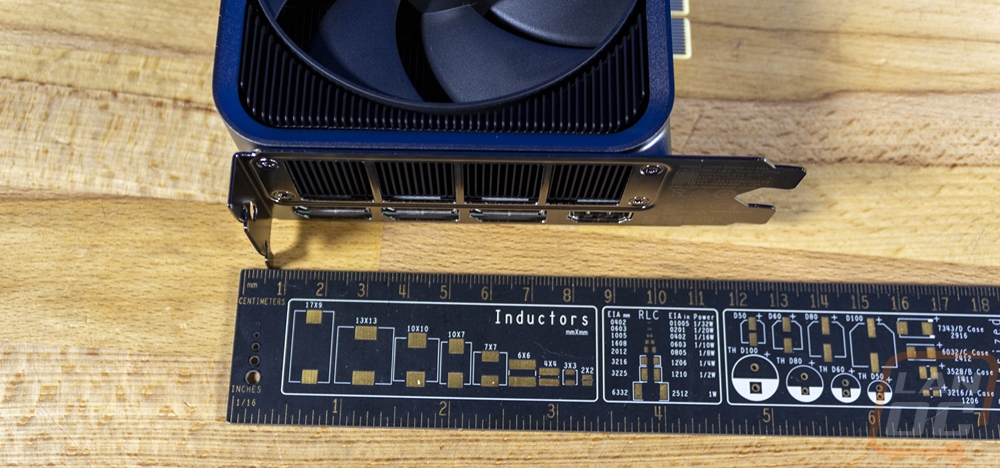
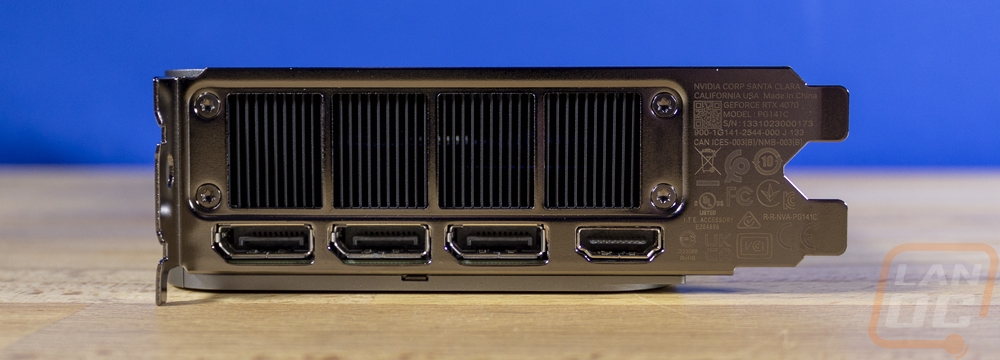
The PCI bracket end of the card gives us a great look at how the card height doesn’t extend much past the top of the bracket. You can also see that Nvidia has tucked all of the certification badges on here as well as your serial number and other information. The bracket then has four very large holes which expose some of the heatsink behind it for ventilation and below that are the four display connections. You get three DisplayPorts and one HDMI with the HDMI down on the bottom, not mixed in the middle of the others which is nice to see.
I did also get a few other Founders Edition cards for comparison as well to put next to the RTX 4070 Founders Edition. The large card is the RTX 4080 Founders Edition which puts into scale a little better how much larger the cards above the RTX 4070 Founders Edition are as well as the 3090 and 3090 Ti. The second card is the RTX 3070 Founders Edition which had the same card dimensions. The 3070 is a nice comparison of some of the differences in the overall card styling, it's easy to forget that card and the 3060 Ti didn’t have the X shape in the middle like the RTX 4070 Founders Edition has and it had both fans on one side. The heatsink fits were tighter together as well. The 3070 to the 4070 has also moved from the power adapter requiring one 8-pin connection to two.
Test Rig and Procedures
CPU: Intel Core-i9 13900K – Live Pricing
Motherboard: Asus Z790 Extreme – Live Pricing
Cooling: Corsair H100i Elite LCD Display - Live Pricing
Noctua NT-H1 Thermal Paste - Live Pricing
Memory: Crucial 32GB Kit (2 x 16GB) DDR5-5600 UDIMM– Live Pricing
Storage: Sabrent Rocket Q4 2TB – Live Pricing
Power Supply: Thermaltake Toughpower GF3 1000W- Live Pricing
Case: Primochill Wetbench - Live Pricing
OS: Windows 11 Pro 64-bit - Live Pricing
|
Our Testing Procedures |
|
|
3DMark |
All 3DMark-based tests are done using the most recent version. We test using all three versions of Fire Strike, Both Time Spy and Time Spy Extreme, and Speed Way. Tests to look at ray tracing performance are done with Port Royal when supported and for Nvidia cards that support DLSS, the DLSS subtest is also done at 1440p with the performance setting and DLSS 2.0 as well as a look at DLSS 1, 2, and 3 at 4K. |
|
Unigine Superposition |
1080p Extreme and 4k Optimized benchmarks along with the VR Future test are done. The VR test is done at the Oculus resolution |
|
VRMark |
Only the Blue room test is run |
|
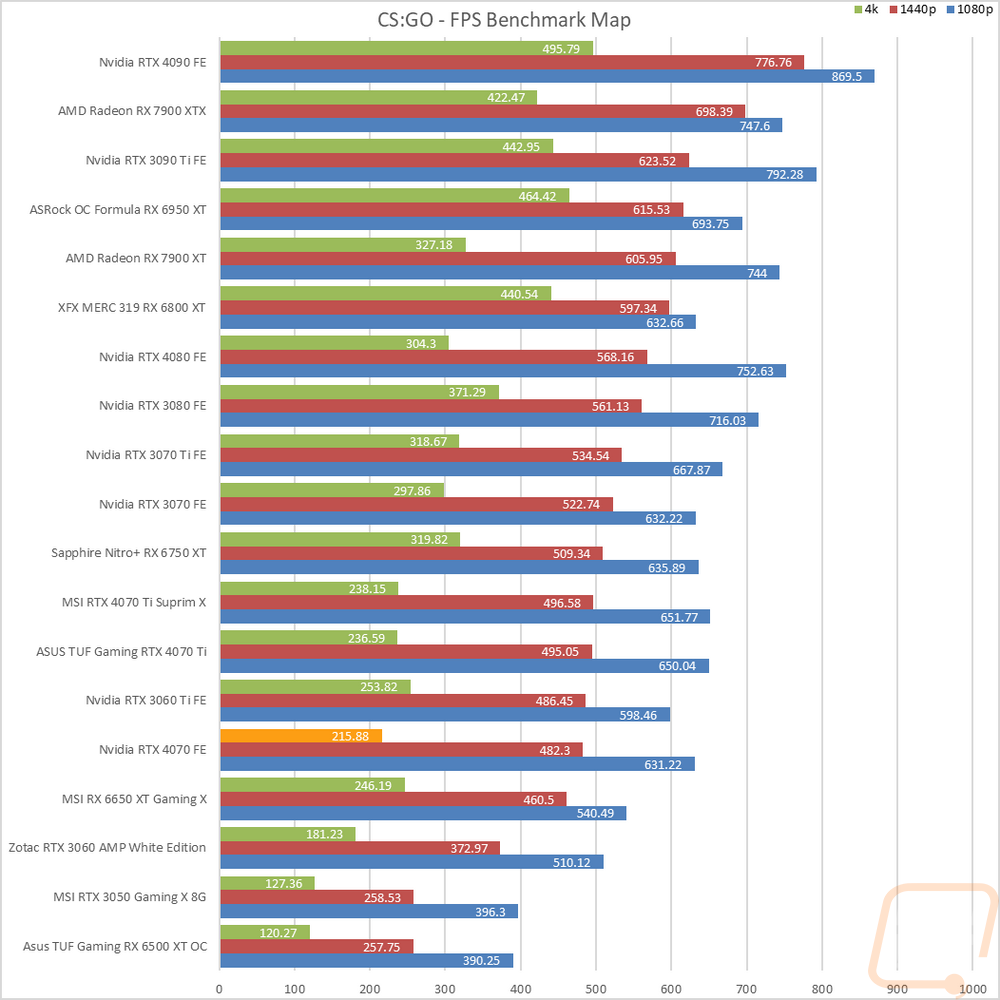
CS:GO |
This test is done using the workshop map called CS:GO Benchmark. You can find more information at this link. https://www.gamingpcbuilder.com/how-to-install-csgo-fps-benchmark-map/ I test at 1080p, 1440p, and 4K resolutions. All auto settings are turned off and detail is set to their highest settings. shadow quality high, model texture detail high, shader detail very high, AA set to 16x, uber shaders enabled |
|
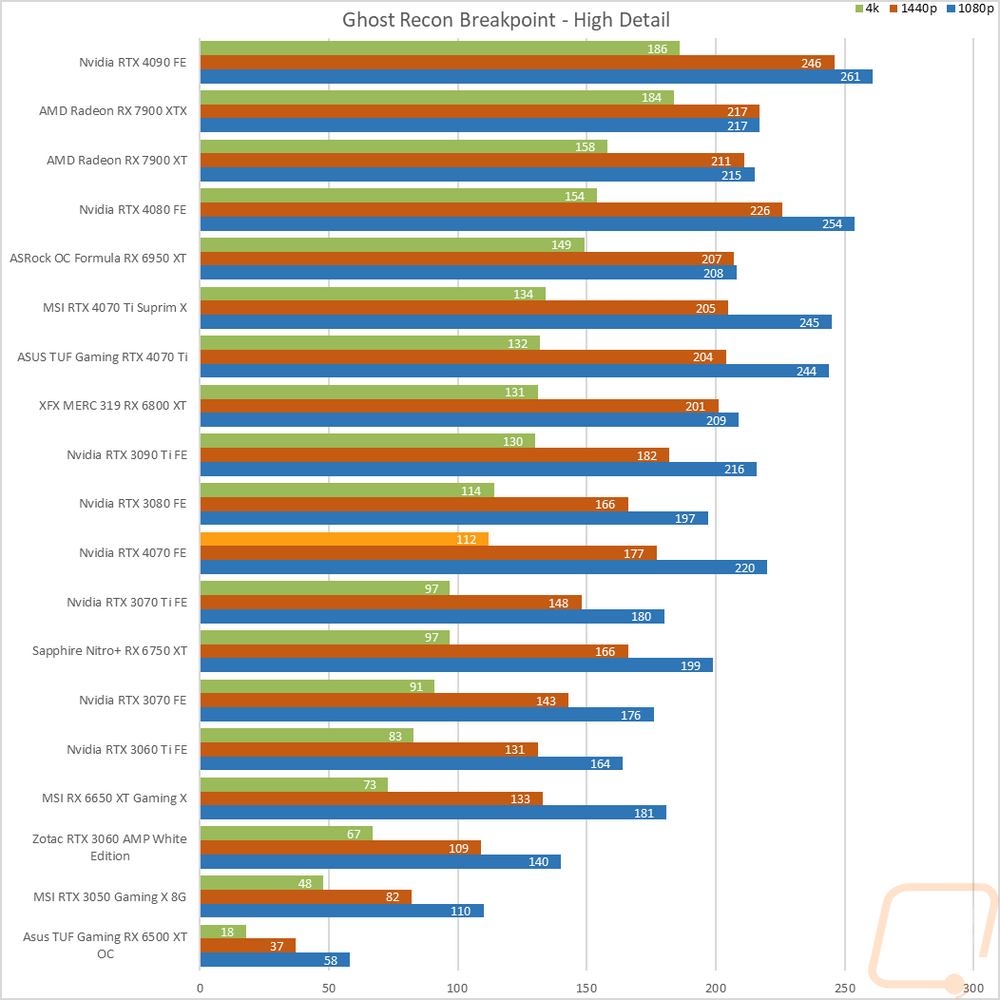
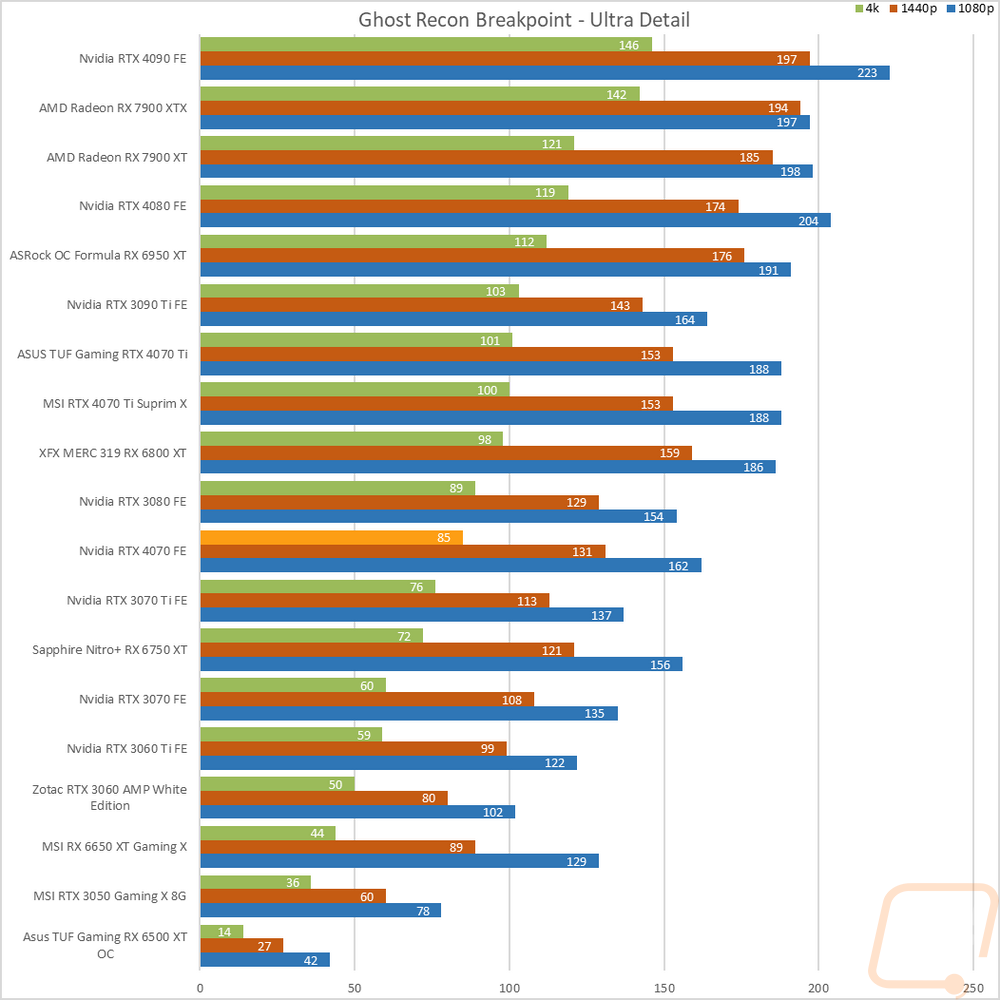
Ghost Recon Breakpoint |
Built-in benchmark tested at 1080p, 1440p, and 4k with the Ultra and Medium detail settings |
|
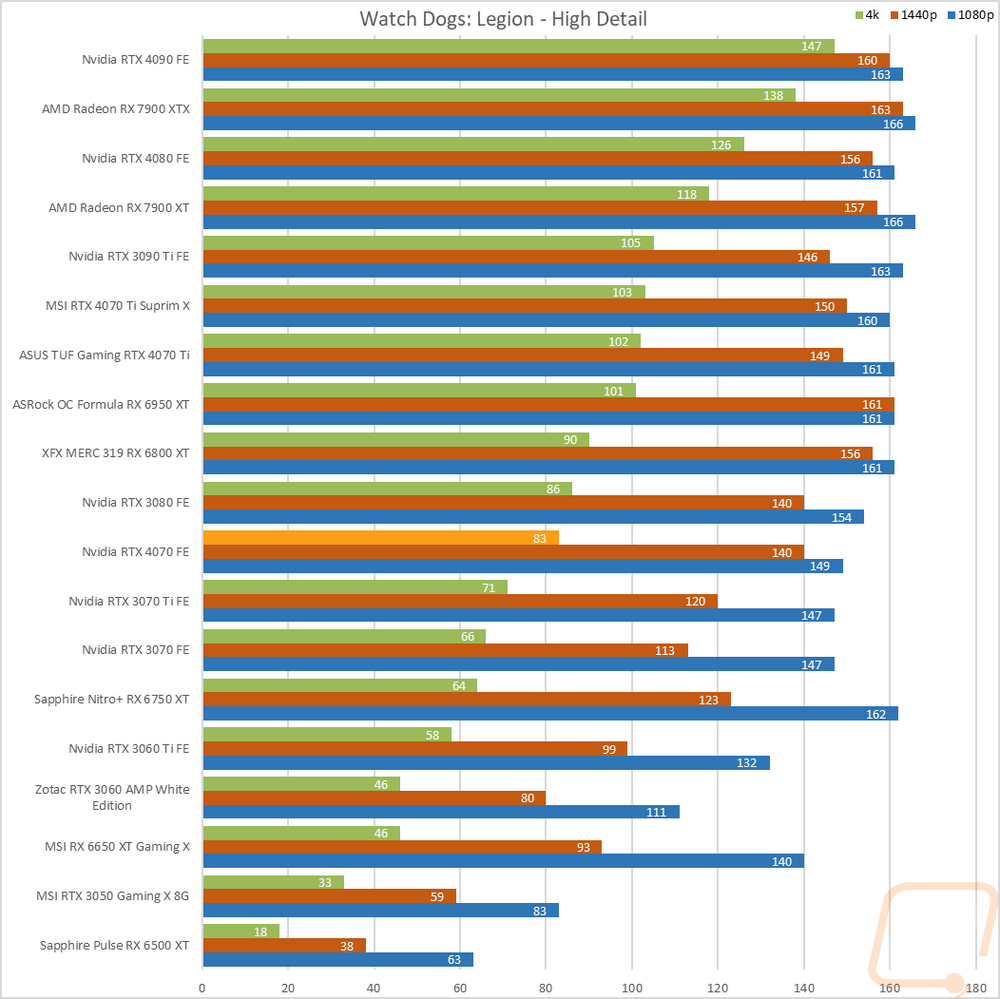
Watch Dogs: Legion |
Built-in benchmark testing at ultra and high details. Tested at 1080p, 1440p, and 4k. I also do RTX and DLSS testing on Nvidia cards at 4K using the Ultra detail settings as a base as well. |
|
Borderlands 3 |
Built-in benchmark testing with the ultra detail setting and medium detail setting, done at full screen with default settings at 1080p, 1440p, and 4k on DX11 |
|
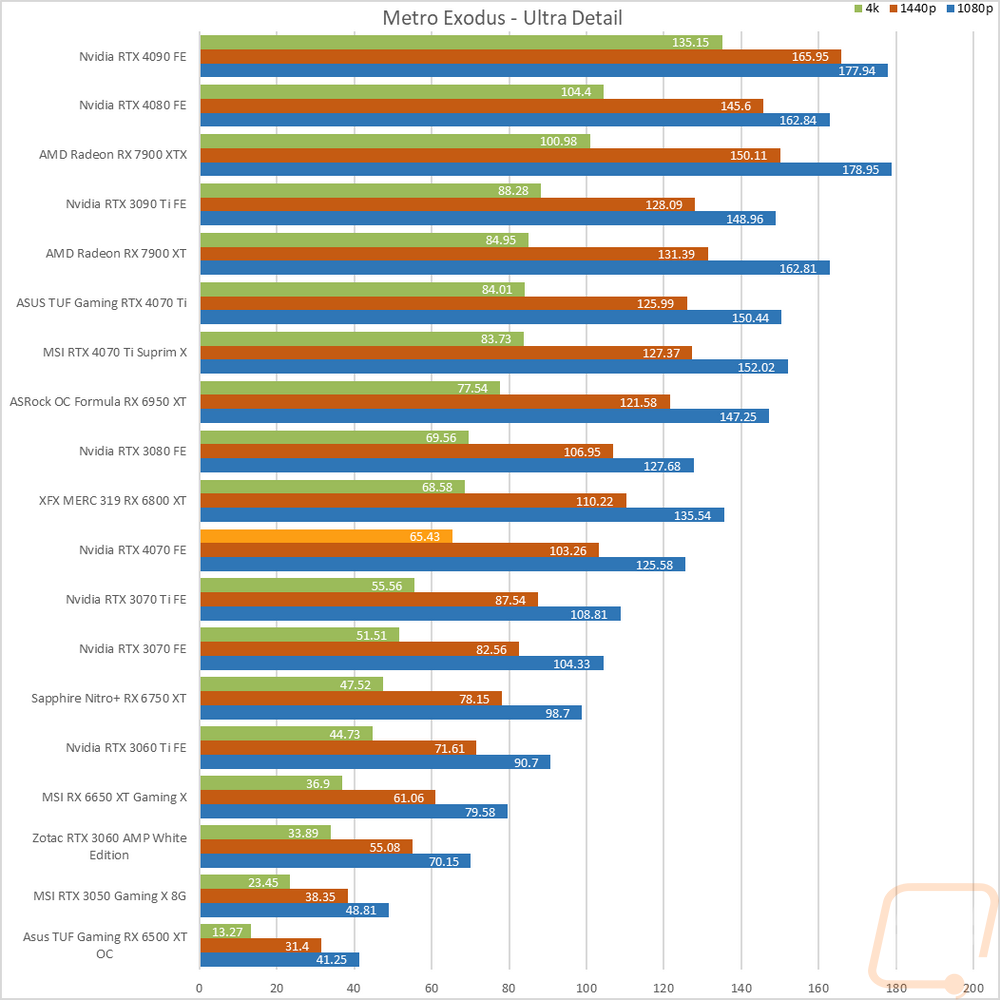
Metro Exodus |
Using built-in benchmark, testing at ultra and normal details at 1080p, 1440p, and 4k. I also do RTX and DLSS testing at 4K with the ultra-detail base settings for Nvidia cards as well. |
|
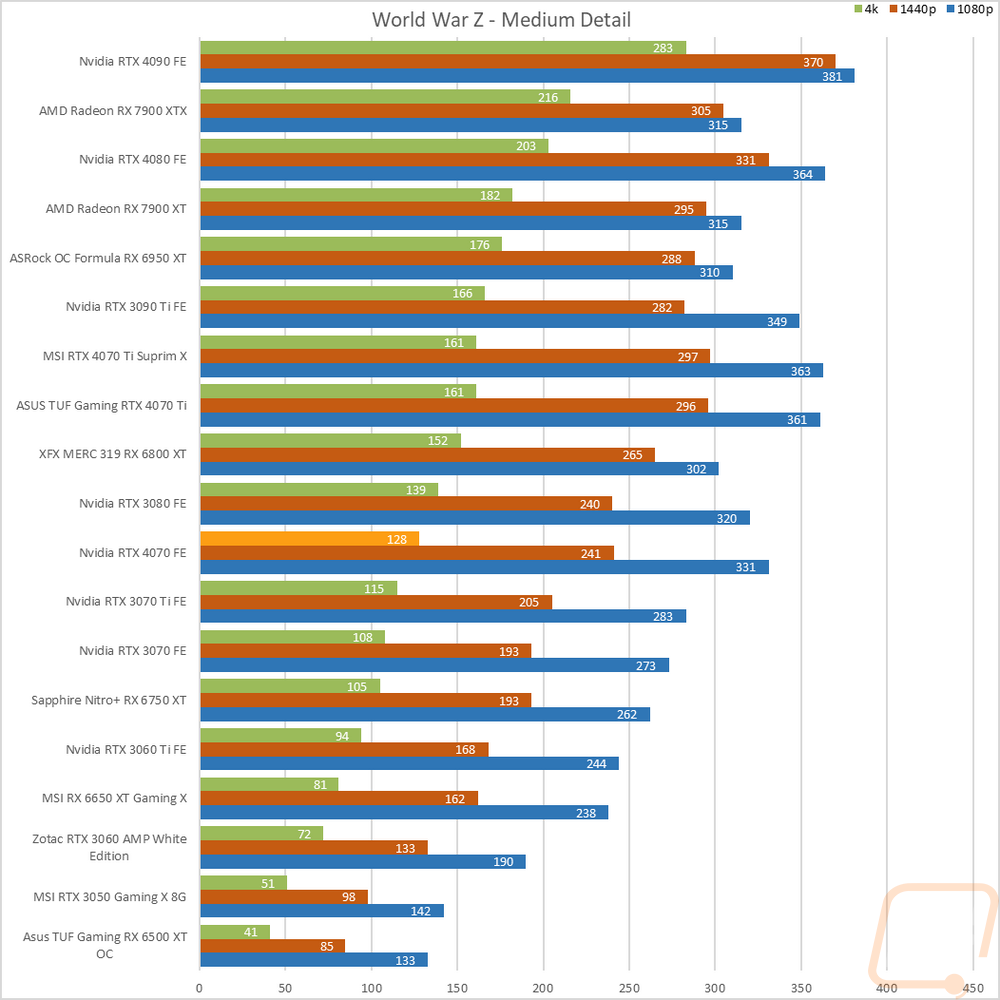
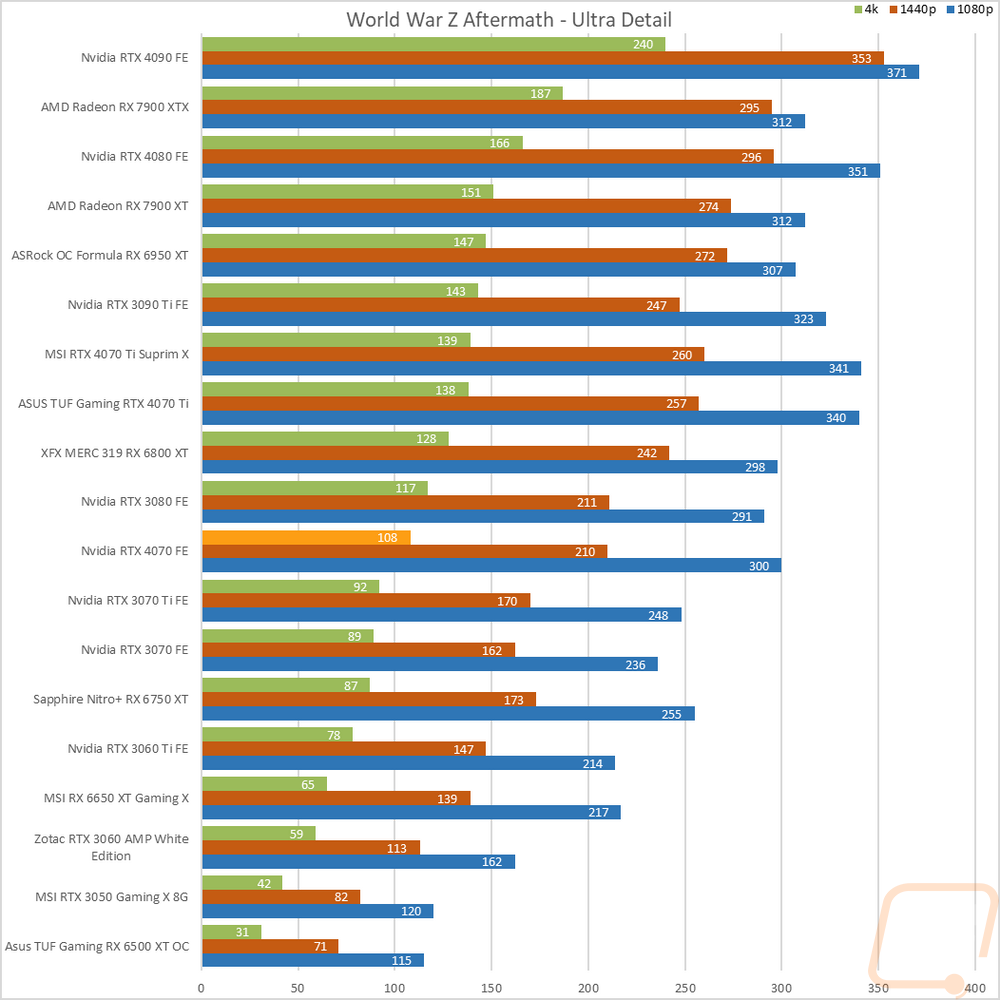
World War Z Aftermath |
Built-in benchmark in DX11 testing both the Ultra detail and Medium detail levels at 1080p, 1440p, and 4K resolutions |
|
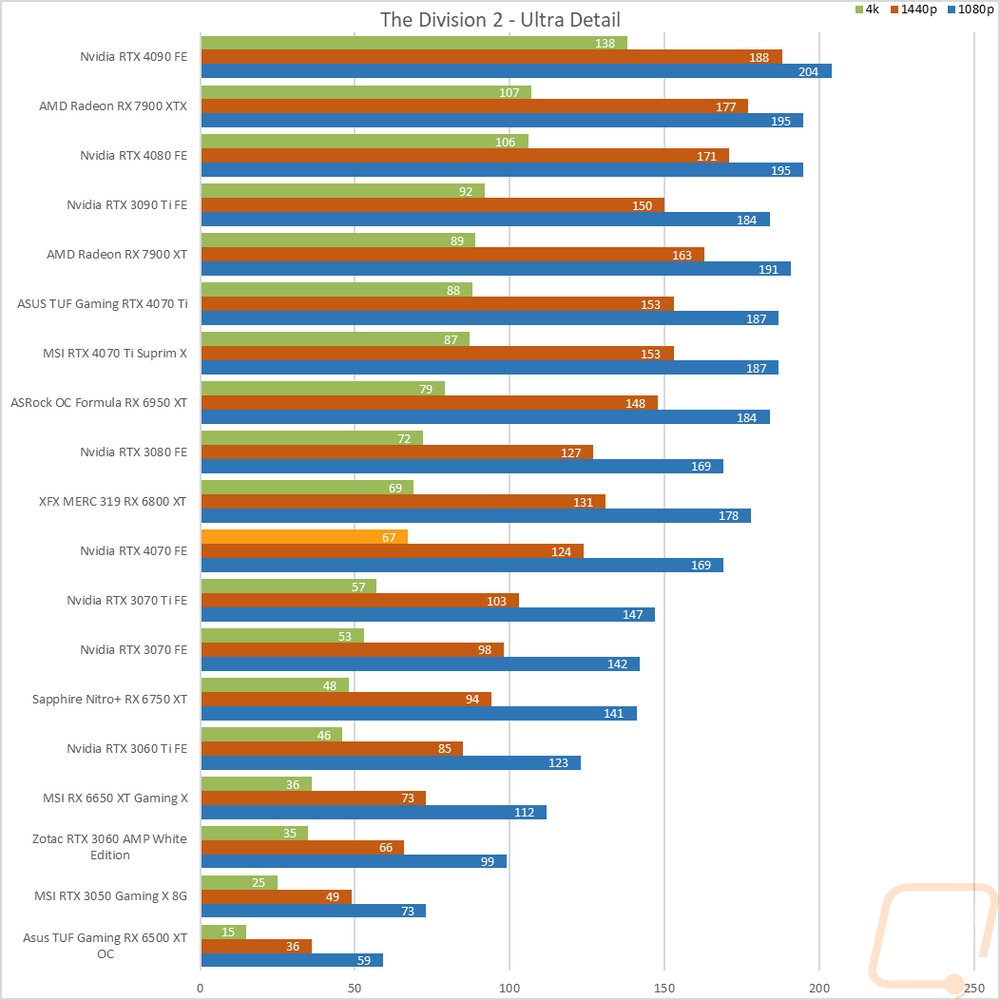
The Division 2 |
Built-in benchmark at Ultra detail with V-Sync turned off at 1080p, 1440p, and 4k resolutions. |
|
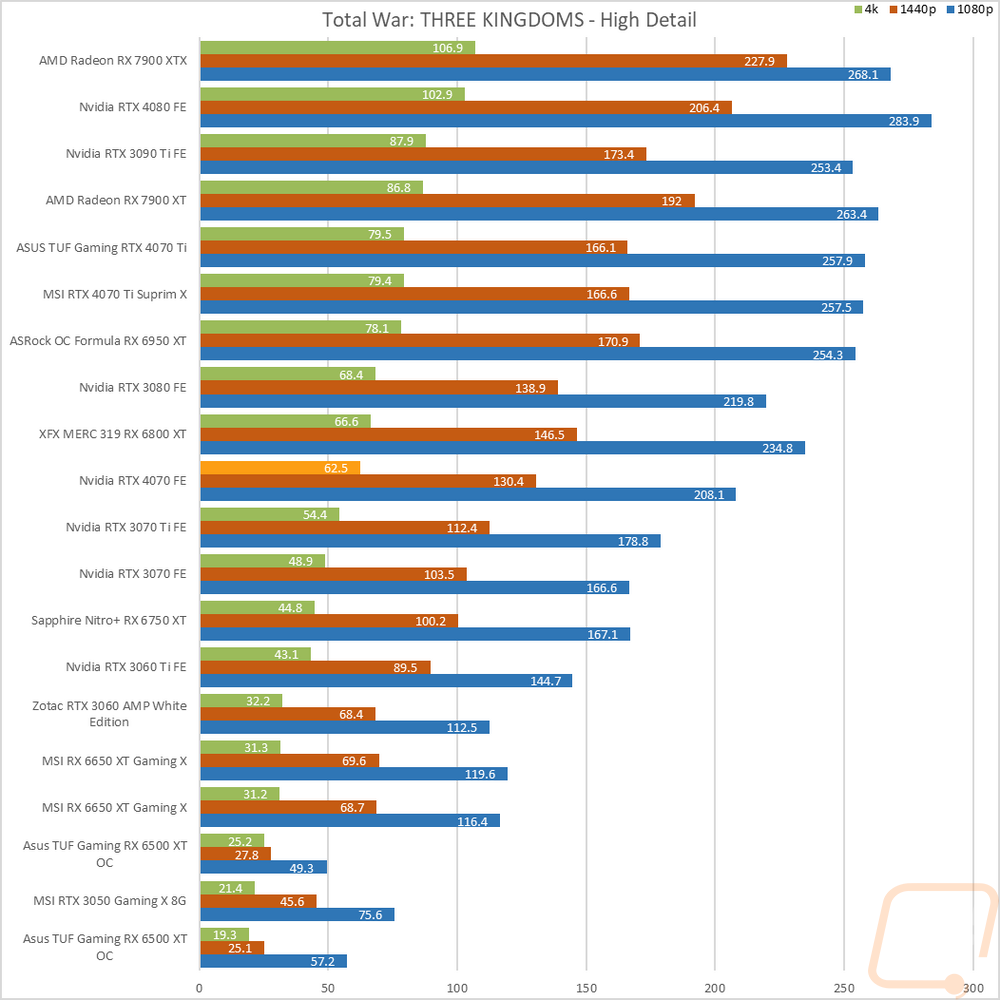
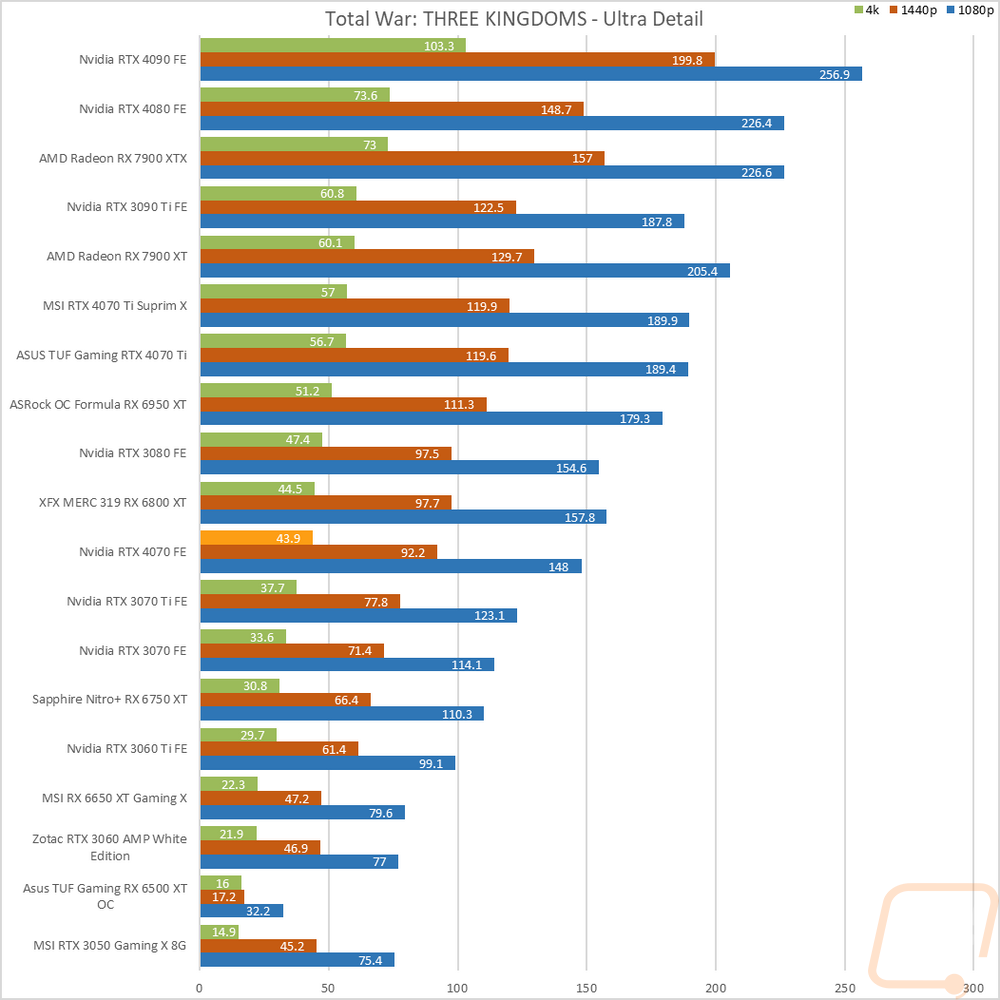
Total War: Three Kingdoms |
Built-in benchmark using the Battle Benchmark setting. Tested at 1080p, 1440p, and 4k at both high and ultra detail settings |
|
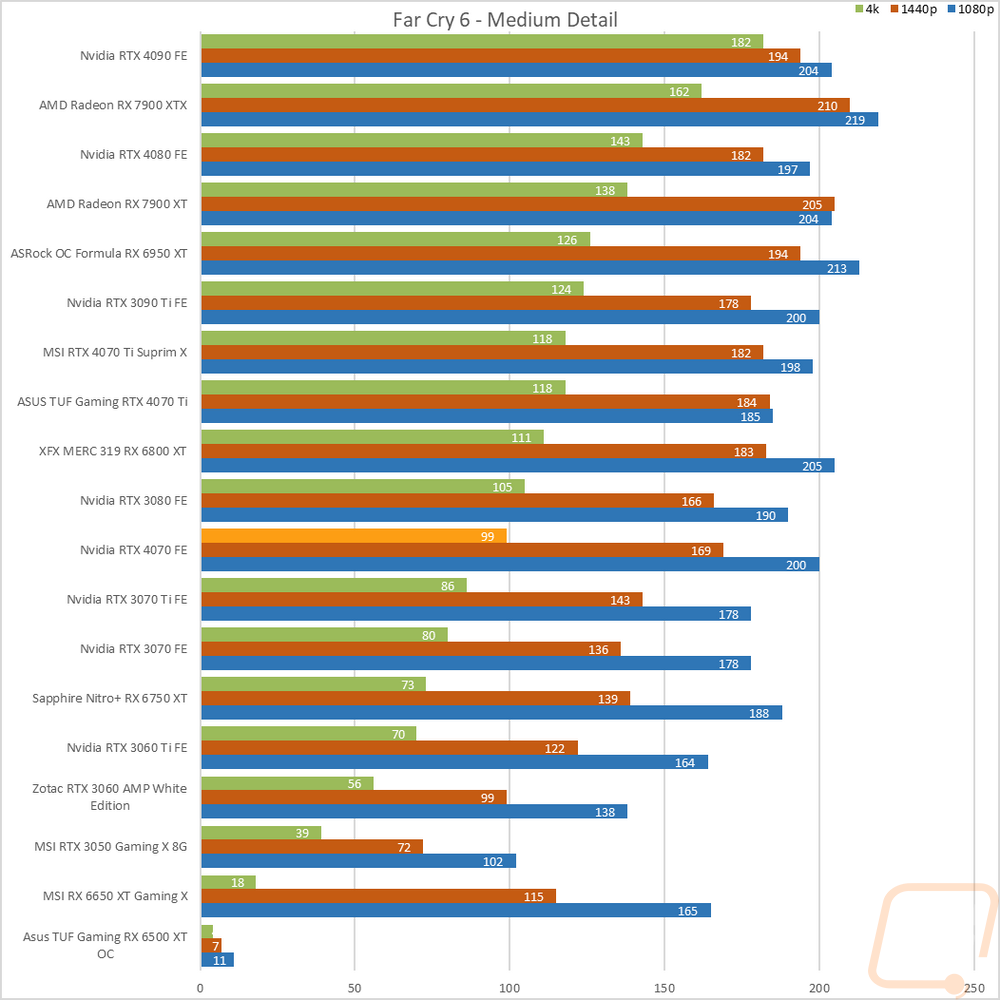
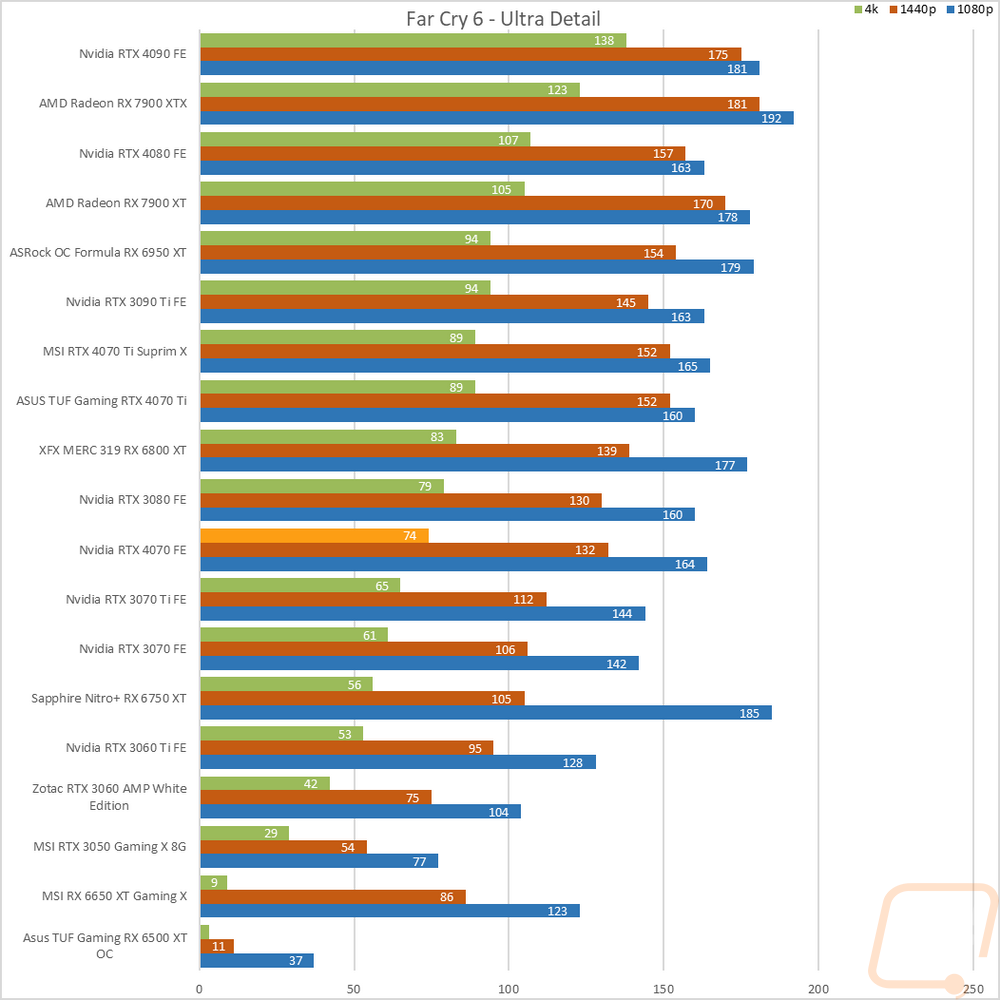
Far Cry 6 |
Built-in benchmark tested at 1080p, 1440p, and 4k with the Ultra and Medium detail settings |
|
V-Ray 5 |
V-Ray 5 benchmark us run with CUDA and RTX settings on cards that support it |
|
Boundary Benchmark |
Testing different DLSS detail levels on cards that support it. All testing is done at 4k with RTX on |
|
Bright Memory Infinite RTX Benchmark |
Benchmark all of the different RTX detail levels. Resolution at 4k and DLSS on balanced for each test |
|
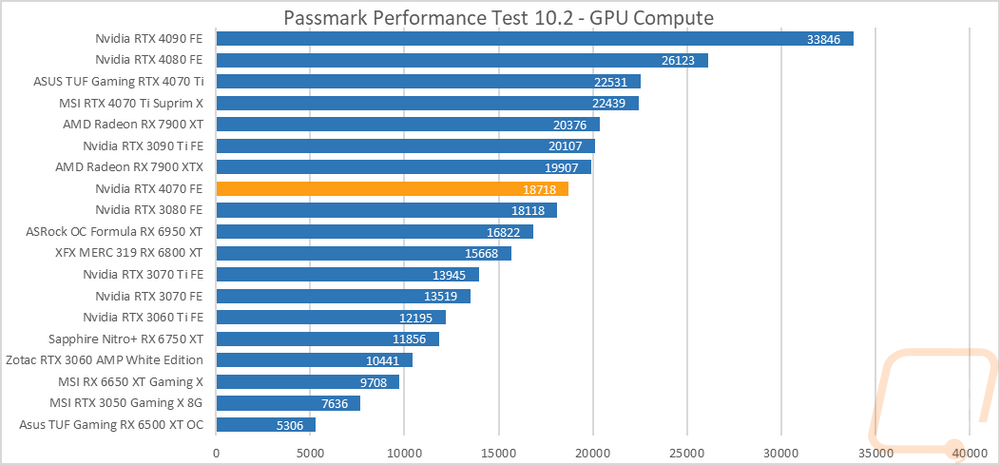
Passmark Performance Test 10.2 |
Test using the GPU Compute Score inside of PassMark's Performance Test 10.2 |
|
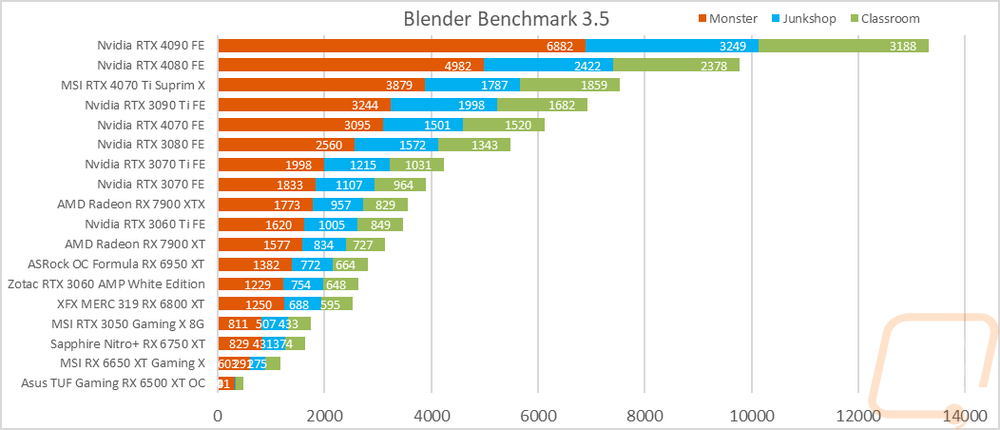
Blender |
Using the standard Blender Benchmark I run the test using the Blender 3.4 setting which tests using the Monster, Junkshop, and Classroom tests. |
|
OctaneBench 2020.1 |
OctaneBench is designed to test rendering in OctaneRender. RTX and non-RTX are both ran. This is a CUDA-only test so only Nvidia cards are tested |
|
Power Testing |
Using a PCat v2 to monitor power between the PCIe slot and the card as well as power through the power cables I test the peak power when running ADIA64, 3DMark Speed Way, 3DMark Time Spy Extreme, FarCry 6 at 4k and Ultra Detail, Watch Dogs Legion at 4K and Ultra detail, and Blender 3.4.0. The results are then averaged as well as the highest result. |
|
Noise Testing |
Our Noise testing is done using a decibel meter 18 inches away from the video card on the bottom/fan side of the card. We test at 50% and 100% fan speeds as well as a third test while under load using AIDA64's stress test. This is done using a Protmex PT02 Sound Meter that is rated IEC651 type 2 and ANSI S1.4 type 2. Tests are done set weighted to A and set to a slow response using the max function. The ambient noise level in the testing area is 33.3 decibels. |
|
Temperature Testing |
Using AIDA64, the GPU stress test is run for 30 minutes or until the result has leveled off. The test is run twice, once with the stock fan profile and a second time with 100% fan speed. During this, I also document the 100% fan speed RPM and document the delta between the fan profile and 100% fan speed as well as get thermal images. |
Synthetic Benchmarks
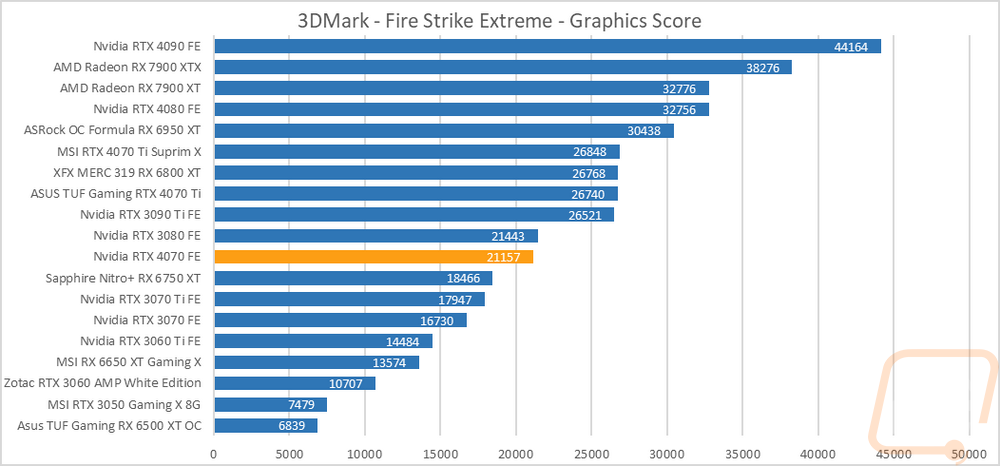
As always I like to start my testing with a few synthetic benchmarks. 3DMark especially is one of my favorites because it is very optimized in both Nvidia and AMD drivers. It's nice to not have to worry about it being favored too much either way and the repeatability of the results makes it a nice chance to compare from card to card, especially when comparing with the same GPU. For the RTX 4070 Founders Edition, we don’t have a matching RTX 4070 to compare it to just yet but I am curious how it compares to the previously released RTX 4070 Ti, the RTX 3070, the 3070 Ti, and both the RX 6800 XT and 6950 XT from AMD. This should give us a good look at both AMD and Nvidia’s last-gen models that are priced above and below the 4070 and see how big the gap is between the 4070 and the 4070 Ti.
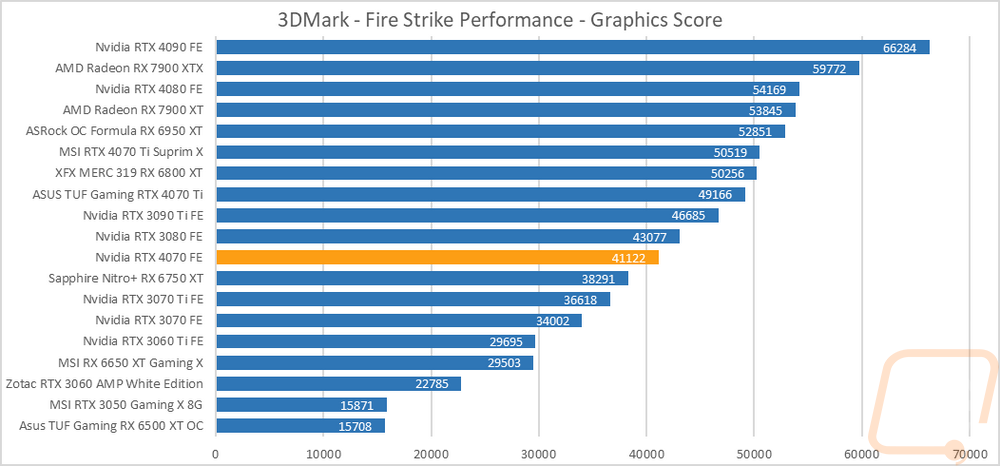
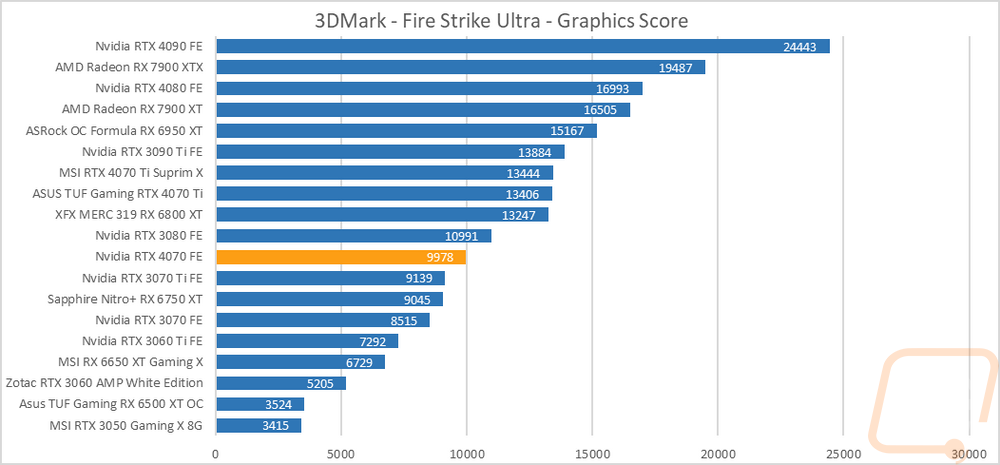
The first round of tests were done in the older Fire Strike benchmark which is a DX11 test. There are three detail levels, performance, extreme, and ultra. The RTX 4070 Founders Edition came in behind the RTX 3080 in all three of the Fire Strike tests and ran ahead of the RX 6750 XT. This means it was also ahead of the 3070 and 3070 Ti but well behind the 6800 XT and 6950 XT which in the case of the 6950 XT was almost 10,000 points higher in two of the three tests.
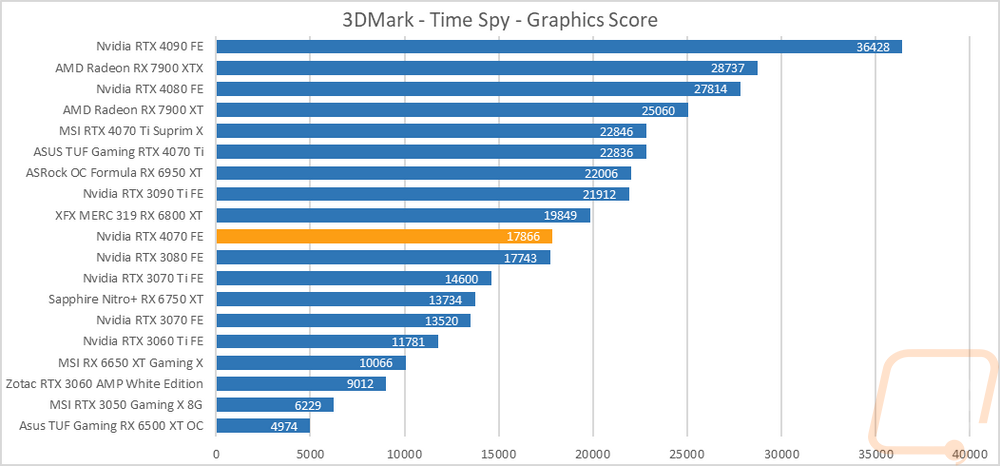
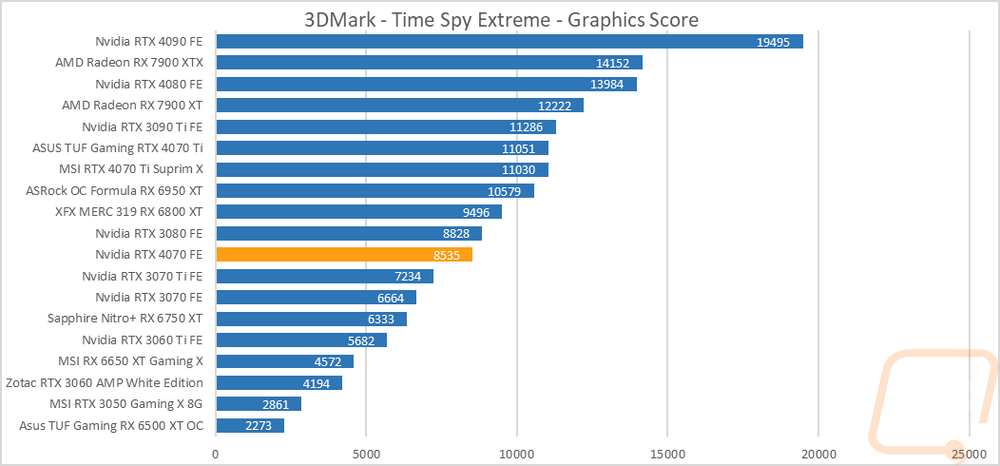
The next two were both based on the Time Spy benchmark. One is the standard test and then there is the extreme detail level. Both of these tests are a little newer and utilize DX12. The Nvidia cards which were down in the charts for the Fire Strike tests do better here. The RTX 4070 Founders Edition edges out the RTX 3080 in the base Time Spy but is still behind it in the Extreme test. This puts it well out in front of Nvidia’s last-gen xx70 cards. This wasn’t enough to catch up to the 6800 XT or the 6950 XT which are still out in front by a good margin, but the gap is smaller at least.
I did also test using the new 3DMark Speed Way which is their latest benchmark. Speed Way is DX12 as well but combines in more future-focused tech like Ray Tracing which up until now 3DMark has only used in feature tests. Going off of Nvidia’s usage numbers a majority of 4000 Series card owners are utilizing both DLSS and RTX when it is available so this may be a better look at what Nvidia owners will see, at least in games that have those features. The RTX 4070 Founders Edition scored a 4470 which put it behind the 3080 but surprisingly is in front of the AMD 6950 XT.
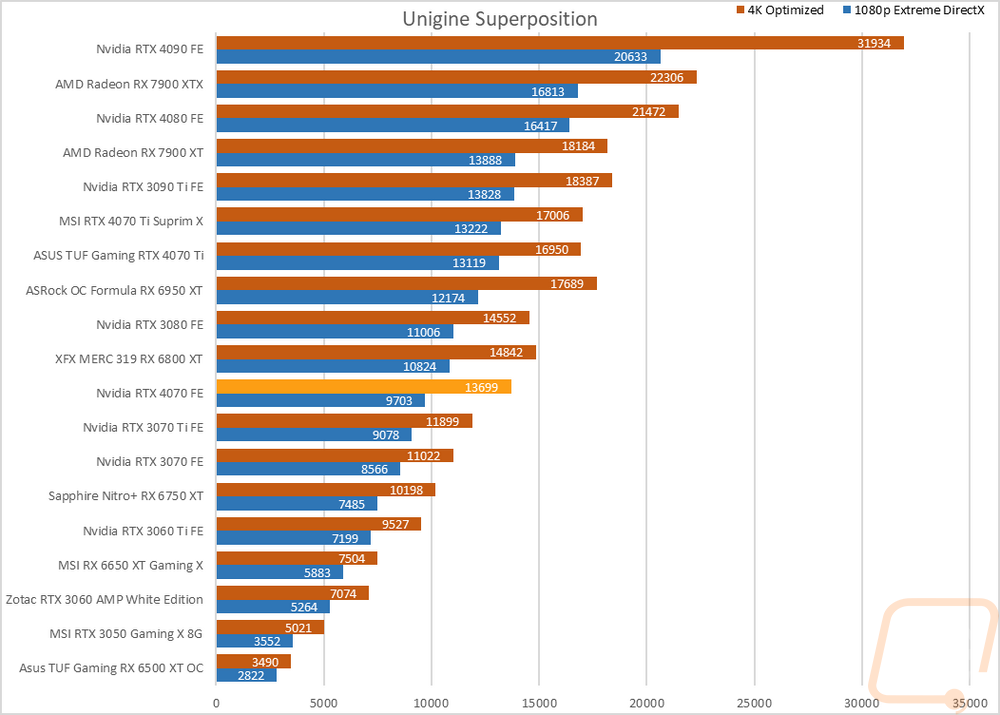
The last test was using the Unigine-based Superposition benchmark and I tested at 1080p with the extreme detail setting as well as the 4K optimized setting. In the extreme detail setting the RTX 4070 Founders Edition sits behind the 6800 XT from AMD in this test on both the 1080p and 4 results. It is out in front of the last generation 3070 Ti and close to the RTX 3080 for the 4K result at least.
VR Benchmarks
As for Virtual Reality, I love it but it is more demanding than traditional gaming. This is partially because of the resolutions needed to render for two eyes and because they render more than what is immediately visible. But also because of post effects to get the proper “fisheye” effect for it to look proper in your eyes with the HMD. You also have to have much higher expectations for frame rates in VR, skipping frames or lower FPS can cause motion sickness in VR. Because of that, I ran a few tests.
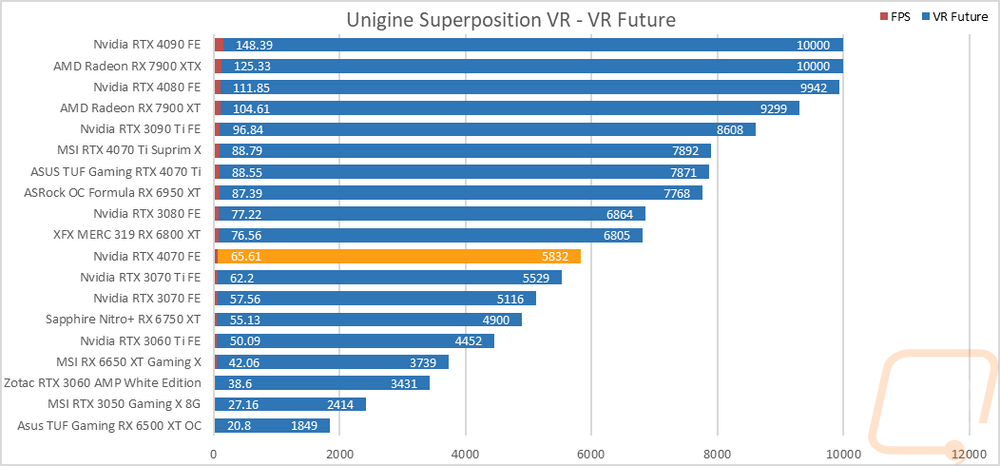
My first test was again in Superposition. This time I tested the VR Future test using the Oculus resolution. I have also included the average frame rate as well which is important for the cards at the top of the chart because for some reason Superposition is capped at 10,000 for its scores and that doesn’t show the performance gap in those cards at the top. The RTX 4070 Founders Edition doesn’t have to worry about that however at it scored a 5832. This puts it 1000 points behind the 6800 XT and surprisingly close to the 3070 Ti for this test.
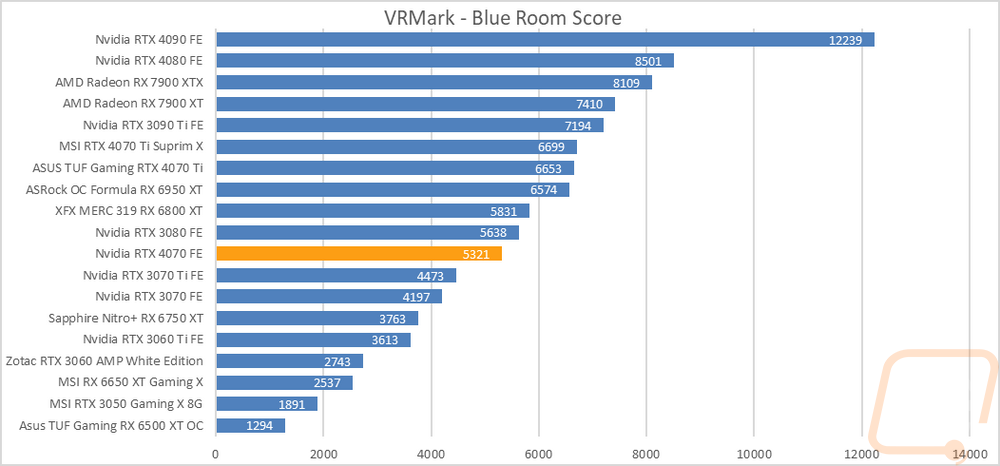
My second round of VR testing was in VRMark which has three tests that are similar to the VR tests in Superposition. I only focused on just the most demanding test called Blue Room which is looking more at future VR performance. The RTX 4070 Founders Edition landed in around the same spot for the VRMark test as well with its 5321 score. This put it right in between the RTX 3080 and RTX 3070 Ti with the AMD 6800 XT and 6950 XT both ahead of it.
In-Game Benchmarks
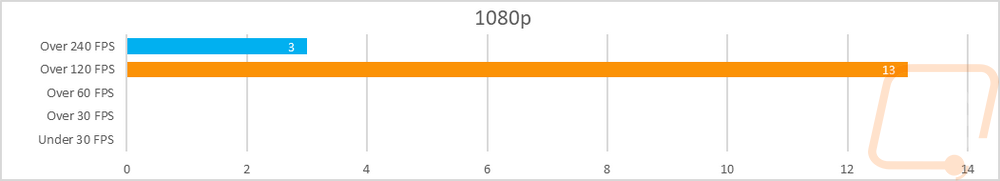
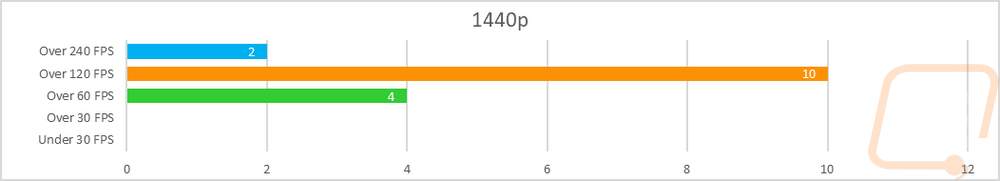
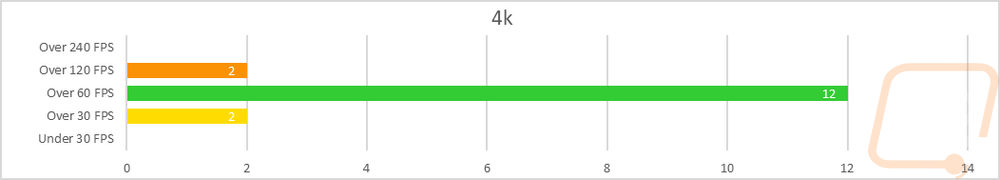
Now we finally get into the in game performance and that is the main reason people pick up a new video card. To test things out I ran through our new benchmark suite that tests 10 games at three different resolutions (1080p, 1440p, and 4k). Most of the games tested have been run at the highest detail setting and a mid-range detail setting to get a look at how turning things up hurts performance and to give an idea of if turning detail down from max will be beneficial for frame rates. In total, each video card is tested 54 times and that makes for a huge mess of results when you put them all together. To help with that I like to start with these overall playability graphs that take all of the results and give an easier-to-read result. I have one for each of the three resolutions and each is broken up into four FPS ranges. Under 30 FPS is considered unplayable, over 30 is playable but not ideal, over 60 is the sweet spot, and then over 120 FPS is for high refresh rate monitors.
So how did the RTX 4070 Founders Edition do overall? Well at 1080p all of the results are over 12 FPS with three reaching up over 240 FPS as well. At 1440p everything is playable as well only this time four of the results are in the 60-119 FPS range. There are two still up over 240 FPS but a majority of the results, 10 in total, were in the 120-239 FPS range. Performance falls off a lot more at 4K which isn’t a big surprise, the 4070 has two games over 120 FPS. There are two under 60 FPS and then the majority, 12 in total, were in the green 60 FPS to 119 FPS range. Overall nearly everything thrown at the 4070 ended up being playable, but 1080p and 1440p is where the 4070 will work best.
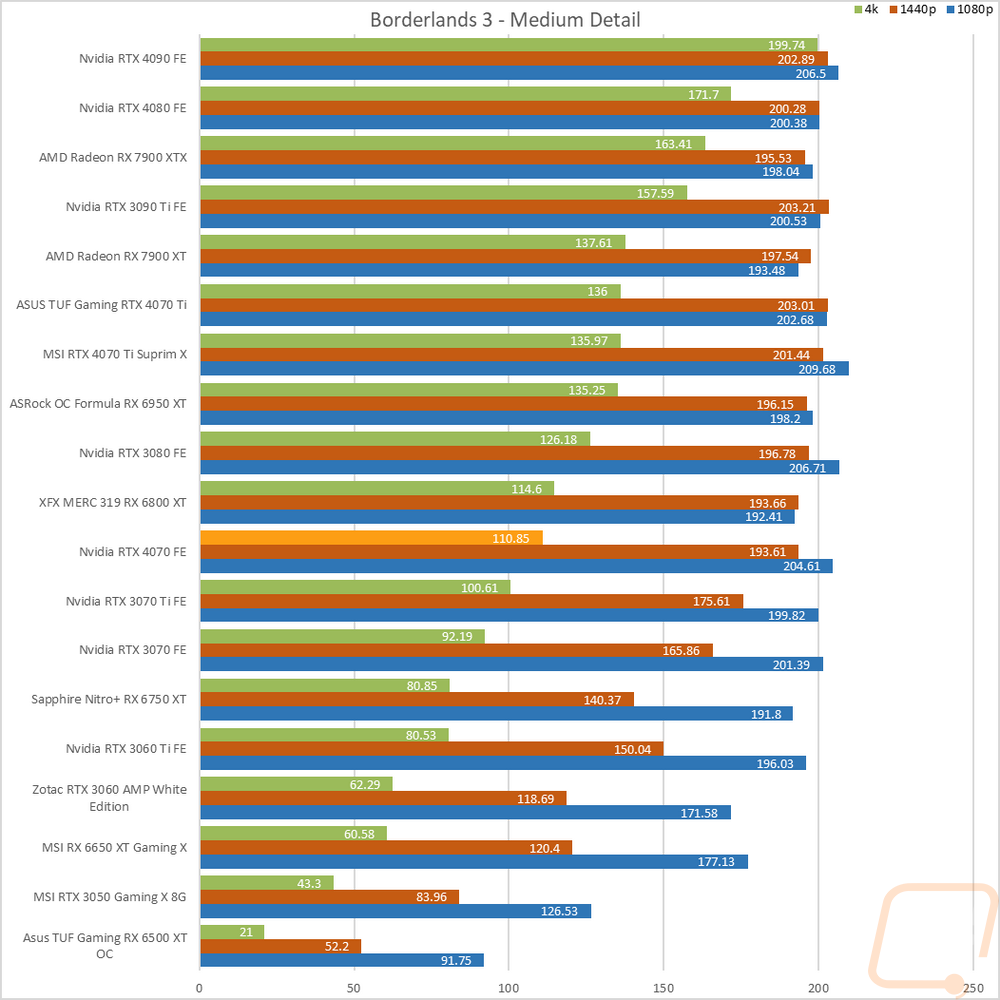
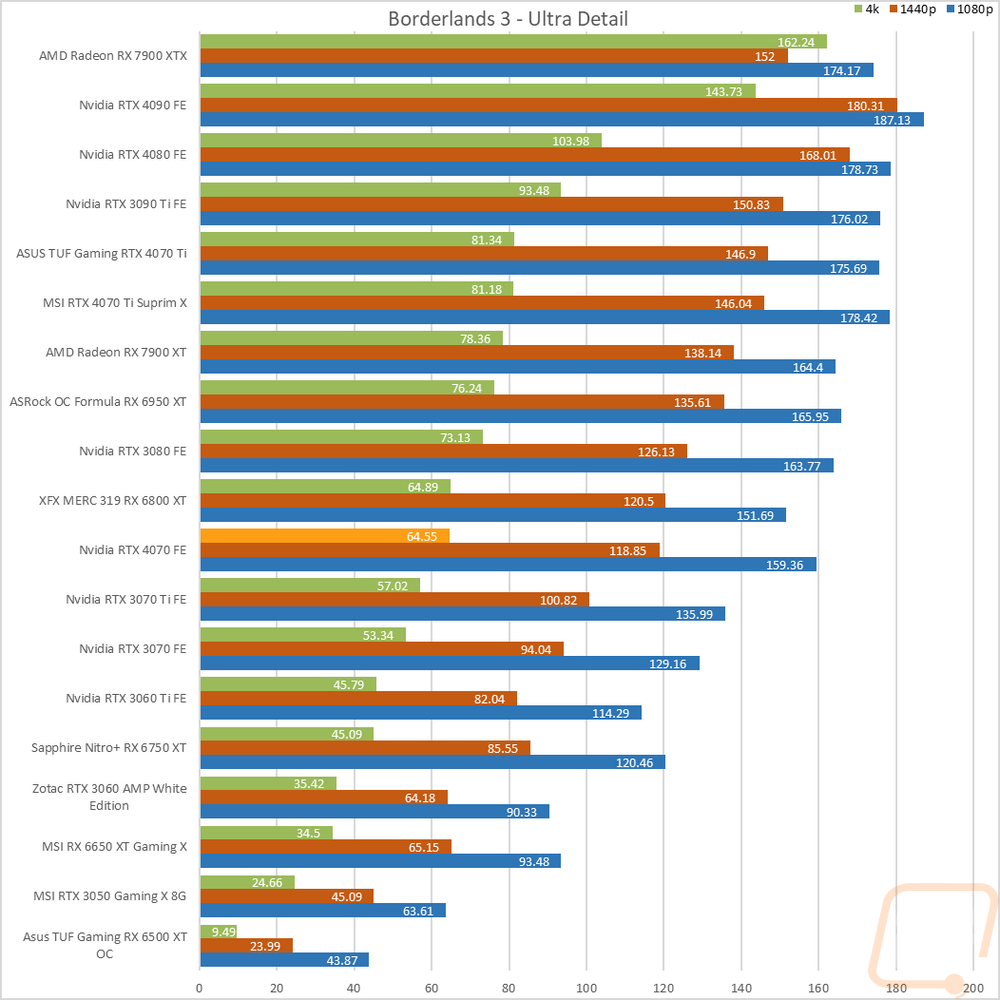
I averaged out the results from each of the three resolutions to get a look at the RTX 4070 compared to a few of the cards around in model number-wise and price-wise. I did remove CS:GO from the averages because of just how much the crazy high numbers can change the overall averages and I wanted to better show what you can expect in performance from a mix of medium/high/ultra detail benchmarks. The results are sorted by 1080p but switching that to 1440p or 4k would flip the 4070 and the 3080 around but they are very close in performance at 1080p and 1440p but the 3080 does pull away at 4K. Our game test suite doesn’t include any ray tracing or DLSS testing which as we saw in the synthetic tests is where Nvidia is able to pull away from AMD. So these are just pure raster performance and both the 6800 XT and 6950 XT did better, especially at 1440p and 4K. Digging into the individual graphs show the same thing as well and there weren’t any standouts other than that even with the 4070 we still see games being CPU limited at 1080p and sometimes 1440p like in Borderlands 3 with the medium detail. That’s even with all of our results being tested in an upgraded 13900K CPU and the latest drivers from AMD and Nvidia.
|
Average FPS (w/o CS:GO) |
1080p |
1440p |
4K |
|
RTX 3070 TI |
165.78 |
126.73 |
74.2 |
|
RTX 3080 |
188.35 |
148.9 |
89.9 |
|
RTX 4070 |
190.62 |
148.64 |
83.48 |
|
6800 XT |
197.08 |
162.35 |
92.37 |
|
6950 XT |
205.27 |
177.19 |
105.8 |
|
4070 Ti |
212.87 |
174.42 |
103.72 |
Compute Benchmarks
Now some people don’t need a video card for gaming, they need the processing power for rendering or 2D/3D production, or in some cases people who game also do work on the side. So it is also important to check out the compute performance on all of the video cards that come in. That includes doing a few different tests. My first test was a simple GPU Compute benchmark using PassMark's Performance Test 10 and the RTX 4070 Founders Edition scored an 18718. This put it in front of the RTX 3080 and behind the 7900 XTX. This also means it was in front of both the 6800 XT and 6950 XT from AMD as well.
Blender is always my favorite compute benchmark because the open-source 3D rendering software is very popular and it isn’t a synthetic benchmark. With the latest version of Blender, they redid the benchmark so we now have a new test that runs three different renderings and gives each a score. I have all three stacked together so we can see the overall performance. The RTX 4070 Founders Edition is a lot farther up in this chart than you might expect. It is in front of the RTX 3080 and behind the RTX 3090 Ti and at least for the Monster and Classroom tests it was a lot closer to the 3090 Ti than I would have expected.
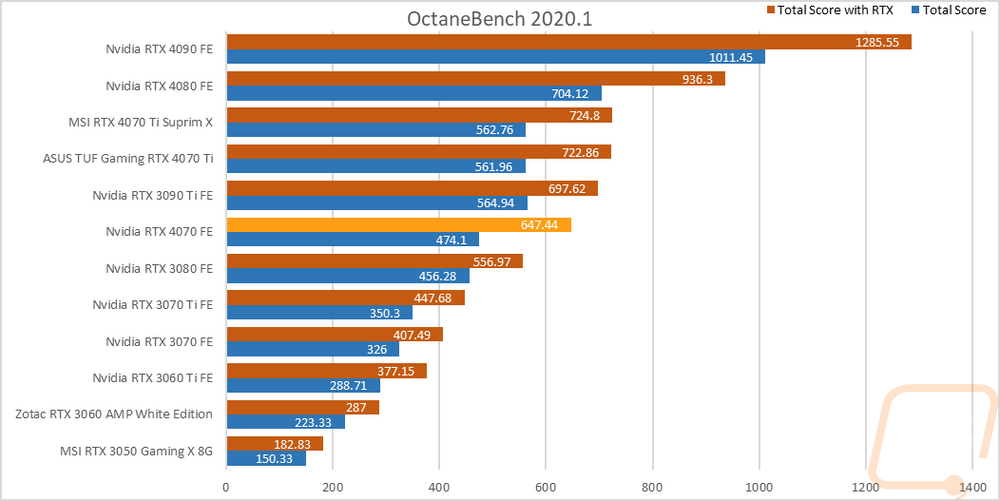
For CUDA-based cards, I also check out OctaneRender performance using their OctaneBench 2060.1 benchmark which allows me to check out both RTX and non-RTX rendering performance. Here the RTX 4070 Founders Edition is ahead of the RTX 3080 which is impressive by itself but the RTX score is more interesting, the base scores were close between the two cards but the 4070 jumps way ahead with RTX.
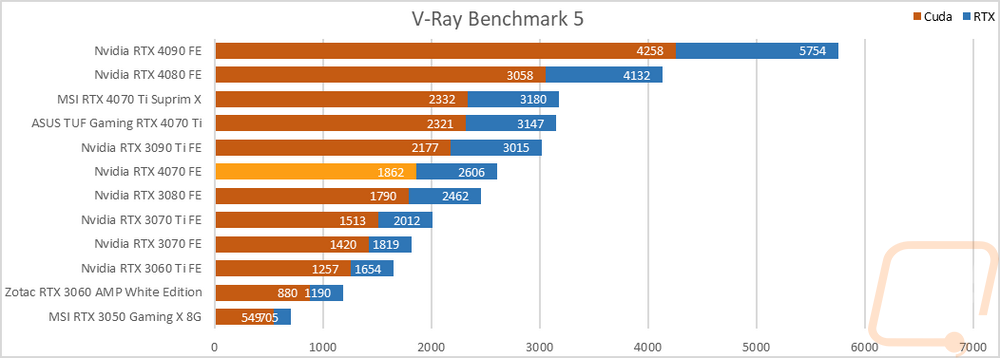
An additional CUDA-based test I also ran V-Ray Benchmark 5 to check out CUDA and RTX performance in the 3D rendering and simulation software. The RTX 4070 Founders Edition did really well here with its CUDA score and RTX scores both outperforming the RTX 3080.
RTX and DLSS
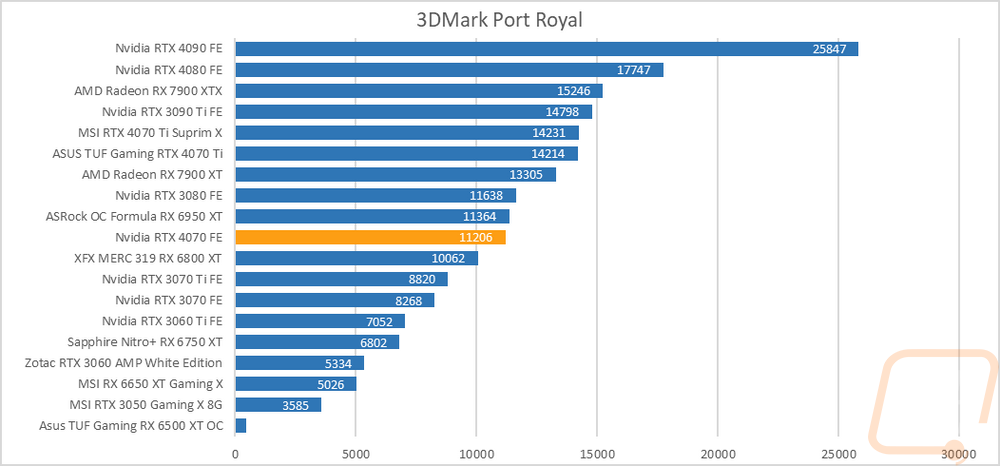
Being an RTX card I also like checking out the performance of some of Nvidia’s features. Namely the ray tracing performance and the performance improvements you can see by using DLSS combined with the tensor cores. My first test goes back to our synthetic benchmarks with 3DMark where I check out their Port Royal benchmark. This is the one test that does also have AMD Ray Tracing support which is great to get a look at how different cards including older non-RTX cards perform. The RTX 4070 Founders Edition came in just behind the 6950 XT on this test with the 3080 a little ahead of that. This put it in front of the 6800 XT and way out in front of last-generations 3070 Ti and 3070.
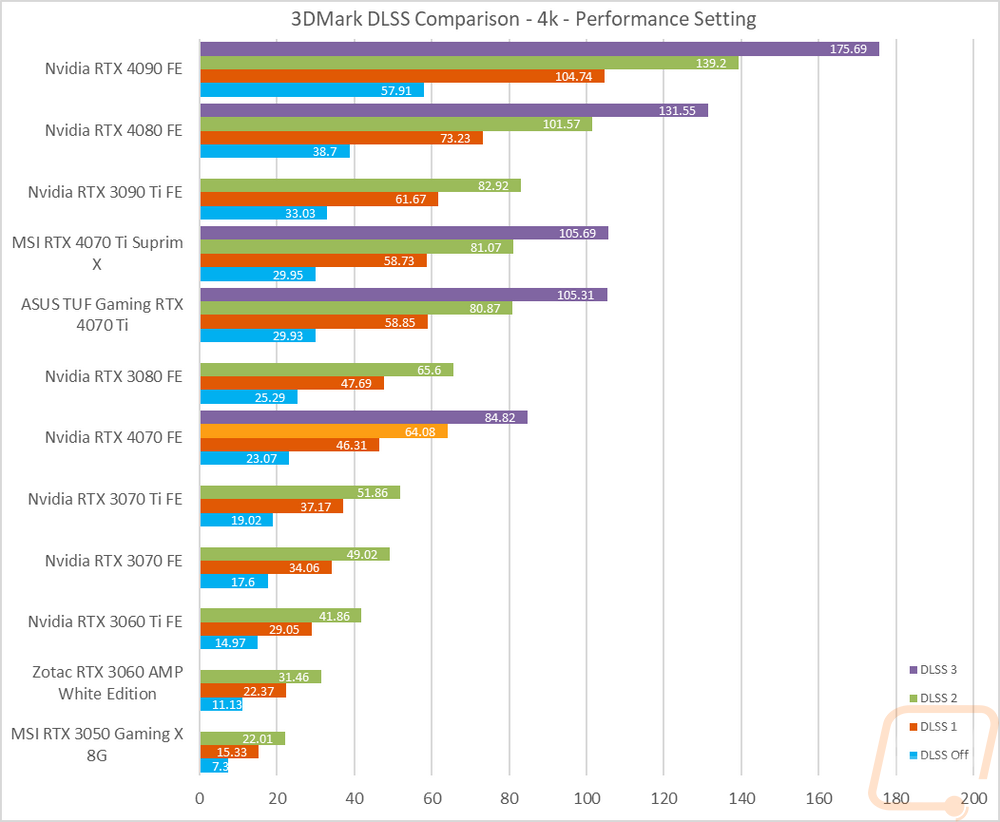
3DMark also has added in a few feature tests, one being a look at DLSS performance. For this one, I have the resolution set to 4K and I test with all three versions of DLSS as well as with it off completely. All DLSS are set to their performance setting as well to keep the results comparable. This gives us a great look at the performance improvements that DLSS has given with DLSS 3 also including frame generation. The RTX 4070 Founders Edition comes in just behind the RTX 3080 here, no surprises there but to note it does have DLSS 3 support where last generation's cards can’t run it. The performance difference that DLSS gives for each generation is impressive really. Without DLSS at all the RTX 4070 Founders Edition ran at 23 FPS, doubling that with DLSS 1. Then almost tripling that for DLSS 2 and four times for DLSS 3.
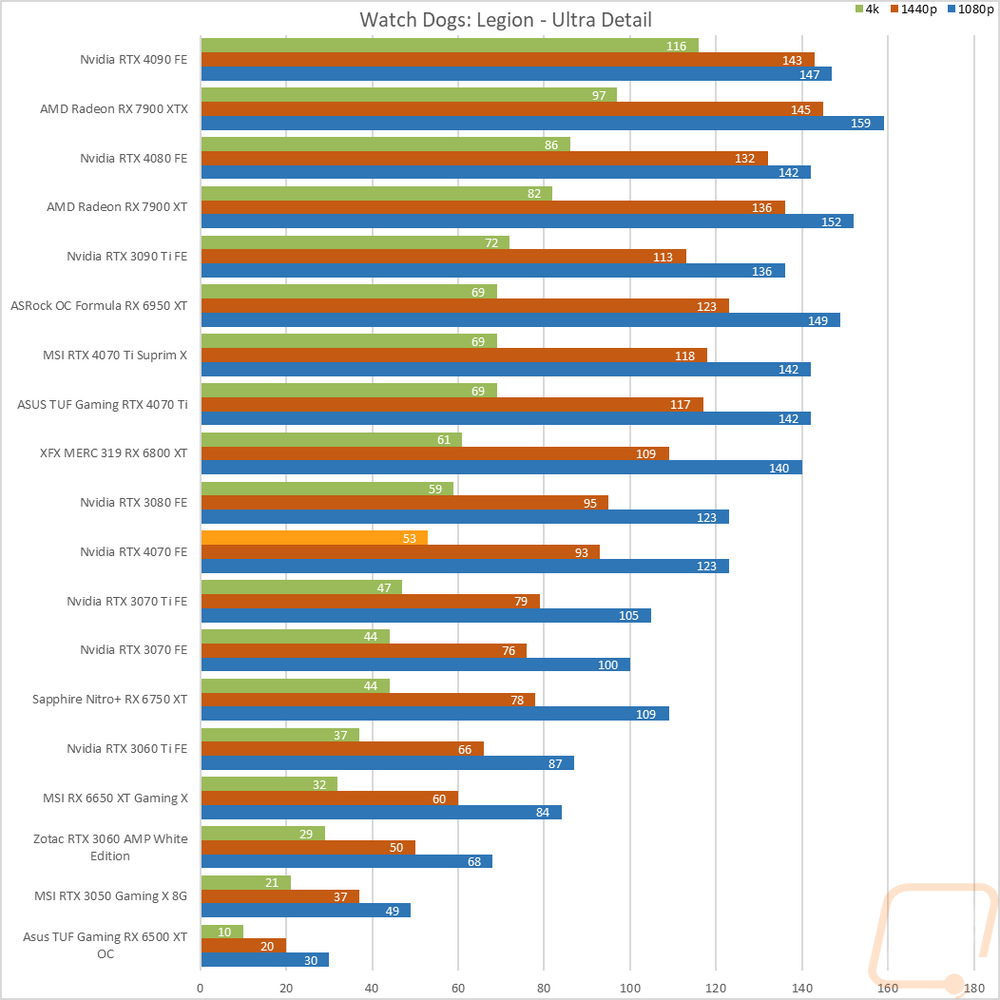
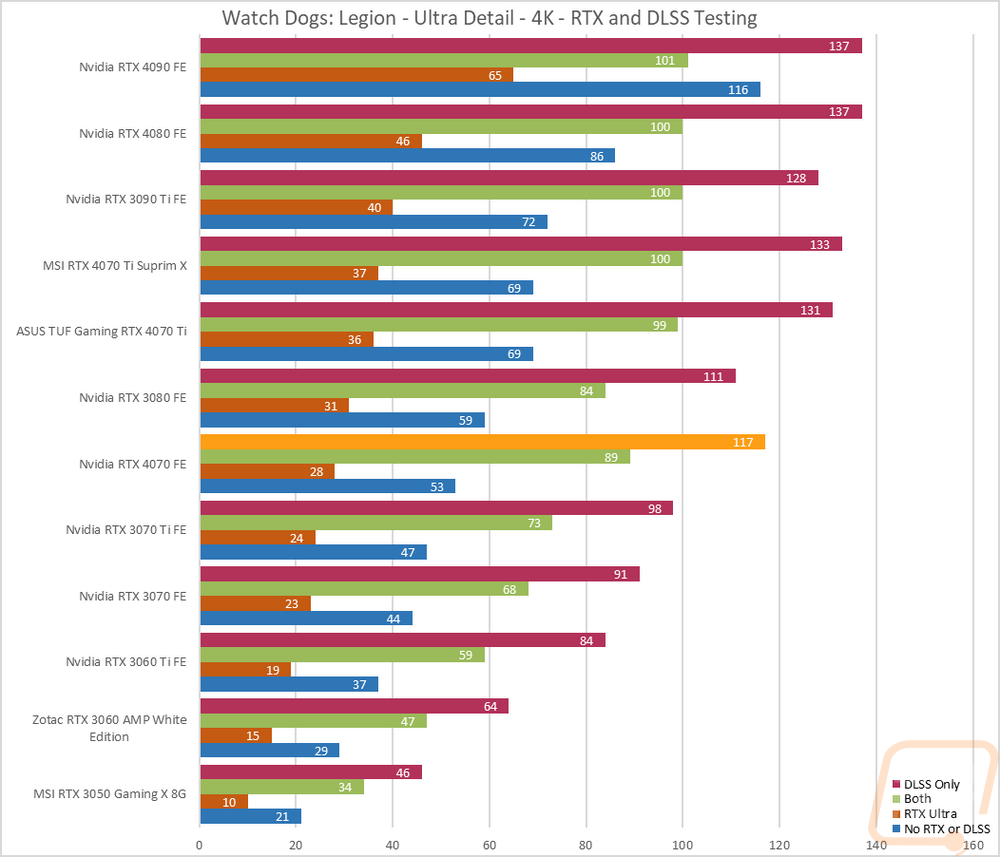
I then jumped into game tests, this time with Watch Dogs: Legion. For this one, I wanted to get an idea of the performance you will see when taking advantage of Nvidia’s RTX and DLSS features. I tested at 4k with the ultra detail setting and with ultra being the setting for DLSS and RTX when they are on as well. I then test with no RTX or DLSS on and then with RTX DLSS on and off and on together. Here the RTX 4070 Founders Edition sits below the 3080 on the graph, but only because the graph is sorted by the no RTX or DLSS performance. The DLSS and combined DLSS and RTX numbers for the 4070 are both higher than the 3080, showing how the improved Tensor cores can help with performance. The test also shows how running RTX can affect performance with the original frame rate being 53 FPS but dropping down to 28 when RTX is turned on. DLSS helps negate that though, running it combined with RTX increases performance up to 89 FPS.
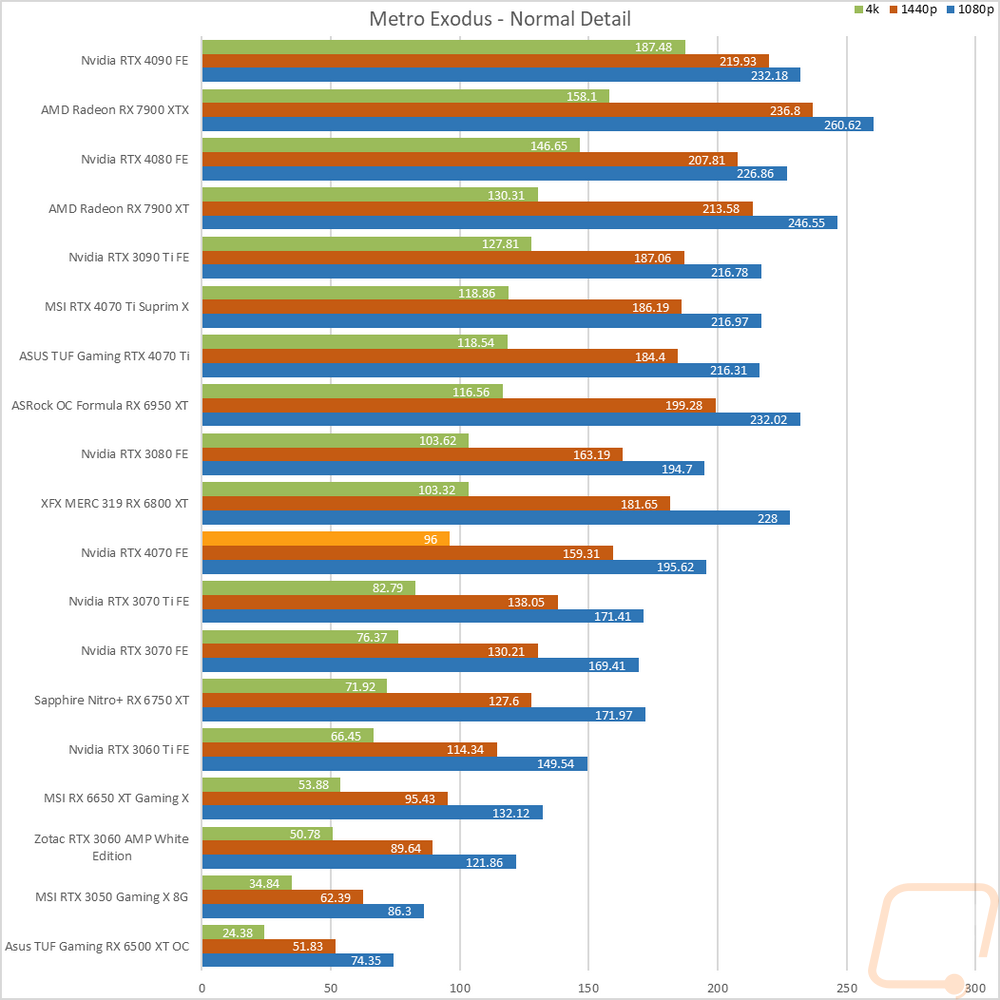
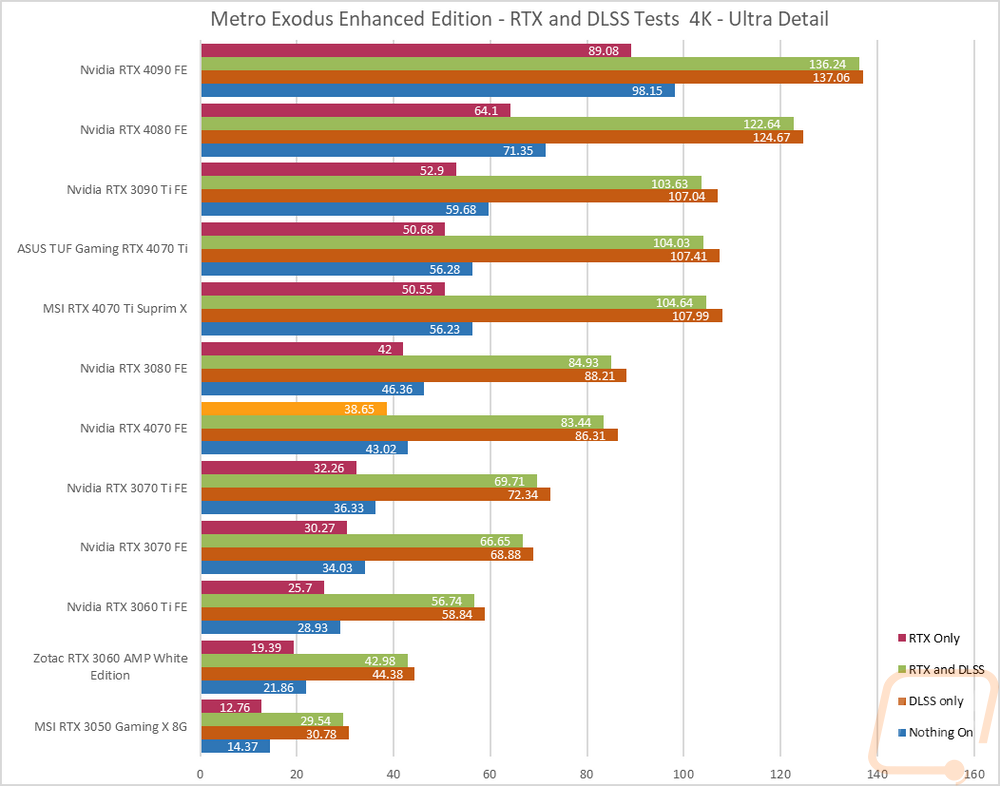
Next, I wanted to check out the performance in Metro Exodus which we have used for testing for a long time now. This test is similar as well with it set to 4K and Ultra detail, I use the included benchmark to test DLSS and RTX individually and then with them both on and both off to give us a look at overall frame rates depending on which direction you go. I should point out that this is using the Enhanced Edition where our normal benchmark uses the standard version for testing with AMD but that version DLSS no longer works. That said the RTX 4070 Founders Edition falls in between the 3080 and the 3070 Ti here and unlike with Watch Dogs DLSS doesn’t push it up past the 3080 for this game.
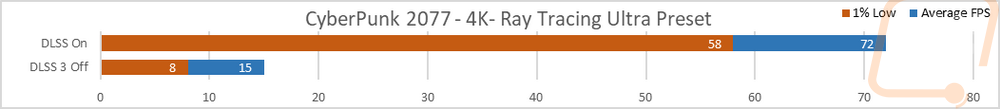
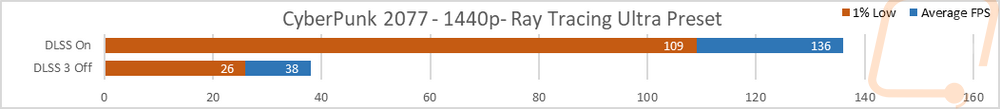
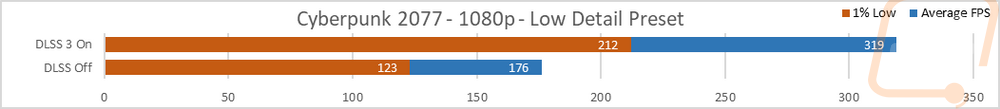
I also wanted to take a look at DLSS 3 performance as well a little more than my initial look at it with 3DMark’s benchmark. For this, I put Nvidias Frameview to the test to run a few benchmarks using the games that currently support DLSS 3. For games with a built-in benchmark, I ran the benchmark but used frameview so we could get the FPS and 1% lows and because some of the game's frame generation is messing up their in game FPS readouts. V-Sync was turned off on all of the tests because it currently causes problems with frame generation and all of the tests were done at 4K and 1440p with the highest detail settings including the highest RTX settings unless noted. DLSS 3 when there is an option was set to the performance setting as well. The first game tested was Cyberpunk 2077 and while the RTX 4070 isn’t designed for 4K use at all, the 4K performance in Cyberpunk gives us a great look at a way that DLSS 3 can help. When running at that high of a resolution and high detail settings including ray tracing the 4070 only runs at 15FPS with 8 FPS for its 1% lows. Turning DLSS 3 on including frame generation that jumps up to 72 FPS with 1% lows at 58. This takes unplayable performance and makes it playable and even smooth with the lows nearly at 60 FPS. The 1440p results were similar, taking the 4070 from 38 FPS up to 136 FPS which is a huge improvement. I also included a 1080p test where I ran at the low detail level just to get a look at the performance improvement in a situation that is CPU limited and while the improvement isn’t as big as we saw at 1440p you do jump from 176 FPS up to 319 FPS but in these CPU limited situations the 1% low performance will be lower than in other situations.
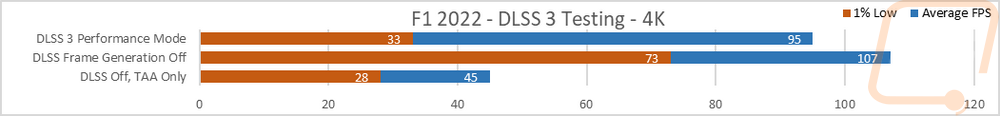
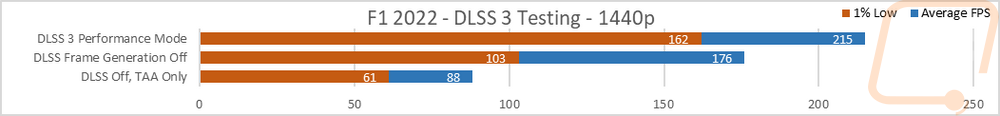
In F1 2022 I ran three tests. I tested with full DLSS, I did it again but turned off frame generation, and then tested with DLSS off and TAA on. Frame generation here was weird at 4K but seemed to work normally at 1440p. I ran this test multiple times with the same result, but at 4K turning frame generation on dropped performance. DLSS 3 alone did still help a lot however taking the 4K performance from 45 FPS and 28 FPS for the 1% lows up to 107 FPS with 73 FPS 1% lows. Taking playable but not smooth up into the smooth range. Once the frame generation issue is worked out that should step things up even higher like we see at 1440p. At 1440p the 4070 already does well at 88 FPS, but utilizing DLSS 3 doubles that for 176 FPS then frame generation adds on to the top for 215 FPS. For F1 22 the high frame rates combined with a high refresh monitor will make a big difference in the experience.
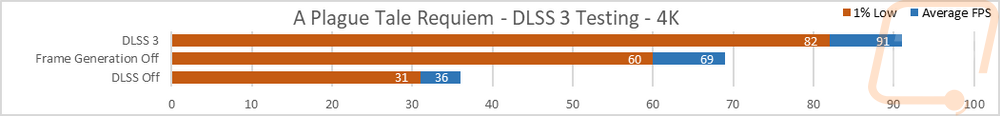
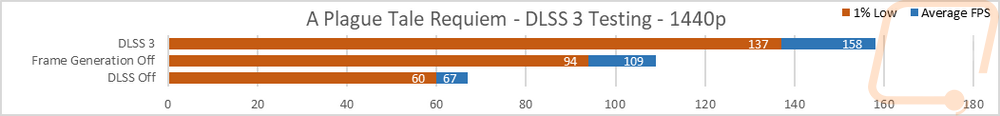
In A Plague Tale turning frame generation on showed how much it can help a lot more with DLSS 3, The RTX 4070 Founders Edition base DLSS improved performance at 4K from 36 FPS up to 69 FPS but adding frame generation into the mix went from double the performance to triple the performance at 91 FPS. The combination of the two taking the performance from barely playable to smooth. At 1440p the 4070 started in the playable range at 67 FPS and 60 1% lows but still improved on that up to 109 with DLSS 3 and 158 with DLSS 3 and frame generation.
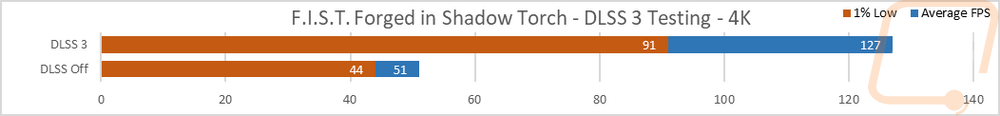
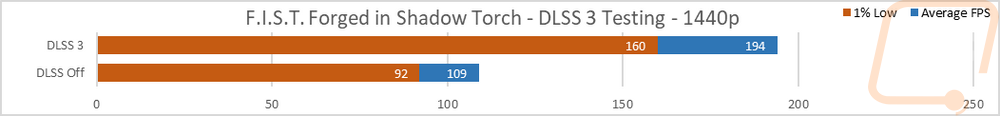
In the side scroller Forged in Shadow Torch, DLSS 3 helped take the detailed side scroller from 51 FPS at 4K up to 127 FPS at 4K and from 109 up to 194 FPS at 1440p. There is a wider gap between the average FPS and the 1% lows, but the performance improvement is still worth it.
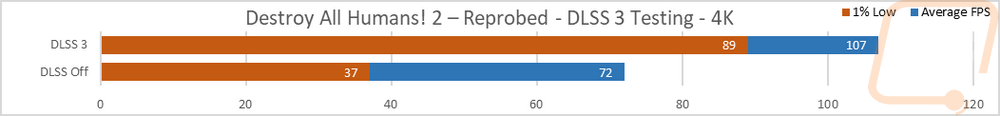
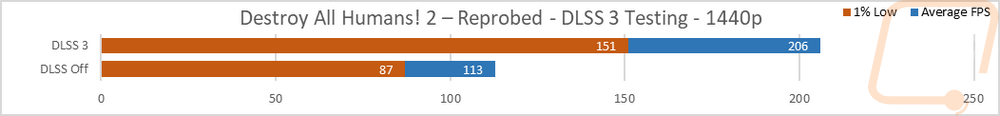
Next up was Destroy All Humans! 2 – Reprobed. The RTX 4070 Founders Edition improved from 72 FPS up to 107 FPS at 4K and from 113 up to 206 FPS at 1440p. At 4k this wasn’t enough to push the 4070 up into another class of performance but at 1440p it would be helpful if you had a high refresh rate monitor and you wanted to get the most out of it.
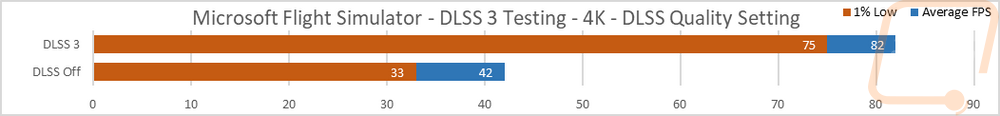
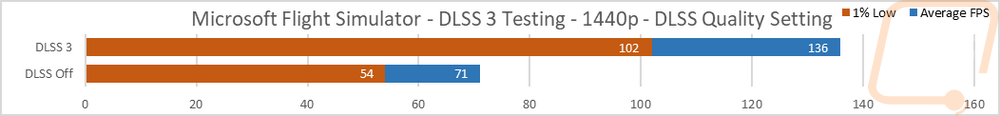
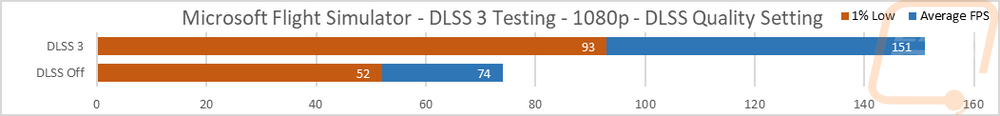
Last I took a look at Microsoft Flight Simulator and this is an interesting case because this is a well-known CPU-limited game. To keep things consistent the test used the landing test run over Sydney. With DLSS off at 4K the RTX 4070 averaged 42 FPS but DLSS 3 nearly doubled that up to 82 FPS taking 4K from playable but choppy up to playable and smooth. The improvement was similar at 1440p as well going from 71 FPS up to 136 FPS, we can see that there is some CPU limitation at 1440p with the 1% low gap on the DLSS 3 result not staying as tight as the non-DLSS result. That is even more noticeable at 1080p where the 4070 more than doubles performance even while being completely CPU limited going from 74 FPS up to 151 FPS.
Cooling Noise and Power
For my last few tests, rather than focusing on in game performance, I like to check out other aspects of video card performance. These are also the most important ways to differentiate the performance between cards that have the same GPU. To start things off I took a look at power usage.
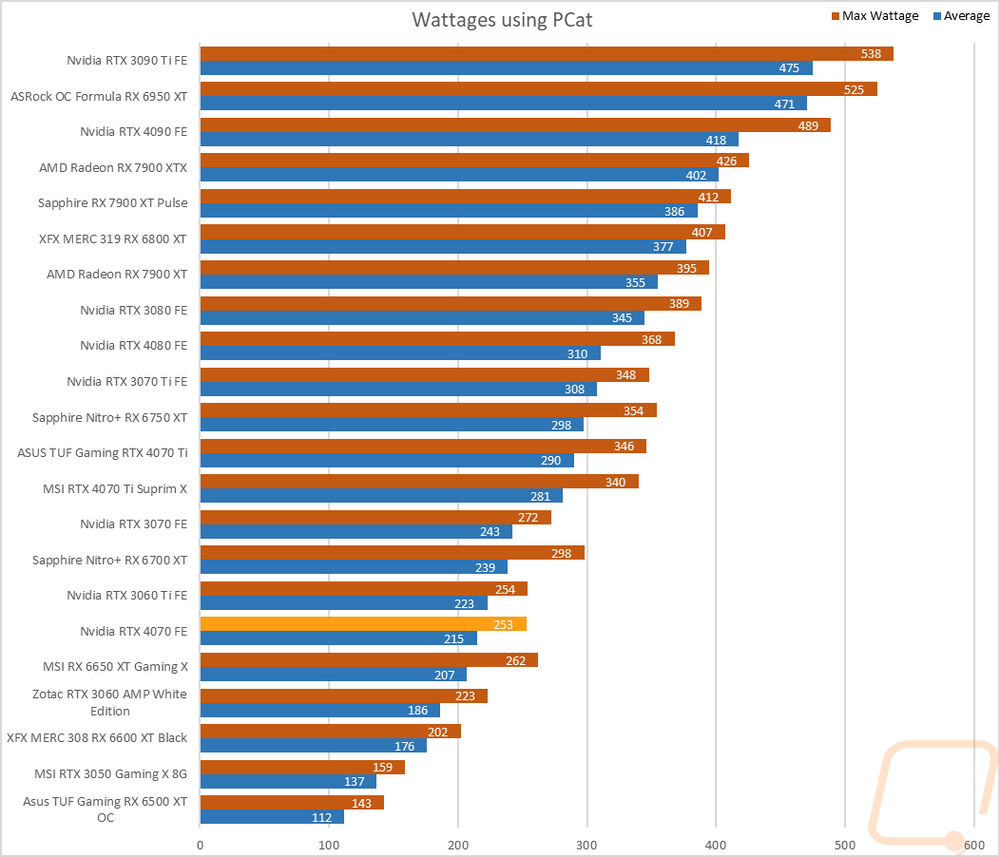
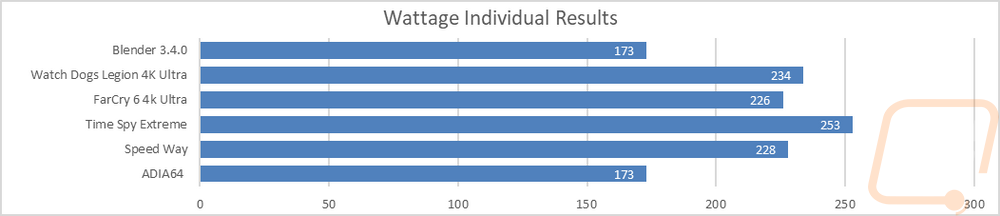
For this, our new test setup utilizes the Nvidia-designed PCat v2 along with cables to handle both traditional 6 or 8-pin connections as well as the new 12VHPWR. The PCat also utilizes a PCIe adapter to measure any power going to the card through the PCIe slot so we can measure the video card wattage exclusively, not the entire system as we have done in the past. I test with a mix of applications to get both in game, synthetic benchmarks, and other workloads like Blender and AIDA64. Then everything is averaged together for our result. I also have the individual results for this specific card and I document the peak wattage result as well which is almost always Time Spy Extreme. For the RTX 4070 Founders Edition, its max wattage was 253 and averaged an impressive 215 watts across all of the tests. This put it right with the RTX 3060 Ti for the peak wattage result but sits 8 watts lower than that with the average. For comparison the RTX 3080 which the 4070 performed similarly averaged 345 watts and peaked at 389 watts. The RTX 4070 is impressively power efficient.
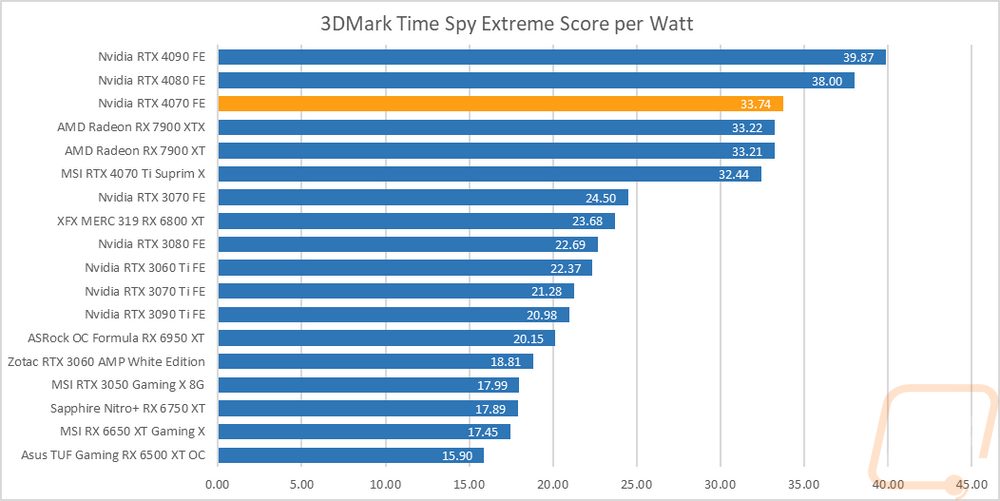
With exact peak wattage numbers when running Time Spy Extreme I was also able to put together a graph showing the total score for each watt that a card draws which gives us an interesting look at overall power efficiency in the popular and demanding benchmark. This reinforces what I was saying before about the RTX 4070’s overall power efficiency with it running up near the top of the chart only behind the 4080 and 4090 in score per watt.
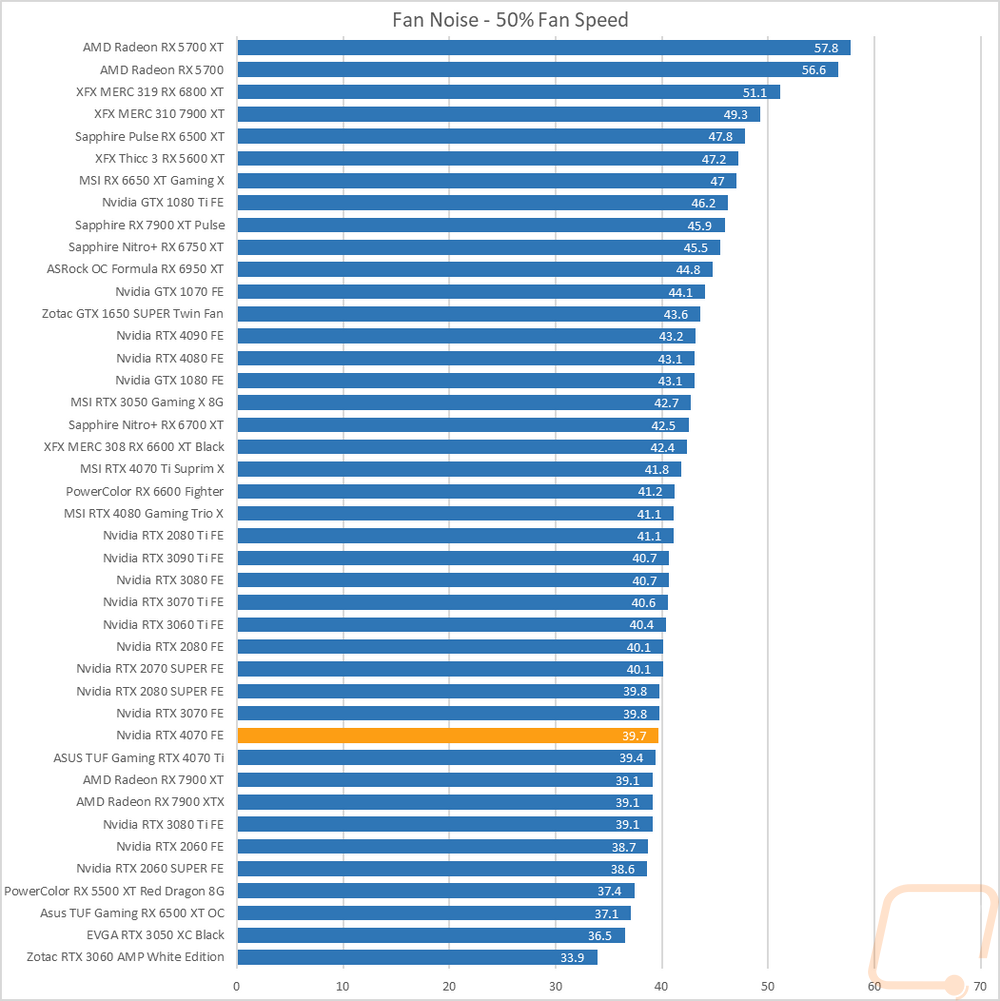
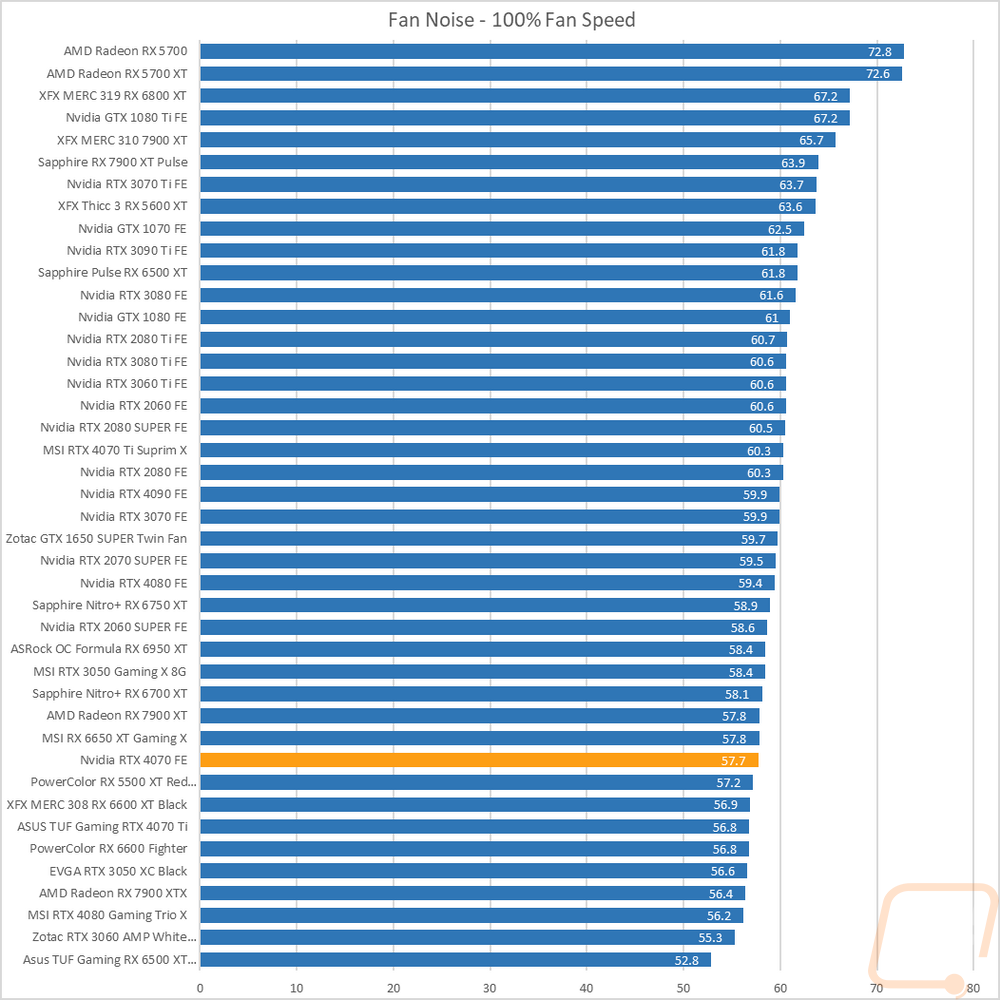
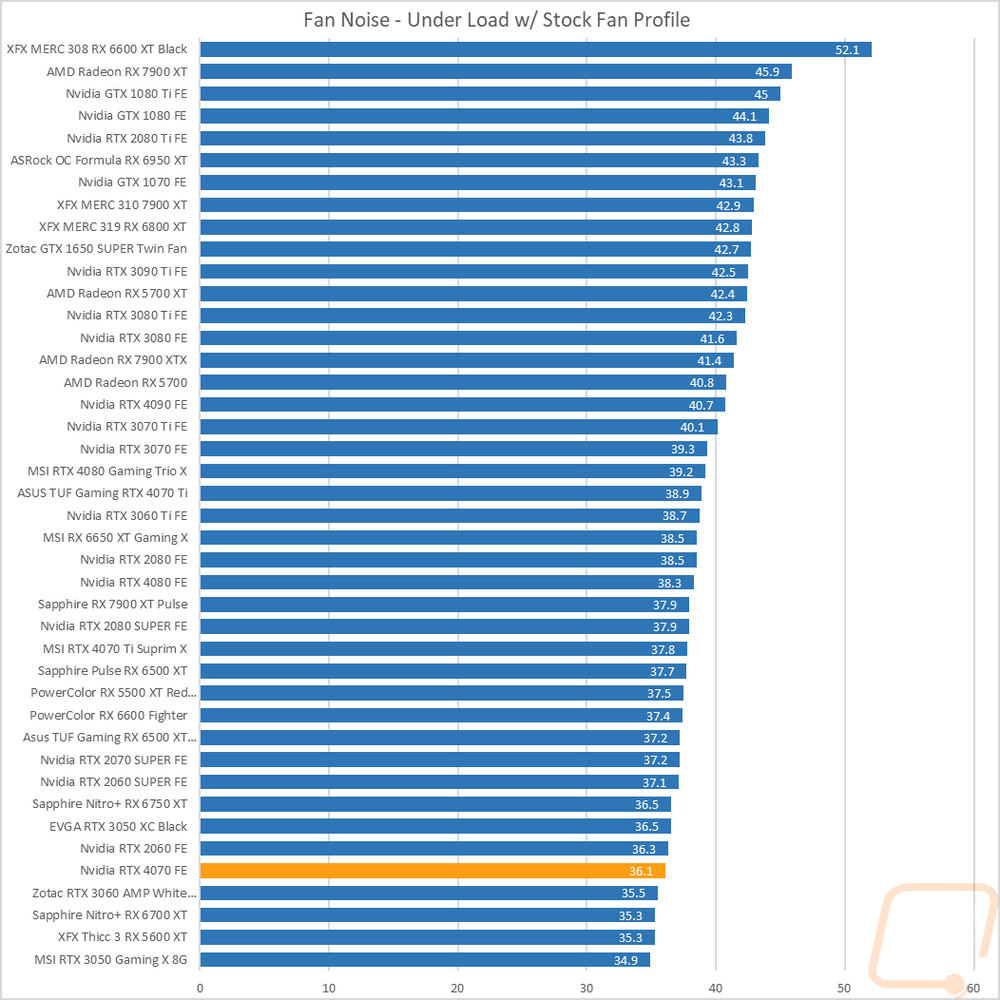
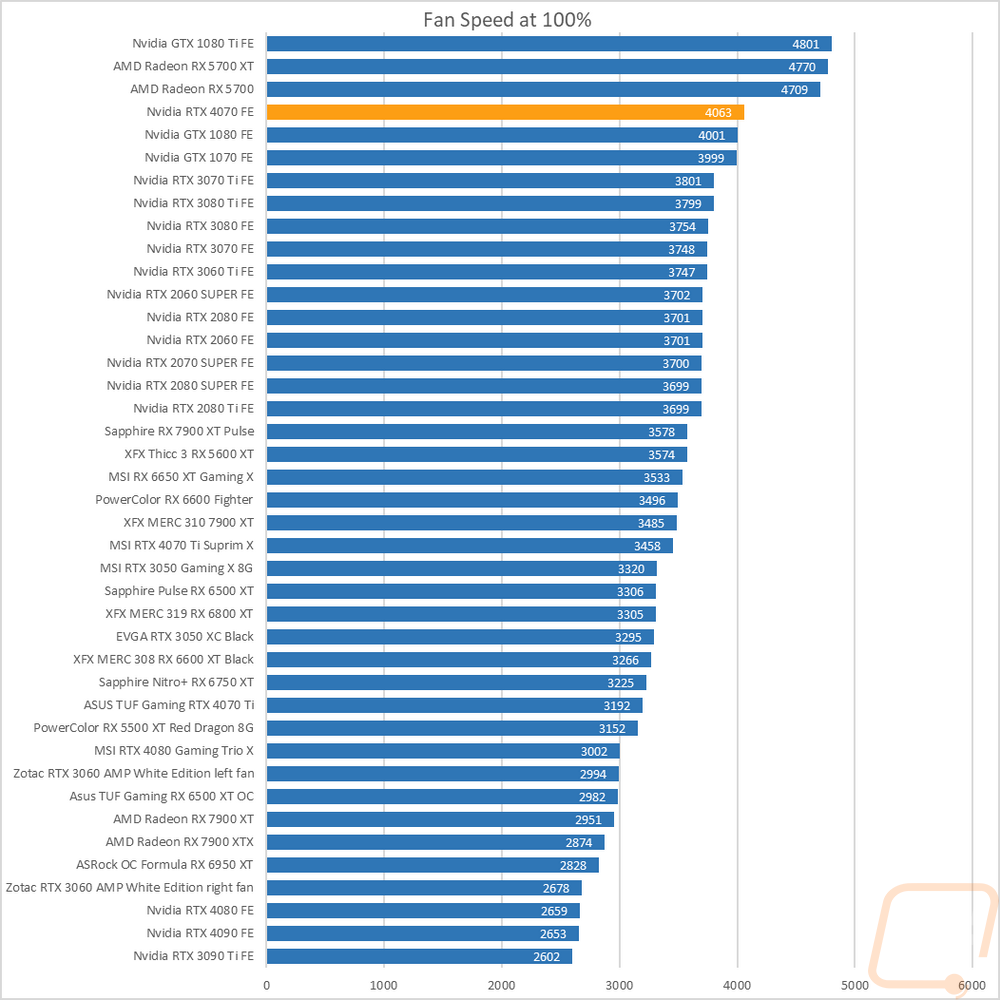
My next round of tests were looking at noise levels. These are especially important to me because I can’t stand to listen to my PC whirling. Especially when I’m not in game and other applications are using the GPU. For my testing, though I first tested with the fan cranked up to 100% to get an idea of how loud it can get, then again at 50% to get an idea of its range. The RTX 4070 Founders Edition did well in both tests with the card running down in the bottom ¼ of our charts in both results. This is surprising when we also check out the max fan RPM chart where the 4070 Founders Edition is near the top with its two fans running at 4063 RPM. Typically the overall RPM matches up with the noise levels but Nvidia has done a great job with the design to keep that down. I also take a look at noise performance while under load. For that when running AIDA64’s stress test I wait until the temperature of the card has leveled off and then measure how loud things are when the card is at its worst-case scenario with the stock fan profile. Here the RTX 4070 Founders Edition is again down at the bottom of the chart at 36.1 decibels, running with the lowest-end GPUs.
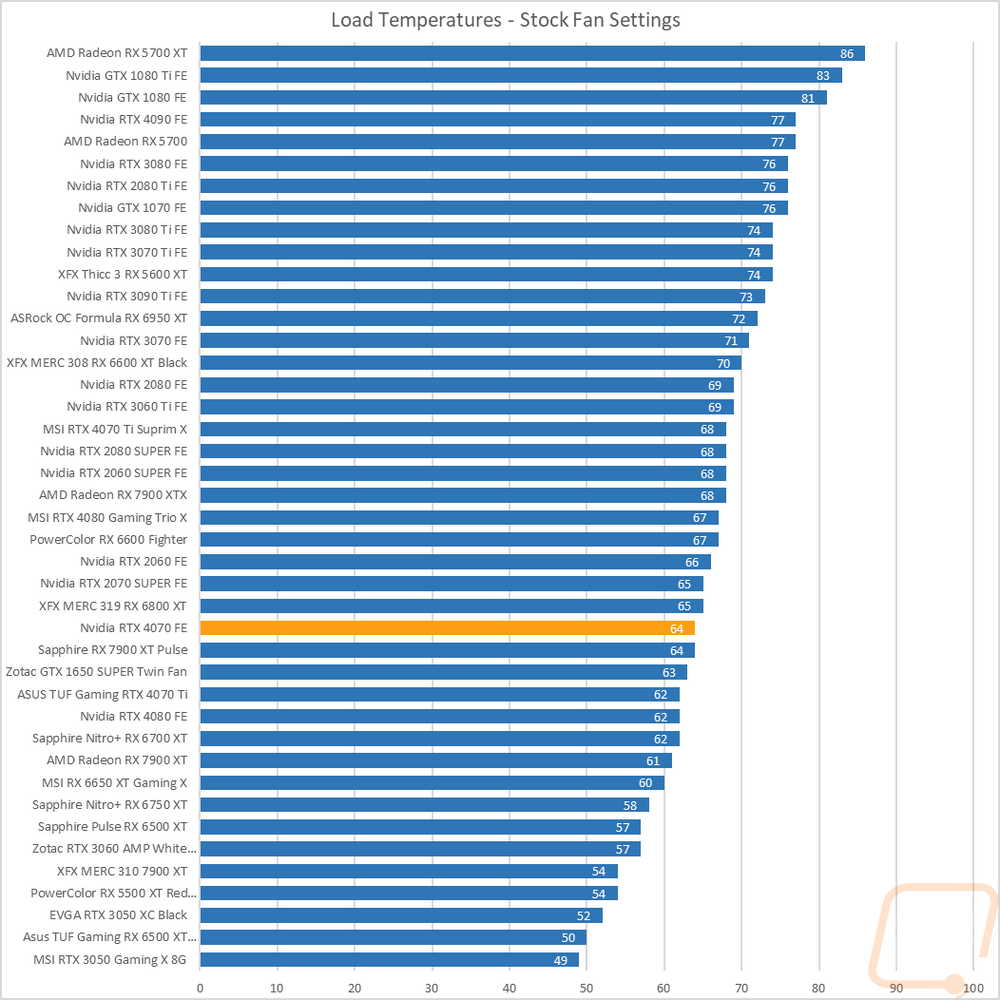
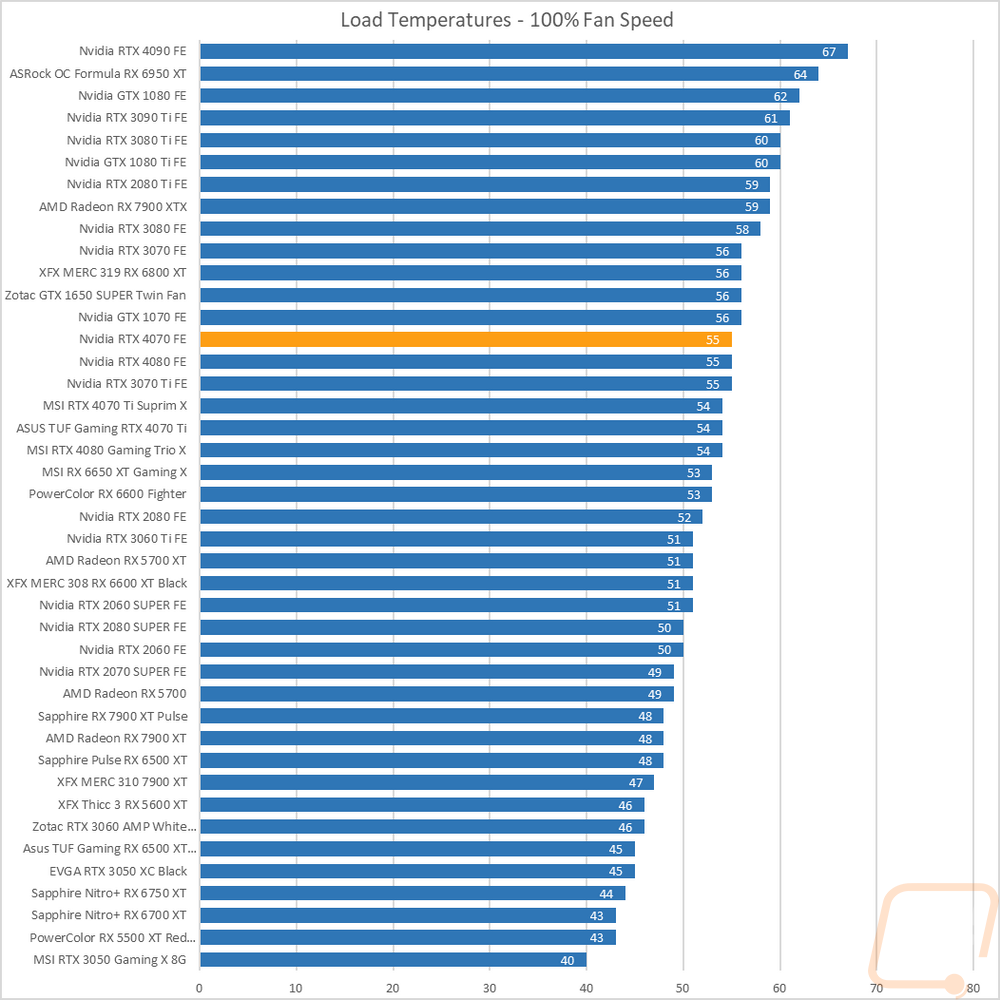
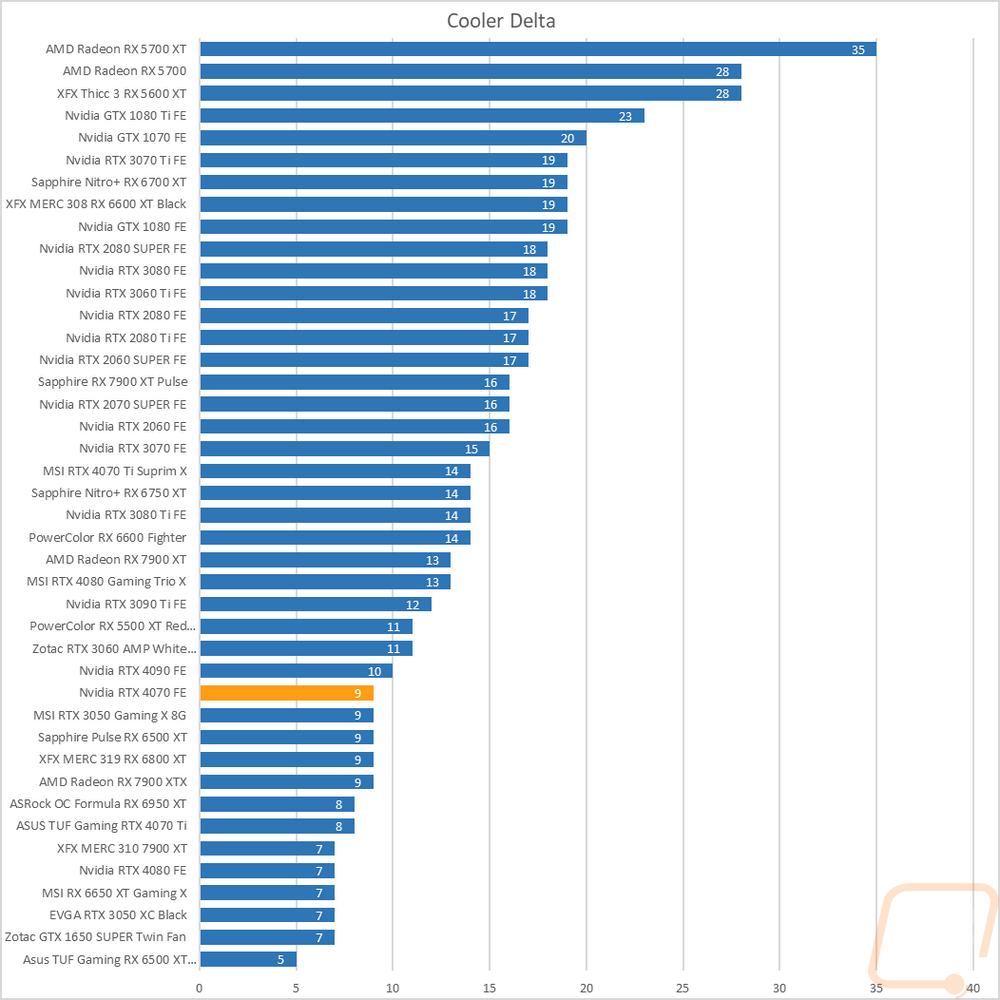
To finish up my testing I of course had to check out the cooling performance. To do this I ran two different tests. I used AIDA64’s Stress Test run for a half-hour each to warm things up. Then I documented what temperature the GPU leveled out at with the stock fan profile and then again with the fans cranked up to 100%. With the stock profile, the RTX 4070 Founders Edition peaked at 64 degrees which was in the bottom 1/3 of the chart. Given its lower TDP, this isn’t too big of a surprise but with the more compact cooler design used for this card, I was worried it wouldn’t be the case. Then with the fans cranked up, the 4070 Founders Edition dropped down to 55 degrees for a delta between the two of 9 degrees. This wasn’t as great and is farther up in the chart with a lot of the aftermarket cards having a lot more headroom. Overall though it looks like Nvidia got their fan profile spot on with it running quiet and cool and not leaving too much headroom left but if you needed to overclock to get a touch more performance there is still room.
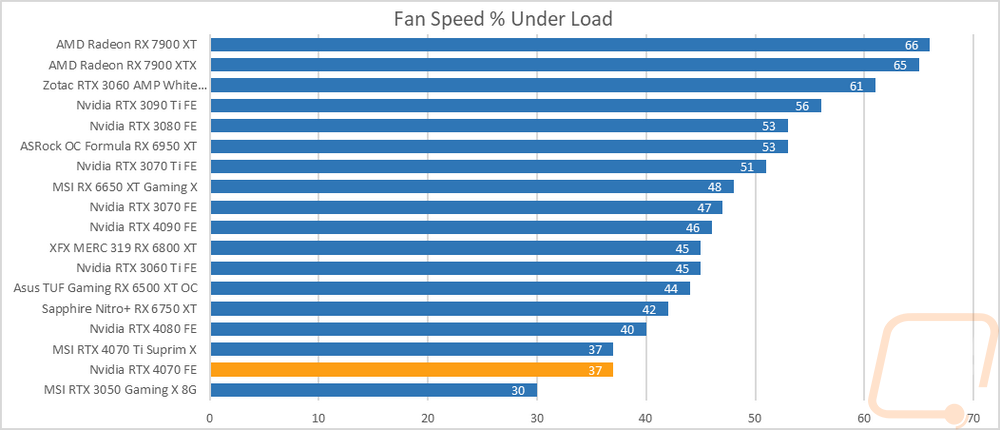
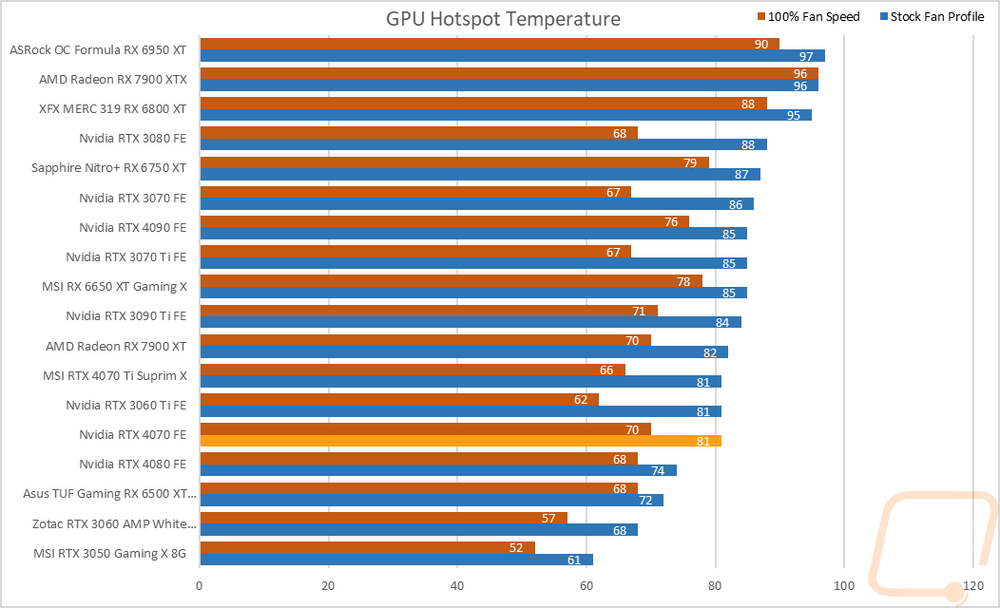
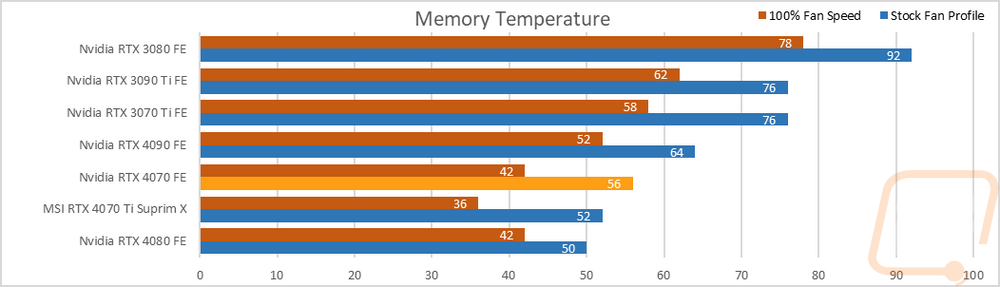
While testing I did also include a few other results while doing the same AIDA64 workload with the stock fan profile and 100% fan speed. To start off I noted where the fan speeds were running when the temperatures leveled off in the stock fan profile test and for the RTX 4070 Founders Edition, the two fans were running at 37% fan speed to keep things running that cool. This is why the noise levels were so good as well with just one card running lower than that. I also noted the GPU Hotspot temperatures and the memory temperatures. The memory temperatures only apply to the cards that have that sensor which as of right now are just the highest-end 3000 Series Nvidia cards and all of the 4000 Series Nvidia cards to date. The 4070 Founders Edition had its GPU hotspot at 81c with the stock fan profile which was down near the bottom of the chart, with the fans at 100% it didn’t drop as much as some of the others running at 70c. Then for the memory, the stock fan profile had the memory running at 56c and cranking the fans up was 42c, again both near the bottom of the chart.
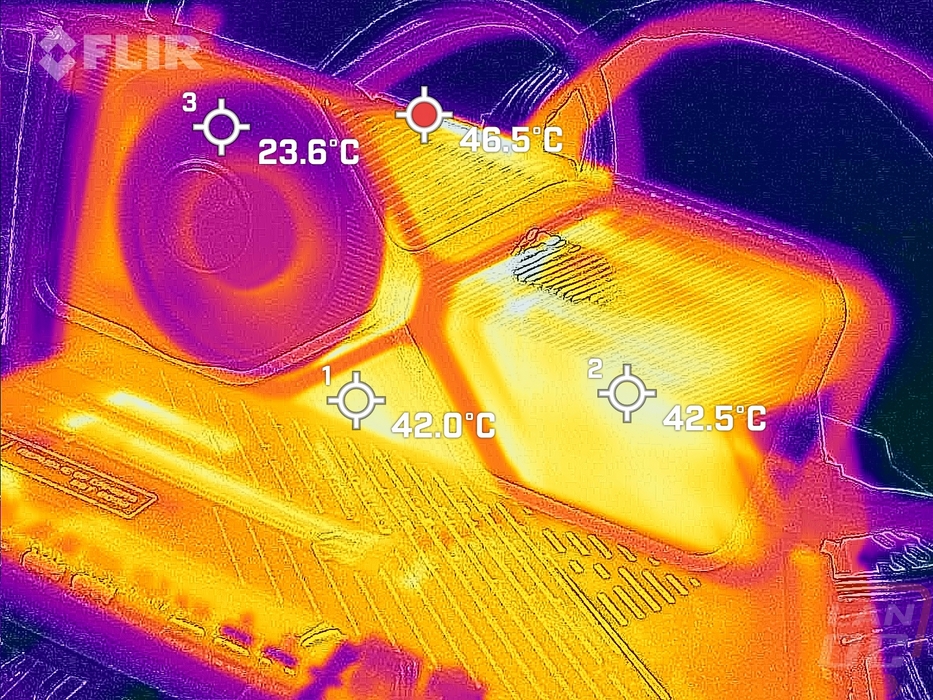
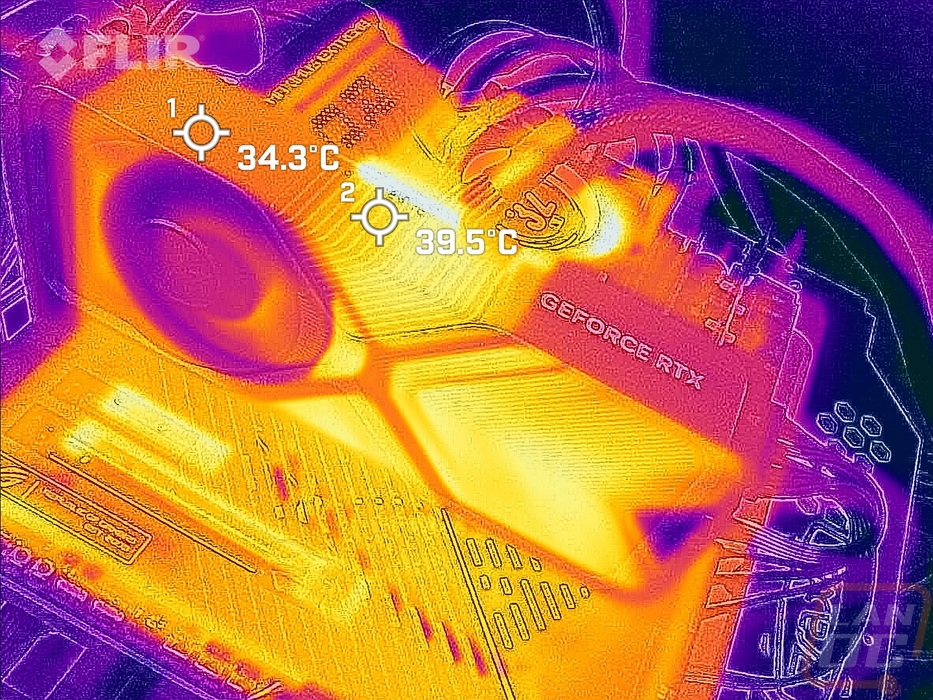
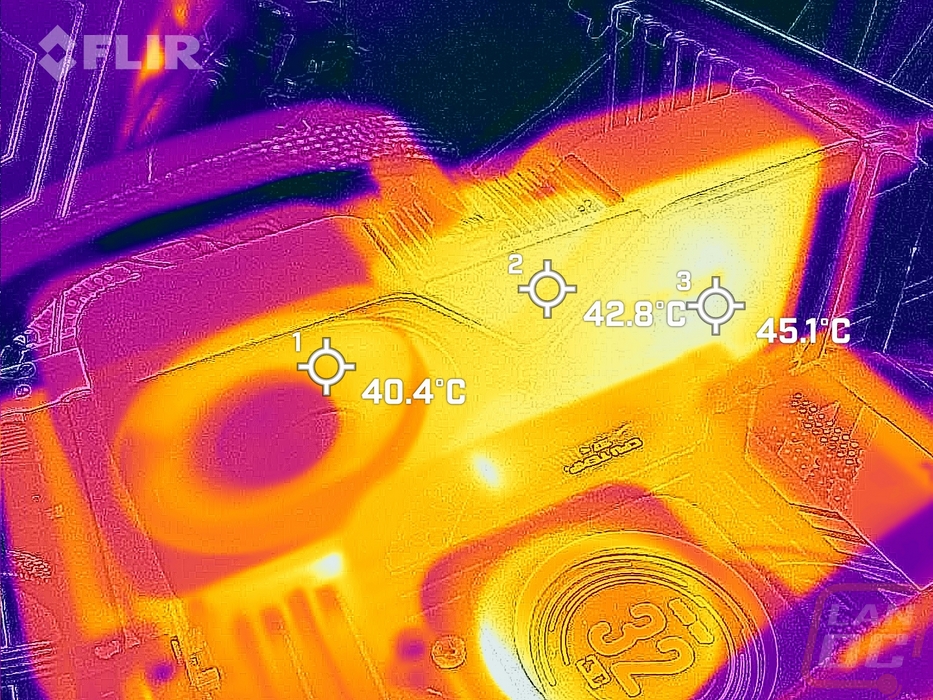
While running the stock fan profile testing I also took the time to get a few thermal images so we could see what is going on. The front side of the RTX 4070 Founders Edition is hottest up at the top edge but is also surprisingly warm on the exposed heatsink on the right side of the card where the blow-through fan is on the backside. Under the front fan, things are cool, however. The top edge has the most heat up against the PCB but even then nothing on the Founders Edition is running too hot. The metal backplate seems to be going a good job of transferring heat as well with this side warmer than the heatsink side of the card all across the backplate and the blow-through fan has the heatsink behind it warmer as well which we also saw when looking at the front.
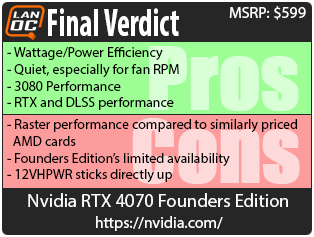
Overall and Final Verdict
The latest in Nvidia’s Ada Lovelace architecture wasn’t a big departure from the RTX 4070 Ti above it, mostly just cut down and with its clock speeds lowered. But with that what stood out to me more than anything in my testing was the power usage and overall efficiency of the card. You have performance that is competing with last generations RTX 3080 but power draw at its peak and averaged across a variety of tests lower than the RTX 3060 Ti. The performance-to-power comparison is only better with Nvidia’s highest-end cards, the 4090 and 4080. That efficiency helped them drop back down to a traditional card size, not the crazy size of the 4080 and 4090 Founders Editions. Even with the smaller card, however, the RTX 4070 Founders Edition impressed on all of its cooling tests and noise tests. Nvidia hit the sweet spot for performance, size, power, noise, and temperatures, and with that, this could be a great SFF card.
The overall performance comparison is a lot more nuanced. Like I said before the 4070 does run right with the RTX 3080, in fact at 1080p in our tests it was a touch faster with the 3080 pulling away as the resolution goes up. But like with the RTX 4070 Ti, it is the ray tracing and DLSS performance that is most impressive. In games that supported it, the 4070 was about to step up and be very capable at 4k while running ray tracing even. To complicate things though, the competition (AMD) isn’t on the same level when it comes to ray tracing and their version of DLSS (FSR) but when it comes to raw rastering performance the 6800 XT which is priced less than the RTX 4070 is faster and the 6950 XT which is most expensive but still close in pricing is even faster than that.
The Founders Edition does have a few downsides, but none of them are big issues. Like with the other 4000 Series Founders Editions the power connection is near the center on the top of the card and it is mounted facing directly up. Combined with the need for the power adapter for some this can get tight quickly in some cases and will also be hard to hide. I wish the design had the angled plug like the RTX 3080 which helped keep strain off of the connection as well. Thankfully this card is a lot smaller at least which will have fewer case issues. The other big issue for me is overall availability of the Founders Edition specifically. Like with other FE cards, it will be on the Nvidia website, Best Buy, and Microcenter which does give you options but I miss the days where this design was available at MSRP at all retailers. I’m a big fan of the all-metal construction and build quality of the cooler and would like to see if be easier to get.
I’ve kind of touched on it already but let's get to pricing. The RTX 4070 Founders Edition and other stock-clocked cards will be hitting stores tomorrow at an MSRP of $599. On the AMD side, the 6800 XT is currently selling for $539-$579 and the 6950 XT are running $629-$679. On the Nvidia side, the cheapest non-refurb RTX 3080 on Newegg is $699 with most at $898 and higher. So if we only look at the RTX 3080 the new RTX 4070 is a great deal especially once you add in DLSS 3 which isn’t available on the 3080. The AMD cards however complicate things. For raw raster performance, those are a great value in comparison, but that is before you put a value on the ray tracing performance and DLSS. Overall I would love to see the RTX 4070 come in lower competing with the 6800 XT. But if ray tracing and DLSS/FSR are your main focus and I do believe in the future those are going to be key to gaming performance the RTX 4070 starts to become an option.

Live Pricing: HERE


