Cooling Noise and Power
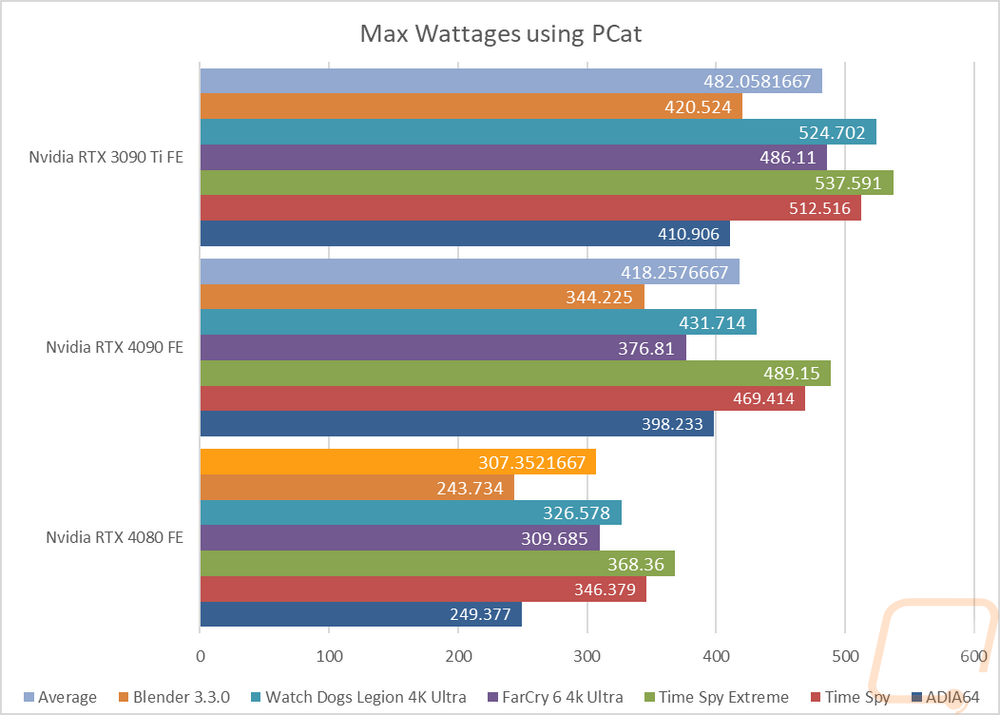
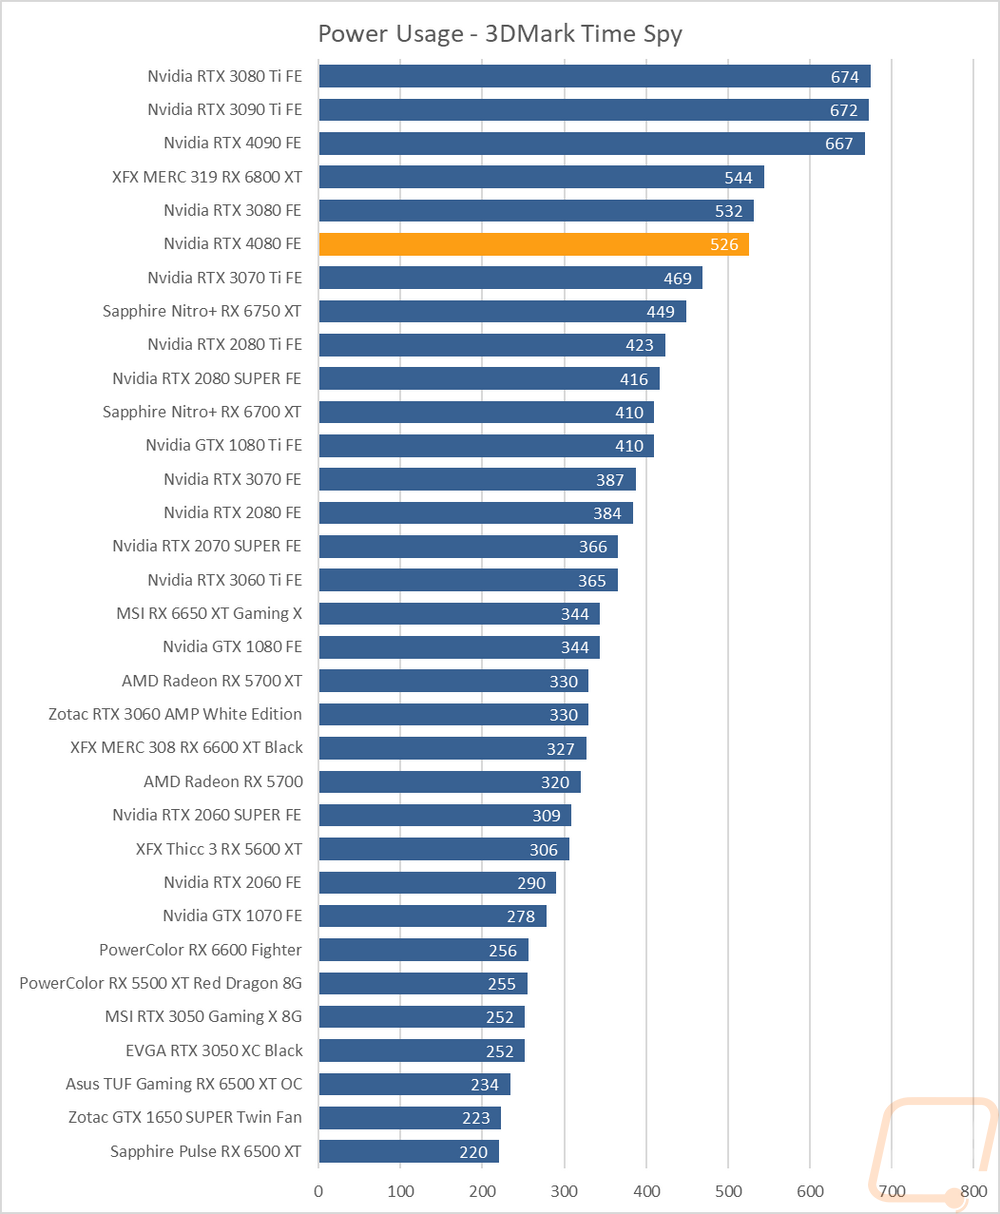
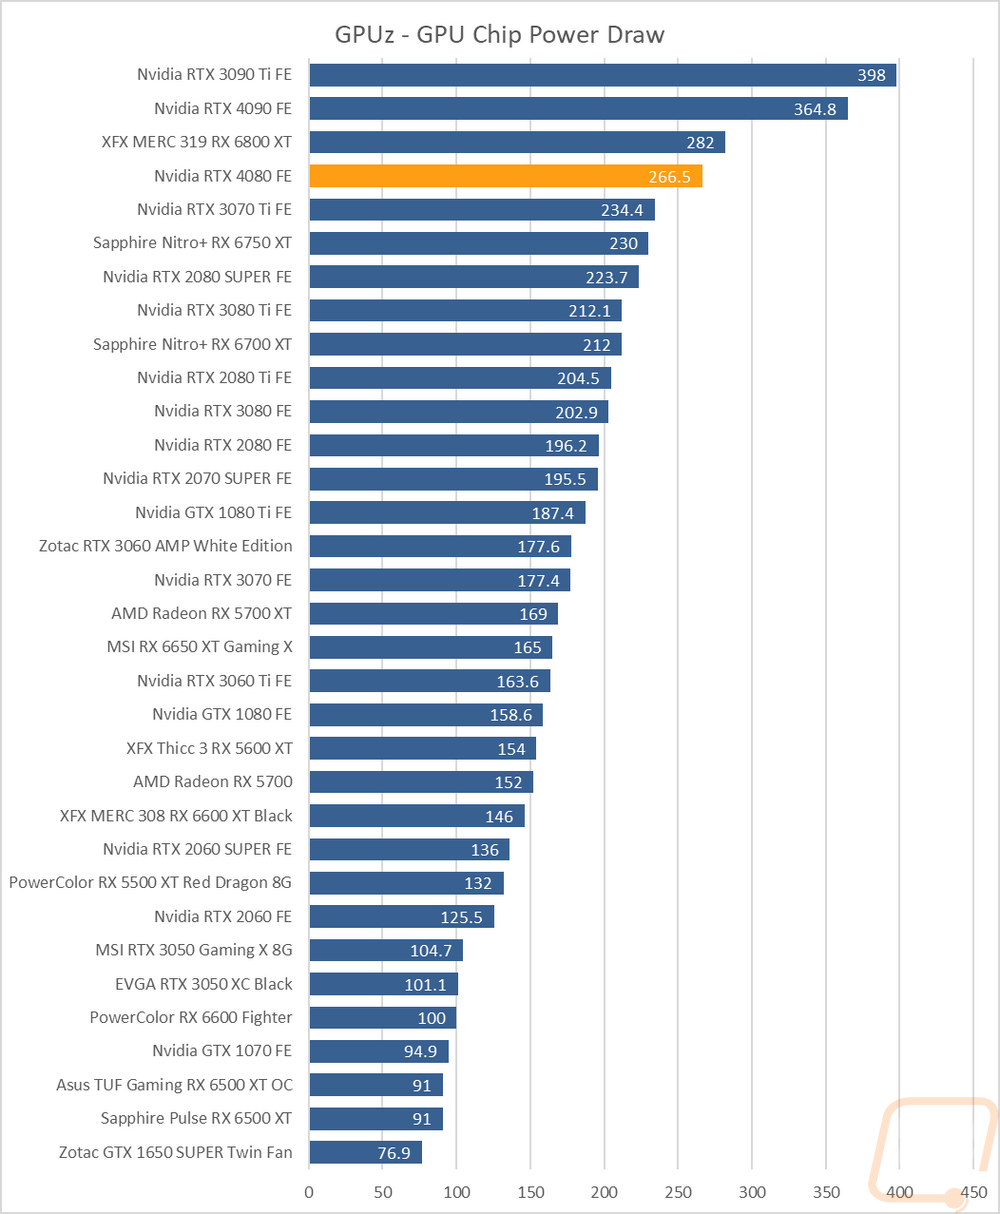
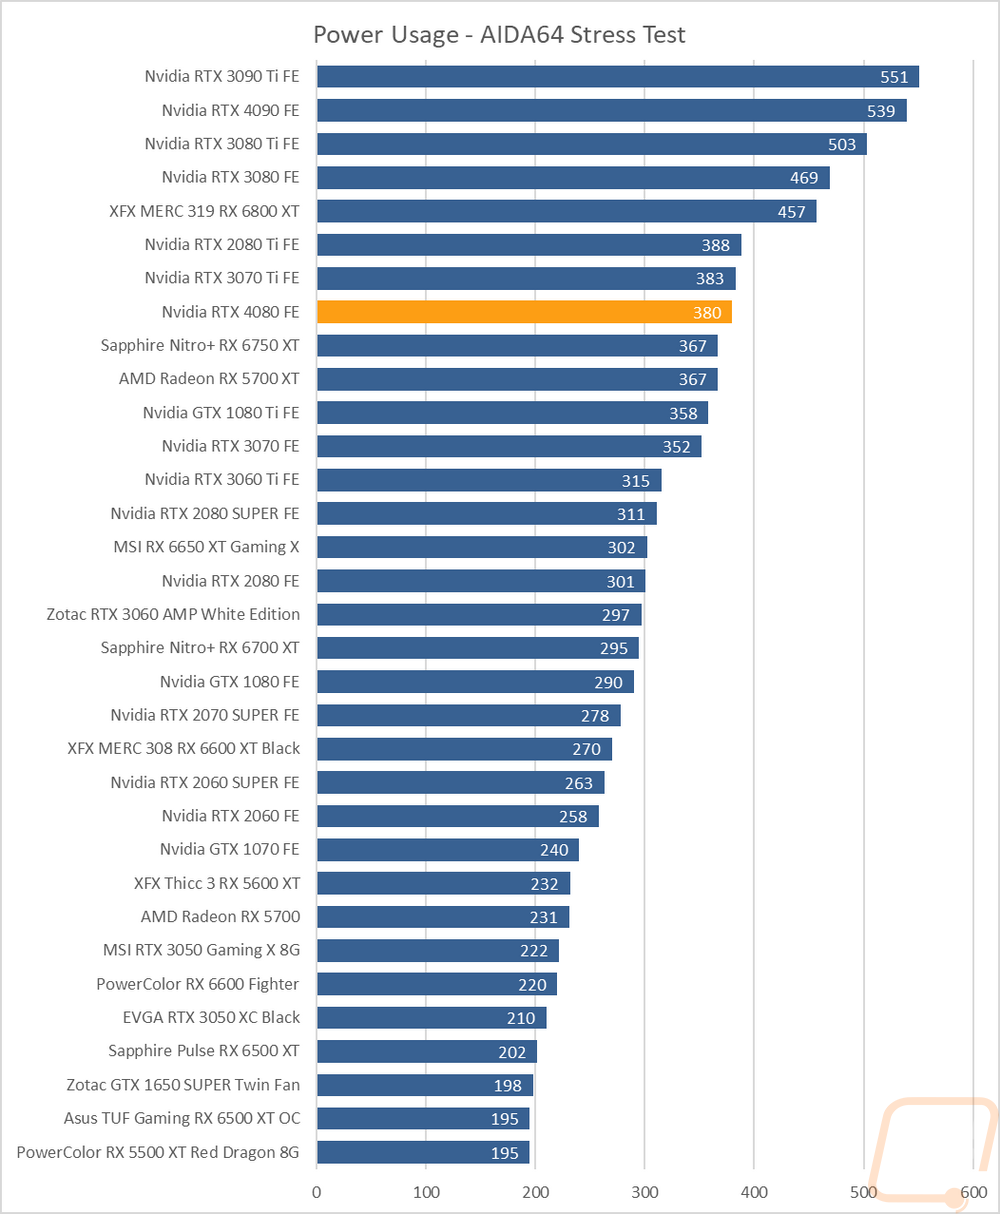
For my last few tests, rather than focusing on in game performance, I like to check out other aspects of video card performance. These are also the most important ways to differentiate the performance between cards that have the same GPU. To start things off I took a look at power usage. For this, I use our Kill-A-Watt hooked up to the test bench to record the total wattage of the system. I ran two tests with the first using 3DMark Time Spy to put the system under a load similar to normal in game performance. Here our test system with the RTX 4080 Founders Edition pulled 526 watts at peak which was surprisingly less than the same system pulled with the RTX 3080 on it. At the same time with Time Spy I also use GPUz to check out the onboard reading for GPU power draw at the chip. The RTX 4080 Founders Edition showed 266.5 watts for the GPU and 307.3 watts of total board power. I also run AIDA64’s stress test on the video card to load up only the GPU and using the Kill-A-Watt the test bench with the RTX 4080 Founders Edition pulled 380 watts which shows how much the CPU side of things is also using but to double check that I got my hands on a new PCat v2 from Nvidia to test JUST the video card power by monitoring both the 12VHPWR connection and the PCIe slot. For this one, I ran a range of tests to get a better look at power usage depending on load types. Blender surprisingly was the lowest on all three cards with AIDA64’s workload being the second lowest. Time Spy and especially Time Spy Extreme on the other hand pushed the RTX 4080 Founders Edition past its TGP of 320 watts by 26 and 48 watts respectively which does make you wonder if that is just optimization for the always popular benchmark. The in game tests fell closer to the TGP with it being 309 watts in Far Cry 6 and 326 watts in Watch Dogs. I then averaged all of the results out with the RTX 4080 Founders Edition averaging 307 watts. For comparison, the RTX 4090 averaged 418 and the older 3090 Ti was even higher at 482 watts which is crazy considering its TGP is 350 and the 4090 has a higher TGP of 450 watts.
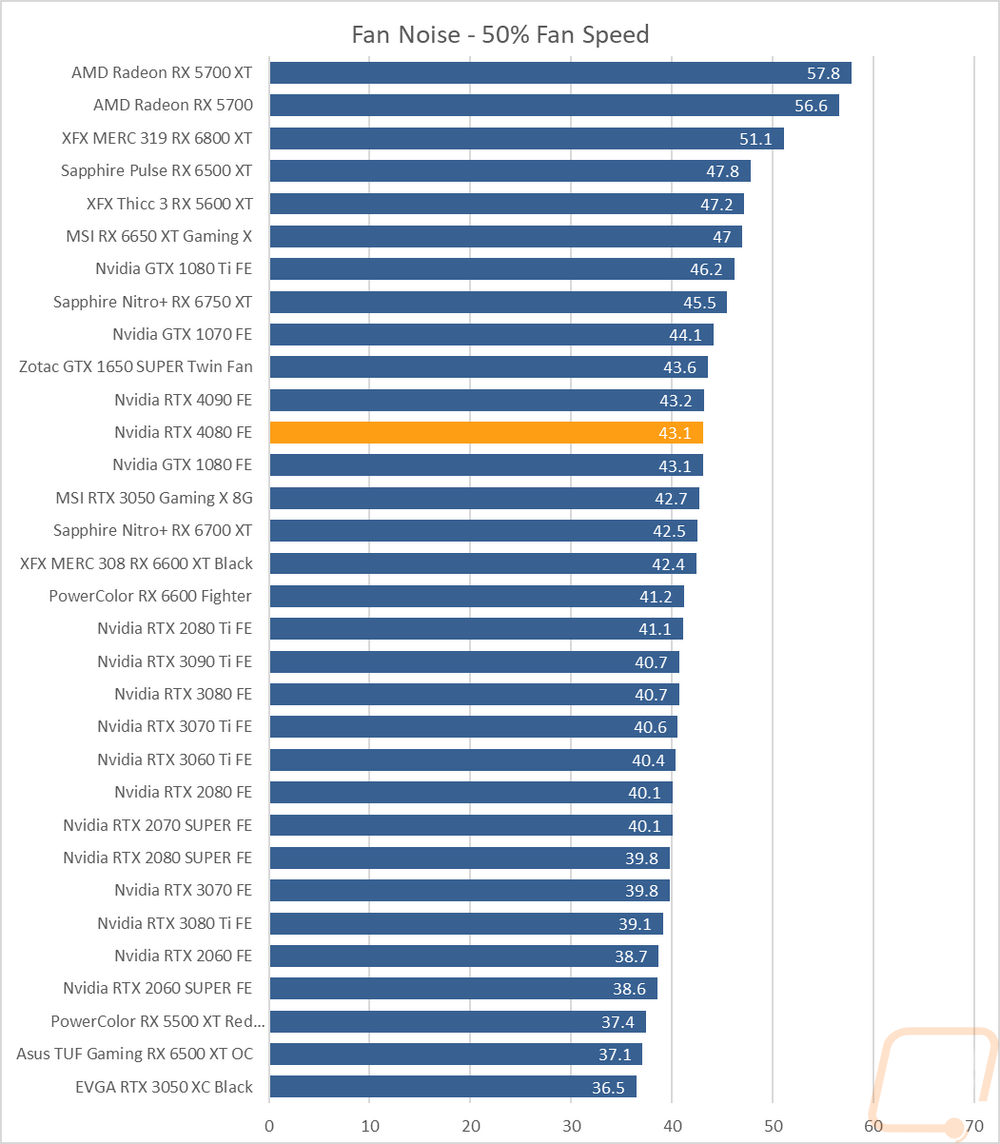
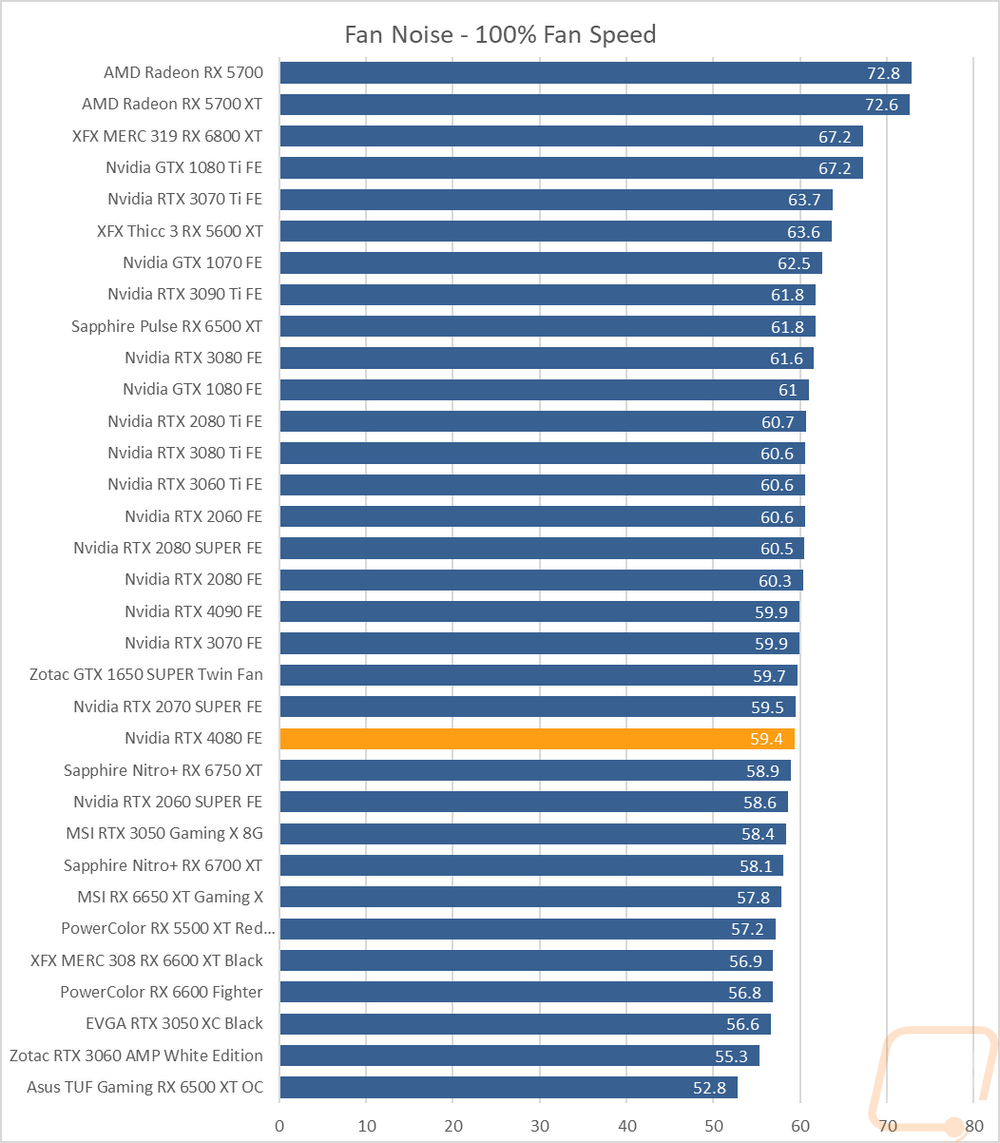
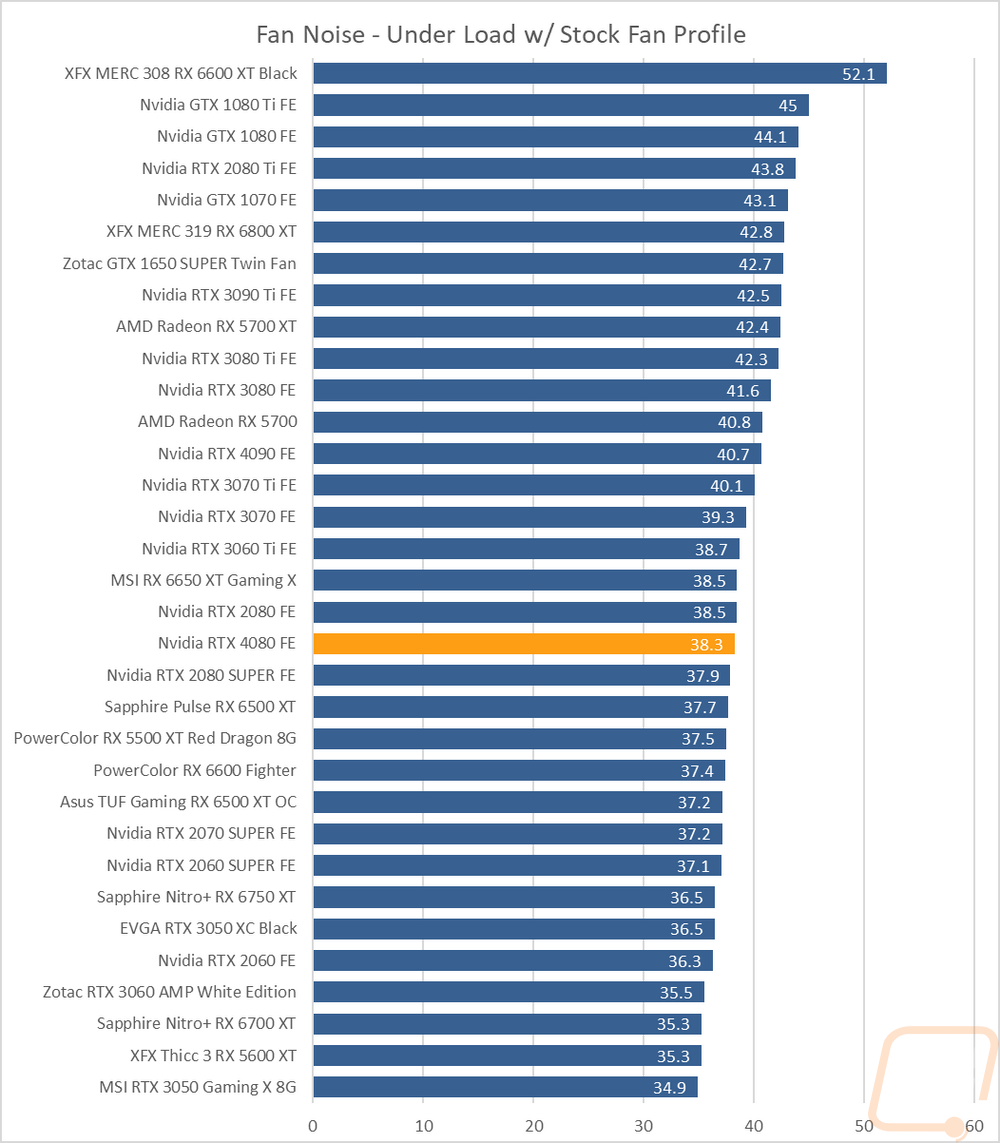
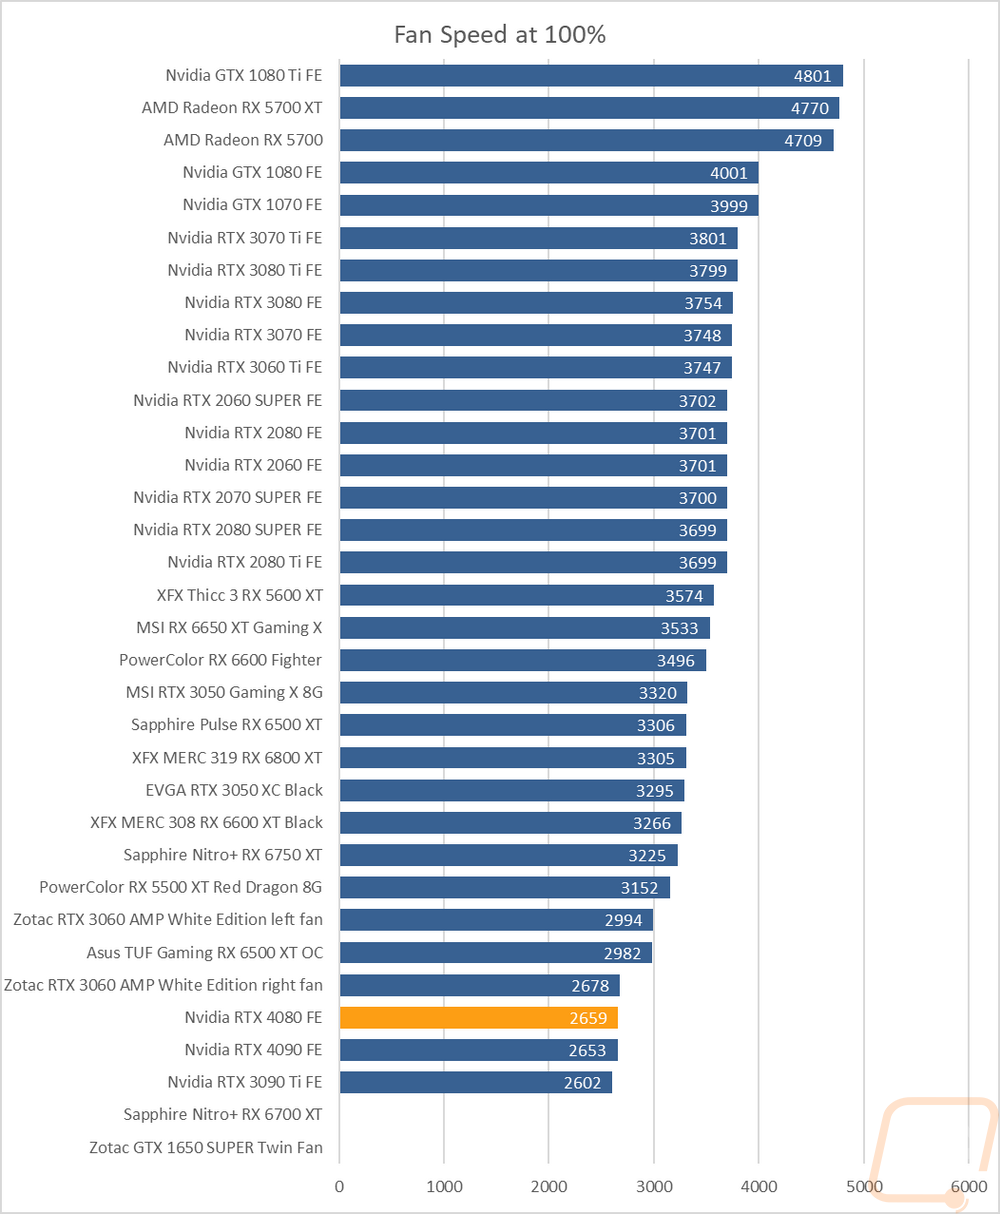
My next round of tests were looking at noise levels. These are especially important to me because I can’t stand to listen to my PC whirling. Especially when I’m not in game and other applications are using the GPU. For my testing, though I first tested with the fan cranked up to 100% to get an idea of how loud it can get, then again at 50% to get an idea of its range. The RTX 4080 Founders Edition fell in the bottom half of the cards tested when testing at 100% fan speed and was right with the RTX 4090 Founders Edition which shares the same cooler. This was an improvement over the RTX 3080 FE and RTX 3080 Ti which came in at 61.6 and 60.6 decibels. The 50% fan speed result was again right with the 4090 FE but was right in the middle of the pack. I also take a look at noise performance while under load. For that when running AIDA64’s stress test I wait until the temperature of the card has leveled off and then measure how loud things are when the card is at its worst-case scenario with the stock fan profile. Here the RTX 4080 Founders Edition did well at 38.3 decibels, 2.4 decibels lower than the 4090 FE with the same cooler but more heat. And even farther below both the RTX 3080 FE and the RTX 3080 Ti FE. The RTX 4080 Founders Edition and the 4090 were able to do this because even when cranked up to 100% fan speed the two fans are only running at 2659 RPM which puts them and the 3090 Ti at the bottom of our chart.
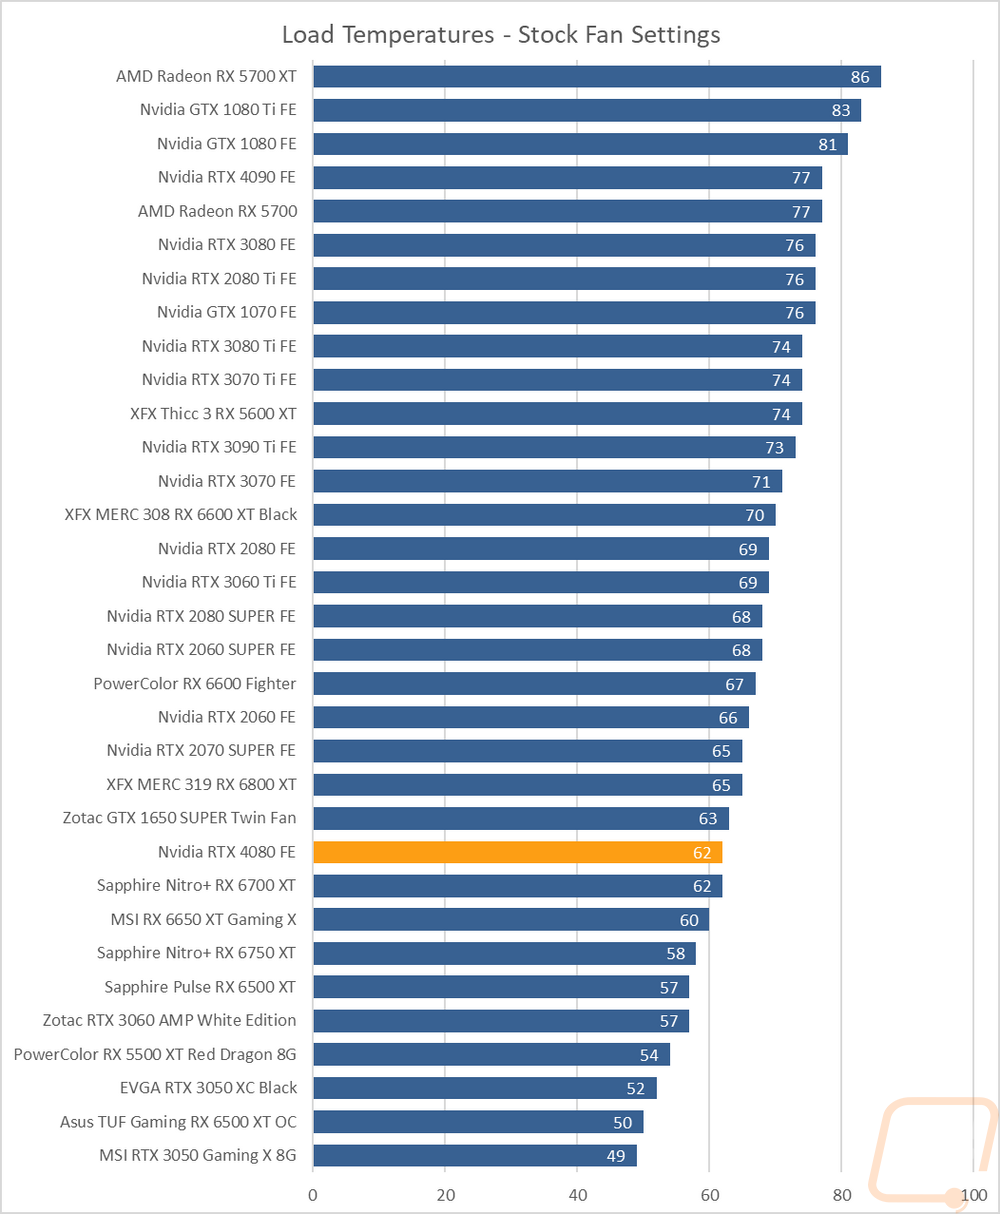
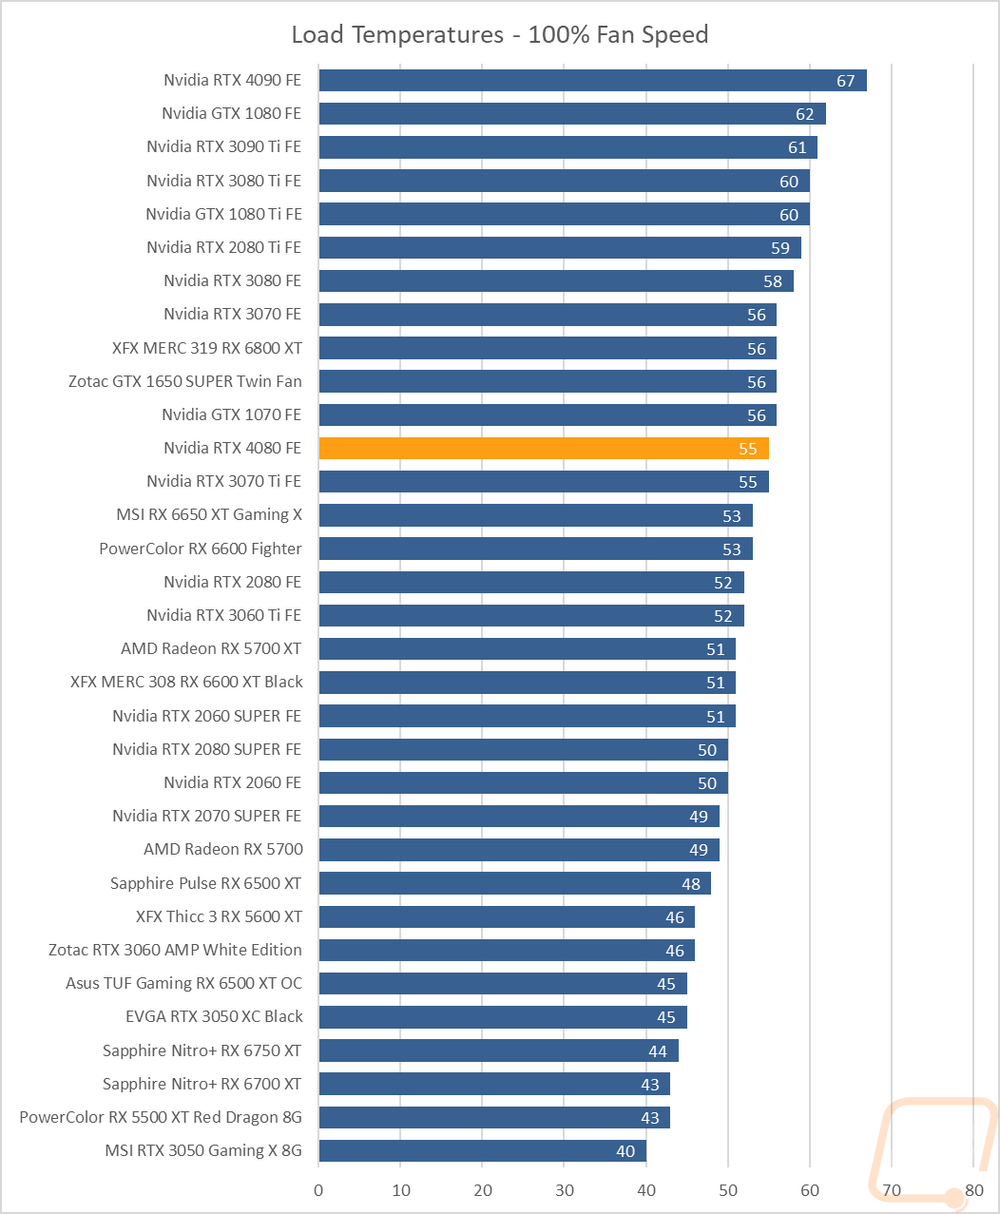
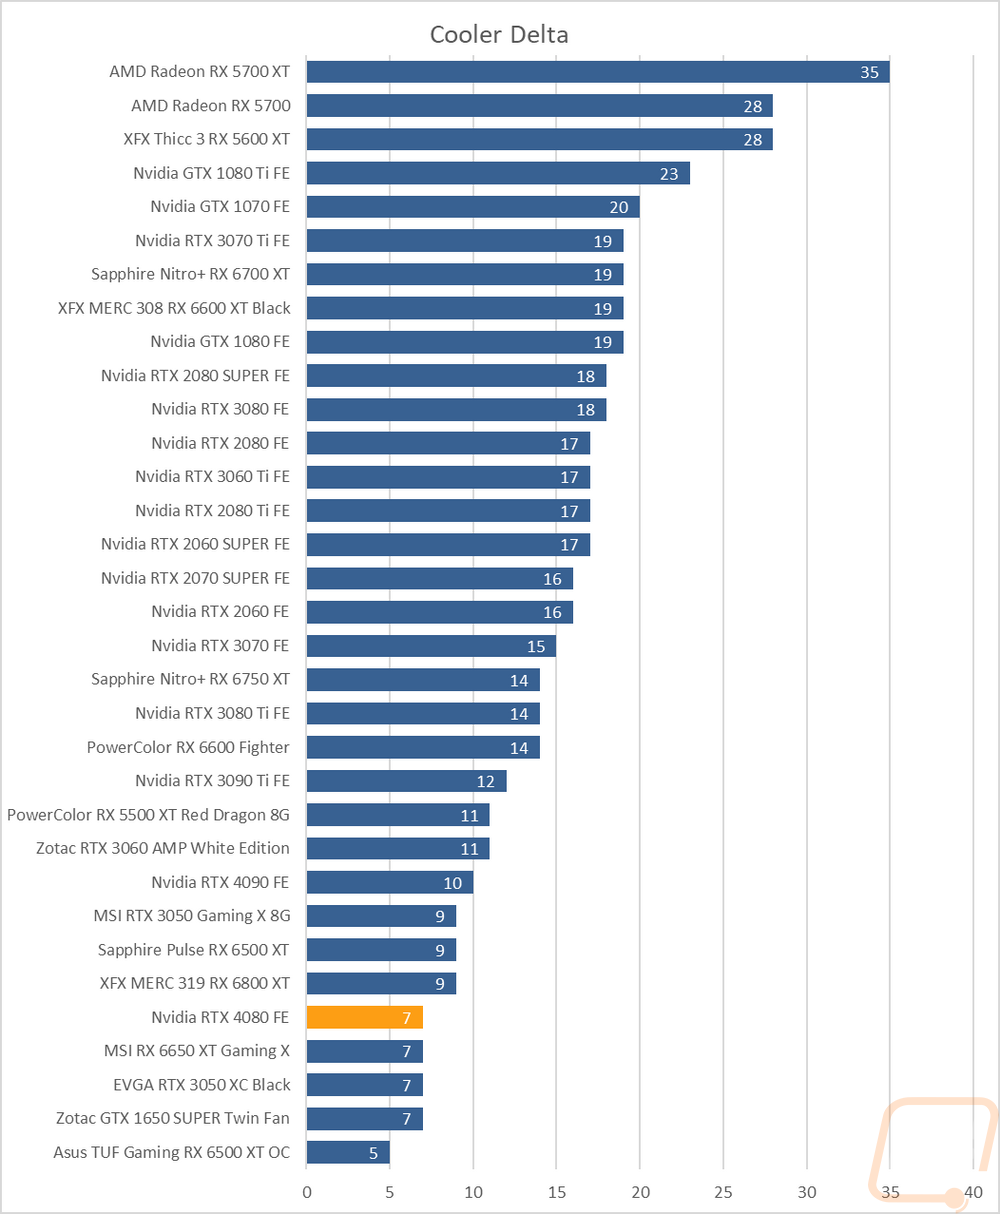
To finish up my testing I of course had to check out the cooling performance. To do this I ran two different tests. I used AIDA64’s Stress Test run for a half-hour each to warm things up. Then I documented what temperature the GPU leveled out at with the stock fan profile and then again with the fans cranked up to 100%. With the stock profile, the RTX 4080 Founders Edition leveled off at 62 degrees which was 15 degrees lower than the RTX 4090 Founders Edition and 12 lower than the 3080 Ti FE that it replaces as well. When doing this test I did also keep an eye on the GPU hotspot which was warmer at 76c. Then with the fans cranked up, the RTX 4080 Founders Edition ran even cooler at 55c, 12c less than the 4090, and 5c lower than the 3080 Ti FE. The RTX 4080 Founders Edition which ran surprisingly cool with the stock fan profile didn’t improve too much with the fans cranked all the way up with the delta being near the bottom of the chart at a 7c difference.
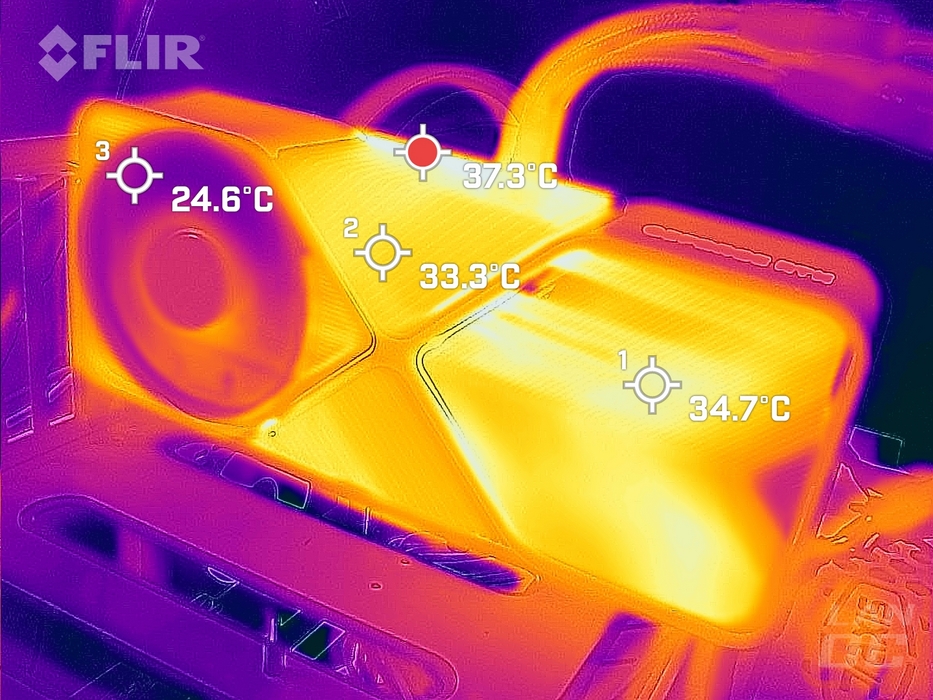
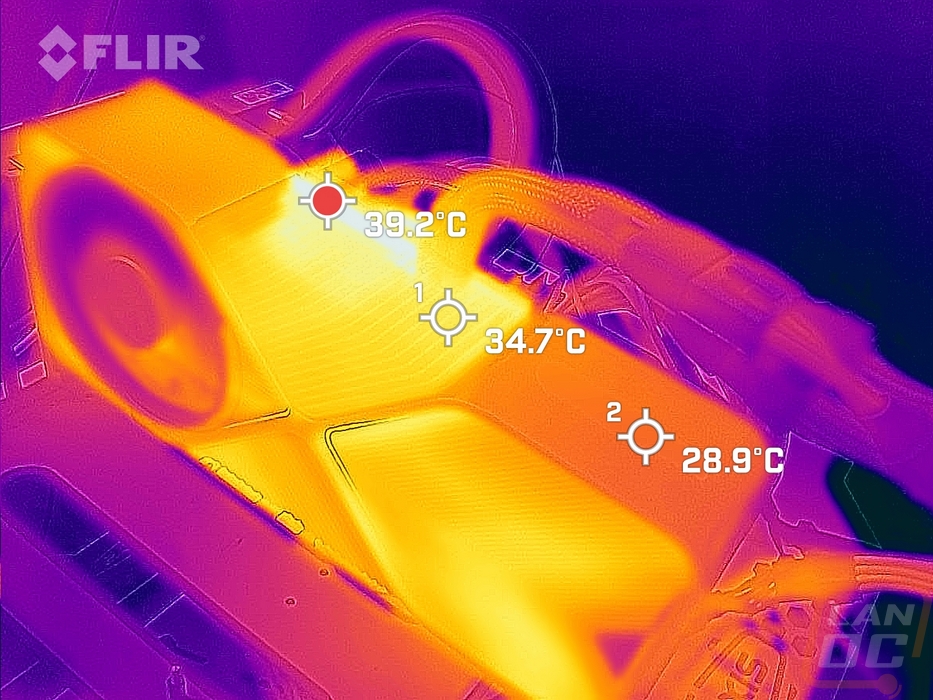
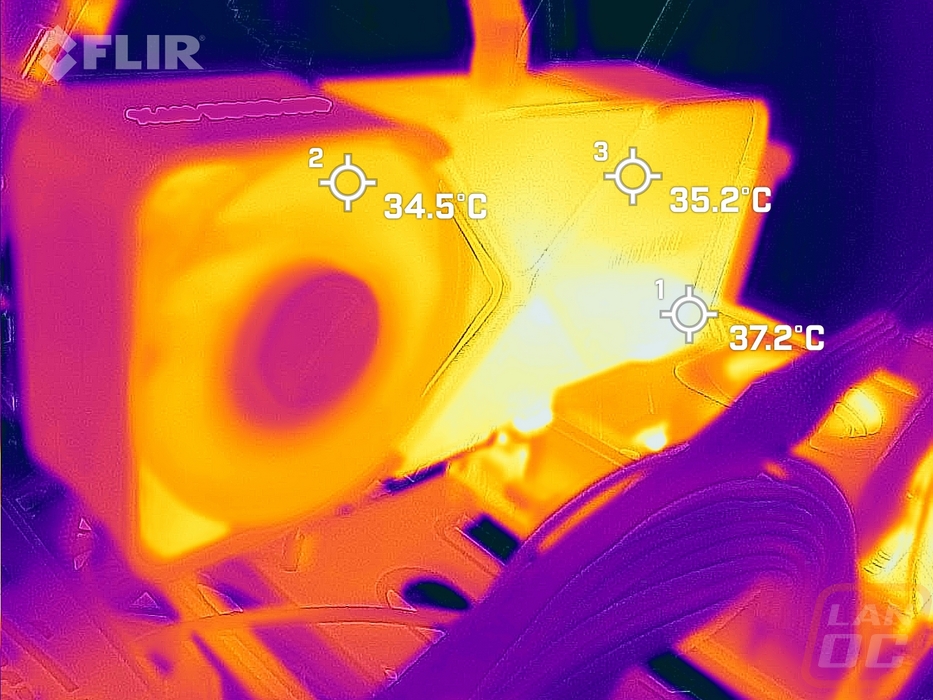
While running the stock fan profile testing I also took the time to get a few thermal images so we could see what is going on. The hottest spot from the left side profile is right at the top edge closest to the PCB but you can also see warm areas in the blow-through end of the heatsink. The top-down angle shows the PCB area being the hottest again. Then on the back, the hotspot was actually on the motherboard showing that while warm, the RTX 4080 Founders Edition wasn’t even the hottest part of the system when only putting a load on the GPU. That back view does show a slightly warmer area on the backplate in the bottom right. Because of the 4090 plug issues I was also keeping an eye in the plug area and you can see the cables getting warmer from the air being blown on them, but the cables and even the plug area weren’t too hot at all.