Compute Benchmarks
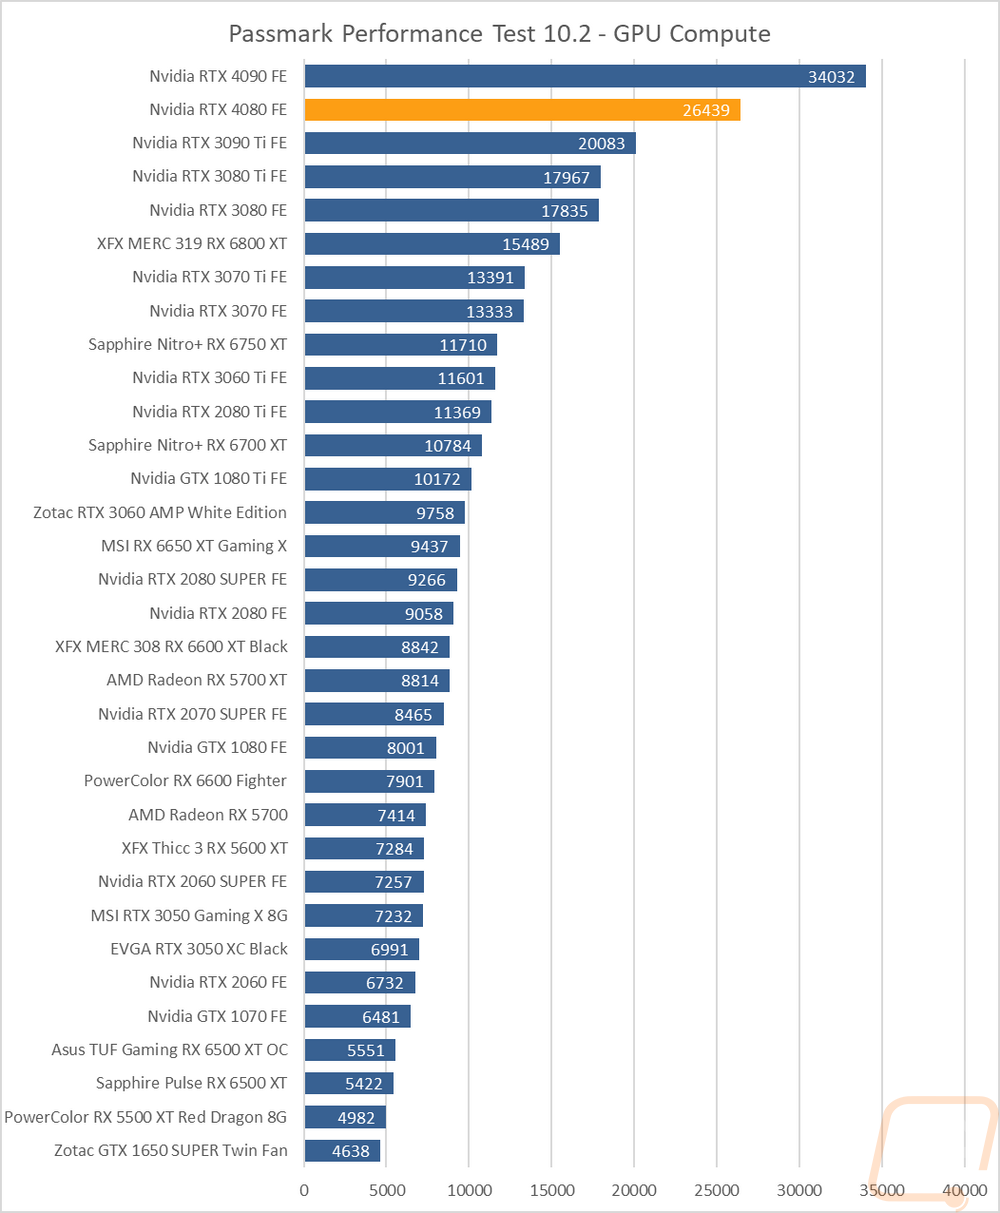
Now some people don’t need a video card for gaming, they need the processing power for rendering or 2D/3D production, or in some cases people who game also do work on the side. So it is also important to check out the compute performance on all of the video cards that come in. That includes doing a few different tests. My first test was a simple GPU Compute benchmark using Passmark’s Performance Test 10 and the RTX 4080 Founders Edition scored 26439 which was 31% in front of the RTX 3090 Ti and 47% over the RTX 3080 Ti!
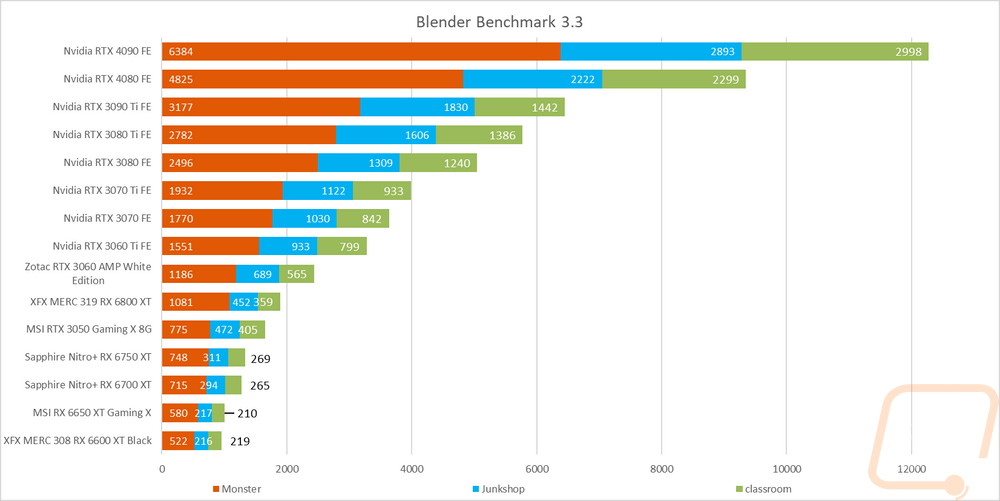
Blender is always my favorite compute benchmark because the open-source 3D rendering software is very popular and it isn’t a synthetic benchmark. With the latest version of Blender, they redid the benchmark so we now have a new test that runs three different renderings and gives each a score. I have all three stacked together so we can see the overall performance. The RTX 4080 Founders Edition didn’t get close to the RTX 4090 of course but beats the RTX 3090 Ti’s total score with just its first two tests.
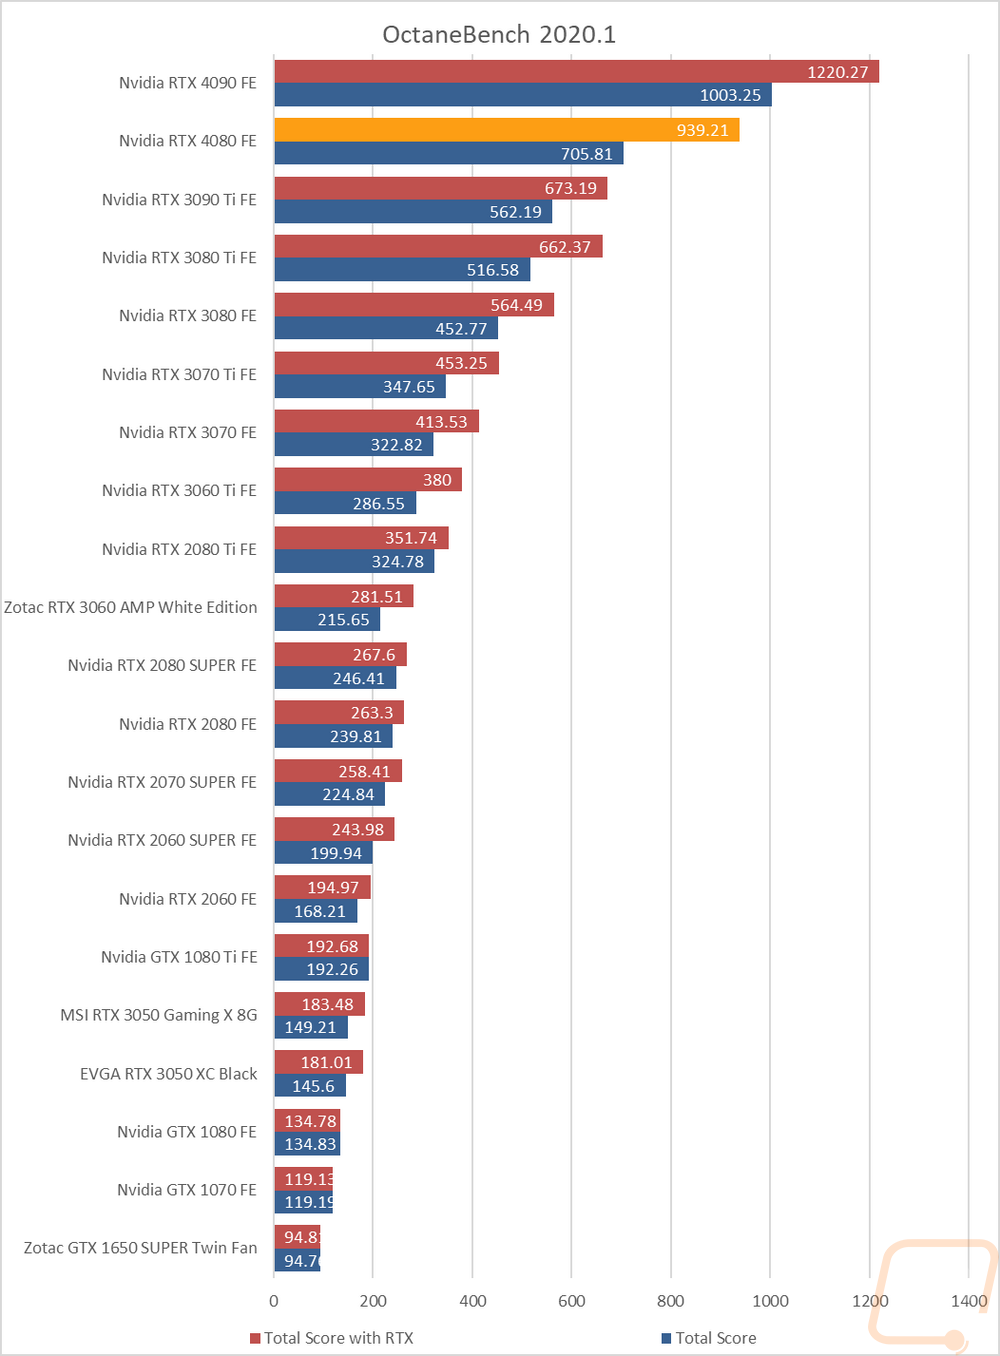
For CUDA-based cards, I also check out OctaneRender performance using their OctaneBench 2060.1 benchmark which allows me to check out both RTX and non-RTX rendering performance. Here the RTX 4080 Founders Edition improved on the RTX 3090 Ti’s score by 39% in the RTX test and 25% in the non-RTX score which shows how much RTX performance has improved this generation.
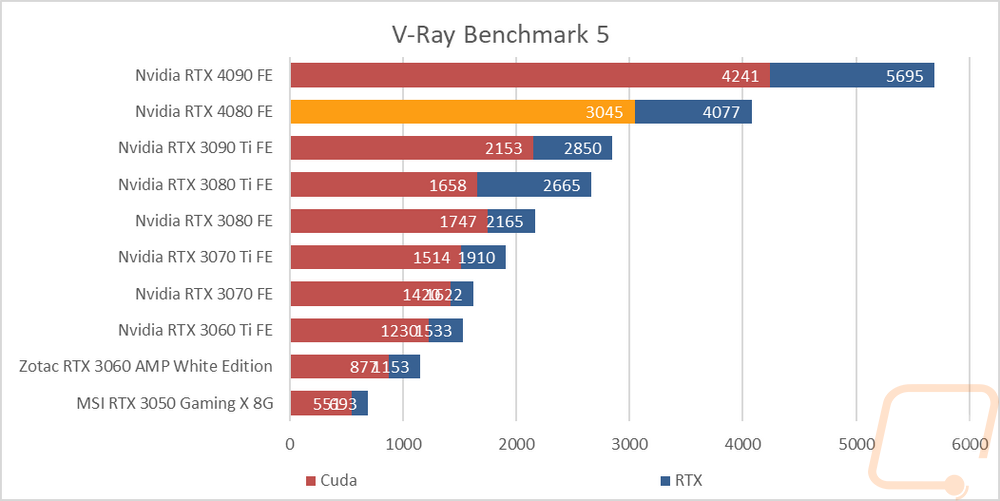
For an additional CUDA-based test I also ran V-Ray Benchmark 5 to check out CUDA and RTX performance in the 3D rendering and simulation software. The RTX 4080 Founders Edition outperformed the RTX 3090 Ti’s RTX score with CUDA cores alone and nearly caught the RTX 4090’s CUDA score with its RTX score. Overall it came in second with the 4090 way out in front but a big gap between it and any of the 3000 Series cards.