Nvidia shook things up with the performance of their first Ada-based card, the RTX 4090, but for a lot of people, that level of performance isn’t needed or is out of their price range. Things start to get interesting as we start to see the rest of the product stand fill out over time. Nvidia announced two RTX 4080 models alongside the RTX 4090 but later “unlaunched” the 12GB model leaving just the RTX 4080 16GB as the one 4080 model and today is the day. The embargo’s lifted and we can finally check out how the RTX 4080 performs ahead of it launching in retailers tomorrow morning. So today I’m going to check out the RTX 4080 Founders Edition and see how it compares with the RTX 4090 as well as last generation's cards. Let’s dive in!
Product Name: Nvidia RTX 4080 Founders Edition
Review Sample Provided by: Nvidia
Written by: Wes Compton
Amazon Affiliate Link: HERE
What's the RTX 4080 All About
I dove into some of the details of the Ada architecture for the RTX 4090 launch and I don’t think we need to get into those details. Be sure to check out our RTX 4090 Founders Edition review for more information there. But I did want to at least take a look at what sets the RTX 4080 apart from the RTX 4090 that we previously took a look at. I also put the specification listing together with the RTX 3080 and RTX 3080 Ti that the RTX 4080 is replacing. From the 4090 to the 4080 the big change is the RTX 4080 is not running on the same AD102 GPU that the RTX 4090 was on, it is on the AD103 which takes the transistor count from 76.3 Billion to 45.9 billion but that is still well above the 28.3 Billion of both of the RTX 3080 cards. This drops the graphics processing cluster count from 11 down to 7 and with that, the texture processing clusters are going from 64 to 38 and streaming multiprocessors from 128 to 78. That same change can be seen in the CUDA cores which the RTX 4080 has 9728 which is nearly half of the 16384 of the RTX 4090. Things get interesting when we compare those same numbers with the 3080 Ti which has more TPCs, SMs, and CUDA cores. It even has more Tensor and RT cores but the RTX 4080 has the newer 4th gen Tensor cores and 3rd Gen RT cores.
Where the RTX 4080 stands out from the 3080 and 3080 Ti is its GPU boost clock speed which can boost up to 2505 MHz, nearly the same as the RTX 4090 compared to 1665 MHz on the 2080 Ti. The memory clock speed is cranked up as well at 1400 MHz which is higher than the RTX 4090 even. But the big downside is the RTX 4080 has a memory interface that is 256-bit whereas the 3080 was 320-bit and the other two were 384-bit. The higher clock speed gives a higher memory data rate at least. Even with the higher memory clock speed, you can see how the interface limits things in the total memory bandwidth, even with 16 GB of memory. The RTX 4080 also has a huge jump in L2 cache like the 4090 compared to the older cards.
It is built on the same TSMC 4 nm Custom NVIDIA Process that the RTX 4090 was built on which helps and the TGP or total graphics power of the card is 320 watts whereas the 4090 was 450 watts. This puts it in line with the RTX 3080 in power and lower than the RTX 3080 Ti. Even so, it does come with a three 8-pin dongle where those two cards both came with dual 8-pin adapters.
|
Specifications |
RTX 3080 |
RTX 3080 Ti |
RTX 4080 |
RTX 4090 |
|
Graphics Processing Clusters |
6 |
7 |
7 |
11 |
|
Texture Processing Clusters |
34 |
40 |
38 |
64 |
|
Streaming Multiprocessors |
68 |
80 |
76 |
128 |
|
CUDA Cores |
8704 |
10240 |
9728 |
16384 |
|
Tensor Cores |
272 (3rd Gen) |
320 (3rd Gen) |
304 (4th Gen) |
512 (4th Gen) |
|
RT Cores |
68 (2nd Gen) |
80 (2nd Gen) |
76 (3rd Gen) |
128 (3rd Gen) |
|
Texture Units |
272 |
320 |
304 |
512 |
|
ROPs |
96 |
112 |
112 |
176 |
|
Boost Clock |
1710 MHz |
1665 MHz |
2505 MHz |
2520 MHz |
|
Memory Clock |
1188 MHz |
1188 MHz |
1400 MHz |
1313 MHz |
|
Memory Data Rate |
19 Gbps |
19 Gbps |
22.4 Gbps |
21 Gbps |
|
L2 Cache Size |
5 MB |
6 MB |
64 MB |
72MB |
|
Total Video Memory |
10 GB GDDR6X |
12 GB GDDR6X |
16 GB GDDR6X |
24 GB GDDR6X |
|
Memory Interface |
320-Bit |
384-bit |
256-bit |
384-bit |
|
Total Memory Bandwidth |
760.3 GB/s |
912 GB/s |
716.8 GB/sec |
1008 GB/s |
|
Texture Rate (Bilinear) |
465.1 GigaTexels/second |
532.8 GigaTexels/second |
761.5 GigaTexels/second |
1290.2 GigaTexels/second |
|
Fabrication Process |
Samsung 8 nm 8N NVIDIA Custom Process |
Samsung 8 nm 8N NVIDIA Custom Process |
TSMC 4 nm NVIDIA Custom Process |
TSMC 4 nm NVIDIA Custom Process |
|
Transistor Count |
28.3 Billion |
28.3 Billion |
45.9 billion |
76.3 Billion |
|
Connectors |
3 x DisplayPort 1 x HDMI |
3 x DisplayPort 1 x HDMI |
3 x DisplayPort 1 x HDMI |
3 x DisplayPort 1 x HDMI |
|
Form Factor |
Two Slots |
Two Slots |
Triple Slot |
Triple Slot |
|
Power Connectors |
1x16-pin (Dongle to 2x 8-Pins) |
1x16-pin (Dongle to 2x 8-Pins) |
1x16-pin (Dongle to 3x 8-Pins) |
1x16-pin (Dongle to 4x 8-Pins) |
|
Minimum Power Supply |
750 Watts |
750 Watts |
750 Watts |
850 Watts |
|
Total Graphics Power (TGP) |
320 Watts |
350 Watts |
320 Watts |
450 Watts |
|
Maximum GPU Temperature |
93° C |
93° C |
90° C |
90° C |
|
PCI Express Interface |
Gen 4 |
Gen 4 |
Gen 4 |
Gen 4 |
|
Launch MSRP |
$699 |
$1199 |
$1199 |
$1599 |
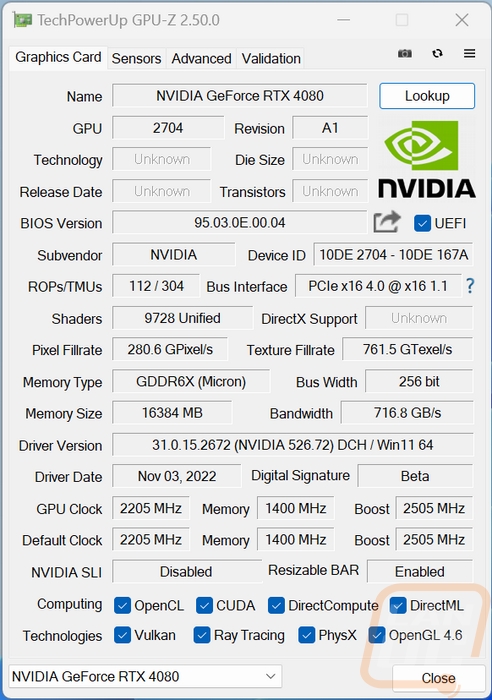
Before getting into testing I did also run GPUz to double-check that our clock speeds match up with the specifications and it does have the 2505 MHz boost clock speed. This also documents the BIOS revision of our card and the driver I used for testing which is the 526.72 driver that Nvidia provided to press before the launch.
Packaging
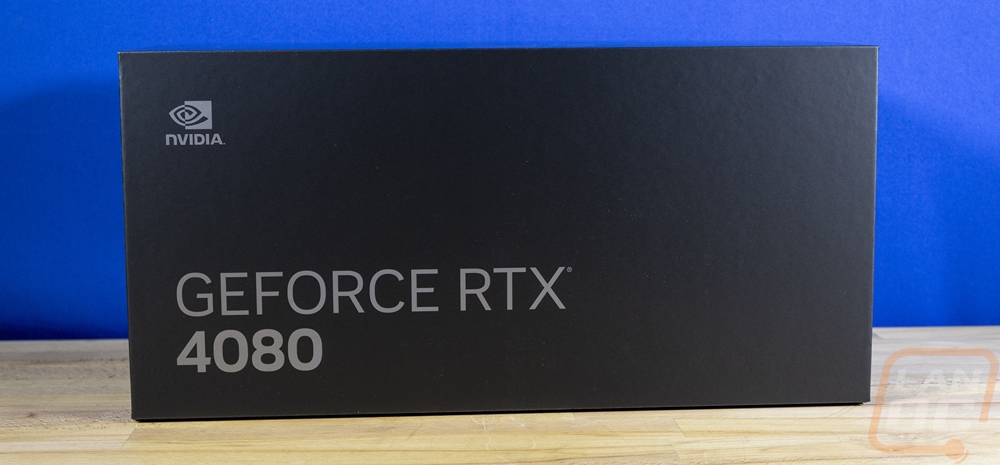
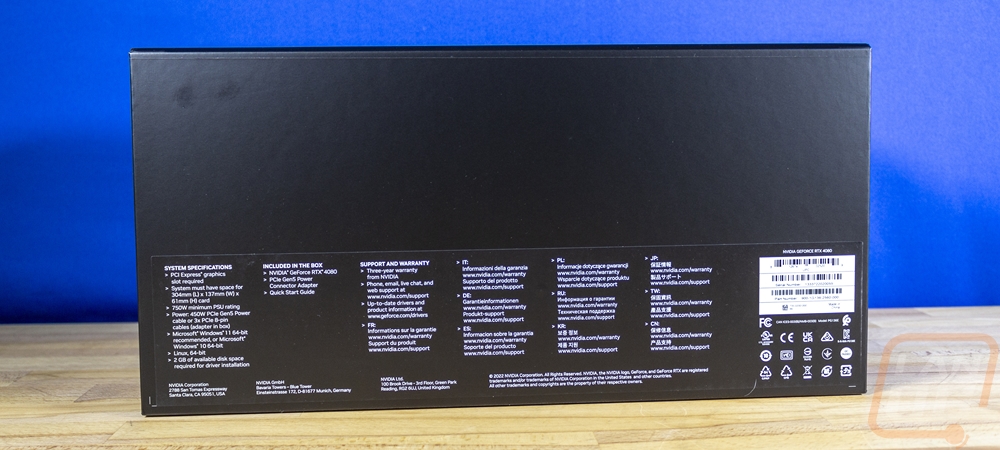
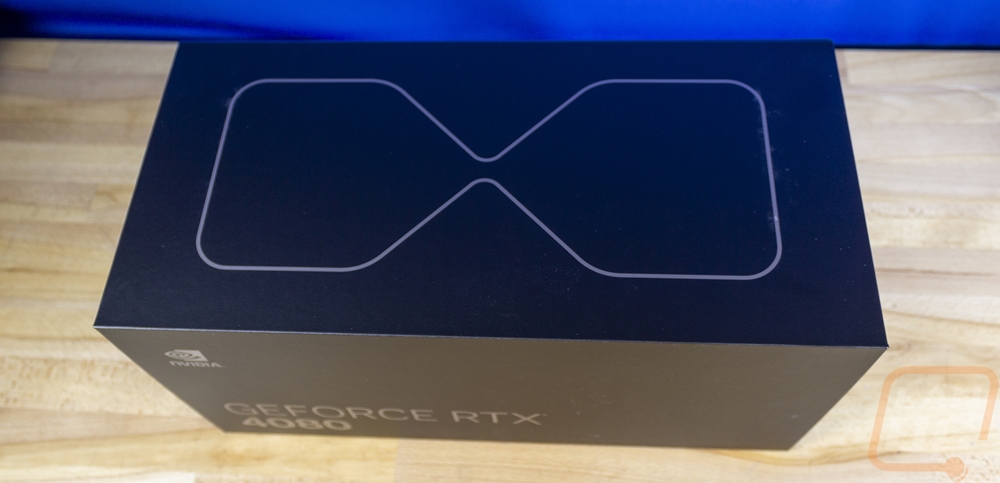
With the RTX 4090 Founders Edition, I was surprised at the huge box that Nvidia went with but loved that it made the card feel special and unique. I assumed when we went down to the RTX 4080 they would save the space in shipping and the weight (the card and box together are 14 pounds, twice the weight of the card and box for the 3080) but surprisingly they stuck with the same packaging. The RTX 4080 Founders Edition comes in the same large box which is blacked out and the front of the box only has the model name and the Nvidia logo, not even the Founders Edition branding. There is a sticker on the back which has some basic specifications including the card size and power requirements. The sticker also lists everything inside and then has information on the warranty across multiple languages. Outside of that, the only thing visible on the box is the silver line drawing on top of the hourglass-like shape that is also on the RTX 4080 Founders Edition’s cooler.
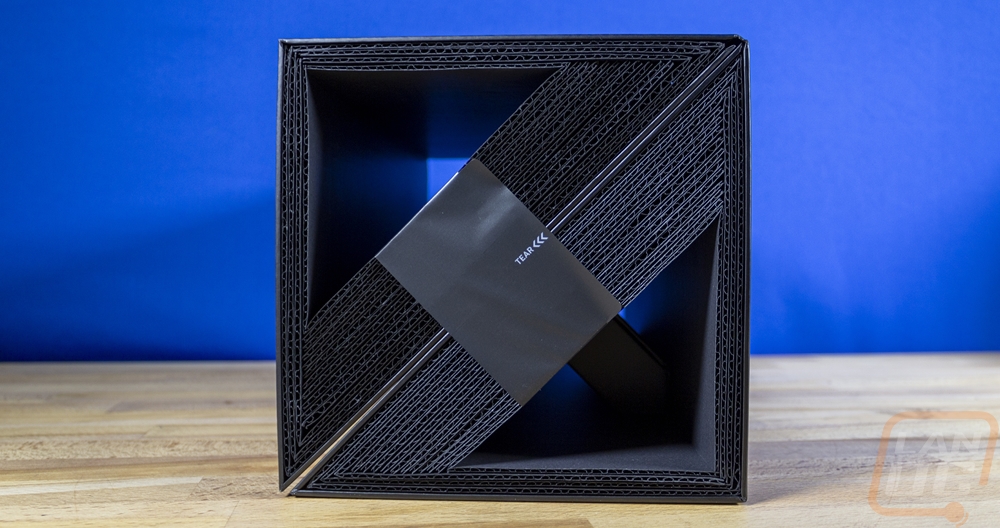
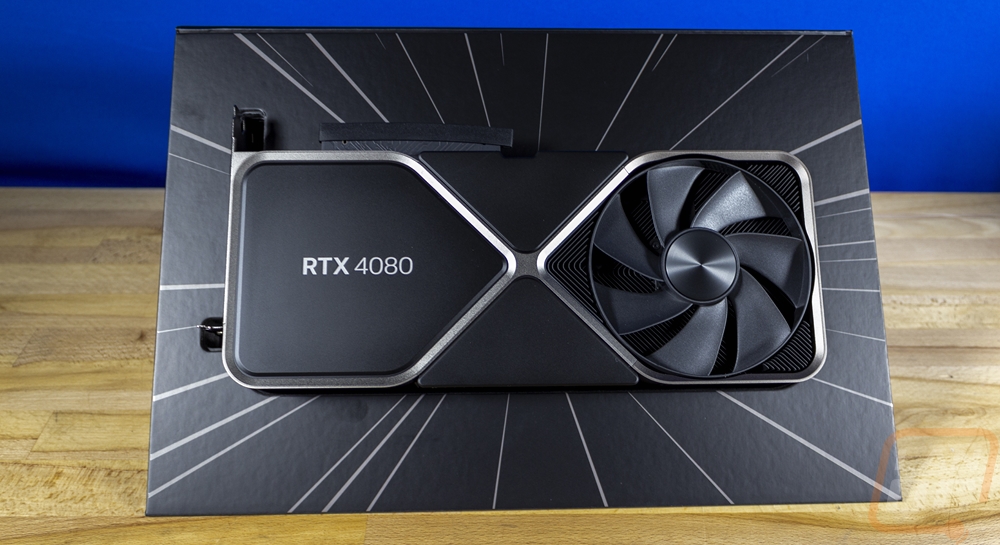
The end view shows what makes the packaging interesting though. It is made entirely out of corrugated plastic and from the end, you can see that most of the box is hollow, you can see through the top and bottom openings. Nvidia then has the tear-off tape on both ends, pulling those off allows you to be able to flip the box open, it unfolds from the middle and shows the card sitting in its cut-out tray. The RTX 4080 Founders Edition is flipped upside down to make the RTX 4080 lettering on the card readable and lines radiating away from the card.
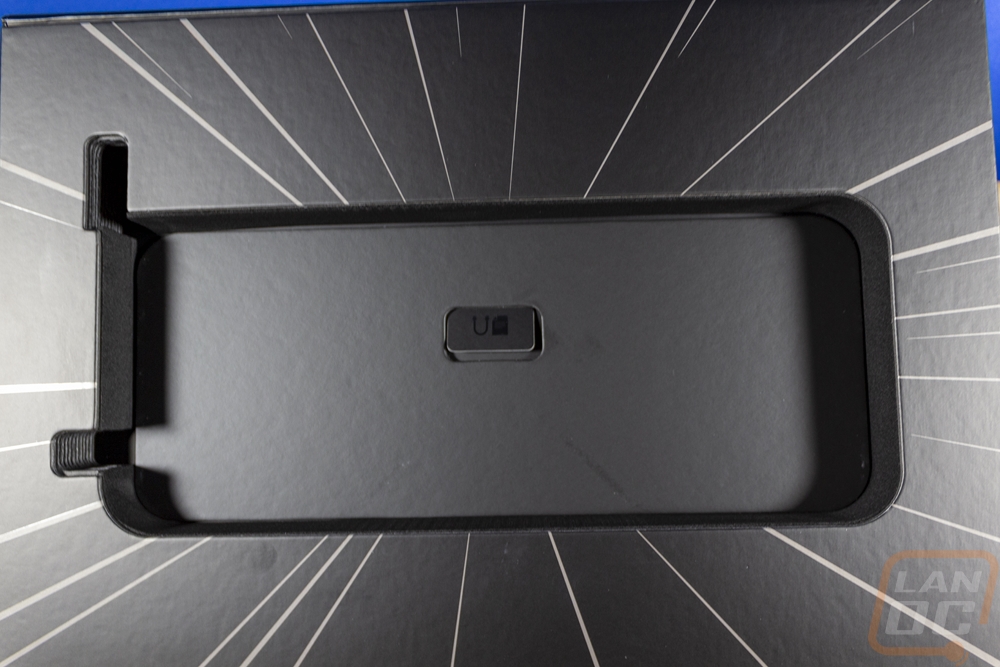
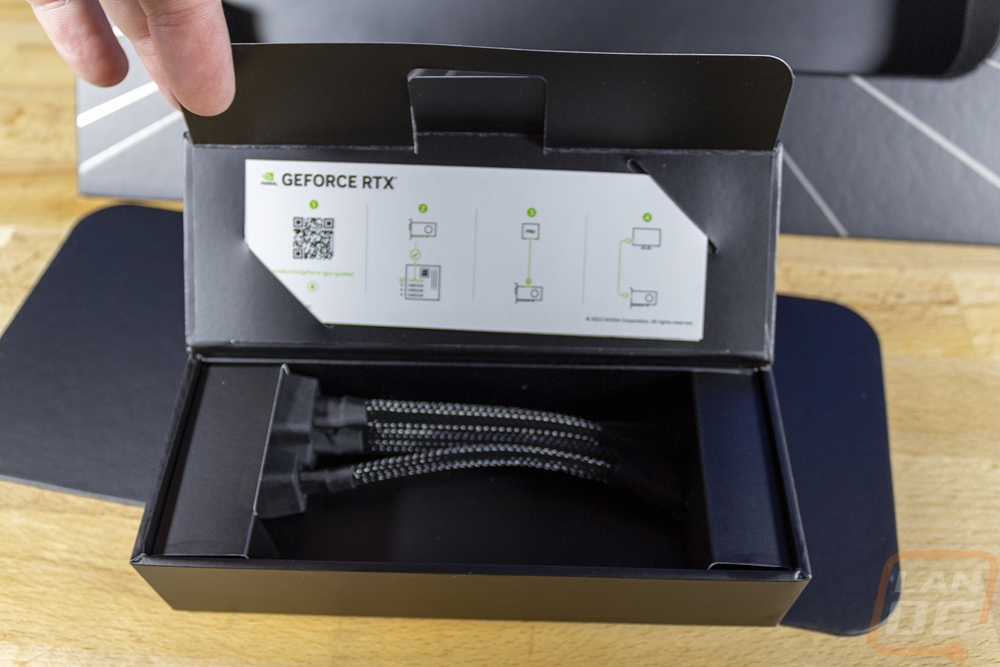
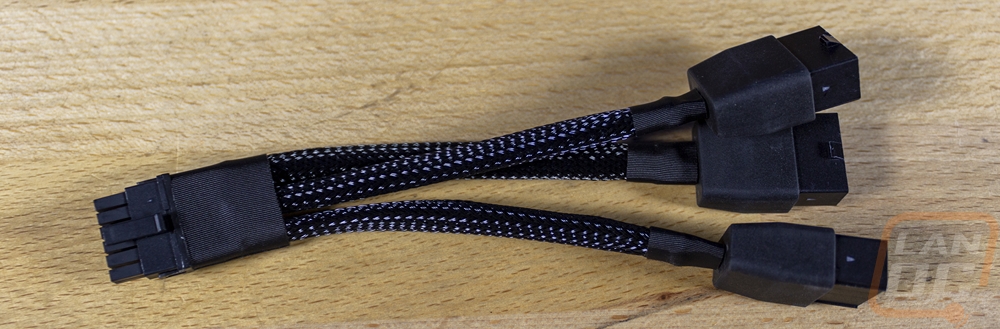
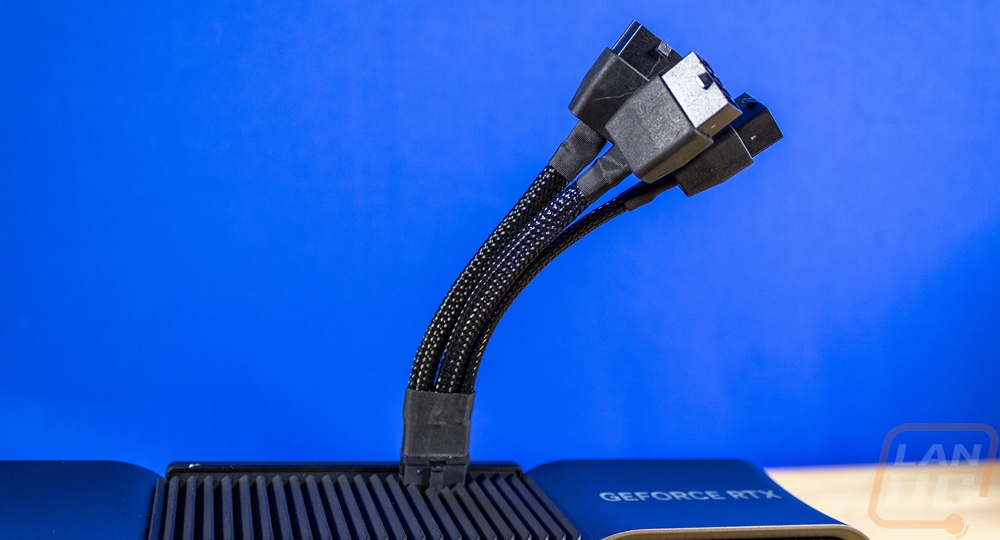
With the RTX 4080, Founders Edition out there is a pull tab in the card-shaped cutout. This is how you pull out the accessory box. That has a card with a QR code on it for installation instructions and three basic drawings showing you how to install the card. Beyond that, the box houses the power adapter, which all of the 3000 series cards came with as well but people may also know about these from problems that some of the RTX 4090s have had with their adapters. Unlike the RTX 4090 Founders Edition, however, this is a three-prong adapter not four with three 8-pin PCIe power plugs on one end going into the new smaller 12+4 aka the 12VHPWR plug. Like with the 3000 series cards, the idea with the new plug is to handle more power through a smaller connection to cut back on the power plug bloat that has been happening with some cards having 3 or more power plugs on them. The 12VHPWR plug is a new connection on the ATX 3.0 standard and the goal is obviously to move to these and not need the adapters in the future but Nvidia includes them because unless you buy one of the few ATX 3.0 power supplies that just recently came out you won’t have the plug.
Card Layout and Photos
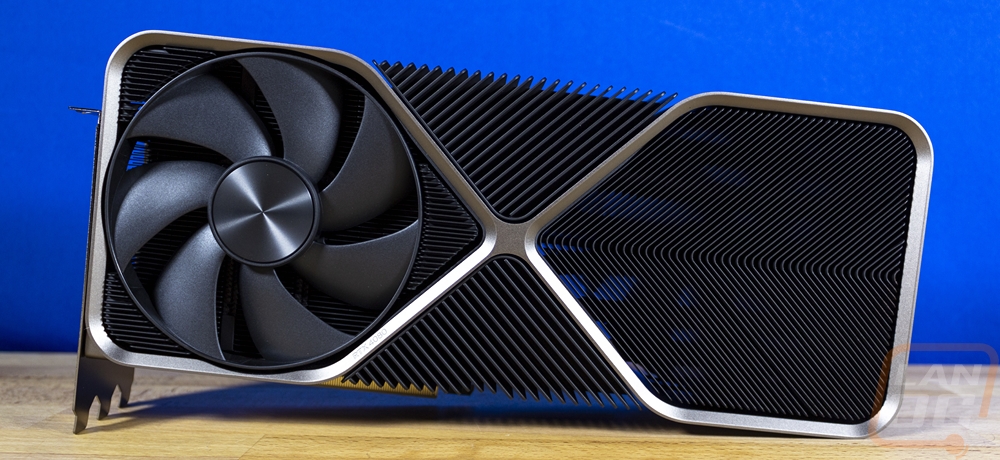
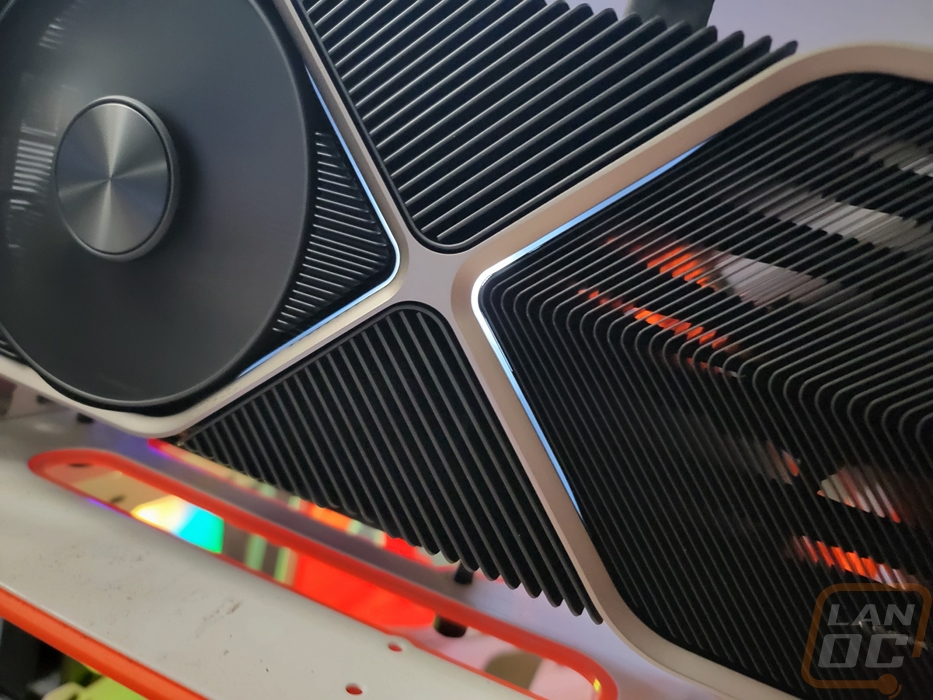
If you have seen any of the 3000 Series Founders Edition cards or the RTX 4090 Founders Edition the styling of the RTX 4080 Founders Edition is going to look familiar. Nvidia didn’t change the styling up at all for this generation. It has the same silver outline on the sides of the cards that I like to call the Infinity Hourglass due to its shape. This splits the card up into four sections and because the outside of the card, at least what is facing the sides, is all heatsink we can see the orientation of the heatsink layout. The left section has the left fan and the heatsink here is horizontal, designed to push some of this air out the PCI bracket end of the card. The two middle sections direct air up and down. Then the back has a V-shaped layout in the blow-through design. The RTX 4080 Founders Edition shares the same heatsink as the RTX 4090 Founders Edition which includes a larger fan than the RTX 3090 and 3090 Ti had and the same huge size.
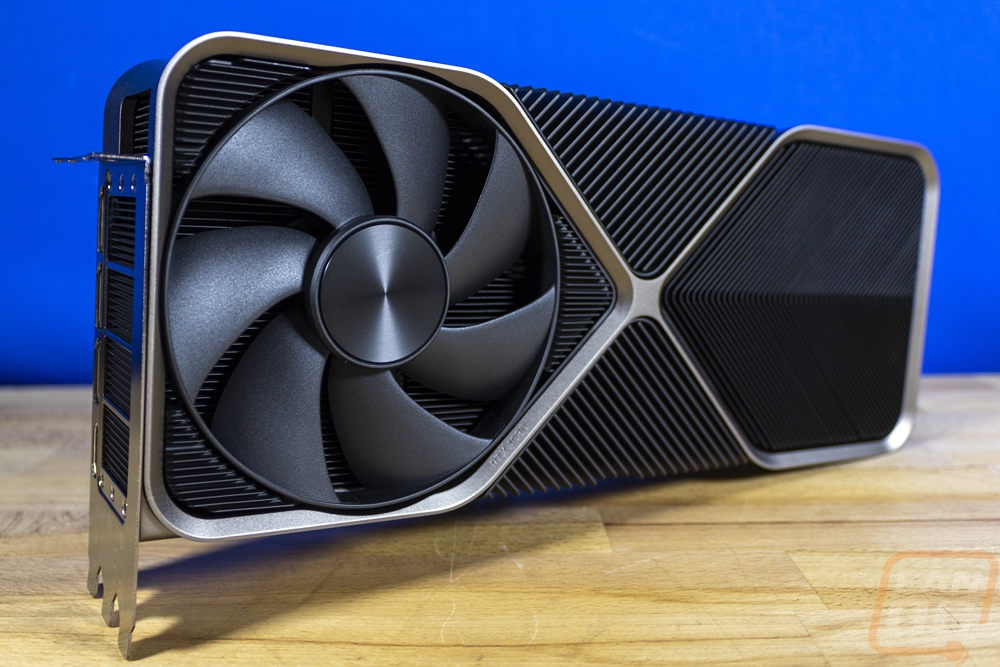
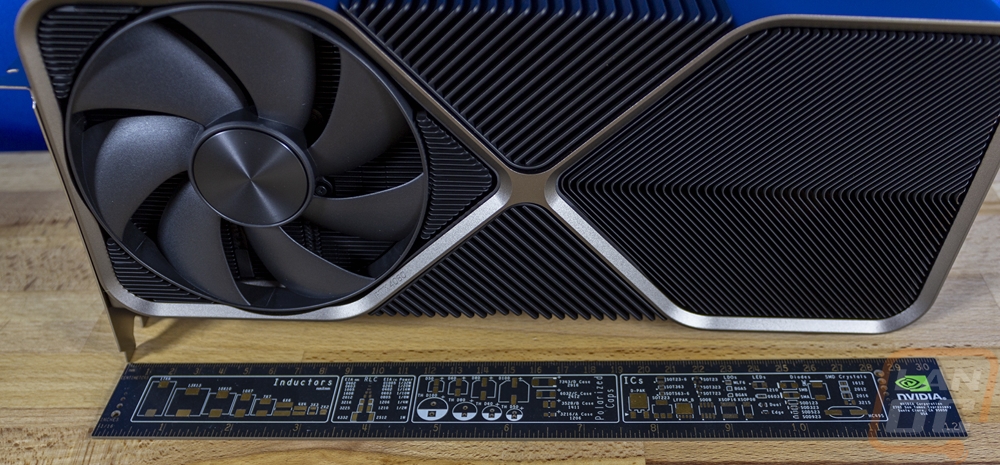
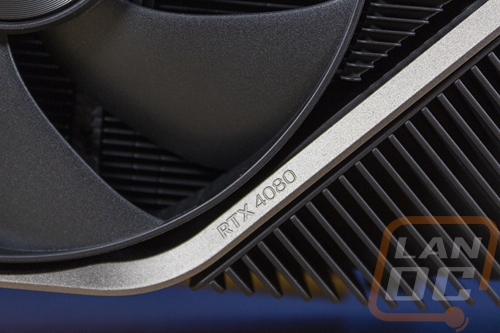
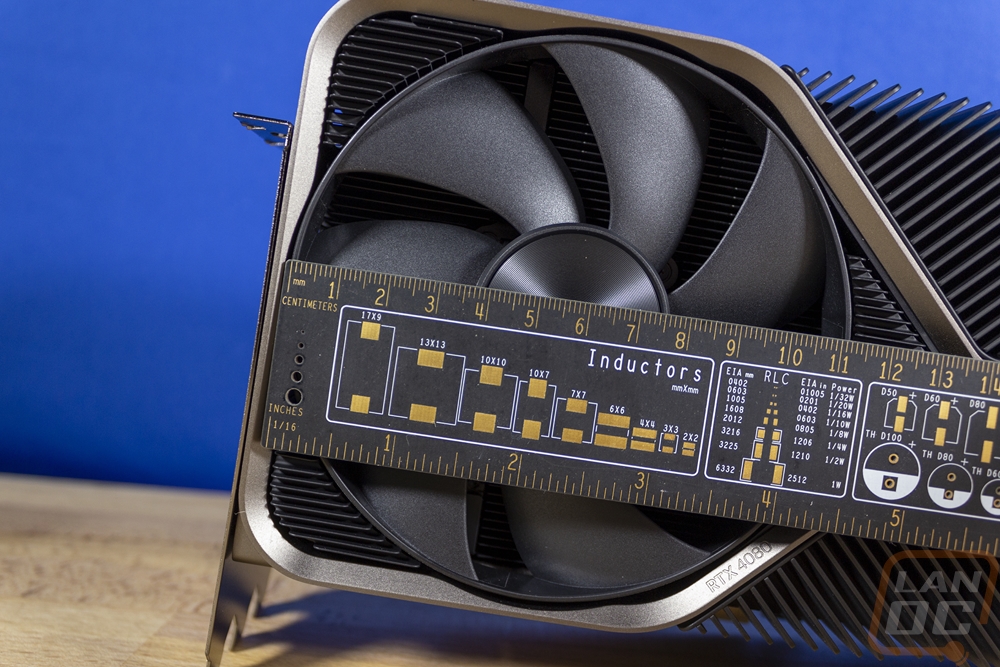
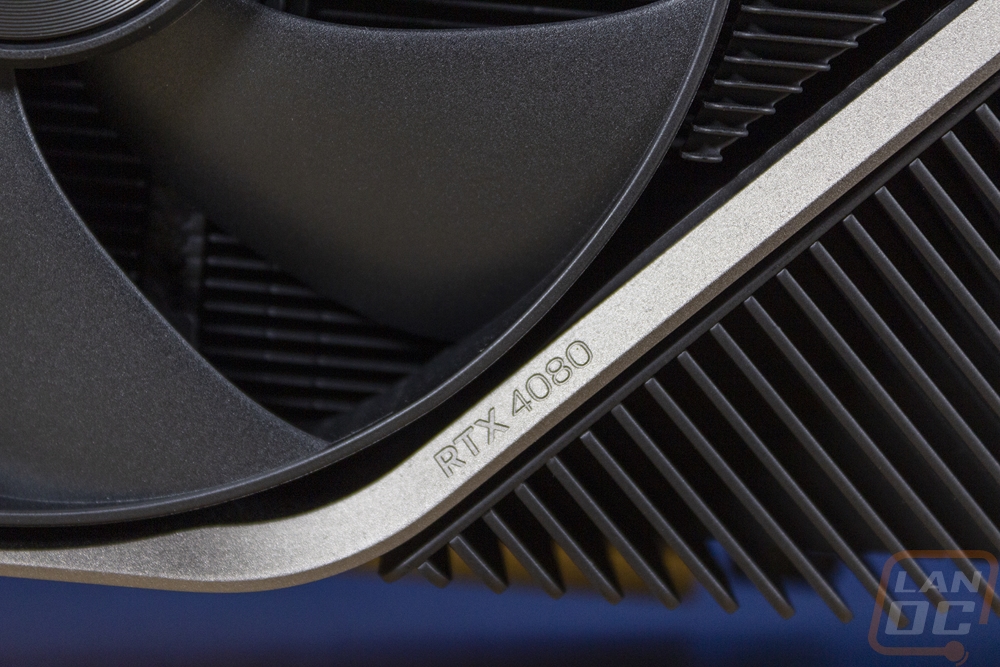
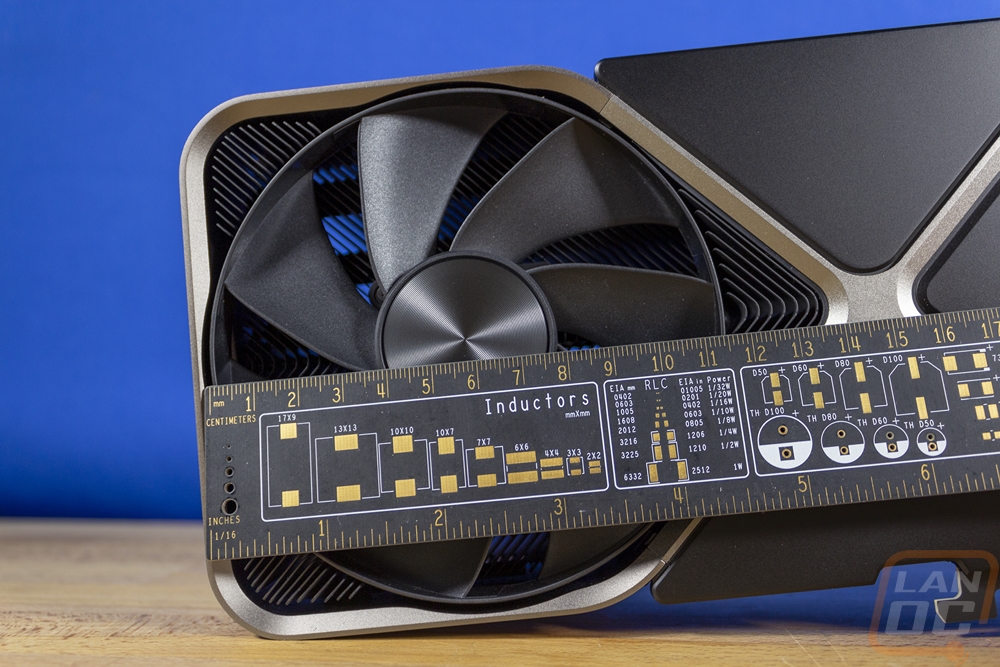
The RTX 4080 Founders Edition is 336mm or 13.2 inches long and 140mm or 5.5 inches tall which is significantly larger than Nvidia’s reference or Founders Edition cards in the past except for the 3090s and the 4090 which have this same larger size. The fan on the front side of the card is 110mm wide and has 7 blades and an outer ring that gives the blades more stability. On the silver infinity hourglass, they do have the RTX 4080 model number molded into the metal which is hard to even see but is a great looking touch. Then the heatsink is all blacked out along with the fan which gives that silver access a lot of contrast.
The back side of the RTX 4080 Founders Edition has a second matching fan like the front which you can see is so large that they had to cut out some of the silver accent out. But beyond around there the rest of the back has a metal backplate covering up the entire PCB. The infinity hourglass shape is still here and this side has the Nvidia logo molded into it like the 4080 branding on the other side. The backplate also has the RTX 4080 model number printed on to it upside down so it could be visible when installed in a PC.
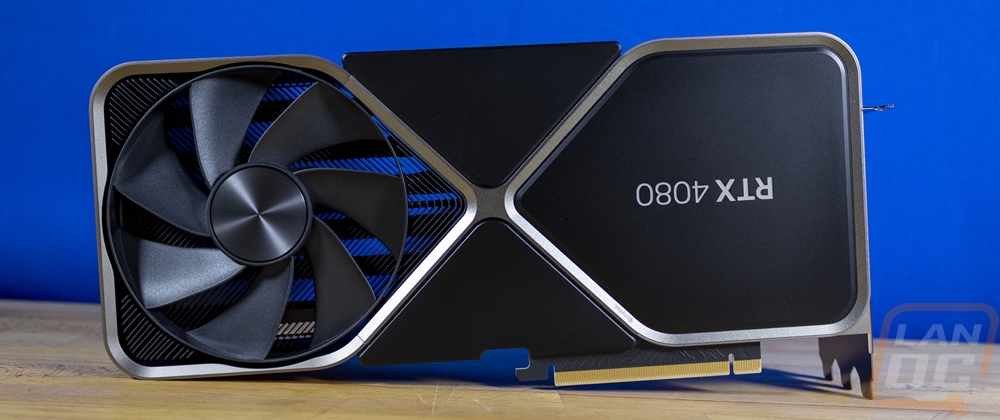
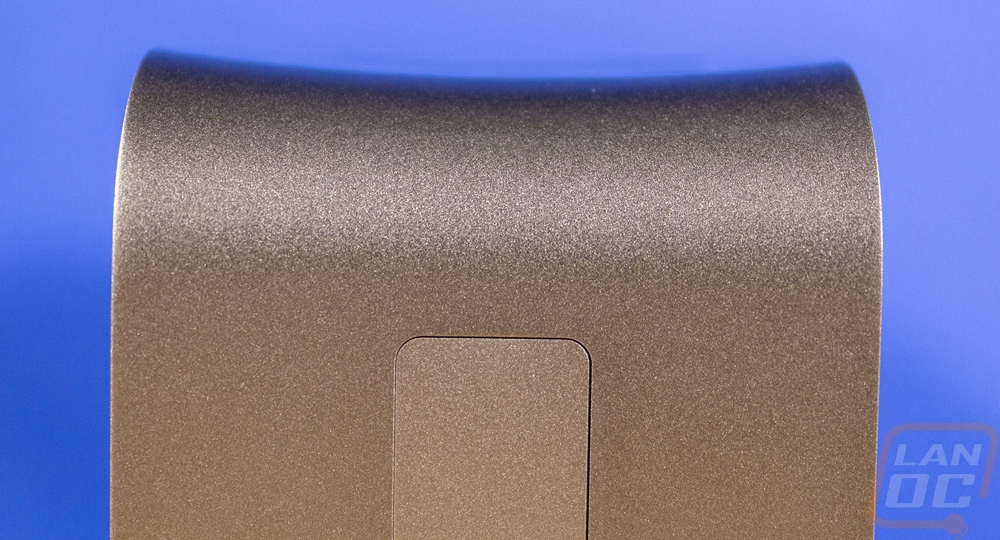
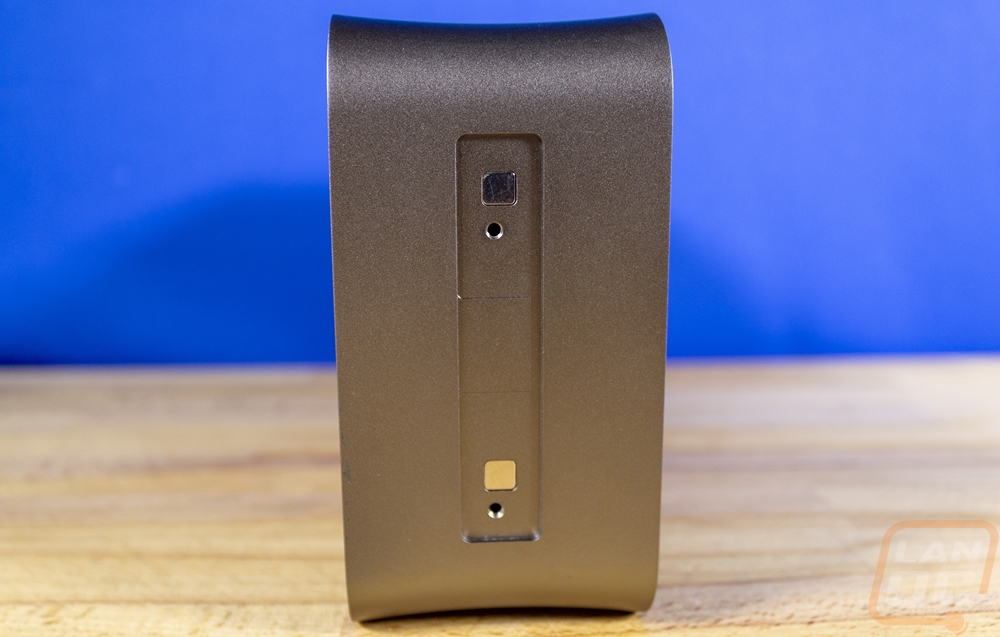
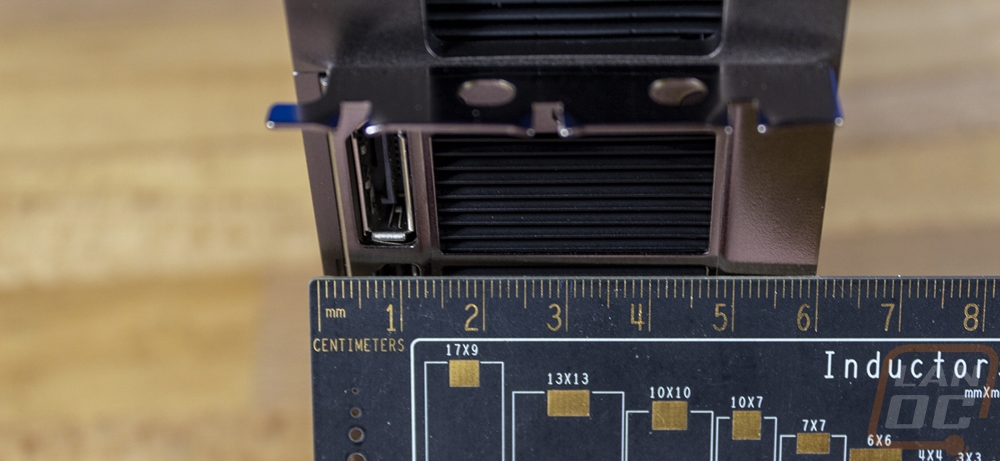
The silver infinity hourglass does run the width at the top and end of the card in the areas it is exposed. The top also has an interesting concave shape to it. Then on the end, the card is solid but it does have a removable panel. This is held in place with magnets and hides the two mounting points that can be used for OEM installations, servers, and for holding up the card.
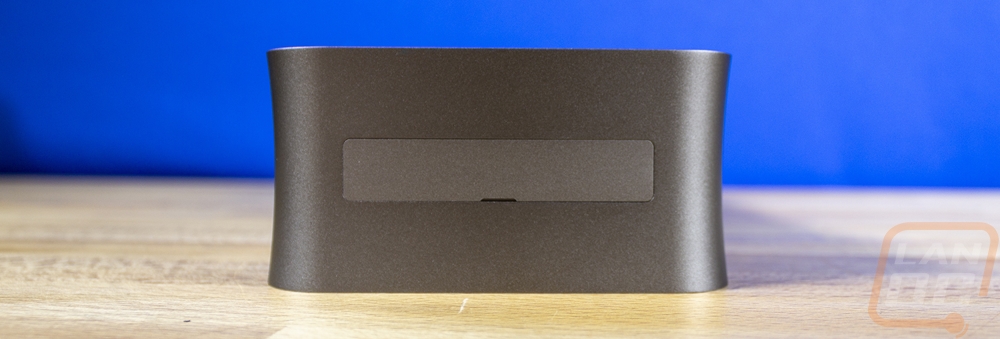
The top and bottom of the RTX 4080 Founder Edition have a similar layout with the exposed heatsink in the middle and the solid sections that are part of the infinity hourglass on the ends.
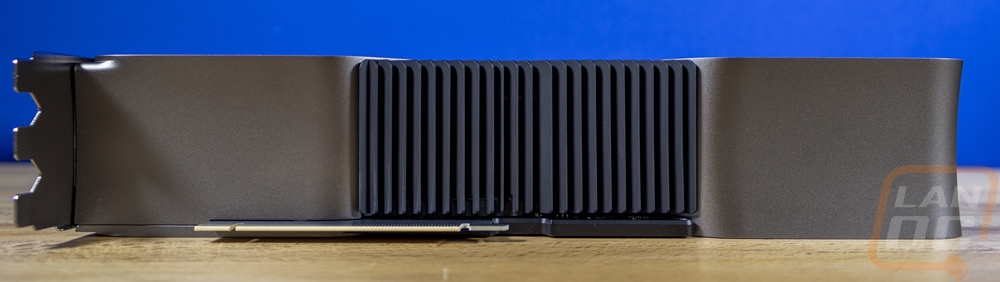
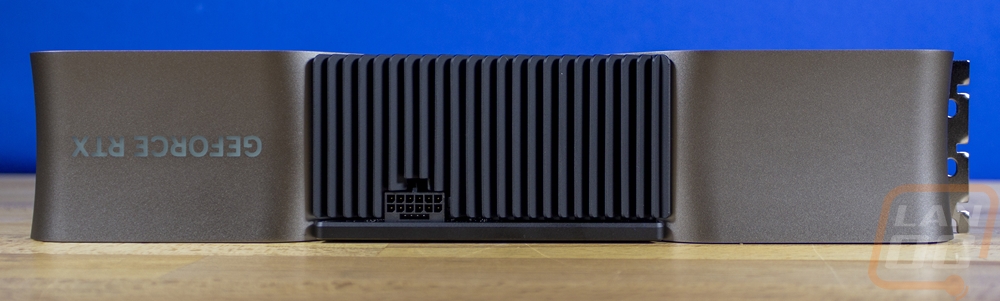
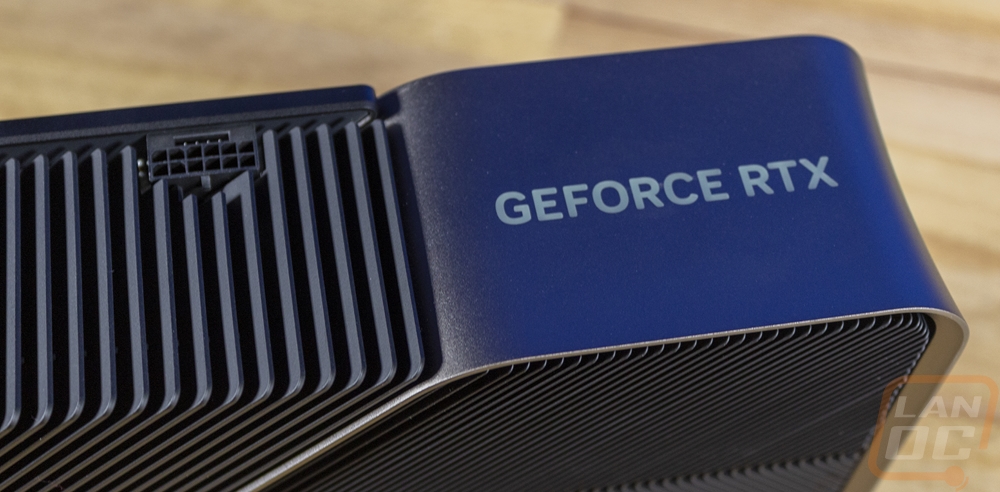
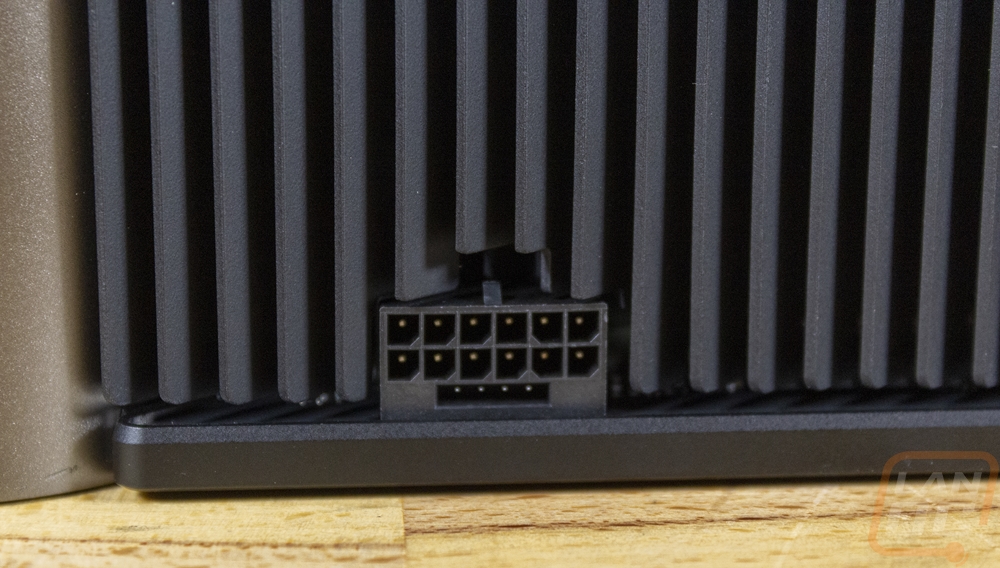
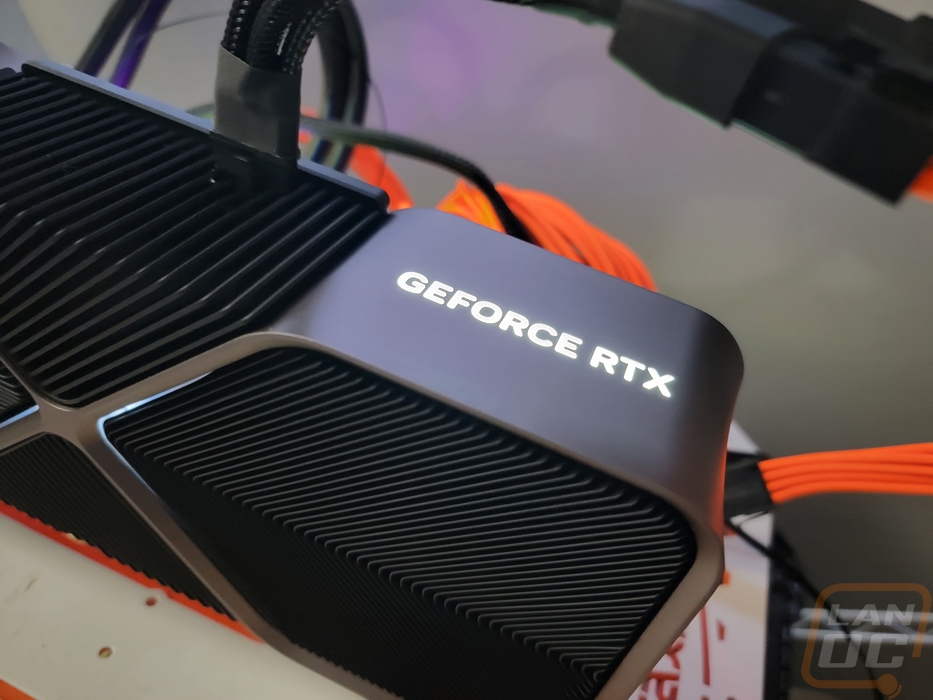
On the top edge of the card, Nvidia does have their GeForce RTX branding which is backlit. I would still prefer this to have the RTX 4080 model name personally, it's always cool to be able to show off what card you have rather than Nvidia’s brand. Also on the top, we have the power connection and nothing here has changed from the RTX 4090 Founders Edition. The plug is at the end of the PCB facing direction up which puts it a little past the halfway point on the card. The big change from the 3080 FE is that this isn’t angled at all, but this is the same 16-pin 12VHPWR connection that the 3090 Ti and 4090 both have even though the RTX 4080 does have slightly lower power requirements. This connection can be found on new ATX 3.0 power supplies and on the adapter that Nvidia included.
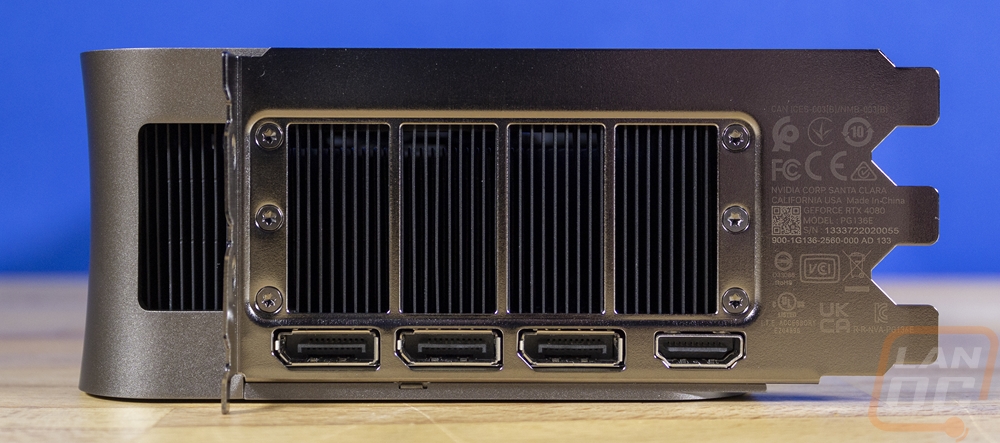
For the PCI bracket end, you can really see the thickness of the triple slot card here. The RTX 4080 Founders Edition has the same 3 DisplayPort and 1 HDMI connection configuration that Nvidia has been using on all of their cards. The HDMI is down at the bottom now, not in the middle which helps prevent any confusion. The bracket also has all of the certification logos and legal information etched on it. This also includes your serial number as well. Then for airflow, they have four large openings, not an array of smaller holes like they have done in the past. While the card isn’t a blower design, this layout does help a lot with airflow.
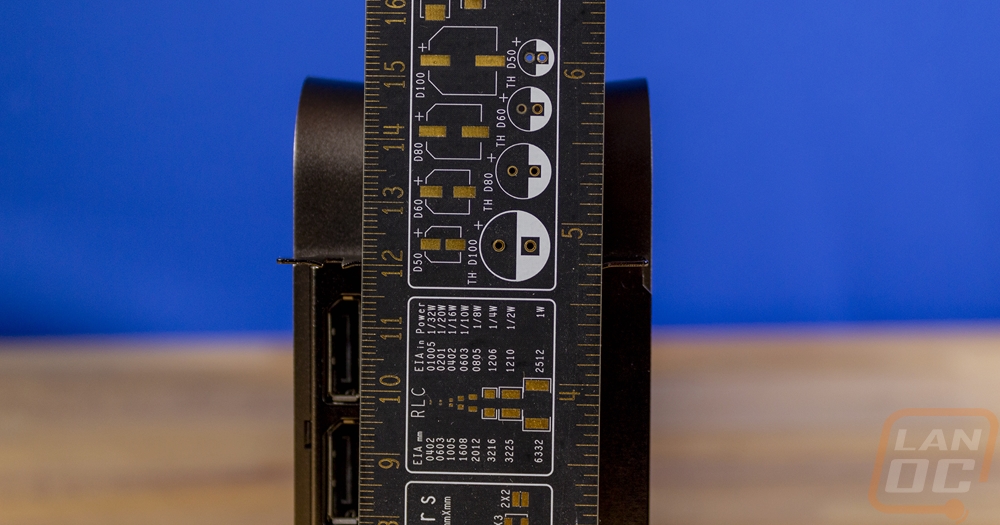
As I mentioned this is a full triple slot card which comes in at 60mm in width. But it is also a tall card, the point of view below shows how it has an extra 30mm over the top of the PCI bracket. This combined with the power plug being on top can cause fitment issues and while we are still waiting to find out more about the 4090 adapter issues that some people have had. That layout and this height doesn’t help things as well, forcing the cable or adapter to be bent way over.
For lighting, Nvidia hasn’t changed anything from the RTX 4090 Founders Edition or the higher-end 3000 series cards for that matter. The RTX 4080 Founders Edition has white lighting on the two sides of the middle of the infinity or hourglass loop and then on the top, the GeForce RTX branding is backlit in white as well. With some software like iCue, you can change these from white to other colors as well.
Test Rig and Procedures
Test System
CPU: Intel Core-i9 12900K – Live Pricing
Motherboard: MSI MEG Z690I UNIFY Gaming Motherboard – Live Pricing
Cooling: Corsair H100i Elite LCD Display - Live Pricing
Noctua NT-H1 Thermal Paste - Live Pricing
Memory: Crucial 32GB Kit (2 x 16GB) DDR5-4800 UDIMM– Live Pricing
Storage: Sabrent Rocket Q4 2TB – Live Pricing
Power Supply: Corsair AX1200 - Live Pricing
Case: Primochill Wetbench - Live Pricing
OS: Windows 11 Pro 64-bit - Live Pricing
|
Our Testing Procedures |
|
|
3DMark |
All 3DMark-based tests are done using the most recent version. We test using all three versions of Fire Strike and both Time Spy and Time Spy Extreme. Tests to look at ray tracing performance are done with Port Royal when supported and for Nvidia cards that support DLSS, the DLSS subtest is also done at 1440p with the performance setting and DLSS 2.0. |
|
Unigine Superposition |
1080p Extreme and 4k Optimized benchmarks along with the VR Future test are done. The VR test is done at the Oculus resolution |
|
VRMark |
Only the Blue room test is run |
|
CS:GO |
This test is done using the workshop map called CS:GO Benchmark. You can find more information at this link. https://www.gamingpcbuilder.com/how-to-install-csgo-fps-benchmark-map/ I test at 1080p, 1440p, and 4K resolutions. All auto settings are turned off and detail is set to their highest settings. shadow quality high, model texture detail high, shader detail very high, AA set to 16x, uber shaders enabled |
|
Mafia 2 Definitive Edition |
This uses the built-in benchmark to test High and Medium detail presets at 1080p, 1440p, and 4K resolutions |
|
Watch Dogs: Legion |
Built-in benchmark testing at ultra and high details. Tested at 1080p, 1440p, and 4k. I also do RTX and DLSS testing on Nvidia cards at 4K using the Ultra detail settings as a base as well. |
|
Borderlands 3 |
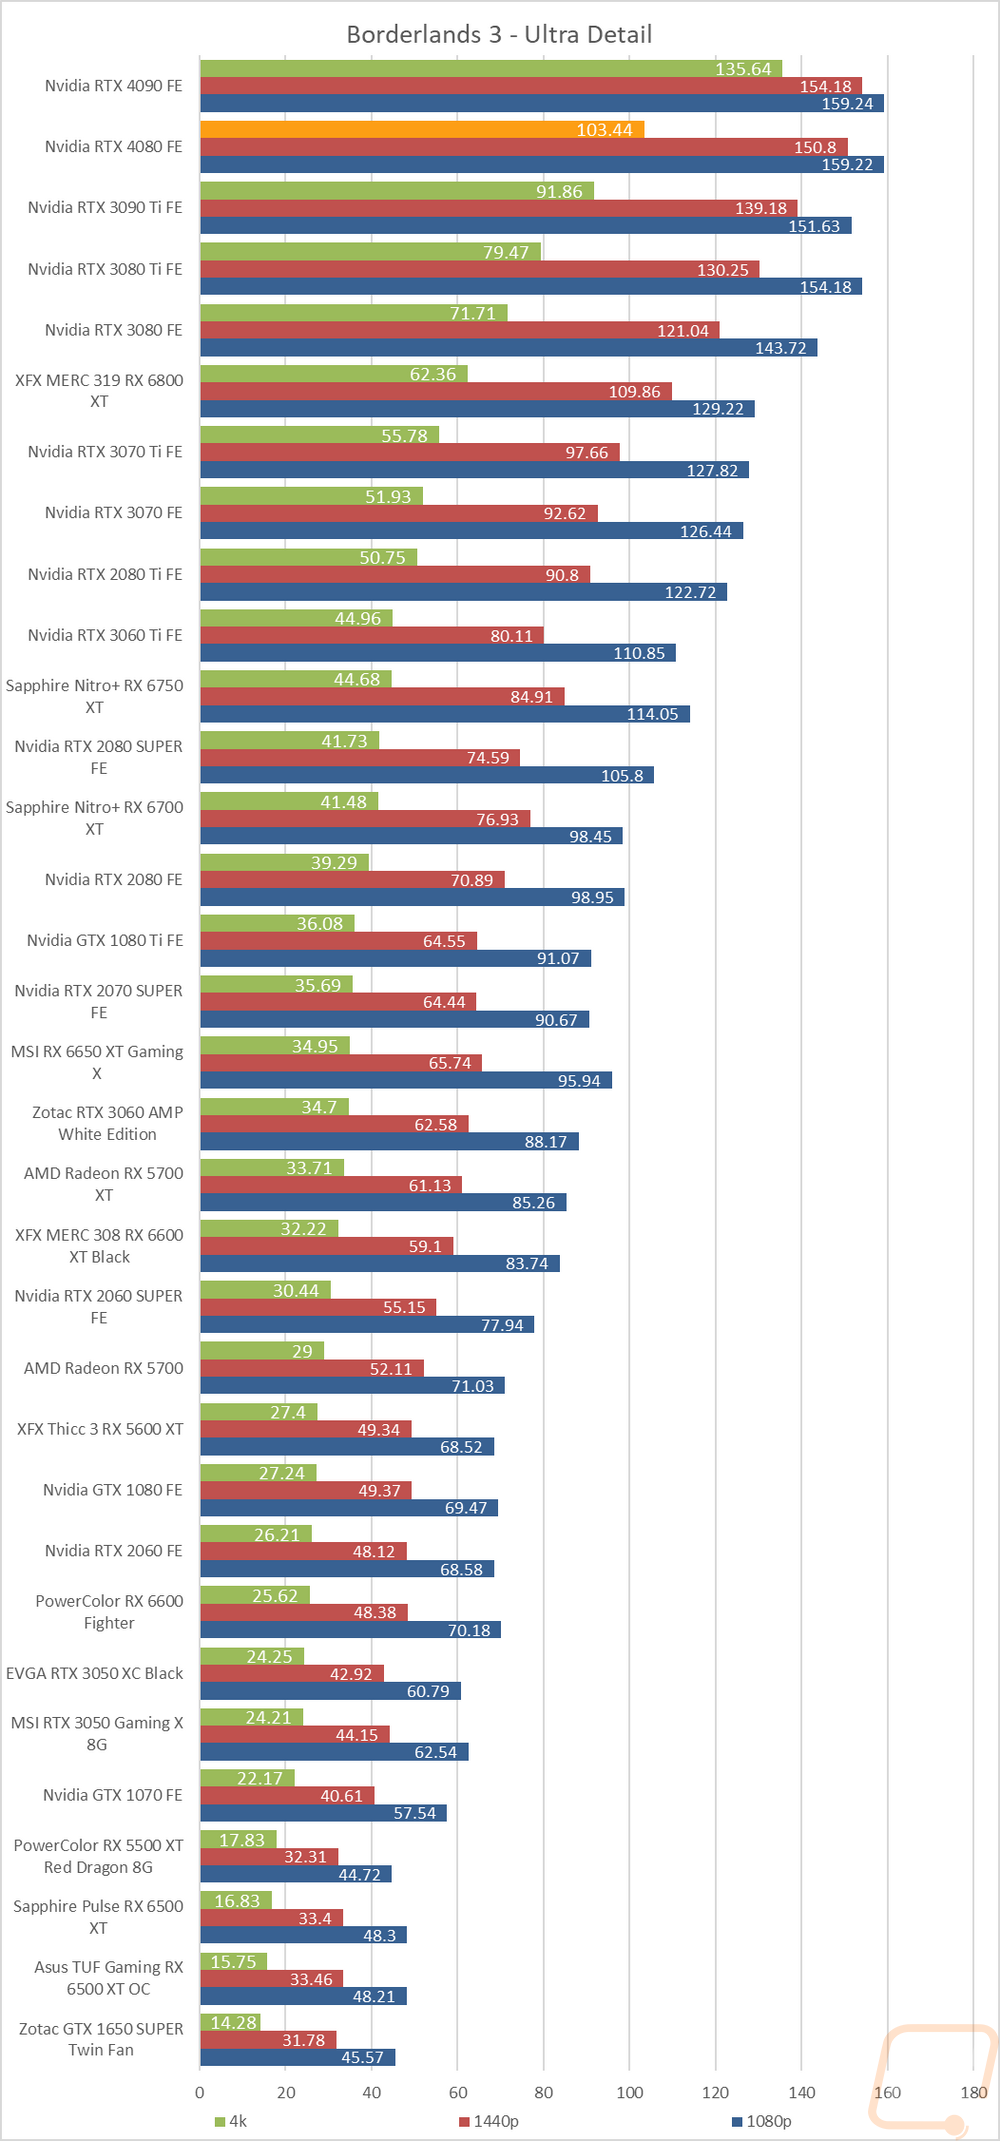
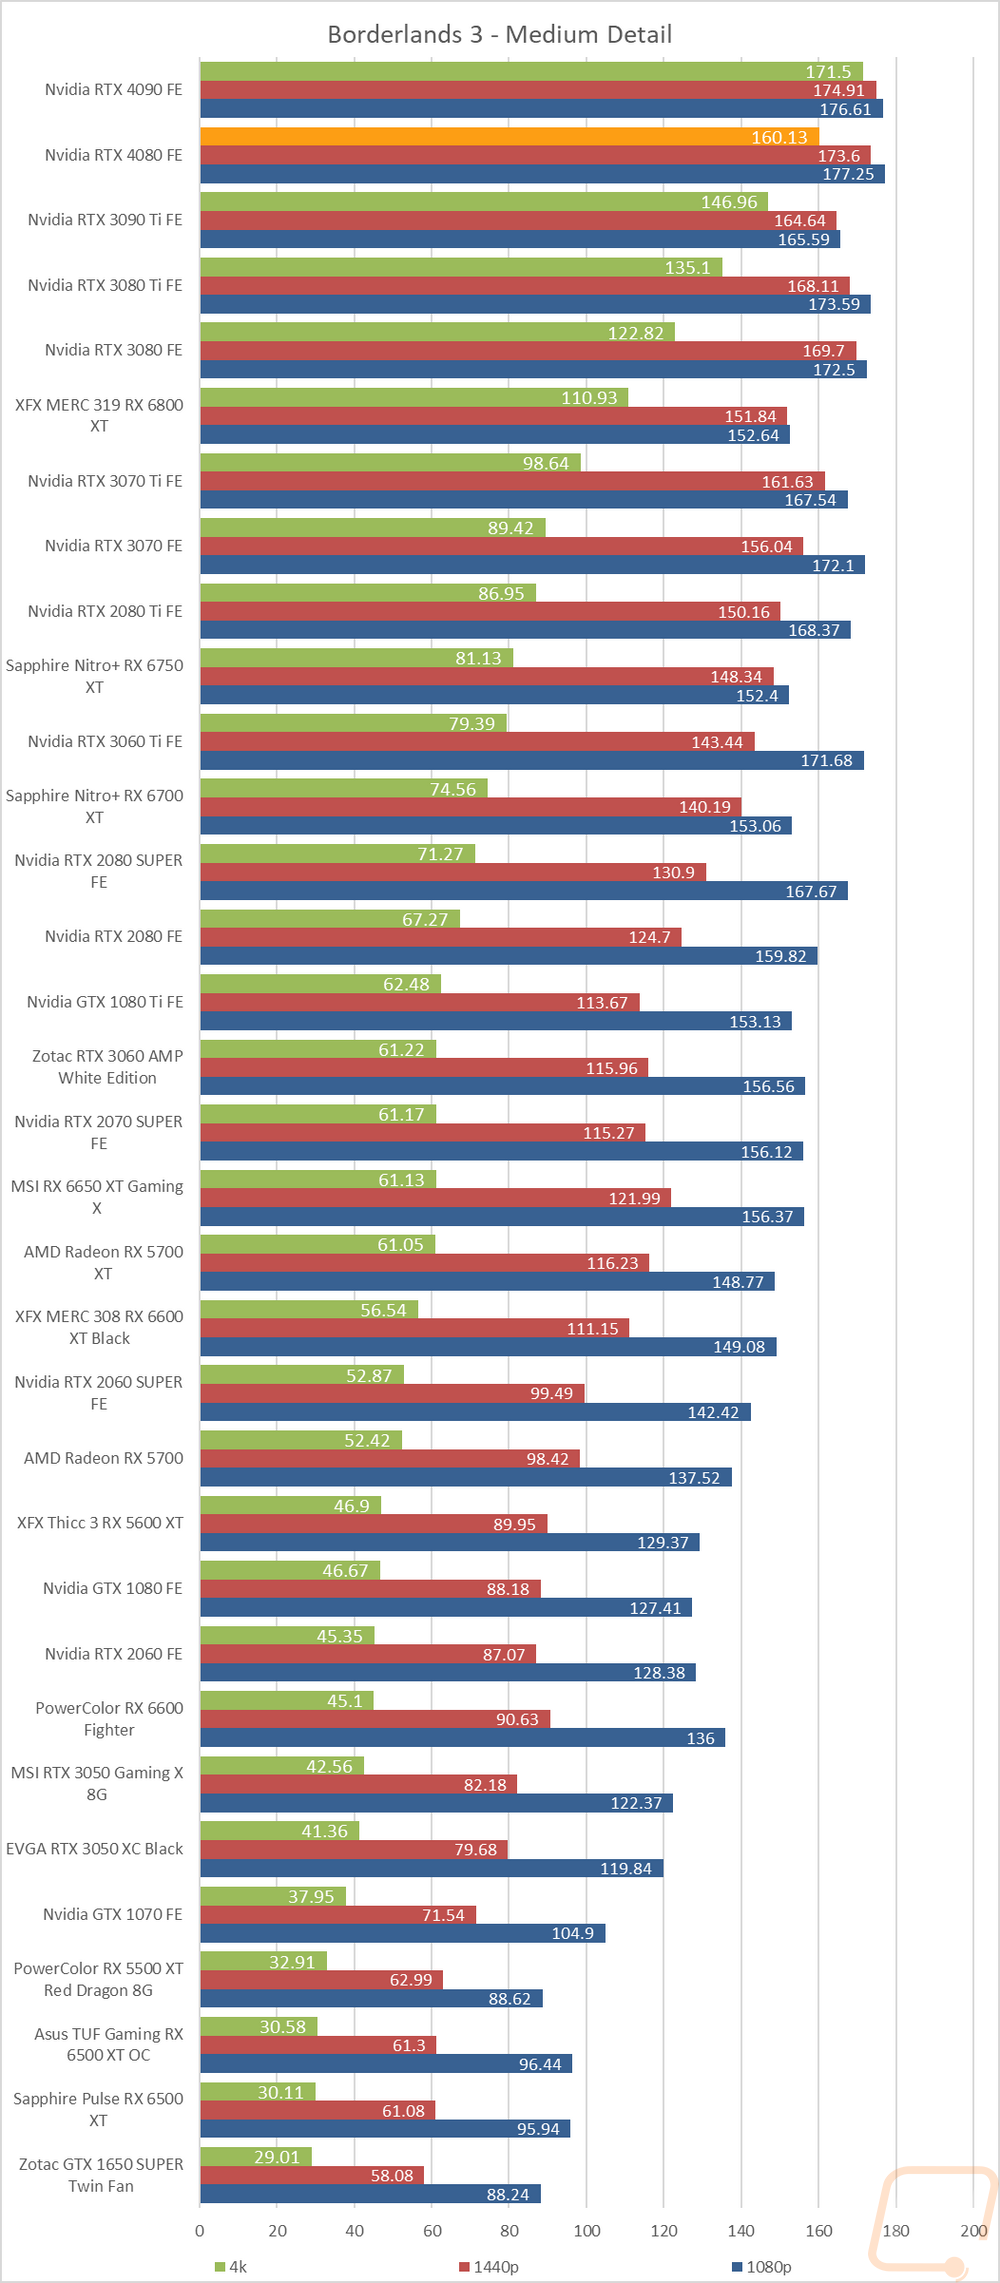
Built-in benchmark testing with the ultra detail setting and medium detail setting, done at full screen with default settings at 1080p, 1440p, and 4k on DX11 |
|
Metro Exodus |
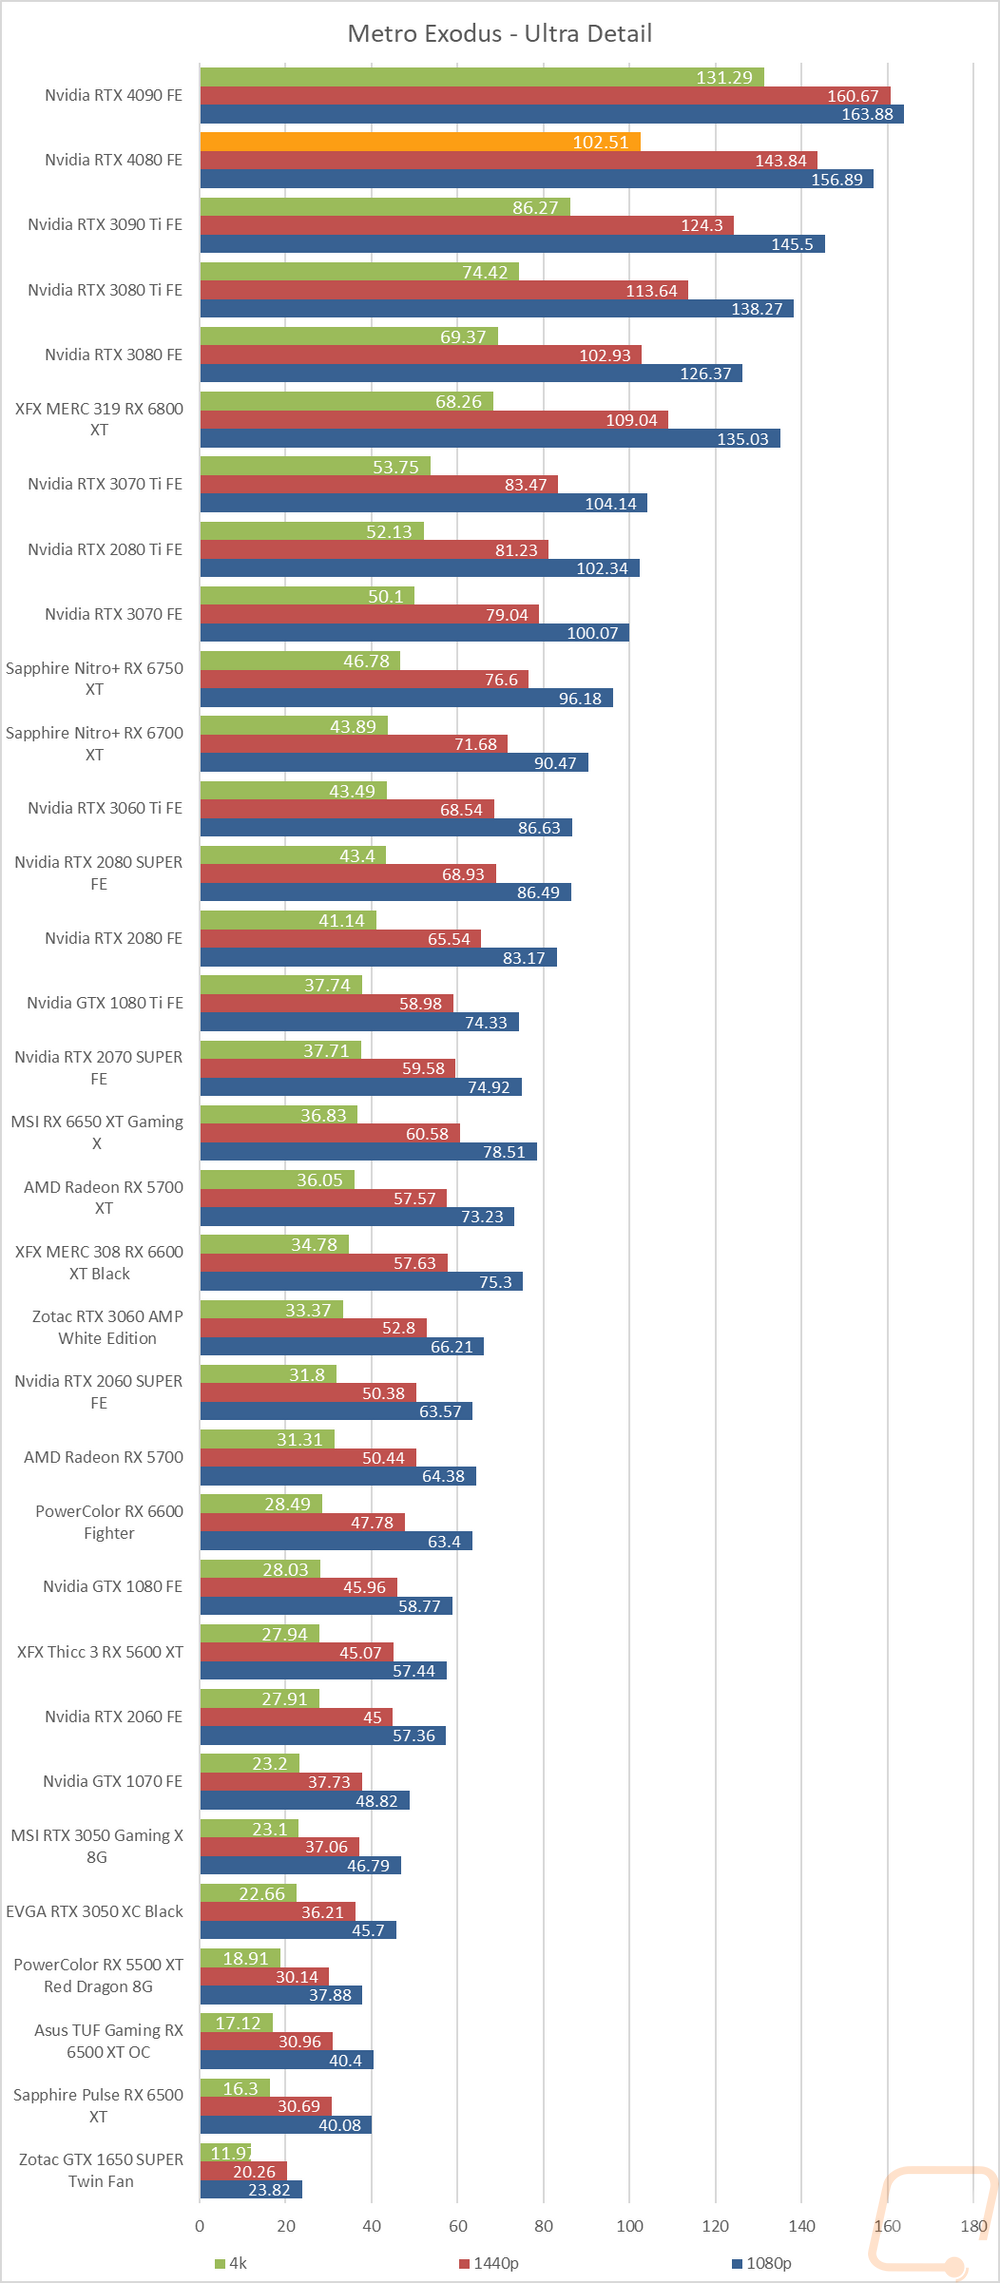
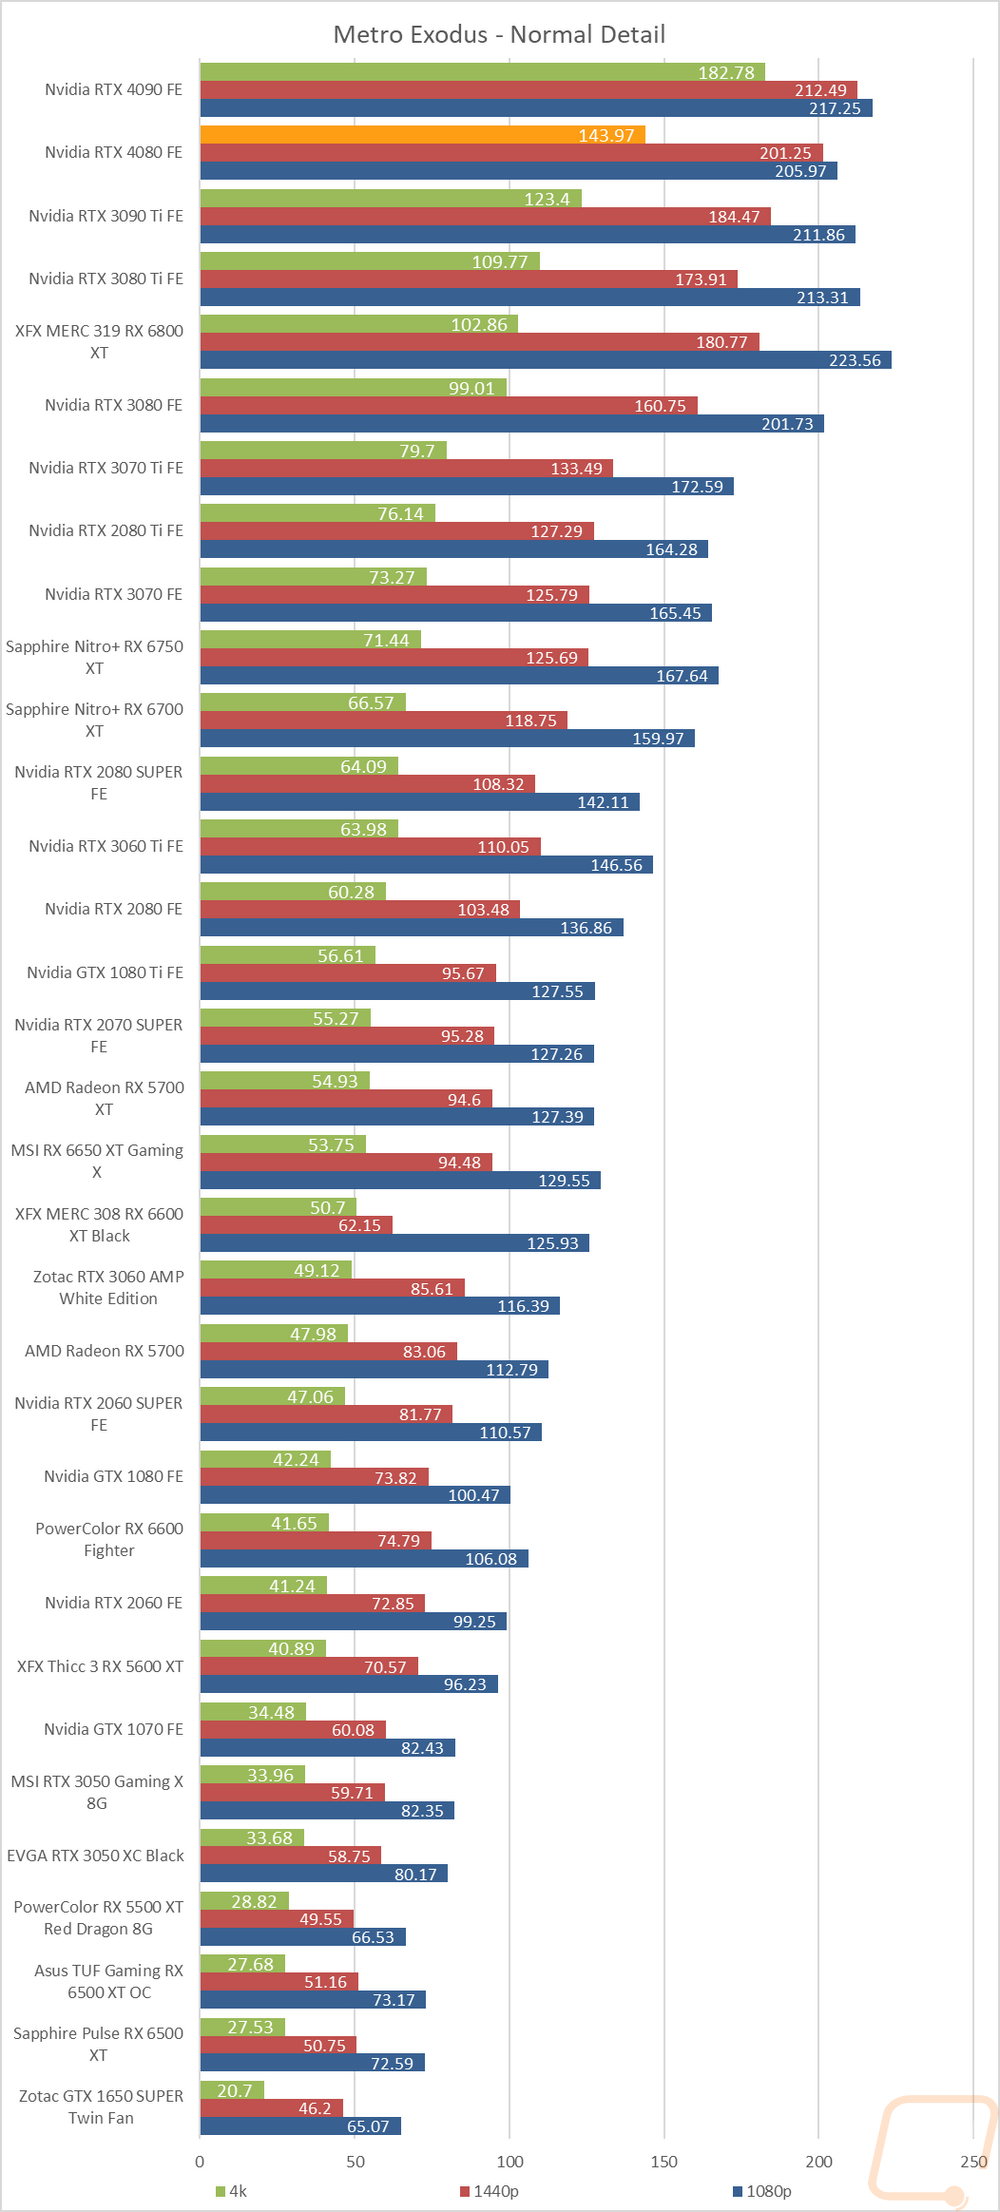
Using built-in benchmark, testing at ultra and normal details at 1080p, 1440p, and 4k. I also do RTX and DLSS testing at 4K with the ultra-detail base settings for Nvidia cards as well. |
|
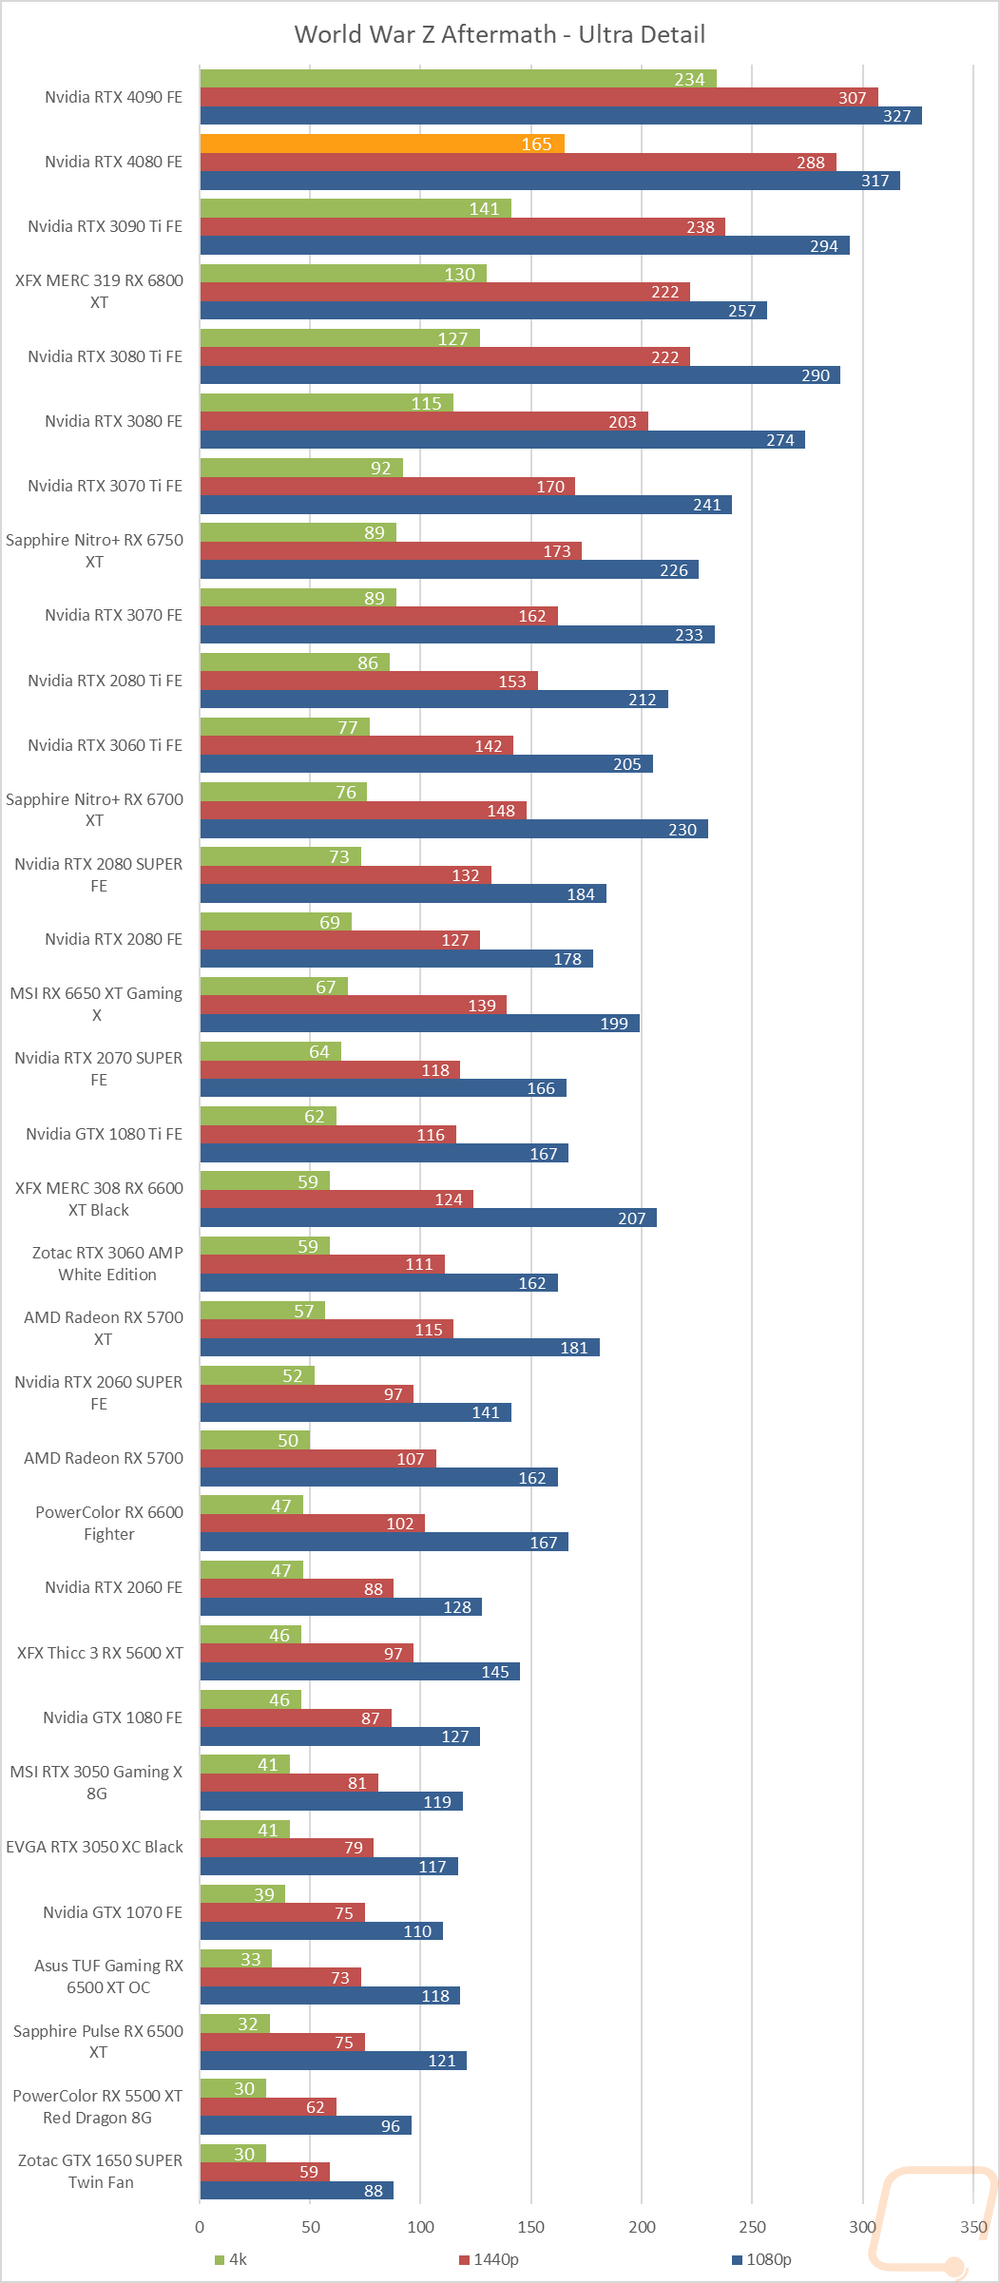
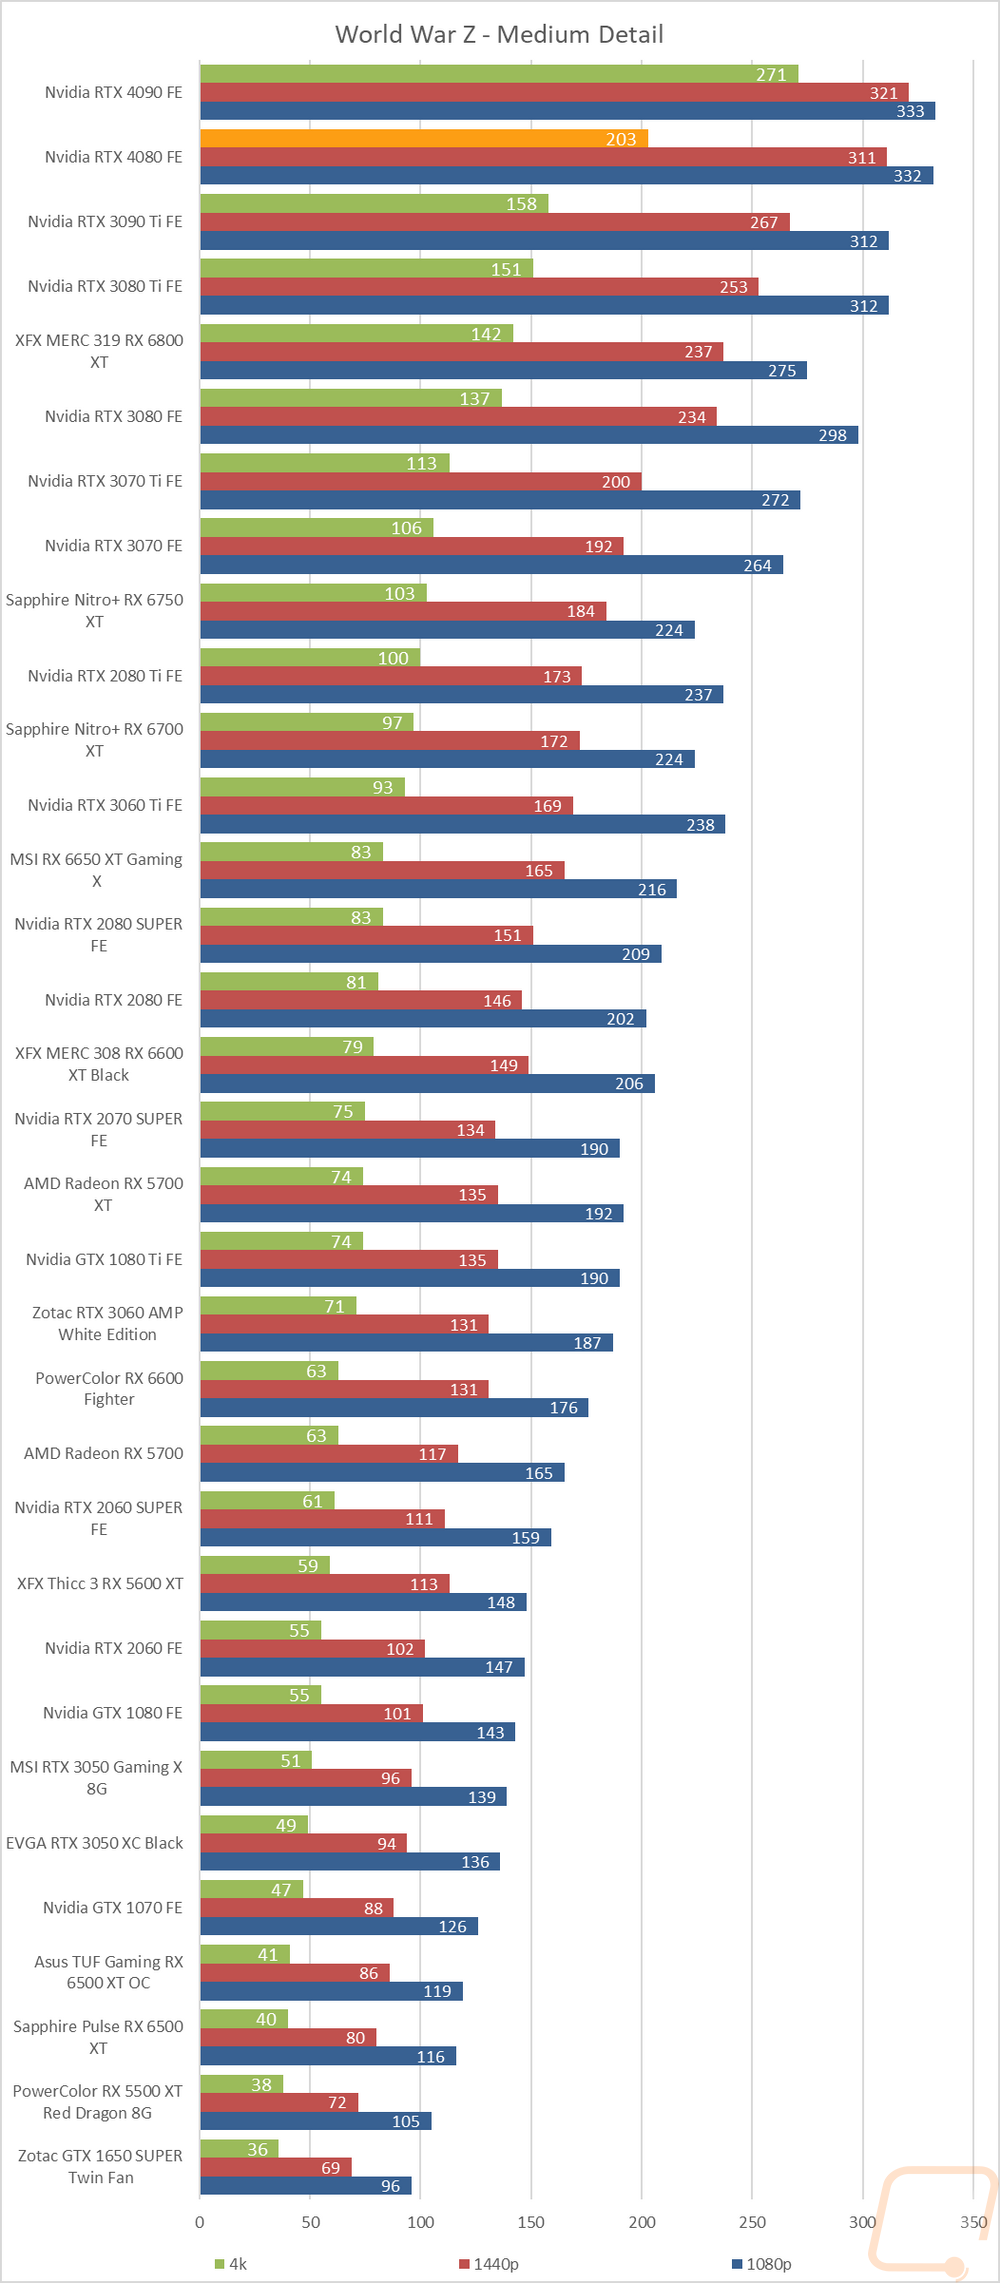
World War Z Aftermath |
The built-in benchmark in DX11 testing both the Ultra detail and Medium detail levels at 1080p, 1440p, and 4K resolutions |
|
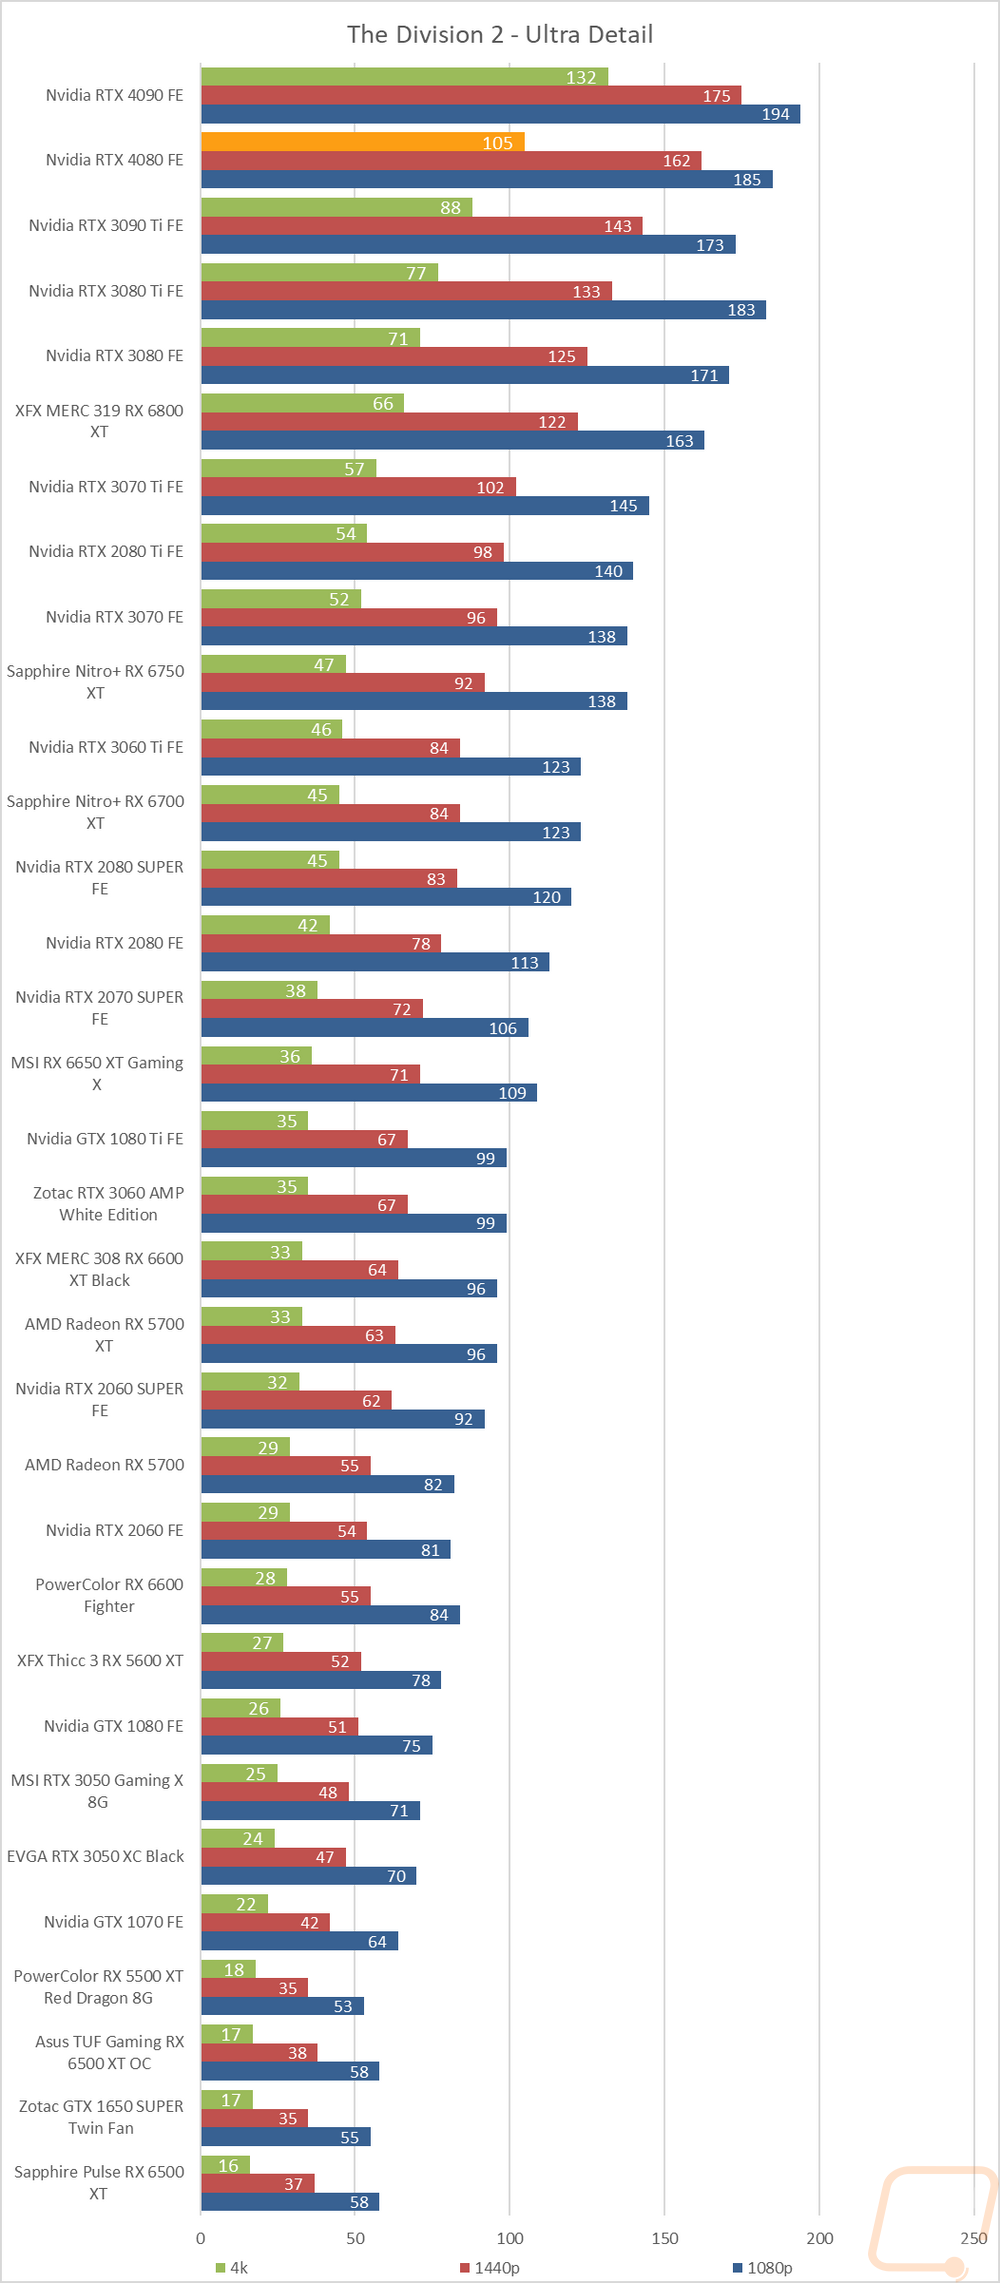
The Division 2 |
Built-in benchmark at Ultra detail with V-Sync turned off at 1080p, 1440p, and 4k resolutions. |
|
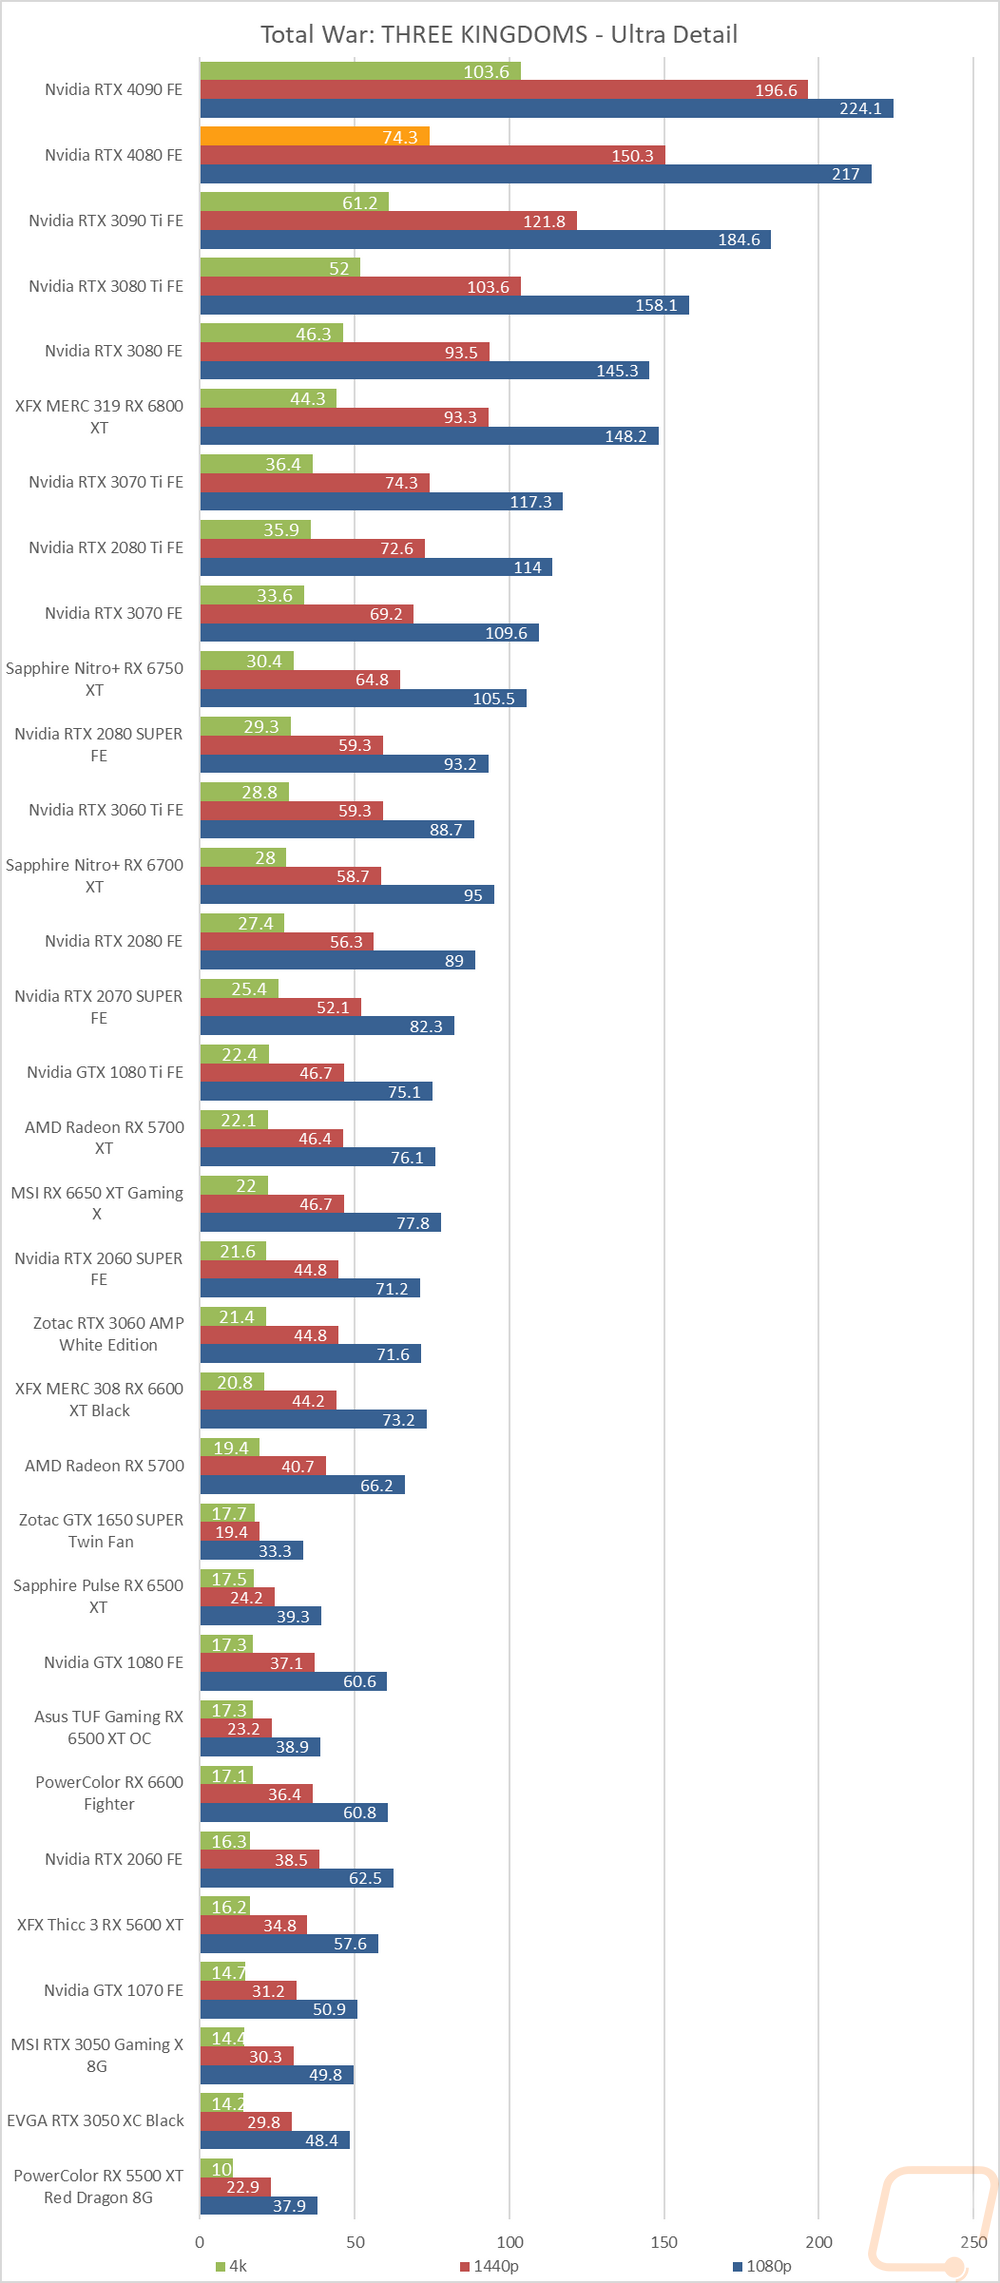
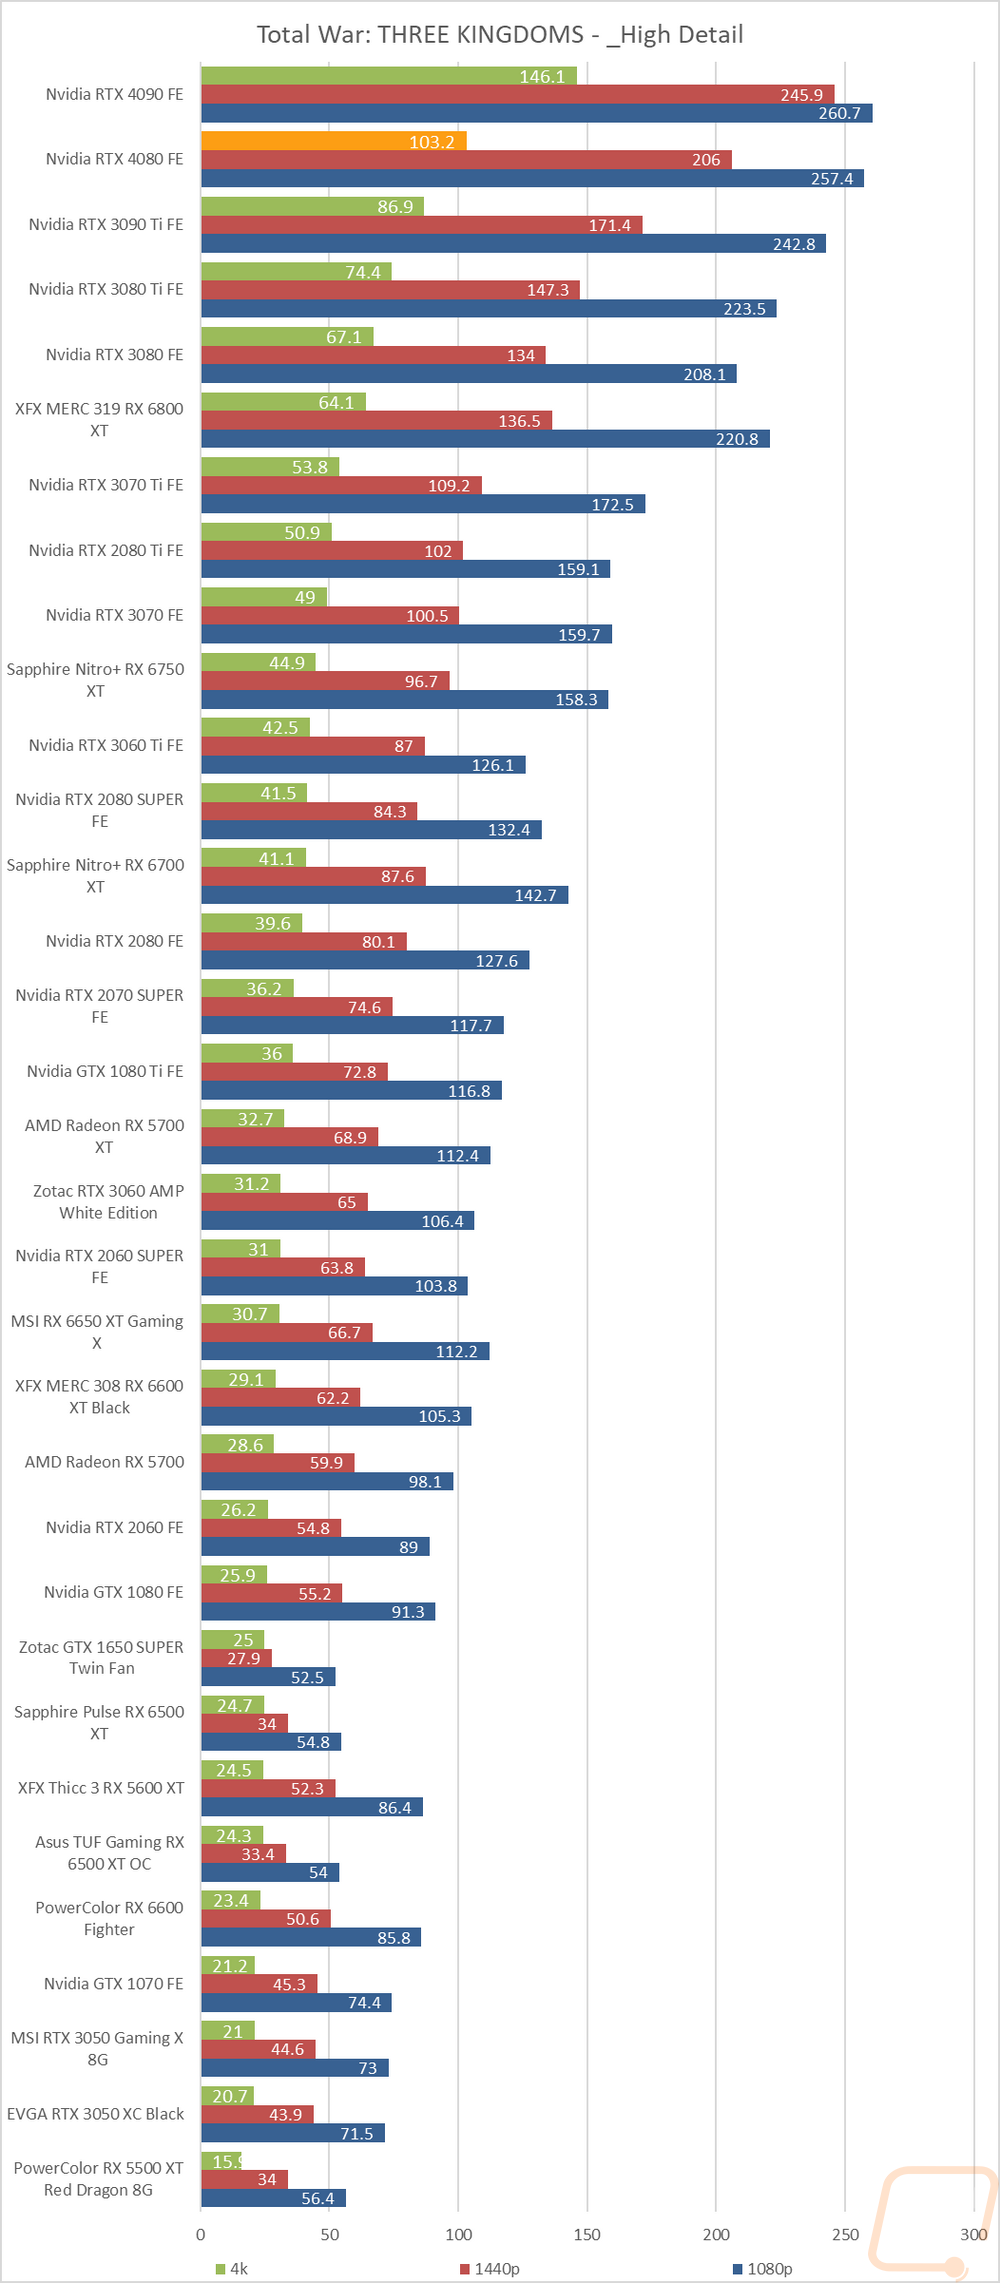
Total War: Three Kingdoms |
Built-in benchmark using the Battle Benchmark setting. Tested at 1080p, 1440p, and 4k at both high and ultra detail settings |
|
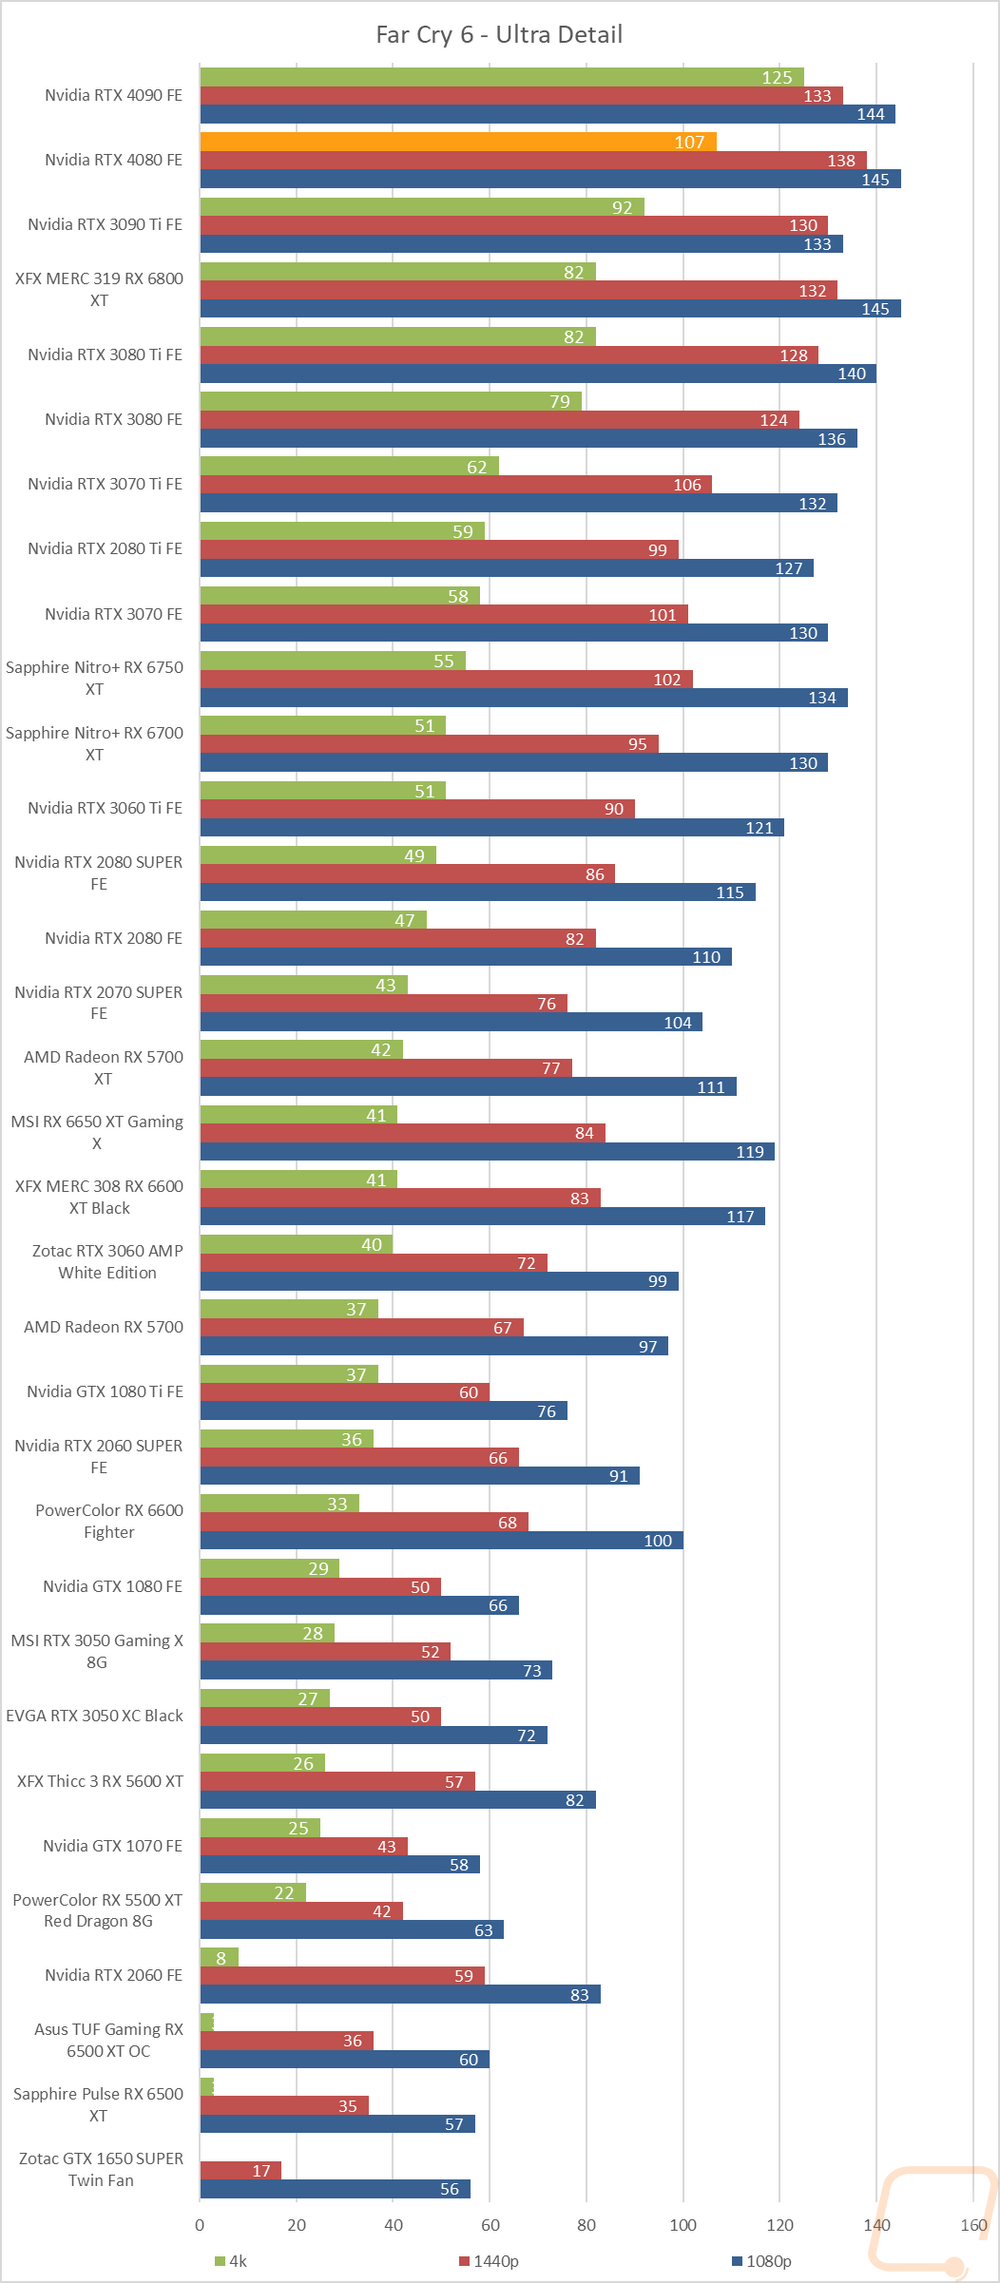
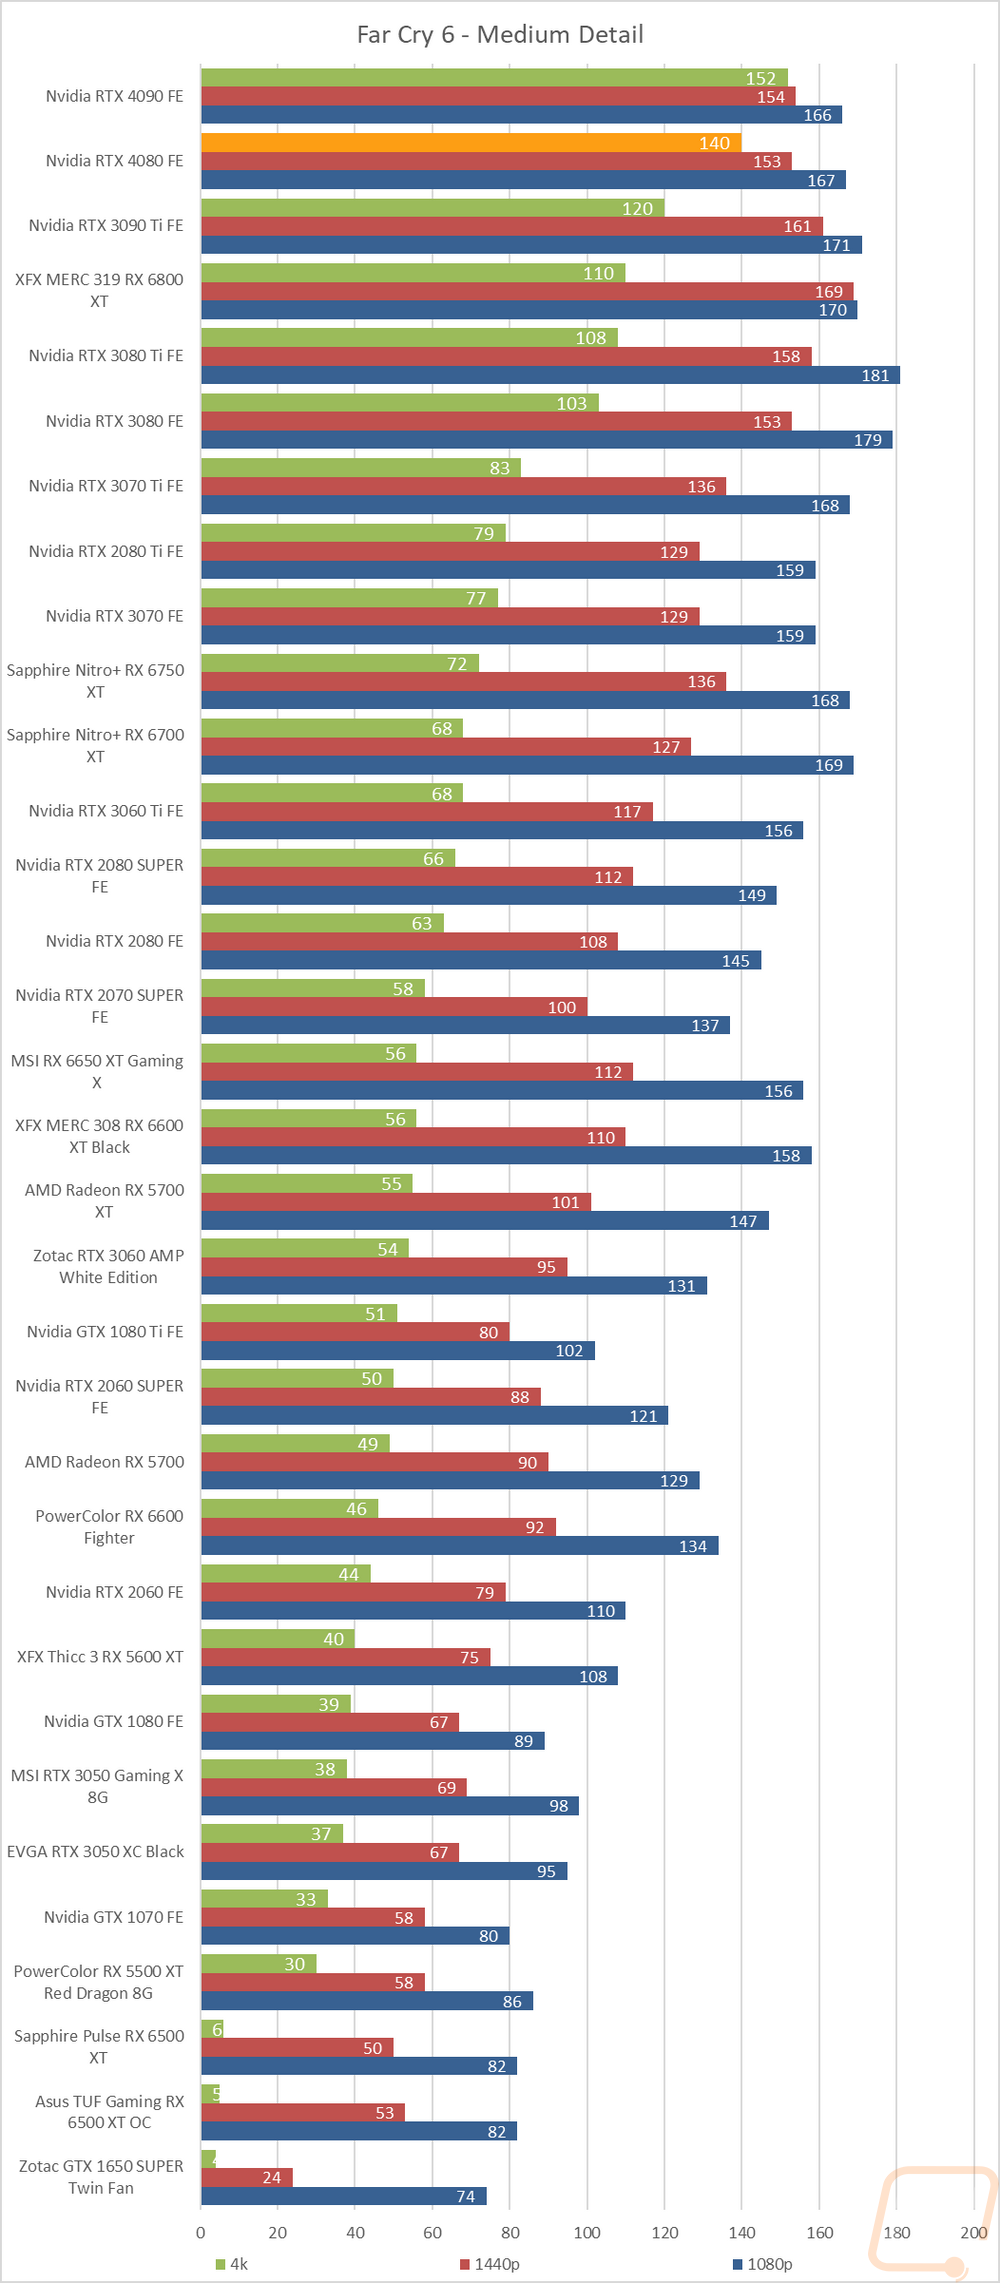
Far Cry 6 |
Built-in benchmark tested at 1080p, 1440p, and 4k with the Ultra and Medium detail settings |
|
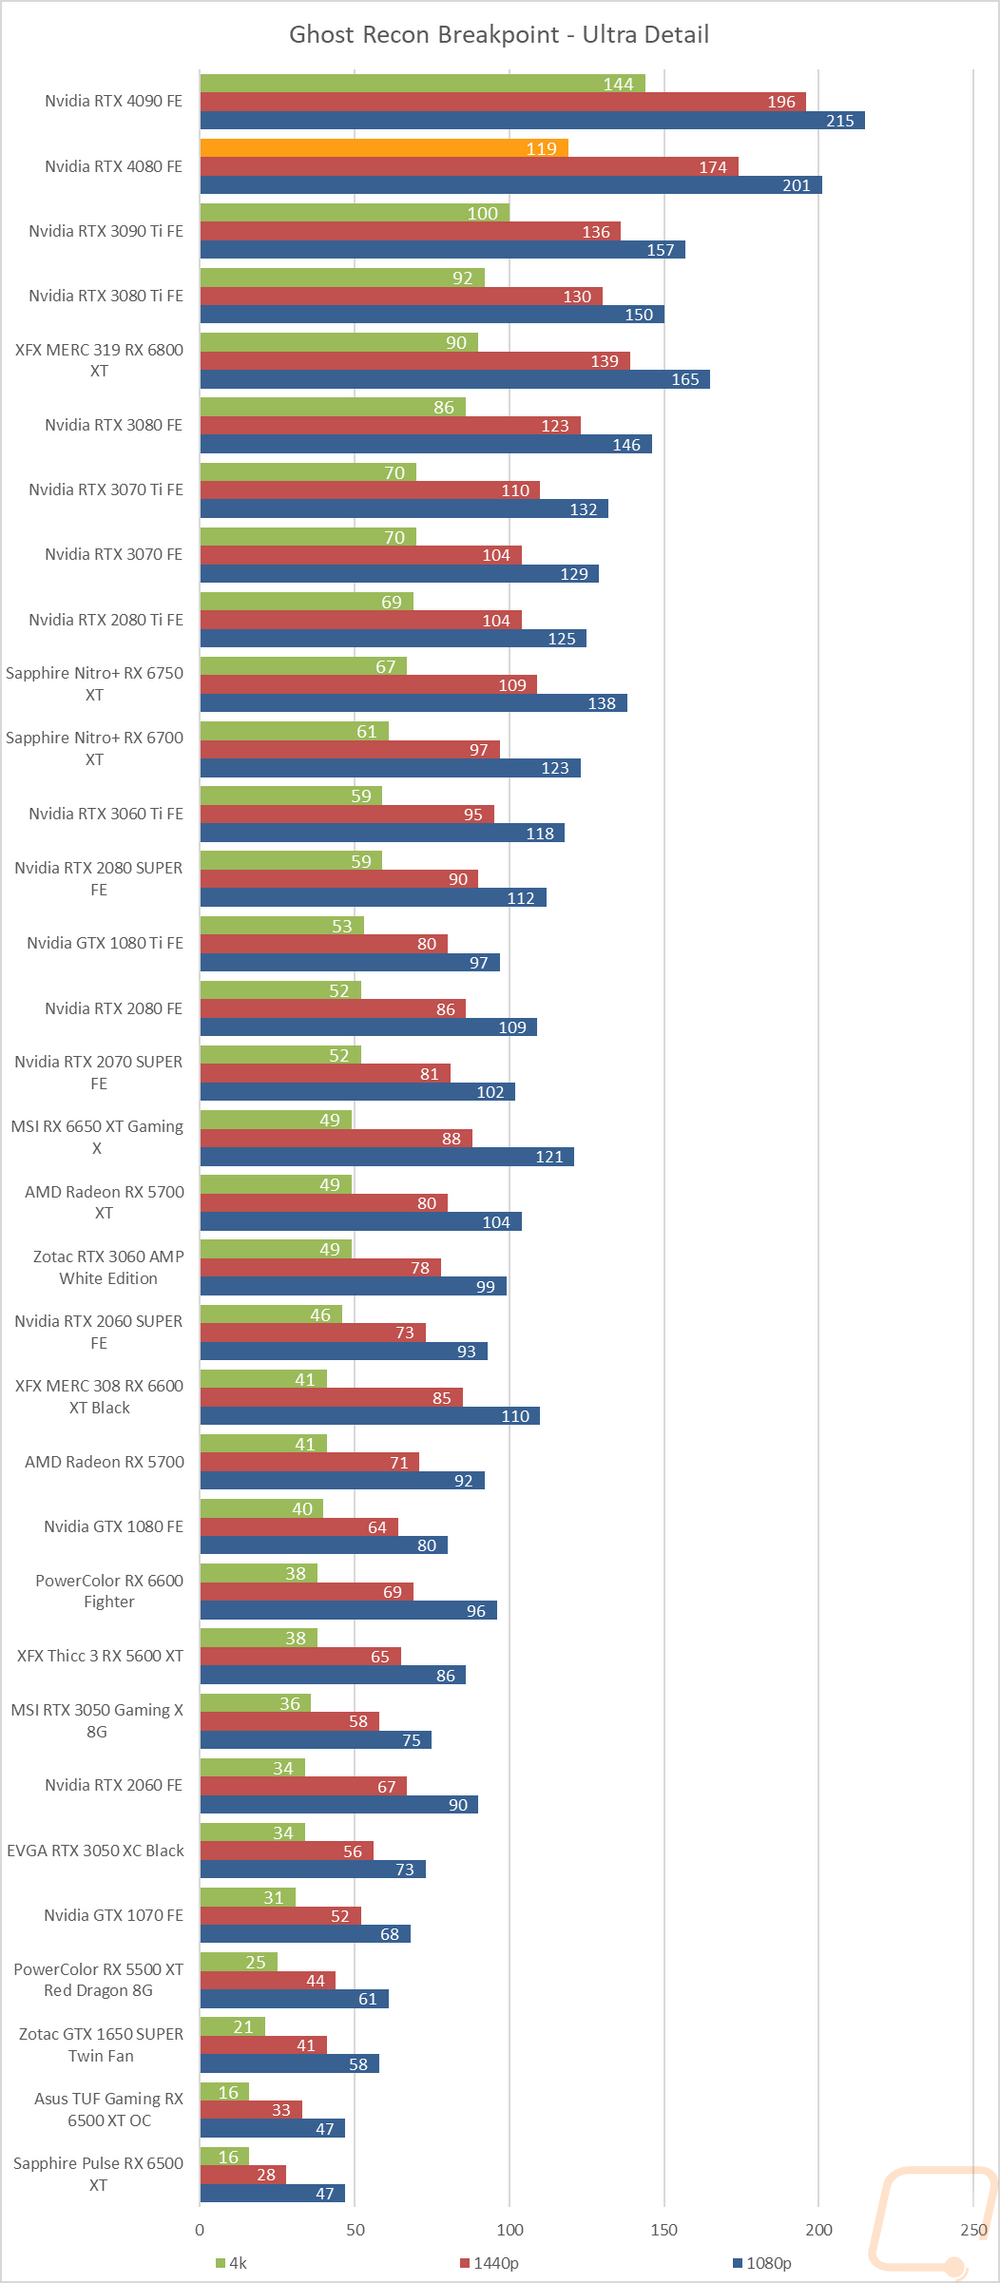
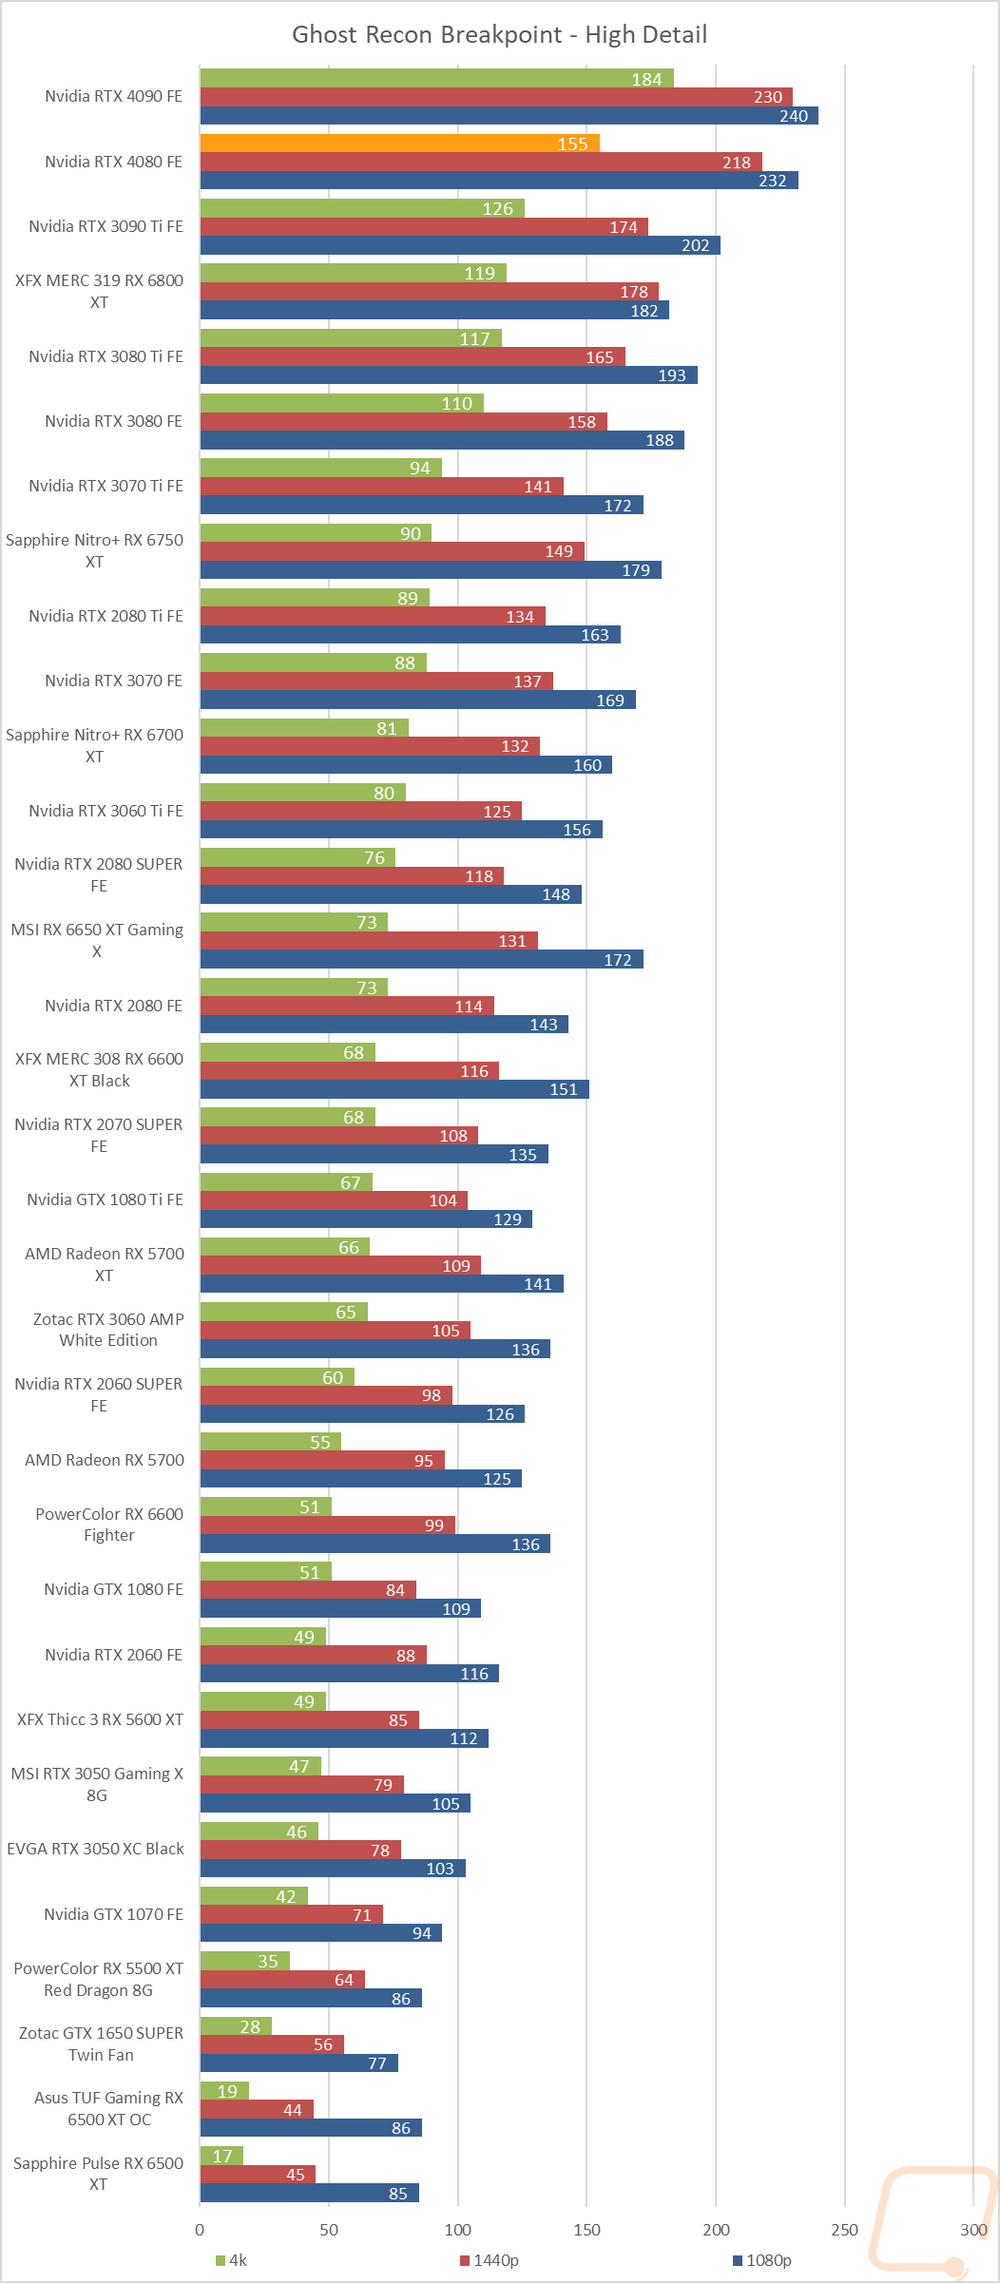
Ghost Recon Breakpoint |
Built-in benchmark tested at 1080p, 1440p, and 4k with the Ultra and Medium detail settings |
|
Boundary Benchmark |
Testing different DLSS detail levels on cards that support it. All testing is done at 4k with RTX on |
|
Bright Memory Infinite RTX Benchmark |
Benchmark all of the different RTX detail levels. Resolution at 4k and DLSS on balanced for each test |
|
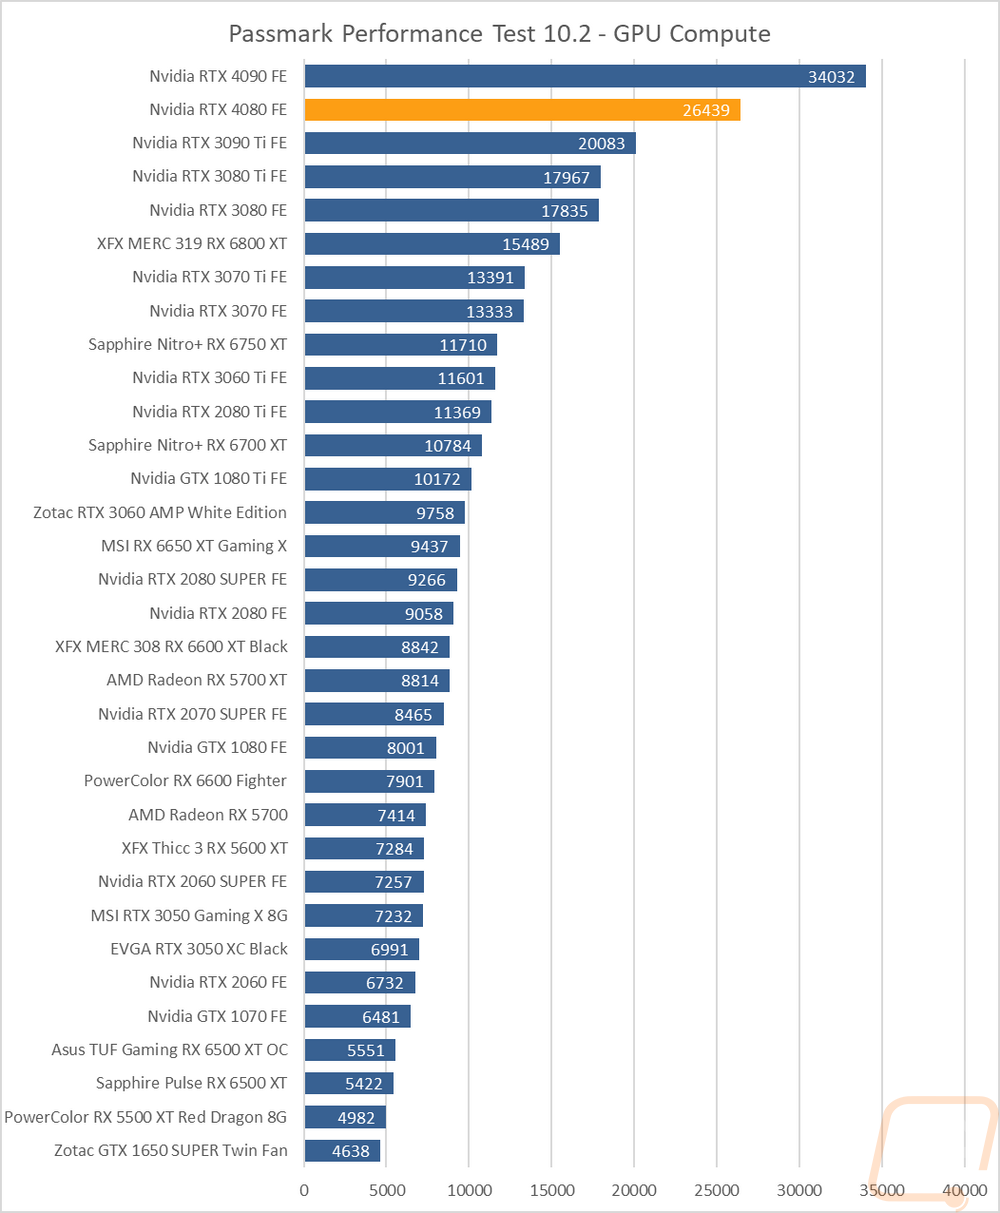
Passmark Performance Test 10.2 |
Test using the GPU Compute Score inside of Passmark’s Performance Test 10.2 |
|
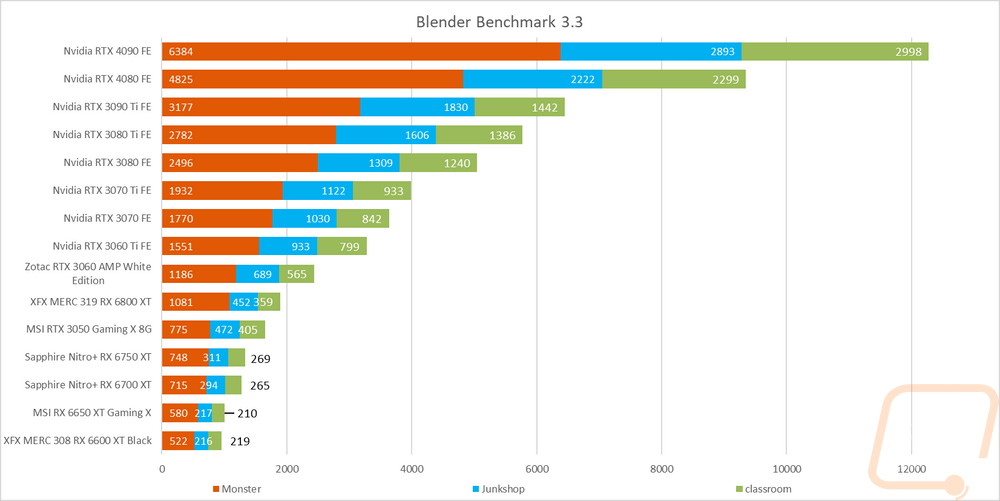
Blender |
Using the new Blender Benchmark with the Quick Benchmark setting set to use the GPU, not the CPU. Nvidia cards are tested twice, once with CUDA and the other with Optix, and AMD cards are run on OpenGL. The result is in total seconds the test took, lower is better. The 2.93.1 build is used and I run all six tests, BMW27, Koro, Classroom, Pavillon, Fishy cat (my favorite), and Victor |
|
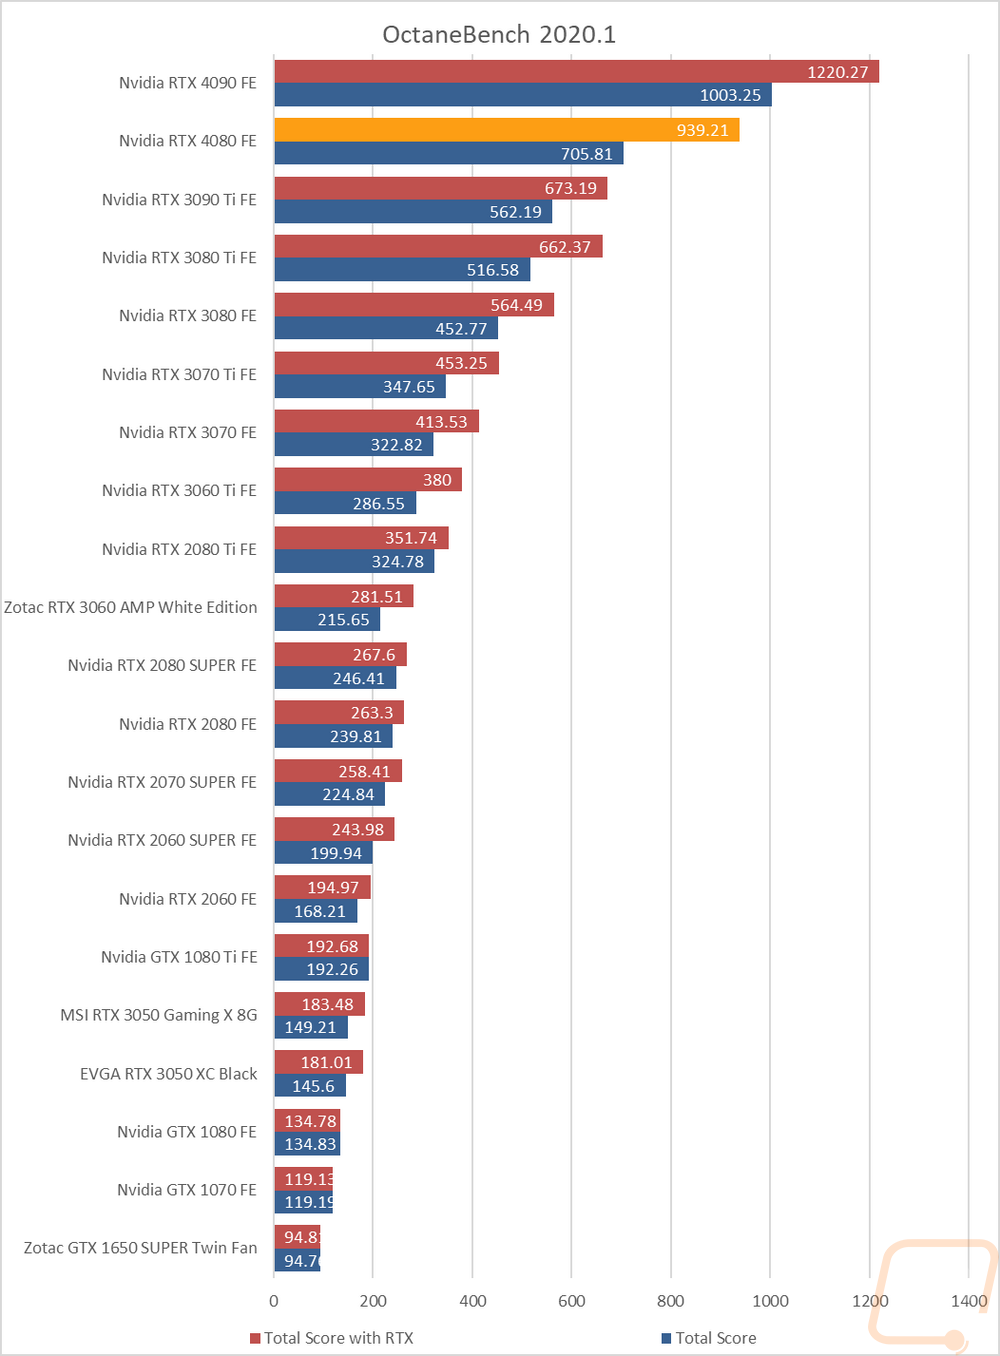
OctaneBench 2020.1 |
OctaneBench is designed to test rendering in OctaneRender. RTX and non-RTX are both run. This is a CUDA-only test so only Nvidia cards are tested |
|
Power Testing |
I run three power tests. Two I use a Kill-A-Watt hooked up in line with the power cord for the test rig. Two tests are done, one using the AIDA64 Stress Test and the second using the 3DMark Time Spy benchmark on the second test. I also use GPUz to document the GPU only reading off the card itself for wattage when doing the Time Spy test. The Time Spy test uses only the second test here because the 3rd test is the combined test that loads the CPU as well. |
|
Noise Testing |
Our Noise testing is done using a decibel meter 18 inches away from the video card on the bottom/fan side of the card. We test at 50% and 100% fan speeds as well as a third test while under load using AIDA64's stress test. This is done using a Protmex PT02 Sound Meter that is rated IEC651 type 2 and ANSI S1.4 type 2. Tests are done set weighted to A and set to a slow response using the max function and tested a second time with C weighting as well. The ambient noise level in the testing area is 33.3 decibels using A weight and 50.0 using C weight. |
|
Temperature Testing |
Using AIDA64, the GPU stress test is run for 30 minutes or until the result has leveled off. The test is run twice, once with the stock fan profile and a second time with 100% fan speed. During this, I also document the 100% fan speed RPM and document the delta between the fan profile and 100% fan speed as well. |
Synthetic Benchmarks
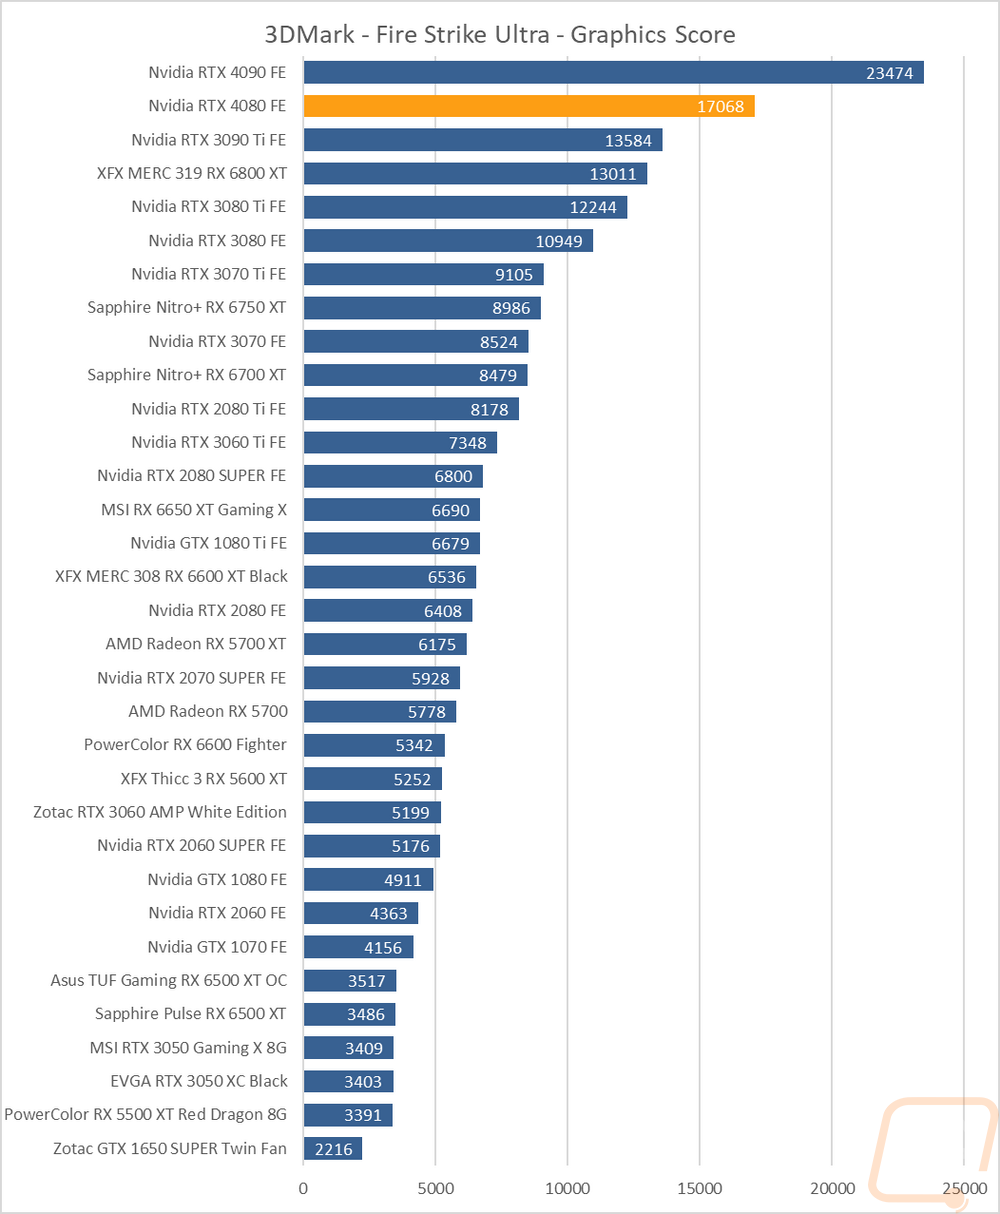
As always I like to start my testing with a few synthetic benchmarks. 3DMark especially is one of my favorites because it is very optimized in both Nvidia and AMD drivers. It's nice to not have to worry about it being favored too much either way and the repeatability of the results makes it a nice chance to compare from card to card, especially when comparing with the same GPU. Right now though with this being the first RTX 4080 in the office I’m mostly curious how it compares to the RTX 4090 that was previously launched and last generations cards like the RTX 3080 Ti that it replaces.
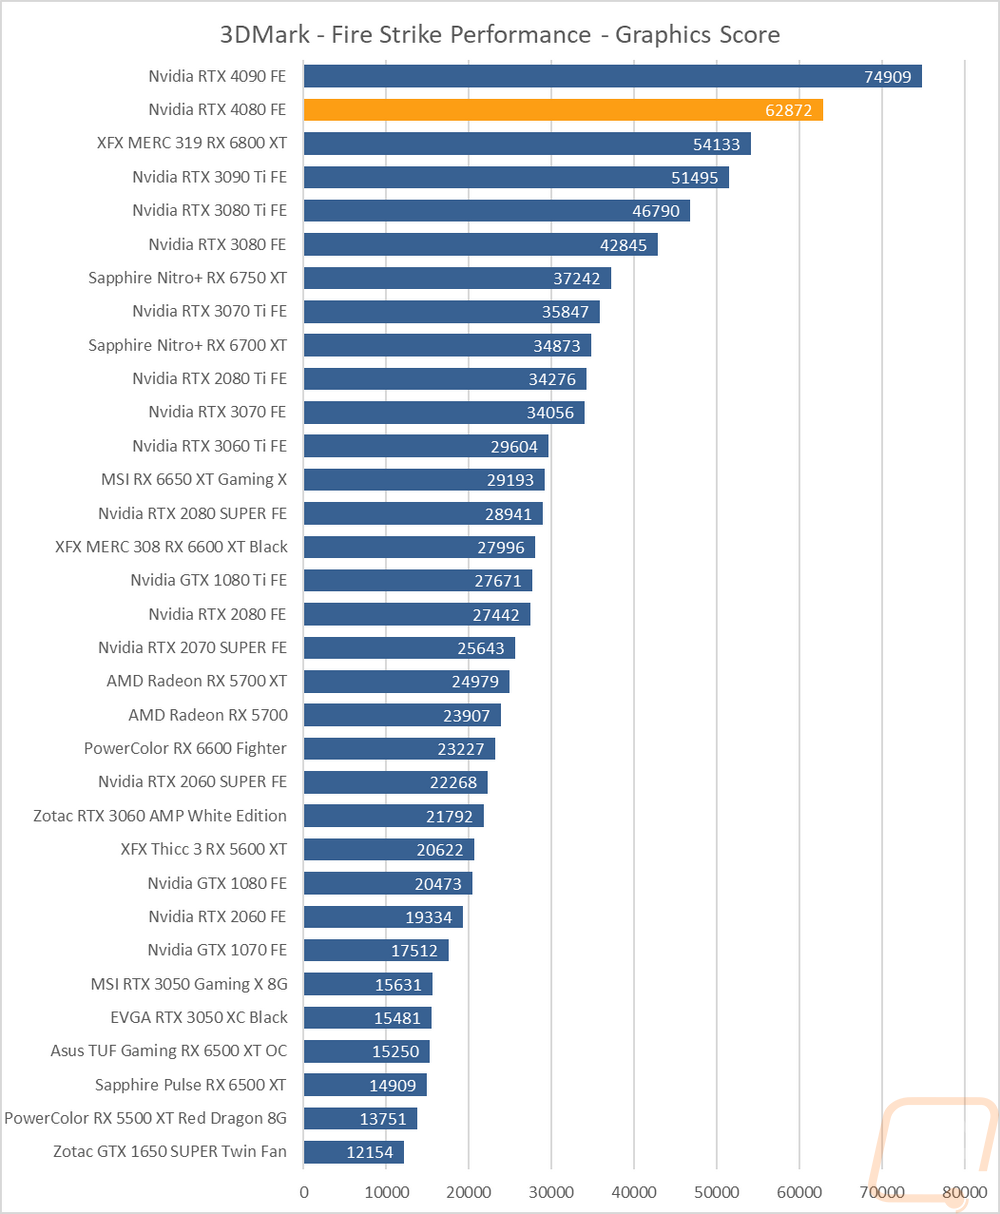
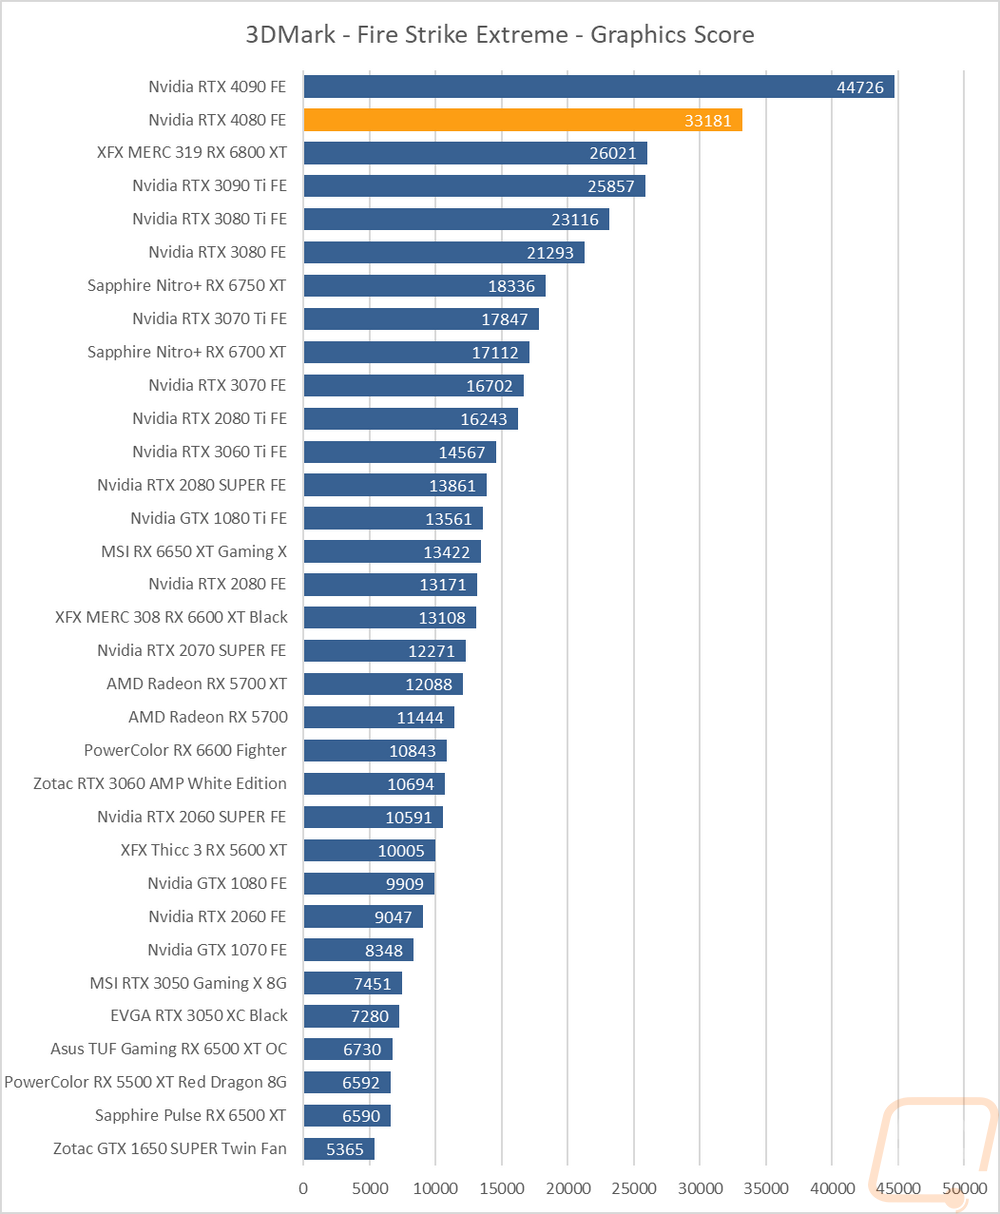
The first round of tests were done in the older Fire Strike benchmark which is a DX11 test. There are three detail levels, performance, extreme, and ultra. The RTX 4080 Founders Edition came in second in all three of the Fire Strike benchmarks with its big brother the RTX 4090 being at the top of course. There is a big performance gap between them, but even still the RTX 4080 Founders Edition outperformed last year's RTX 3090 Ti by a wide margin, not to mention the 3080 Ti.
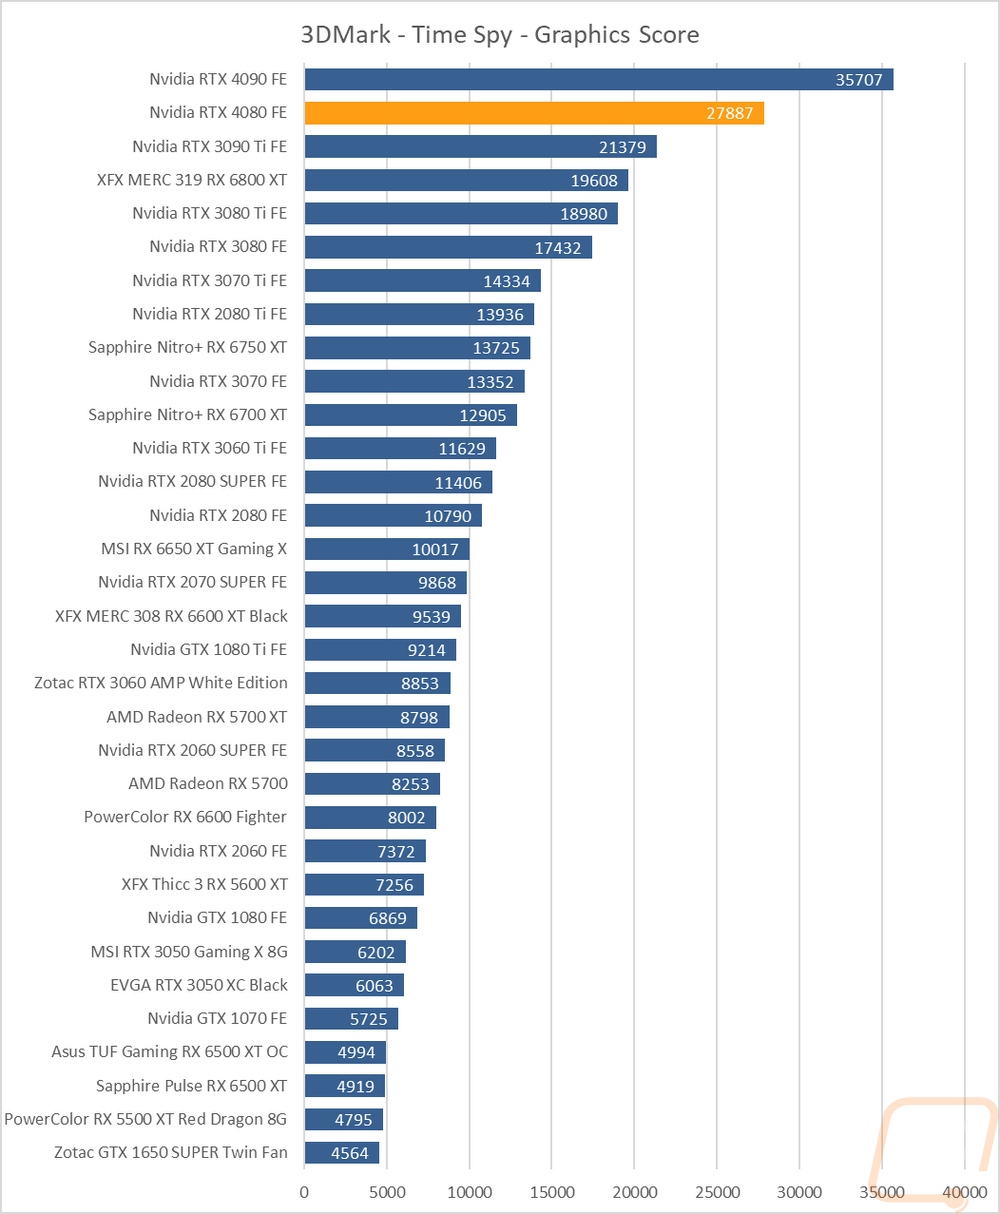
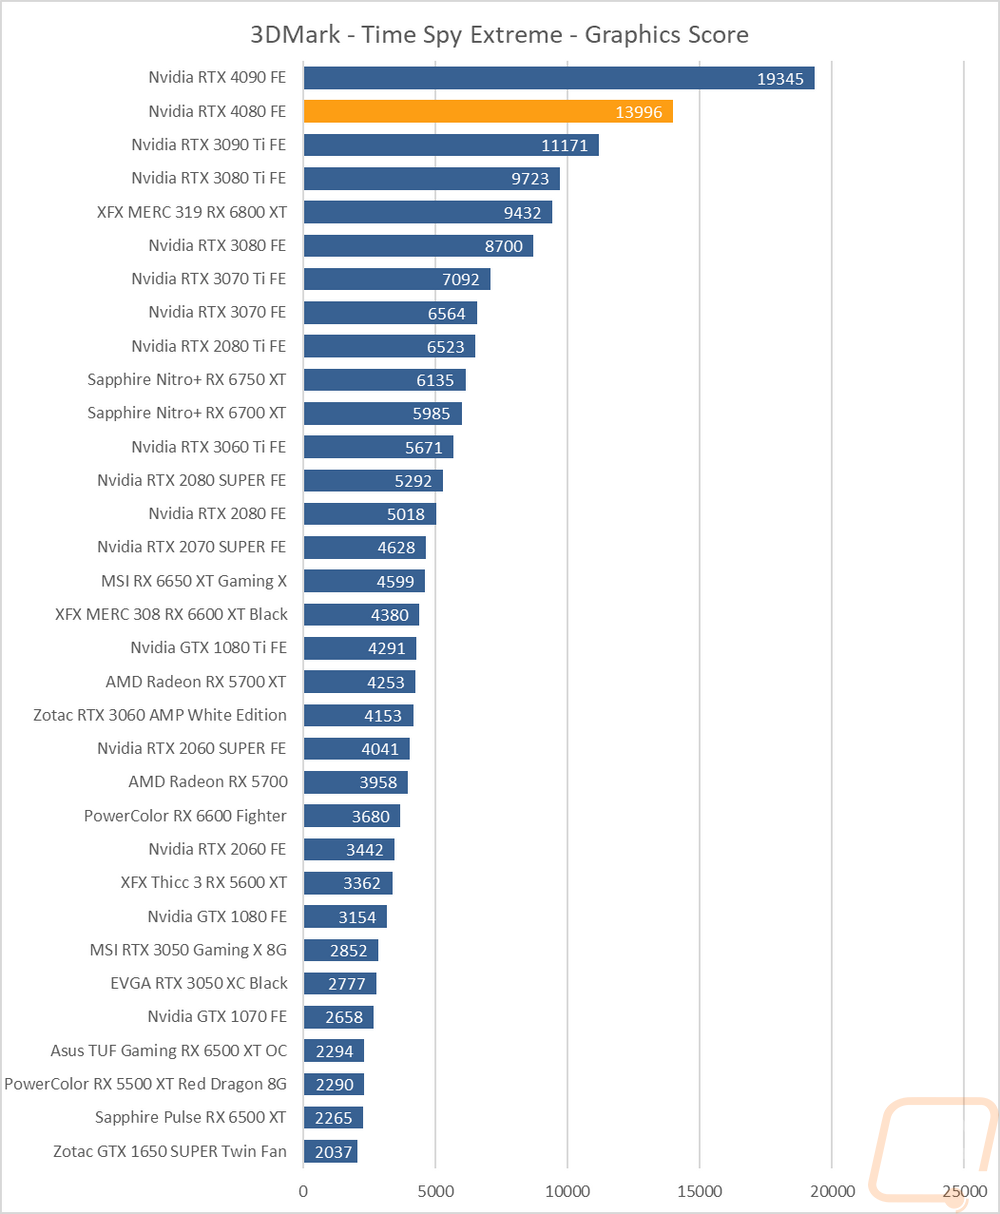
The next two were both based on the Time Spy benchmark. One is the standard test and then there is the extreme detail level. Time Spy is 3DMark’s first DX12 benchmark and the RTX 4080 Founders Edition performed similarly here as well with the 4090 way out in front and the RTX 4080 Founders Edition way out ahead of everything from the last generation including the 3090 Ti.
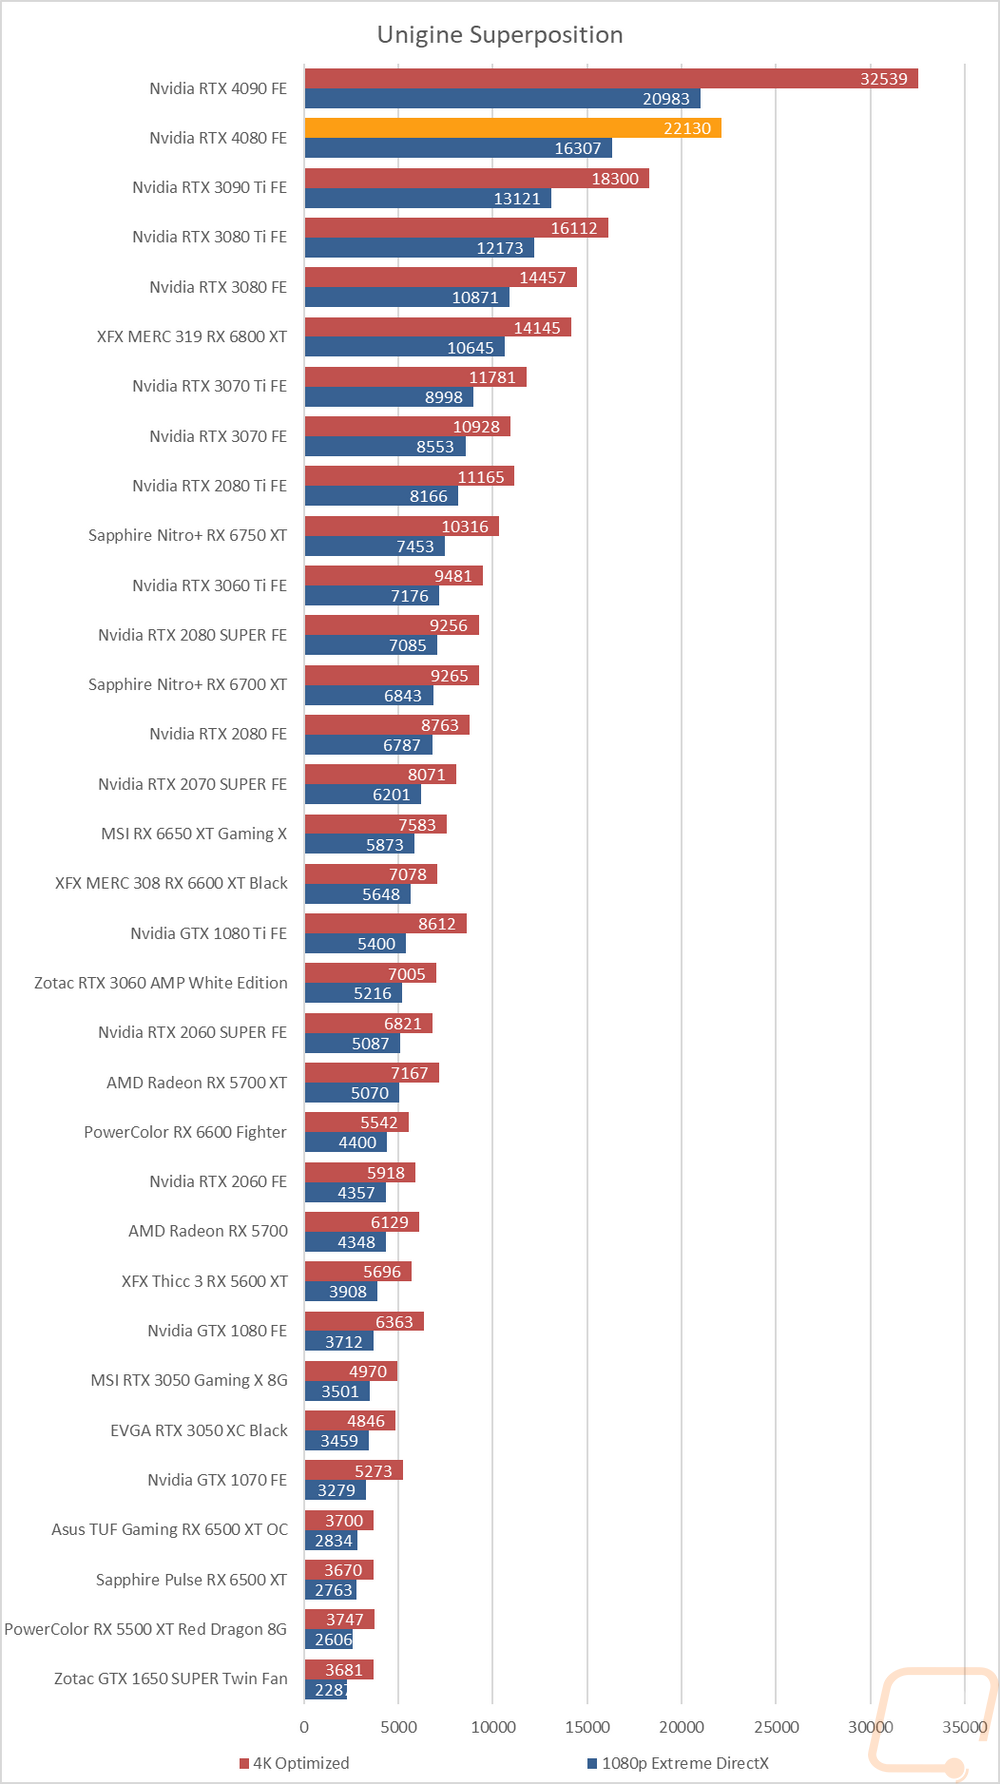
The last test was using the Unigine-based Superposition benchmark and I tested at 1080p with the extreme detail setting as well as the 4K optimized setting. In the extreme detail setting the RTX 4080 Founders Edition came in second to the RTX 4090 once again here and the gap between the two cards, especially on the 4K result, is crazy here with the 4090 almost breaking the scaling of the graph. That said the RTX 4080 Founders Edition is still way out in front of the RTX 3090 Ti and with none of the tested AMD cards even close.
VR Benchmarks
As for Virtual Reality, I love it but it is more demanding than traditional gaming. This is partially because of the resolutions needed to render for two eyes and because they render more than what is immediately visible. But also because of post effects to get the proper “fisheye” effect for it to look proper in your eyes with the HMD. You also have to have much higher expectations for frame rates in VR, skipping frames or lower FPS can cause motion sickness in VR. Because of that, I ran a few tests.
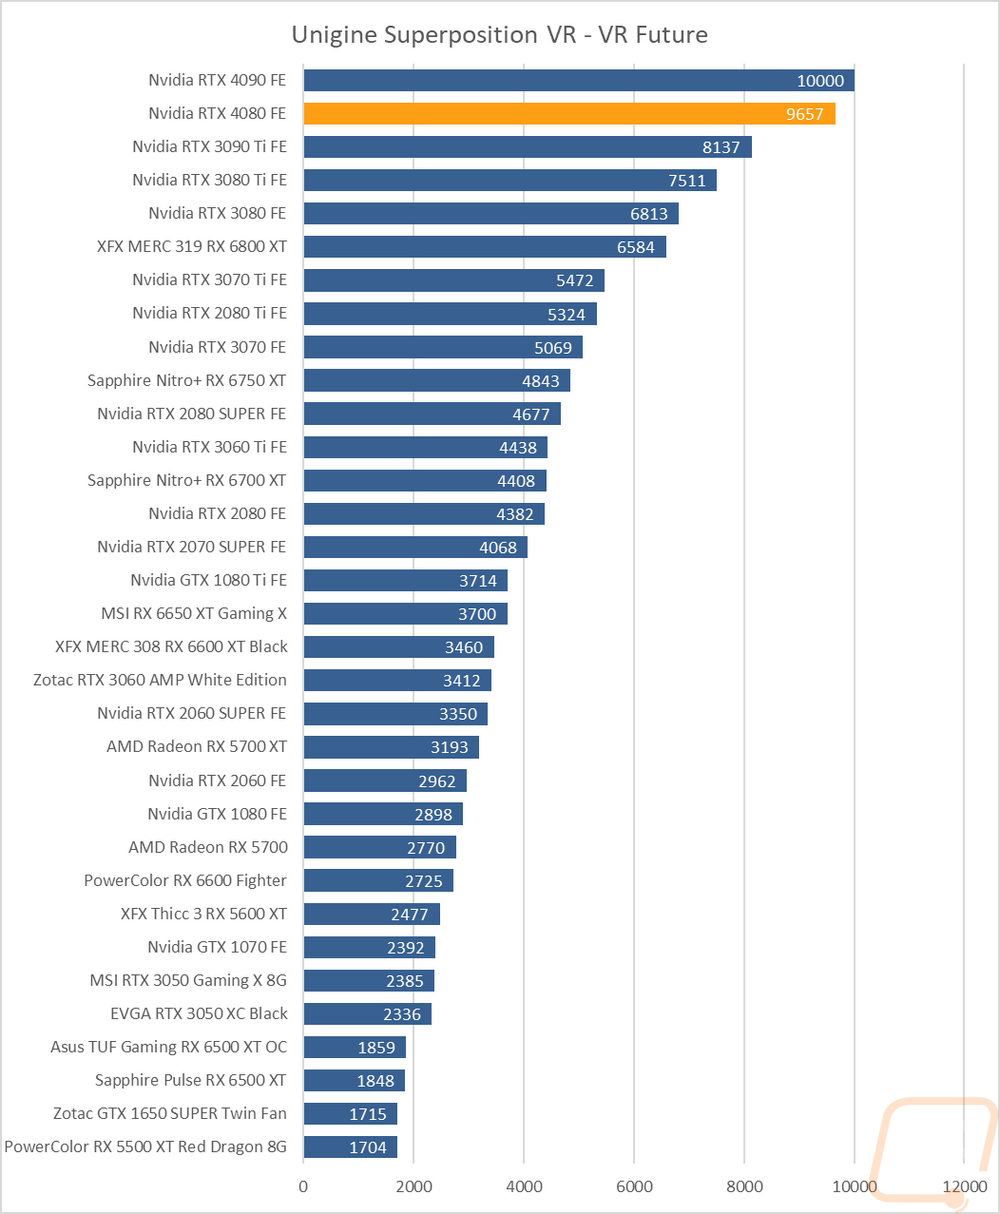
My first test was again in Superposition. This time I tested the VR Future test using the Oculus resolution. Here the RTX 4080 Founders Edition is once again in second but looks close to the RTX 4090 but don’t let that fool you. The 4090 found the score cap of 10,000 which is holding it back significantly. The gap between the RTX 4080 Founders Edition and the 3090 Ti here is impressive though, not to mention the 3080 Ti that the RTX 4080 Founders Edition is replacing.
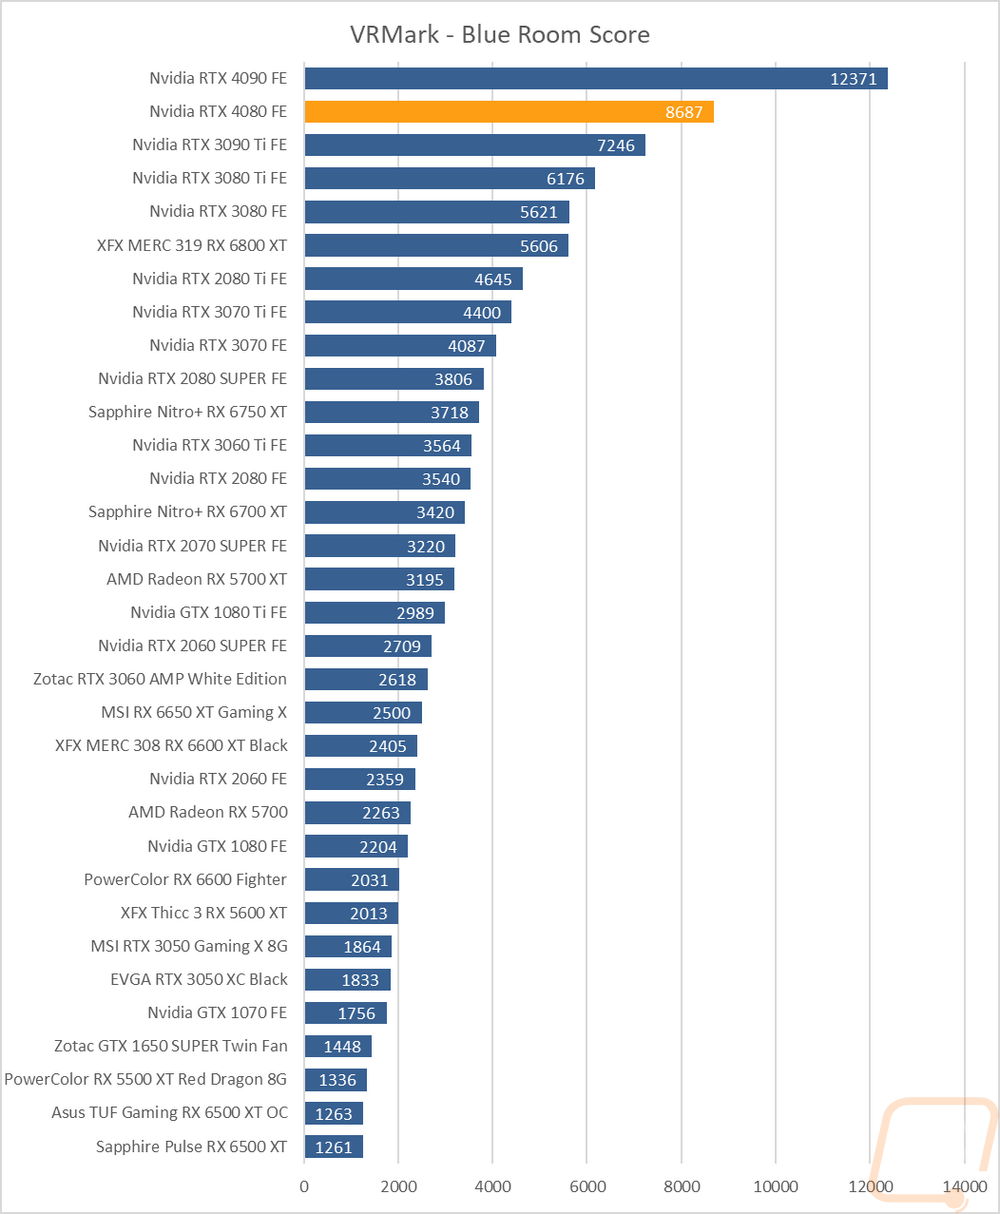
My second round of VR testing was in VRMark which has three tests that are similar to the VR tests in Superposition. I only focused on just the most demanding test called Blue Room which is looking more at future VR performance. The RTX 4080 Founders Edition, once again, is second to its big brother the RTX 4090 which once again nearly breaks the graph from being so far out in front. The RTX 4080 Founders Edition beat the 3090 Ti by almost 20% and improved on the RTX 3080 Ti by an impressive 40%.
In-Game Benchmarks
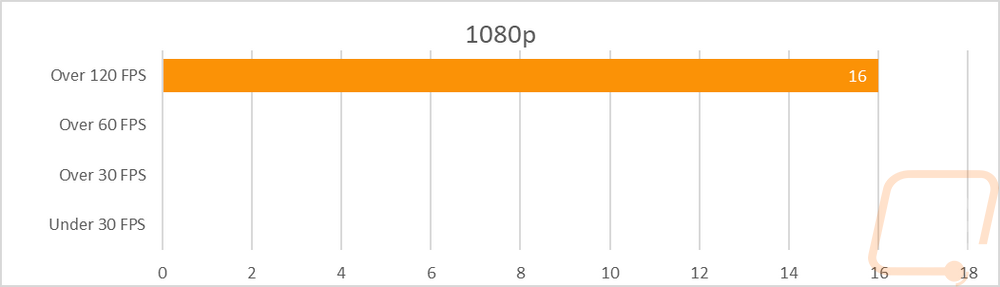
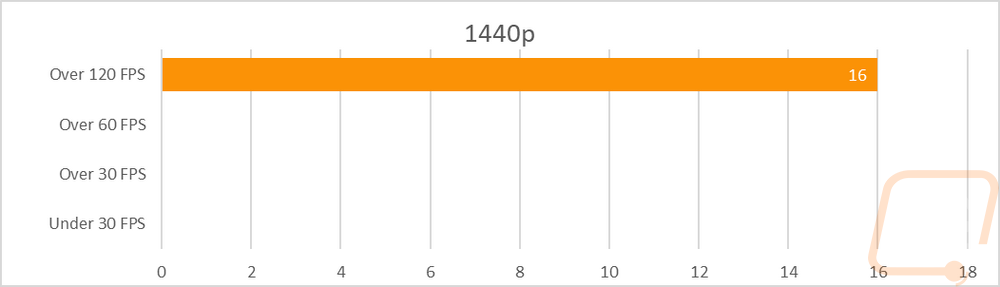
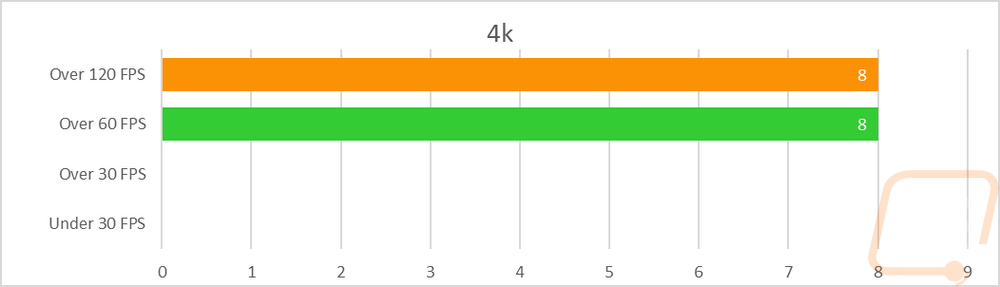
Now we finally get into the in game performance and that is the main reason people pick up a new video card. To test things out I ran through our new benchmark suite that tests 10 games at three different resolutions (1080p, 1440p, and 4k). Most of the games tested have been run at the highest detail setting and a mid-range detail setting to get a look at how turning things up hurts performance and to give an idea of if turning detail down from max will be beneficial for frame rates. In total, each video card is tested 54 times and that makes for a huge mess of results when you put them all together. To help with that I like to start with these overall playability graphs that take all of the results and give an easier-to-read result. I have one for each of the three resolutions and each is broken up into four FPS ranges. Under 30 FPS is considered unplayable, over 30 is playable but not ideal, over 60 is the sweet spot, and then over 120 FPS is for high refresh rate monitors.
So how did the RTX 4080 Founders Edition do? Well when looking at the playability graphs, much like its bigger brother the RTX 4090, the RTX 4080 Founders Edition dominated all of our tests at 1080p and 1440p with every single result coming in over 120 FPS. It is only at 4K can we get an idea of performance at all with these charts and even there the RTX 4080 Founders Edition didn’t have any trouble with any of our tests. Exactly half of them came in at 60 FPS or higher and half were up over 120 FPS as well. For comparison, the 4090 had just two results up under 120 FPS at 4K but the RTX 4080 Founders Edition is still a monster as well and that is before figuring DLSS 3 into the mix.
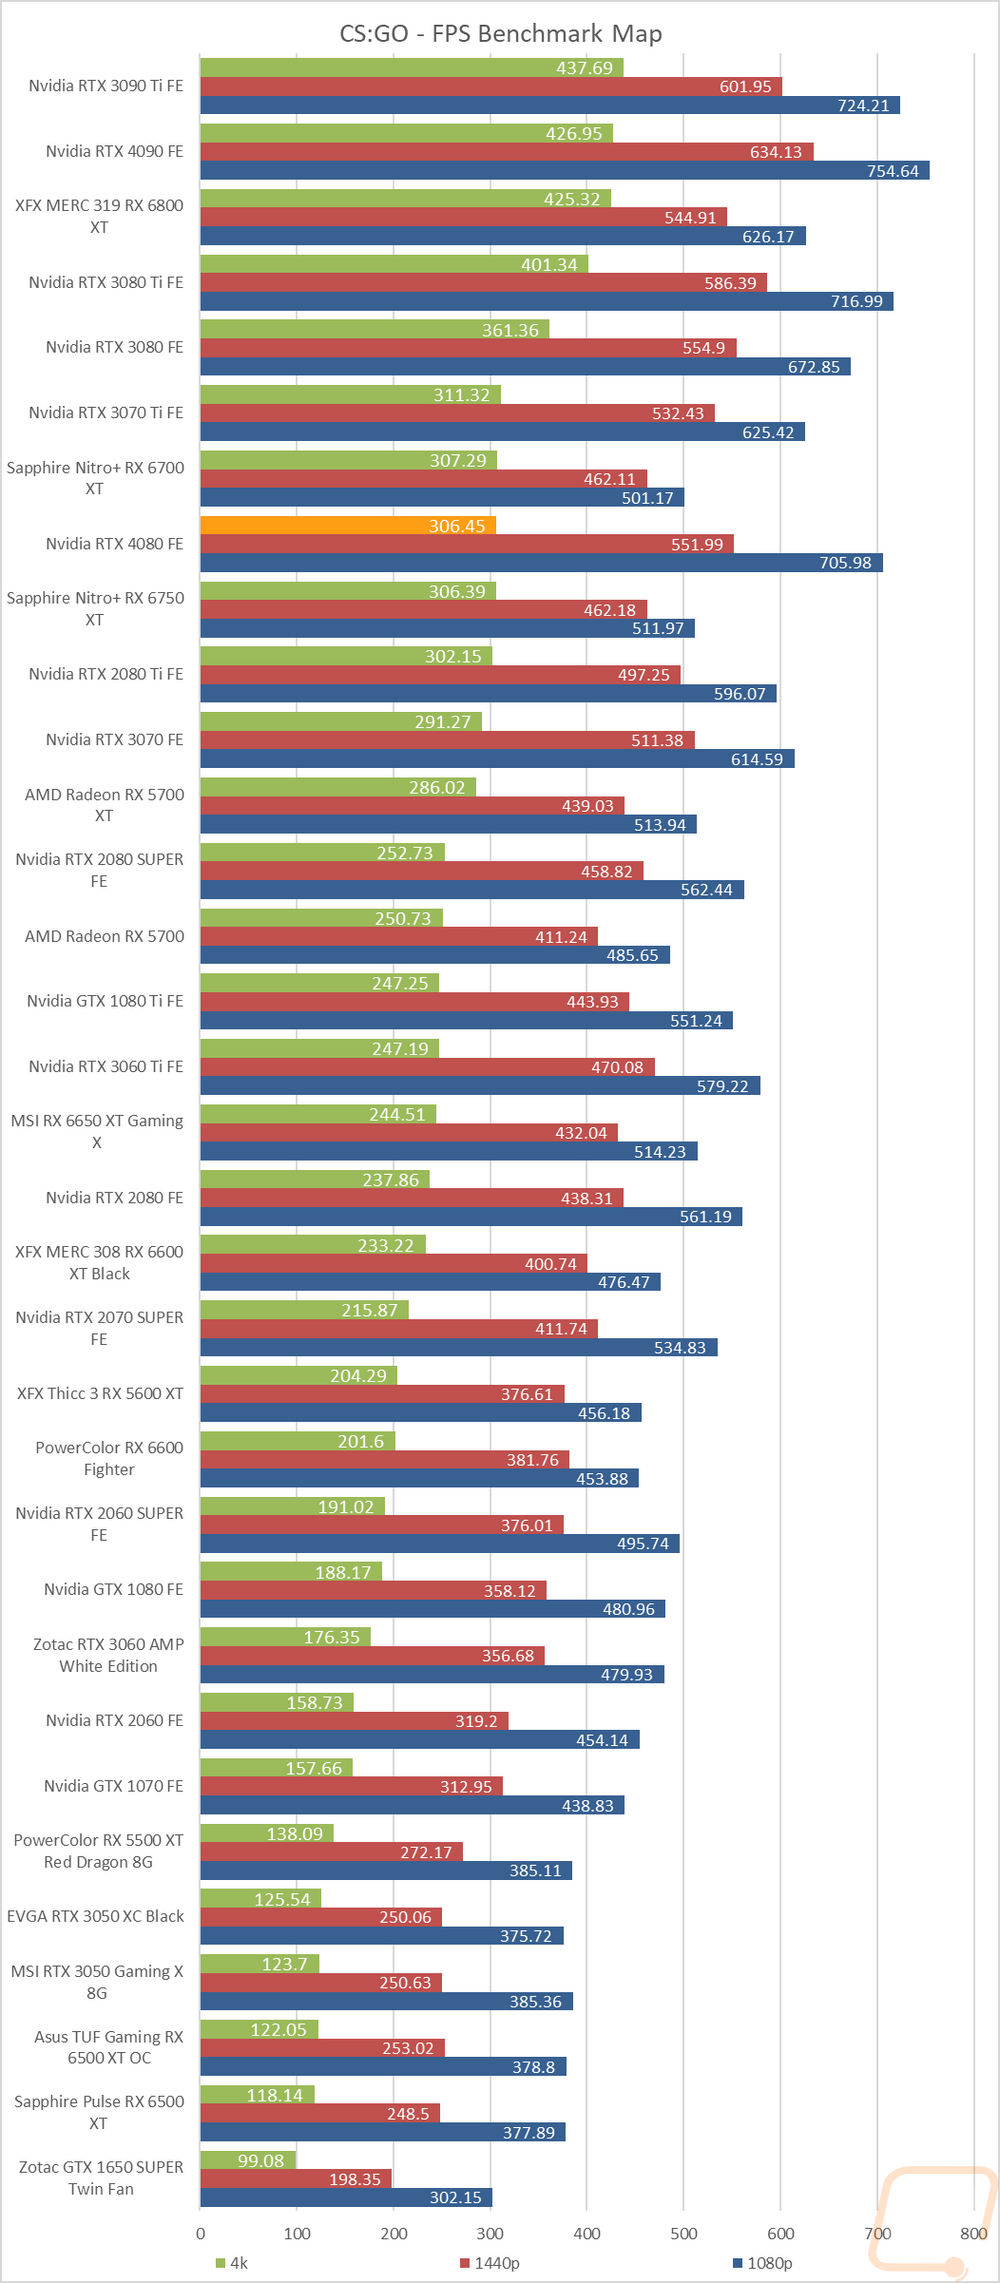
Of course, I have all of the actual in game results as well for anyone who wants to sort through the wall of graphs below. Except for our first result in CS:GO the RTX 4080 Founders Edition sits in second behind the RTX 4090 in all of the test results when sorting them by 4K. 1080P results are out the window because in almost every test those are CPU limited and we see the same in a lot of the 1440p results as well. When I average the numbers out but take out CS:GO because it is so high it breaks the average the RTX 4080 stays close to the 4090 at 1440p at 182 and it averages at 126 FPS at 4k, a big improvement over the 3080 Ti which averaged 96 FPS and comes in 23% less than the 4080s performance. As far as individual results, really only the CS:GO result is the only thing that stands out and even that is mostly just the performance at 4K. The 4080 Founders Edition came in below the RTX 3080 which makes me wonder if the 4K performance is limited by the smaller 256-bit memory interface combined with the extremely high frame rates that CS:GO sees. I’ve spoken with Nvidia about this one and am waiting to hear back from them on it. That said complaining about 300+ FPS is about as first-world problem as you can get. Even with that slowdown, you are well above the highest refresh rate available on a 4K monitor and also above the max 4K refresh rate of DisplayPort 1.4 which this card has so it isn’t a big deal.
|
|
1440p Average FPS |
% -/+ to the 4080 perf |
4k Average FPS |
% -/+ to the 4080 perf |
|
RTX 4090 |
195 |
+7% |
158 |
+25% |
|
RTX 4080 |
182 |
0% |
126 |
0% |
|
RTX 3090 Ti |
153 |
-16% |
106 |
-16% |
|
RTX 3080 Ti |
151 |
-17% |
96 |
-23% |
Compute Benchmarks
Now some people don’t need a video card for gaming, they need the processing power for rendering or 2D/3D production, or in some cases people who game also do work on the side. So it is also important to check out the compute performance on all of the video cards that come in. That includes doing a few different tests. My first test was a simple GPU Compute benchmark using Passmark’s Performance Test 10 and the RTX 4080 Founders Edition scored 26439 which was 31% in front of the RTX 3090 Ti and 47% over the RTX 3080 Ti!
Blender is always my favorite compute benchmark because the open-source 3D rendering software is very popular and it isn’t a synthetic benchmark. With the latest version of Blender, they redid the benchmark so we now have a new test that runs three different renderings and gives each a score. I have all three stacked together so we can see the overall performance. The RTX 4080 Founders Edition didn’t get close to the RTX 4090 of course but beats the RTX 3090 Ti’s total score with just its first two tests.
For CUDA-based cards, I also check out OctaneRender performance using their OctaneBench 2060.1 benchmark which allows me to check out both RTX and non-RTX rendering performance. Here the RTX 4080 Founders Edition improved on the RTX 3090 Ti’s score by 39% in the RTX test and 25% in the non-RTX score which shows how much RTX performance has improved this generation.
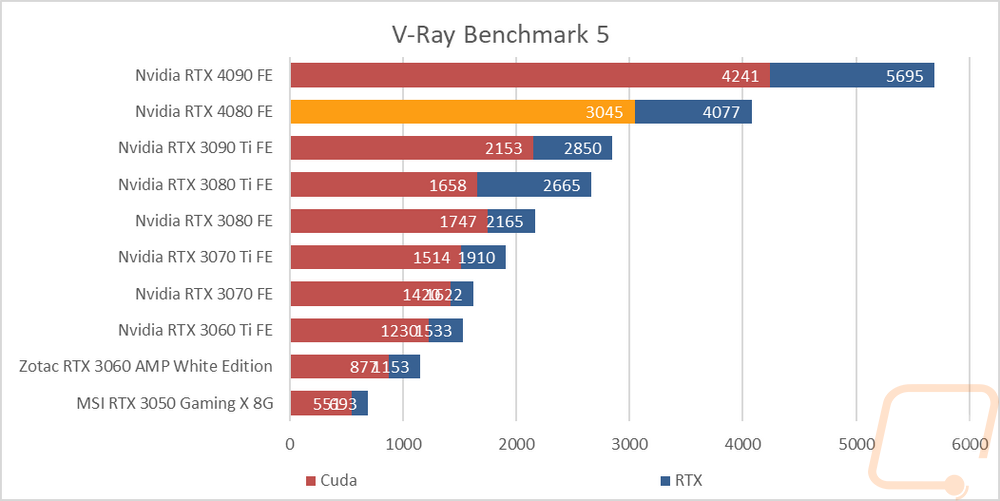
For an additional CUDA-based test I also ran V-Ray Benchmark 5 to check out CUDA and RTX performance in the 3D rendering and simulation software. The RTX 4080 Founders Edition outperformed the RTX 3090 Ti’s RTX score with CUDA cores alone and nearly caught the RTX 4090’s CUDA score with its RTX score. Overall it came in second with the 4090 way out in front but a big gap between it and any of the 3000 Series cards.
RTX and DLSS
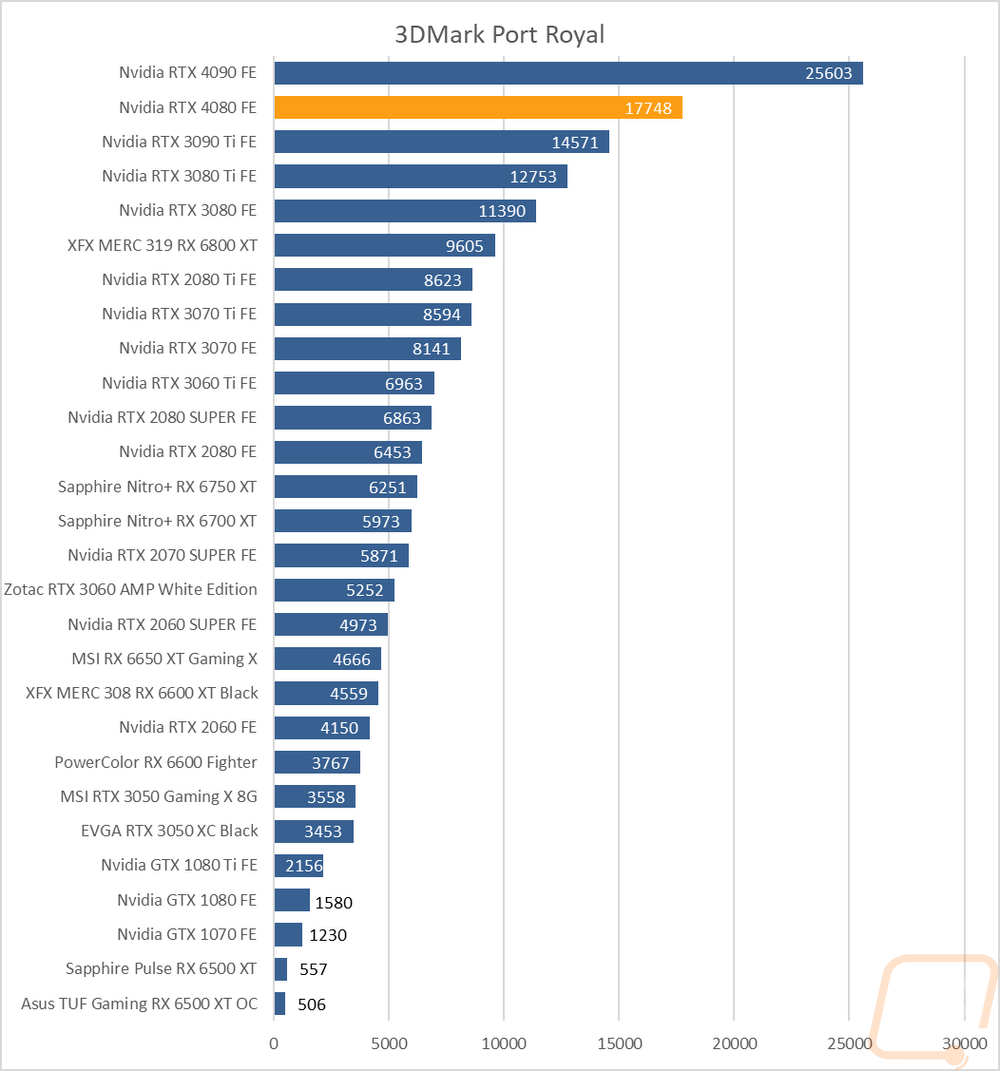
Being an RTX card I also like checking out the performance of some of Nvidia’s features. Namely the ray tracing performance and the performance improvements you can see by using DLSS combined with the tensor cores. My first test goes back to our synthetic benchmarks with 3DMark where I check out their Port Royal benchmark. This is the one test that does also have AMD Ray Tracing support which is great to get a look at how different cards including older non-RTX cards perform. The RTX 4080 Founders Edition scored 17748 in Port Royal which is 8000 points less than its bigger brother the RTX 4090 but is still enough to keep a heavy lead ahead of the RTX 3090 Ti.
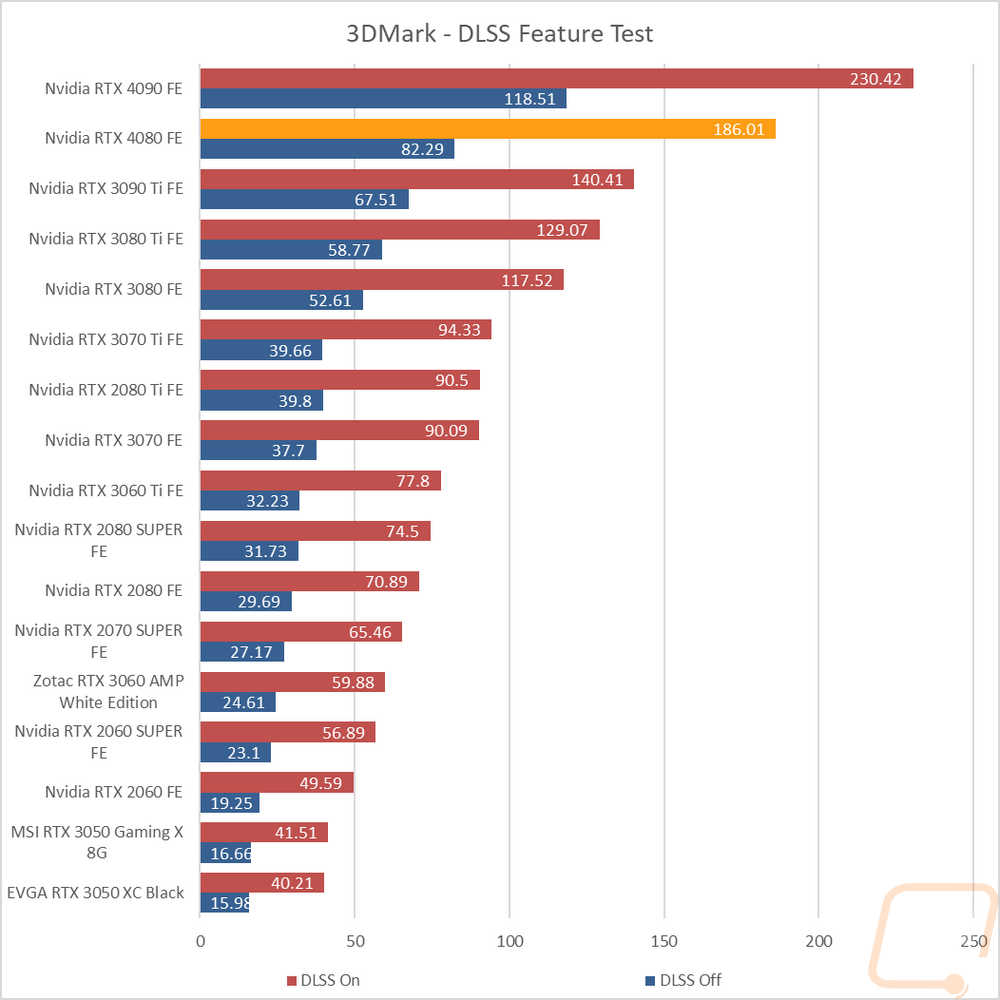
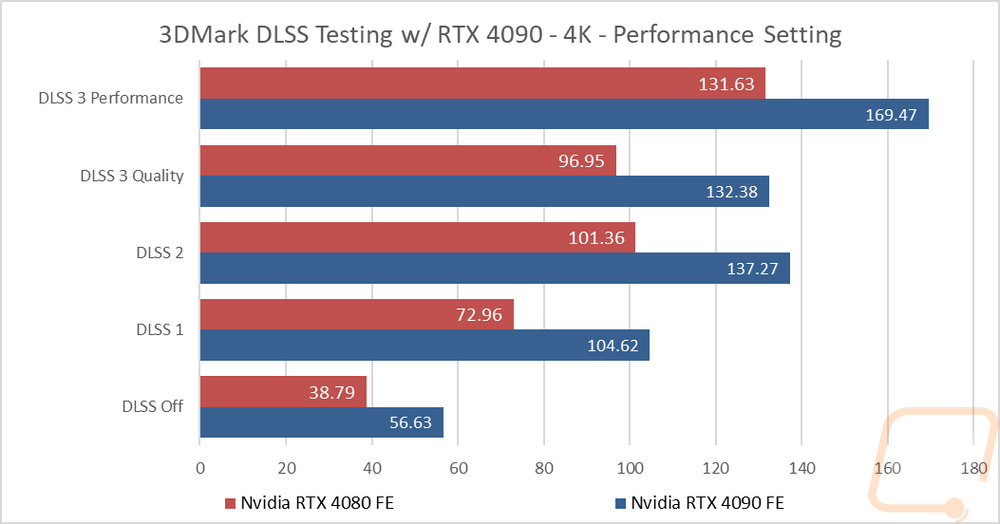
3DMark also has added in a few feature tests, one being a look at DLSS performance. For this one, I have the resolution set to 1440p and DLSS 2.0 turned on. I then have run the test on every card supported to get a comparison of how their test performs with and without DLSS. With DLSS 3 on, and with this being 1440p the gap between the RTX 4080 Founders Edition and the RTX 4090 is smaller here than in previous tests. I did a second set of tests at 4K across all three versions of DLSS and twice with the new DLSS 3 to test the performance and quality settings. This was less to compare the 4080 and 4090 against each other and more to show the performance differences between the versions. With the performance setting DLSS 3 puts a big lead on the other two DLSS versions but more importantly is over three times faster than running without DLSS on at all which is crazy!
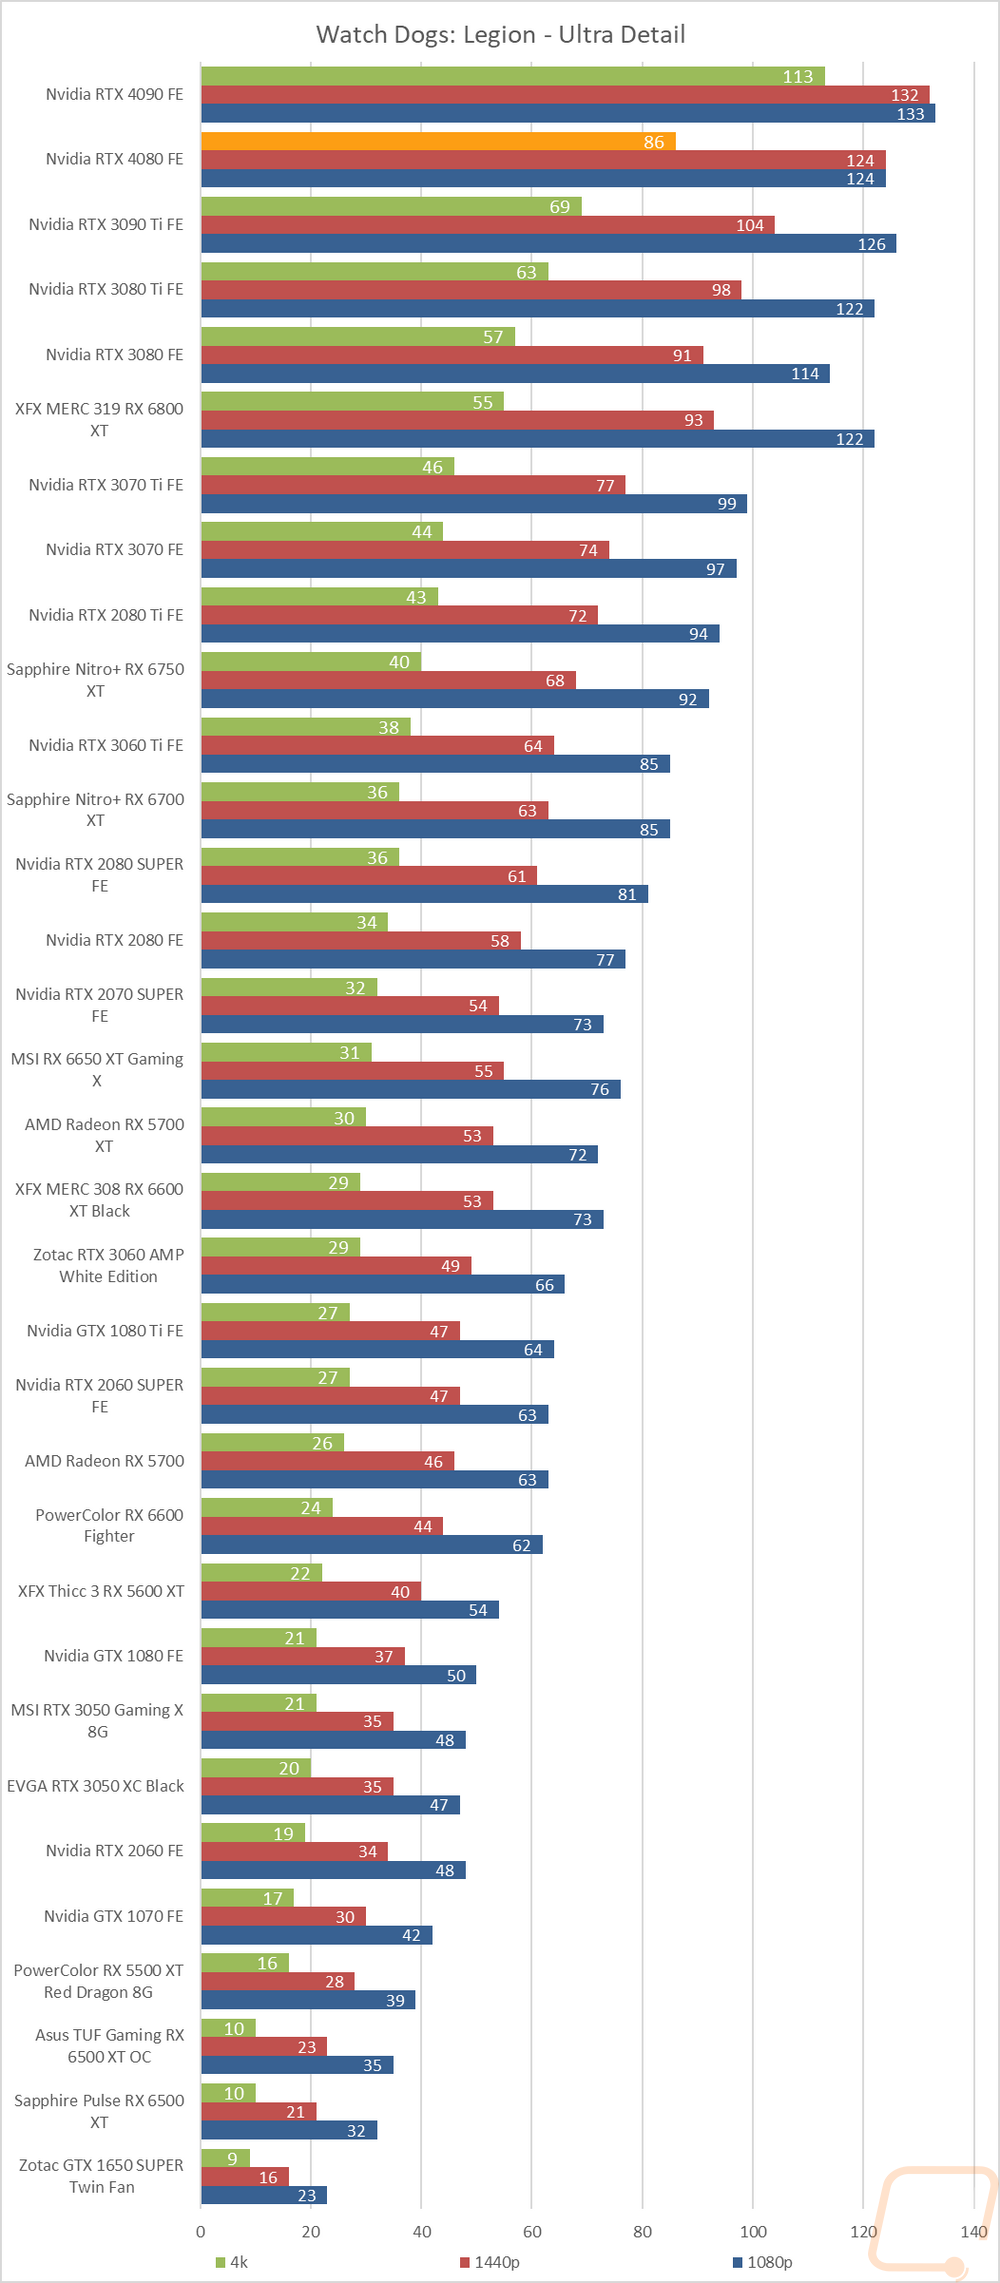
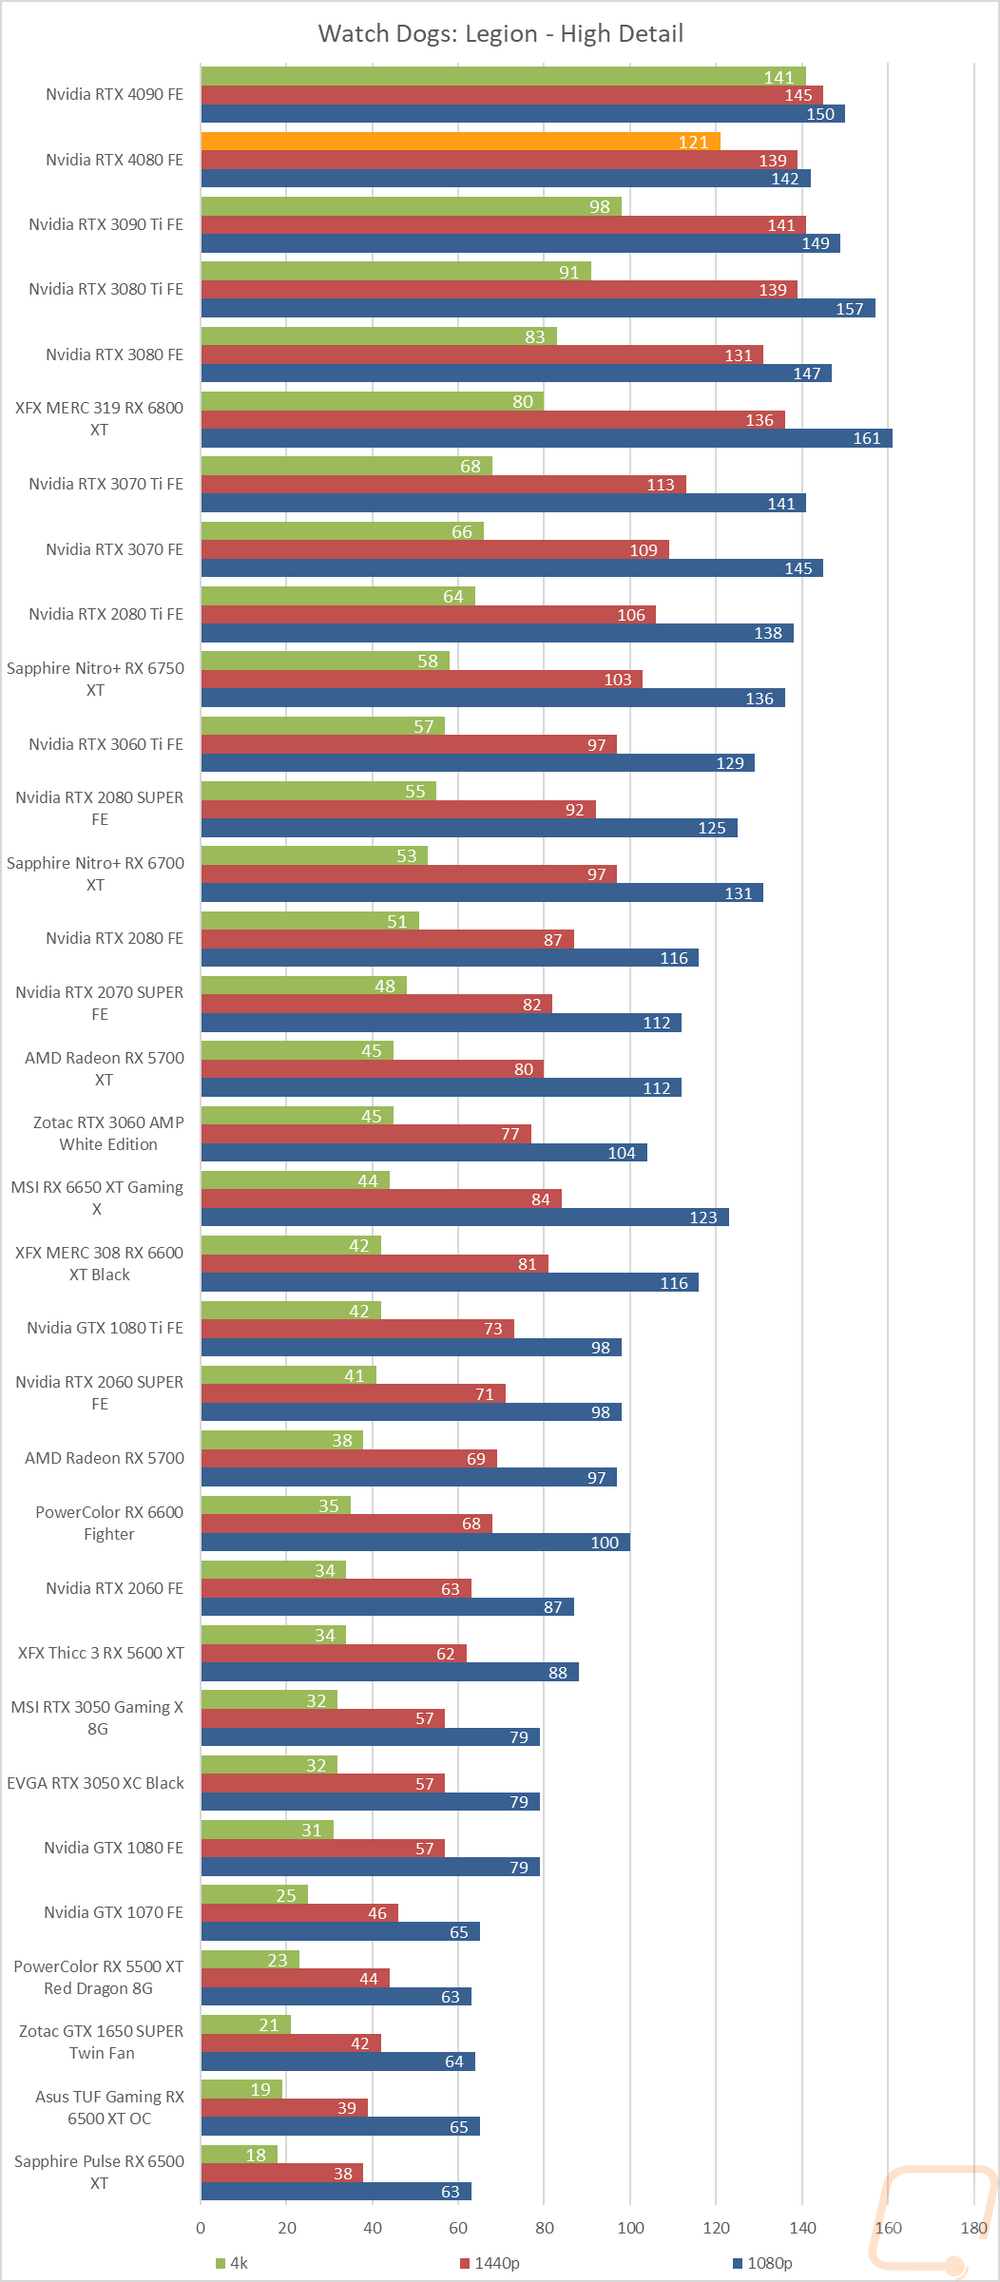
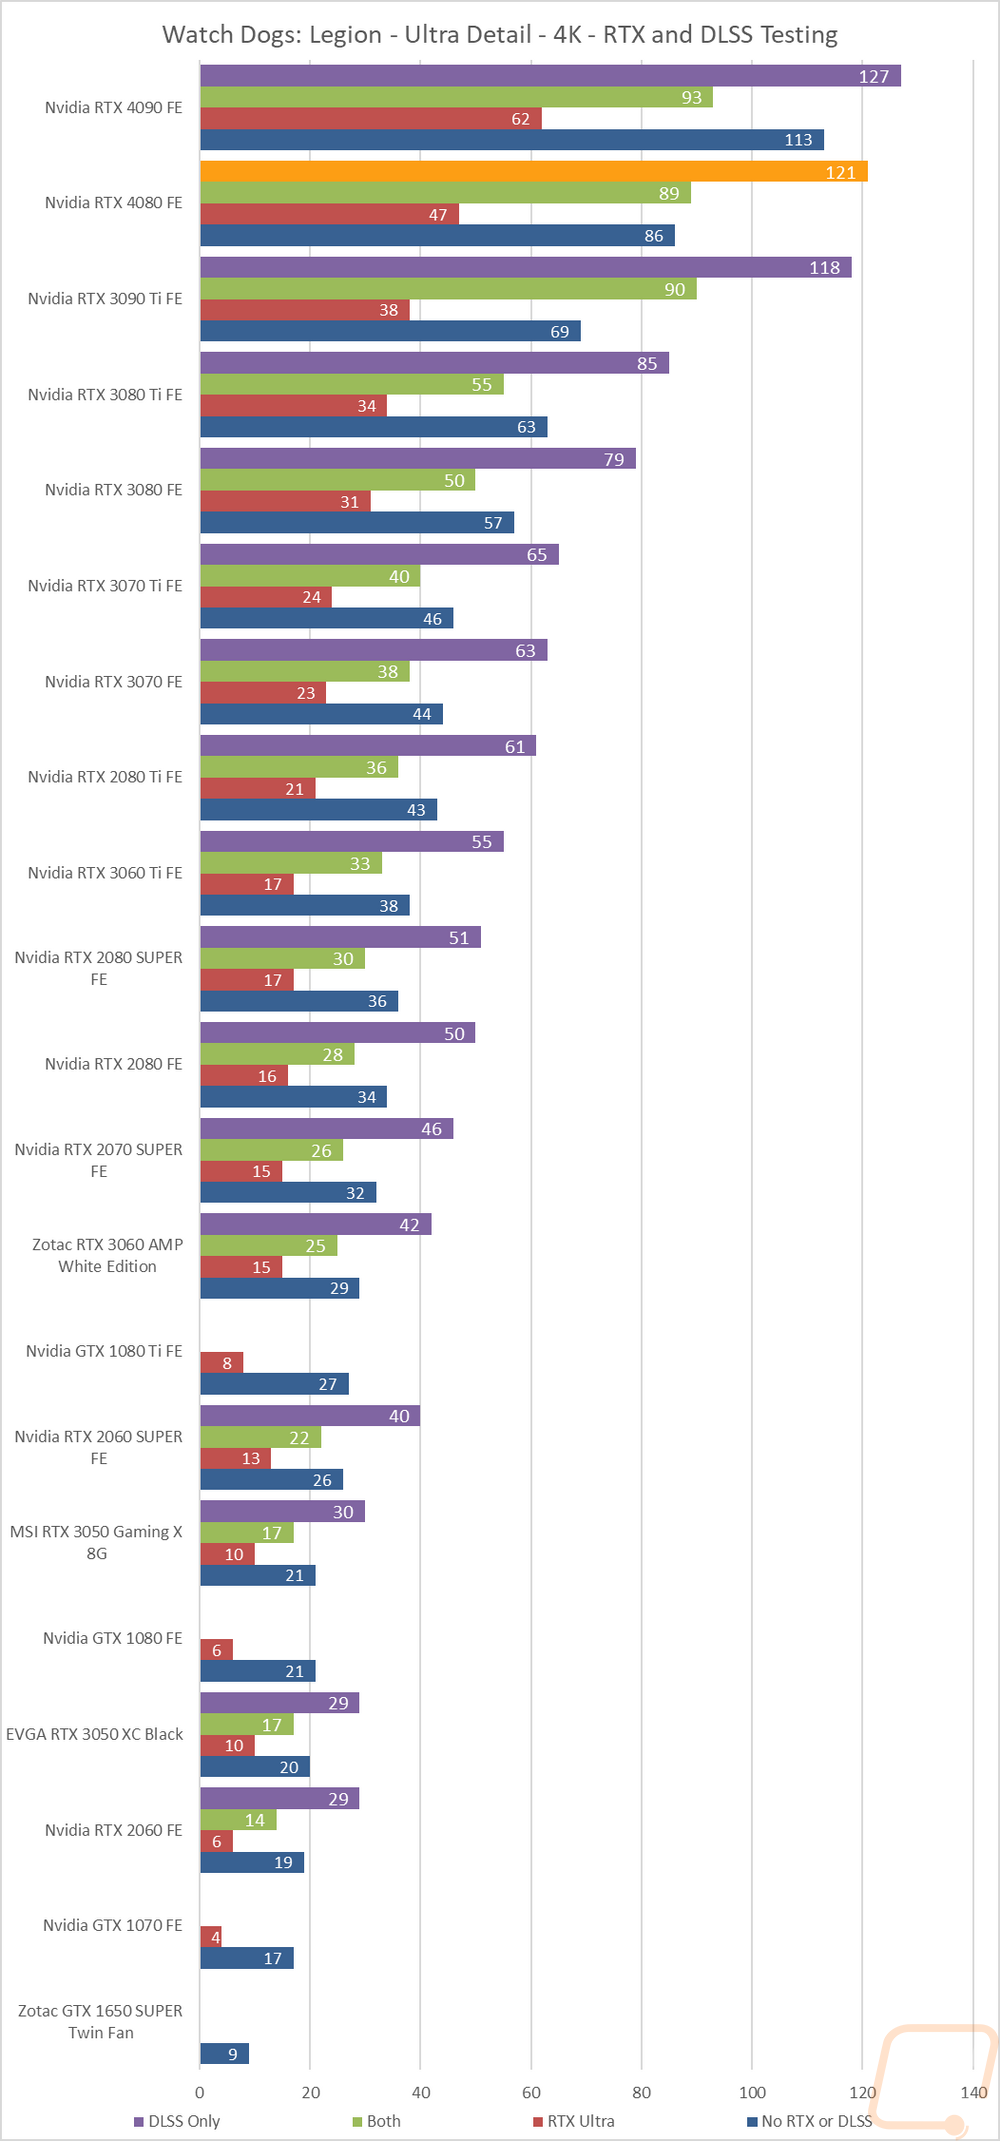
I then jumped into game tests, this time with Watch Dogs: Legion. For this one, I wanted to get an idea of the performance you will see when taking advantage of Nvidia’s RTX and DLSS features. I tested at 4k with the ultra detail setting and with ultra being the setting for DLSS and RTX when they are on as well. I then test with no RTX or DLSS on and then with RTX DLSS on and off and on together. Here the RTX 4080 Founders Edition was able to reach over 120 FPS when using DLSS at 4K at the ultra detail preset which could be huge for high refresh monitor users. More importantly though in my opinion is the jump from 47 FPS to 89 when using RTX which shows how it can help you gain the performance needed to make RTX gameplay smooth.
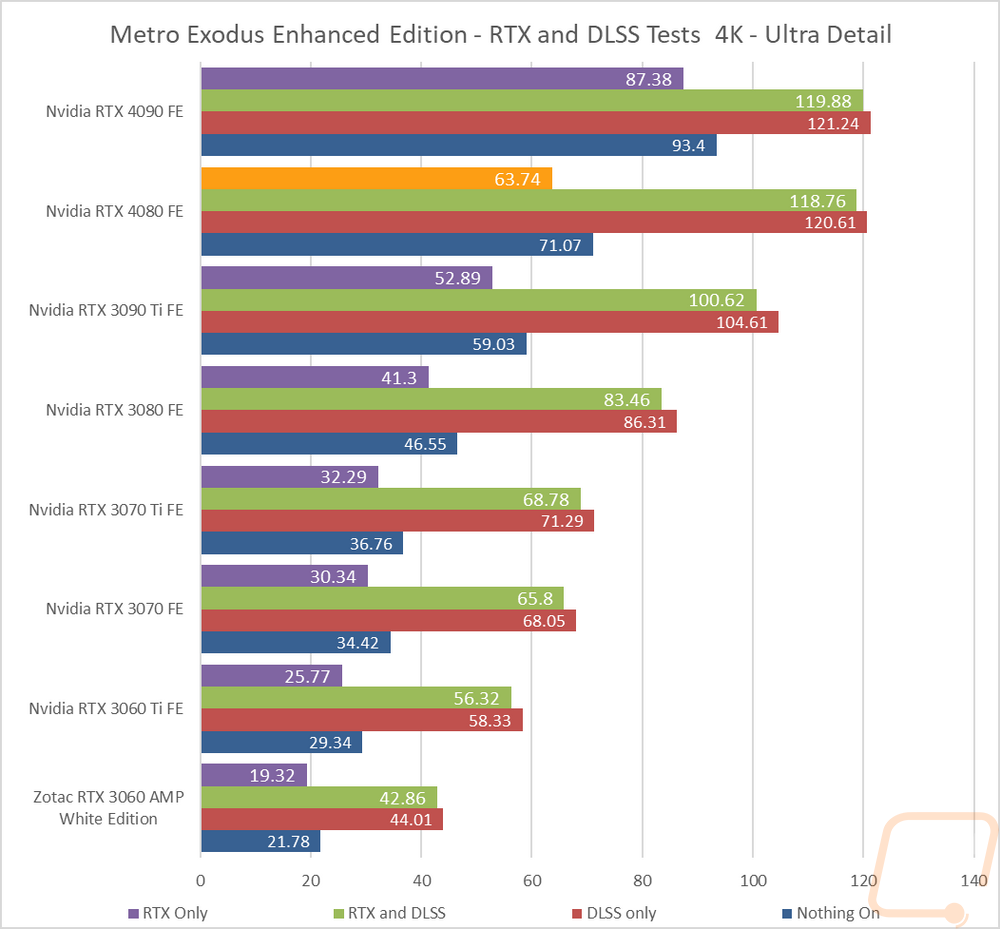
Next, I wanted to check out the performance in Metro Exodus which we have used for testing for a long time now. This test is similar as well with it set to 4K and Ultra detail, I use the included benchmark to test DLSS and RTX individually and then with them both on and both off to give us a look at overall frame rates depending on which direction you go. Running RTX on the RTX 4080 Founders Edition dropped the frame rate from 71 down to 63 FPS but running DLSS was able to nearly double that and the performance gap between RTX or no-RTX was nearly nothing when running DLSS.
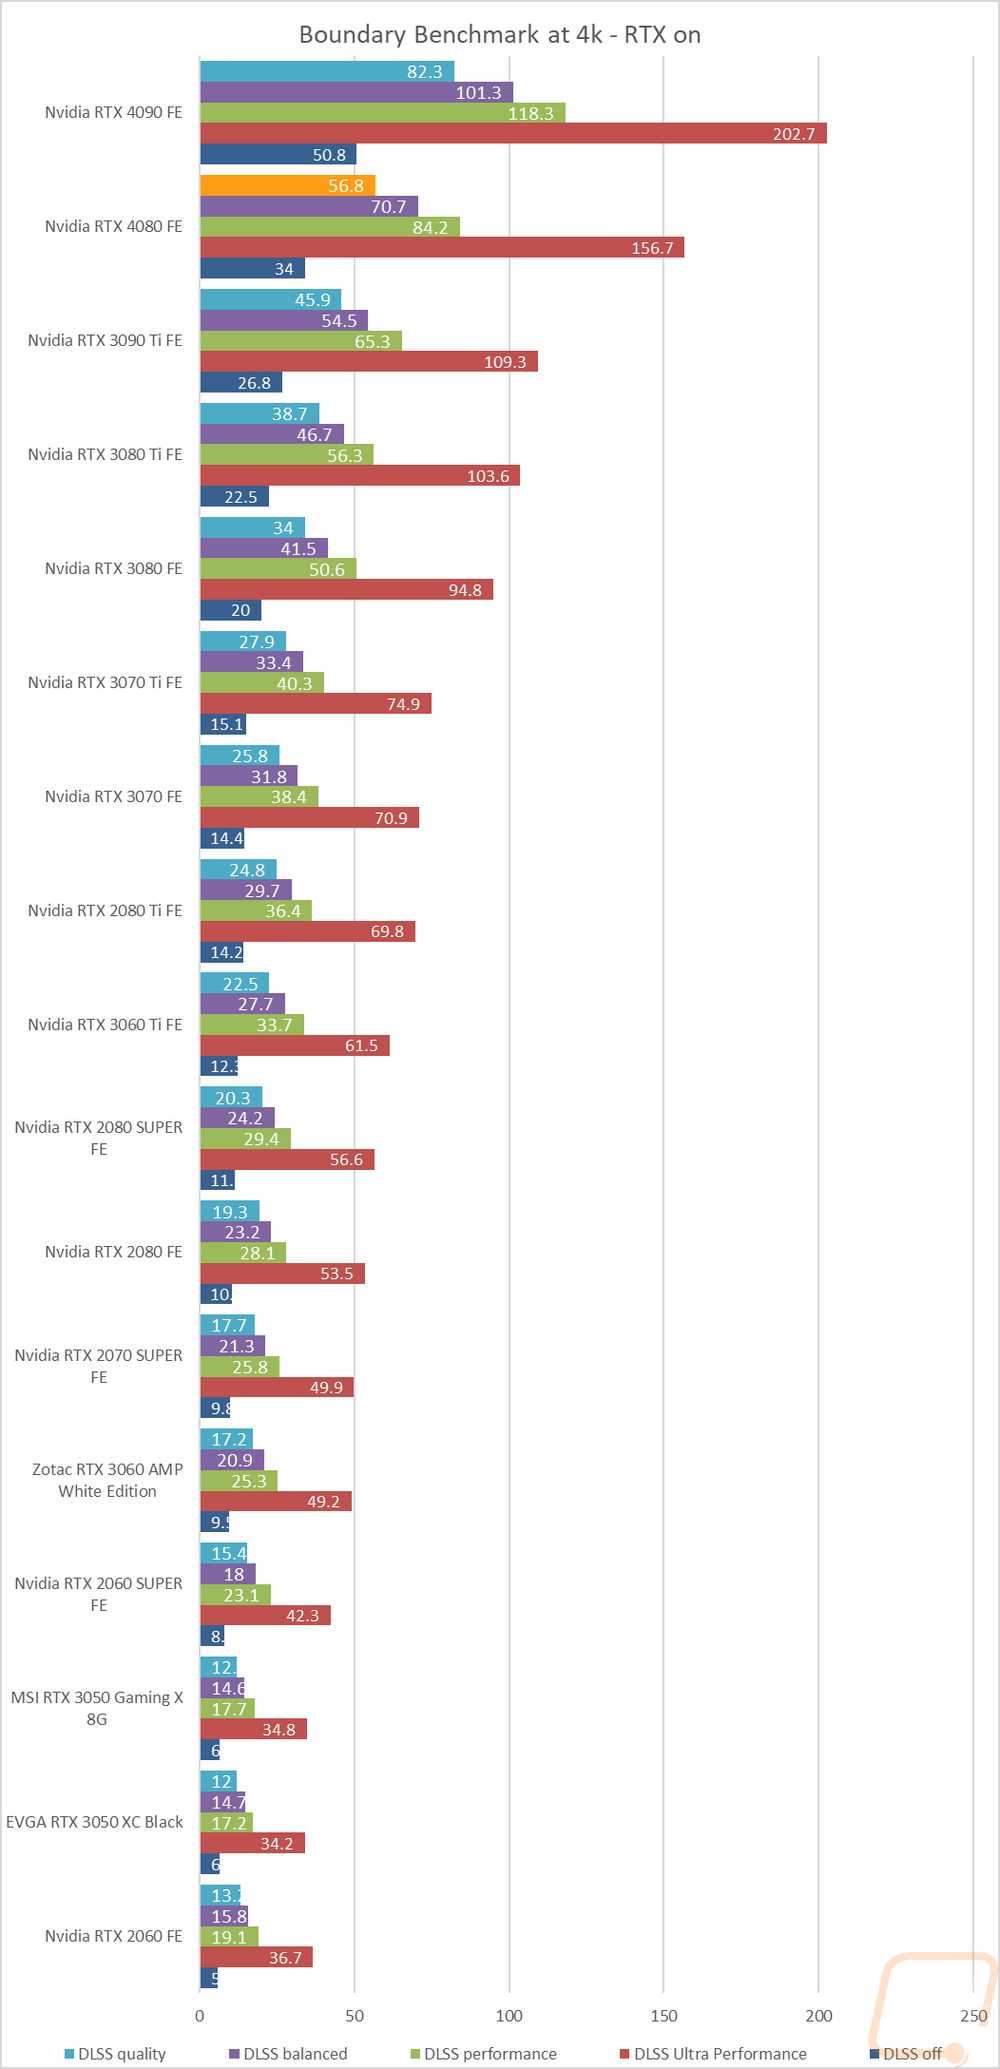
Next, I tested using a benchmark based on the game Boundary. For this one, I wanted to see how all of the different DLSS settings would perform, including turning it off completely. This is run using the free benchmark and with the resolution set to 4k and RTX on. While the RTX 4080 Founders Edition performed much better than any of the older cards, it didn’t have the performance to get to nearly smooth performance here without DLSS on at all like the 4090 was. But turning DLSS on, even on the highest detail was enough to get close to the 60 FPS range. The ultra performance setting on the other handle doubled those numbers and some.
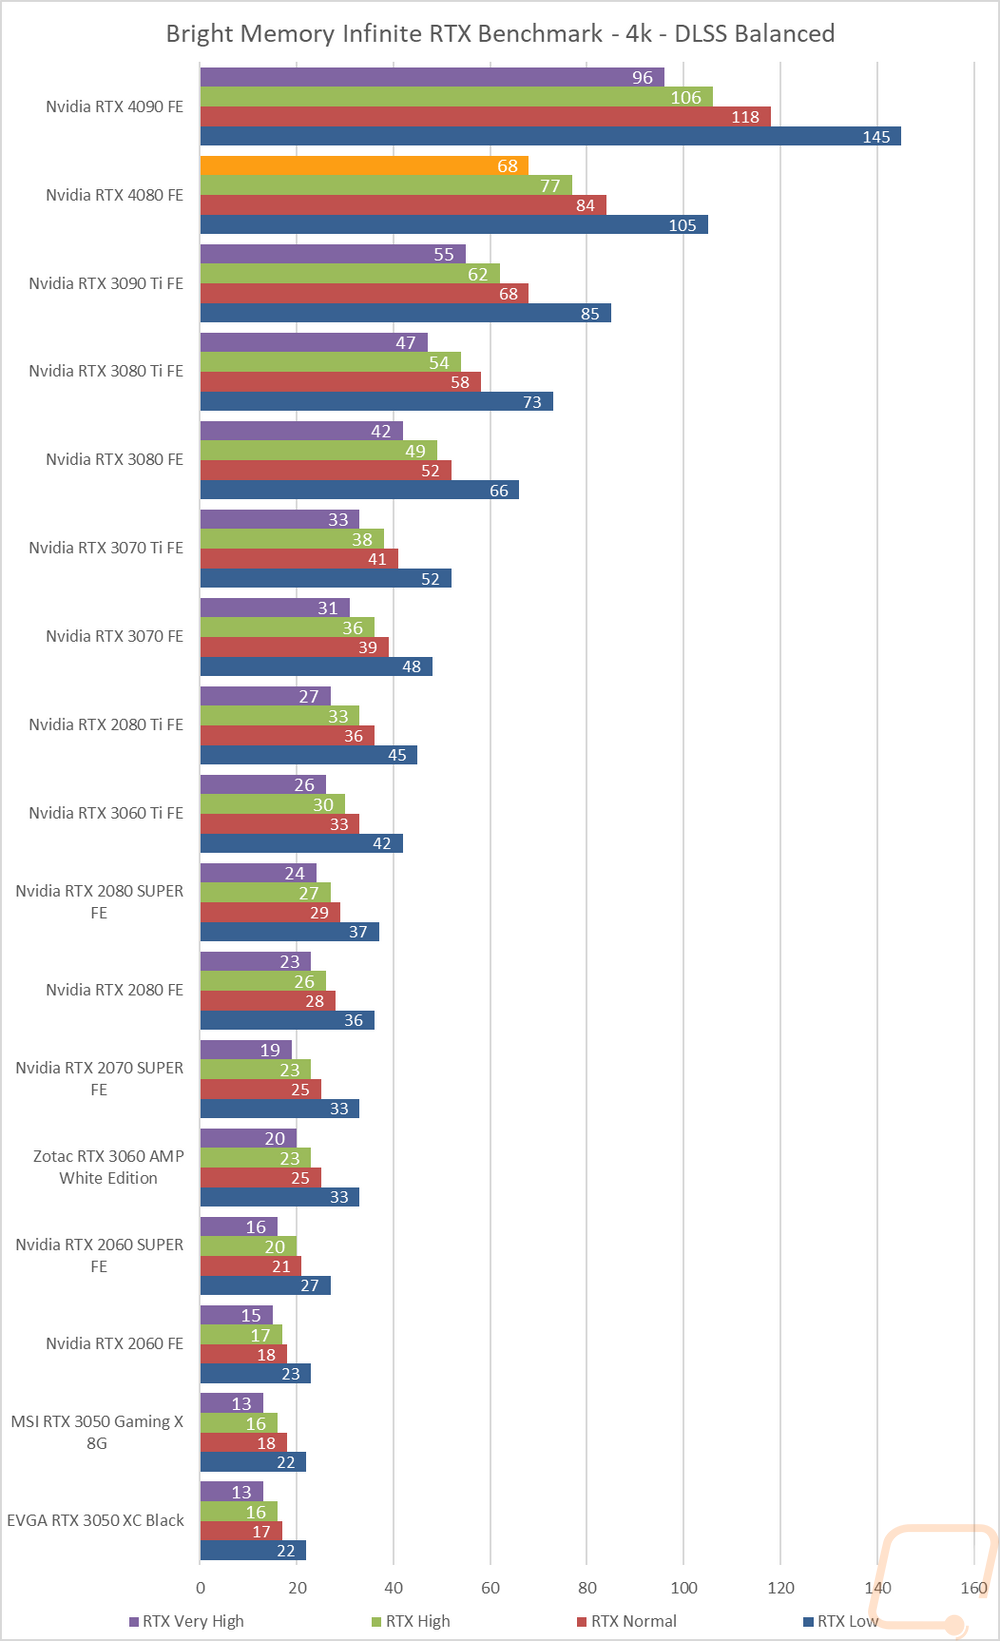
The last tests were done in a benchmark based on the game Bright Memory with their free steam benchmark. This is similar to the previous Boundary test only it is looking at RTX settings individually with the resolution set to 4K and DLSS is set to the balanced setting. The RTX 4080 Founders Edition came in at 68 FPS at the highest RTX preset but it is interesting to see how changing the RTX detail improved performance. It wasn’t enough, in this case, to bump the frame rate up into the next category like how in the past it was able to bump things up over 60 FPS but this does show how sometimes playing with this setting when available can get you a little more smoothness when needed.
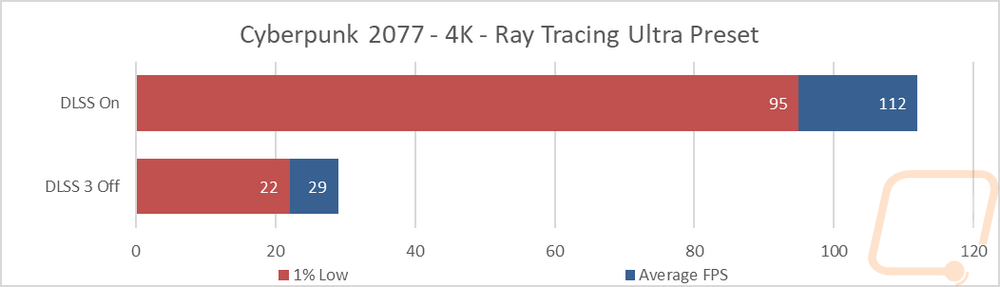
I also wanted to take a look at DLSS 3 performance as well a little more than my initial look at it with 3DMark’s benchmark. For this, I put Nvidias Frameview to the test to run a few benchmarks using the games that currently support DLSS 3. For games with a built-in benchmark I ran the benchmark but used frameview so we could get the FPS and 1% lows and because with some of the games frame generation is messing up their in game FPS readouts. V-Sync was turned off on all of the tests because it currently causes problems with frame generation and all of the tests were done at 4K with the highest detail settings including the highest RTX settings. DLSS 3 when there is an option was set to performance which is the setting Nvidia suggests when using it at 4K.
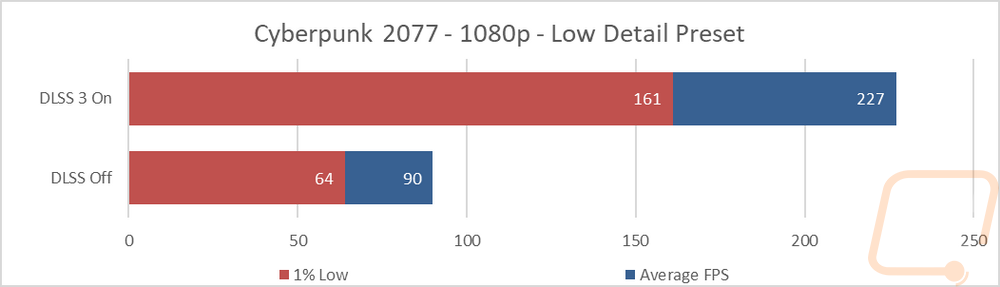
The first game tested was Cyberpunk 2077 and this one shows how big of a difference DLSS 3 can make. With it off the game averaged 29 FPS but with everything turned on it was nearly 4 times as fast at 112 FPS. 1% lows did have a bigger gap but weren’t too bad as well. I tested Cyberpunk with the detail turned down and at 1080p as well to move things to be CPU limited and the game went from 90 FPS up to 227 FPS, being CPU limited although it does show more in the 1% lows.
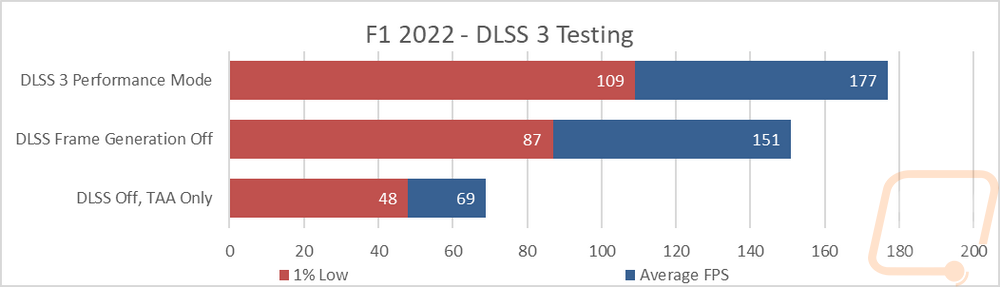
In F1 2022 I ran three tests. I tested with full DLSS, I did it again but turned off frame generation, and then tested with DLSS off and TAA on. Frame generation here was good for another 36 FPS but DLSS 3 as a whole went from 69 FPS to 177 FPS, a 156% improvement.
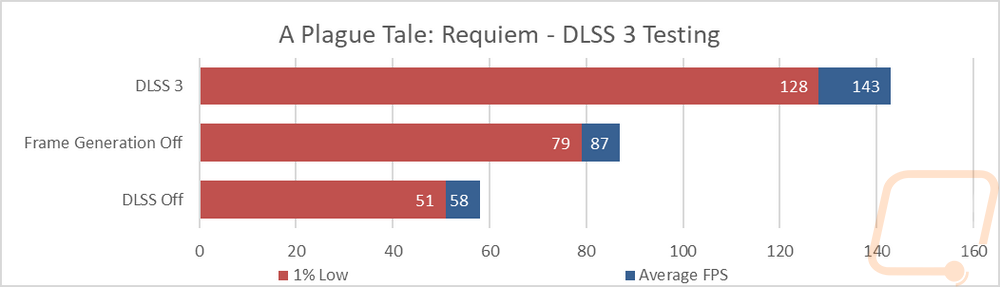
In A Plague Tale turning frame generation showed how much it can help a lot more with DLSS 3 without it improving from 58 FPS to 87 FPS but jumping up to 143 with it on.
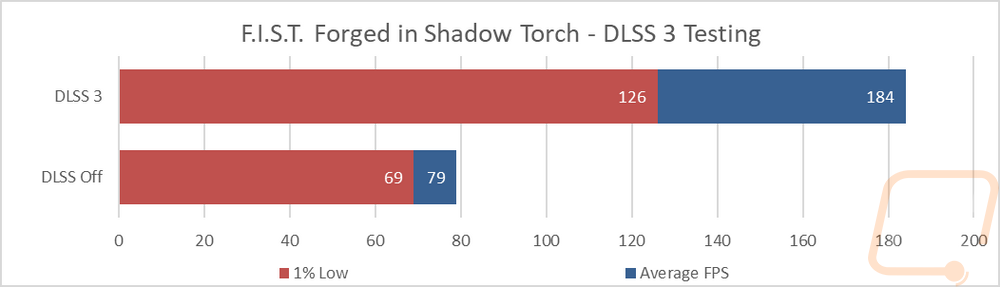
In the side scroller Forged in Shadow Torch DLSS, 3 made a huge difference once again but you do trade off a lot on the 1% lows. Without it, the 4080 was running at 79 FPS and improved 132% to 184 FPS with DLSS 3 on.
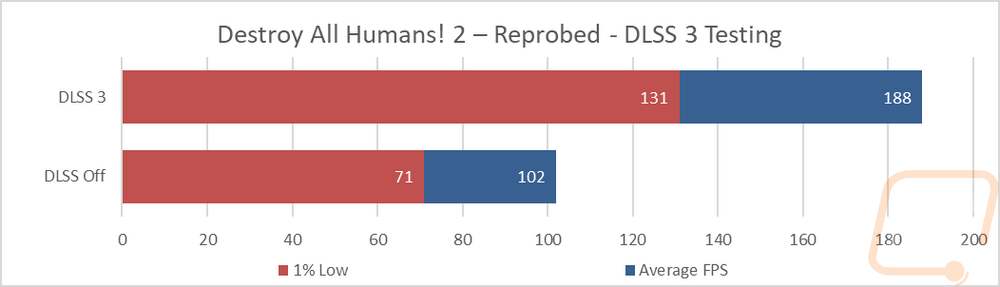
Next up was Destroy All Humans! 2 – Reprobed. The RTX 4080 Founders Edition did well here even without DLSS with it averaging 102 FPS but turning it on did jump it up to 188 FPS. The 1% lows here did get worse with DLSS 3 on.
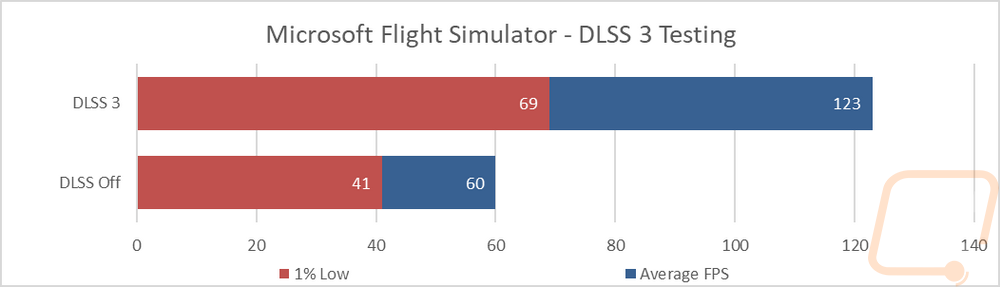
Last I took a look at Microsoft Flight Simulator and this is an interesting case because this is a well-known CPU-limited game. With DLSS off the RTX 4080 Founders Edition averaged 60 FPS on our landing test run over Sydney. Turning DLSS 3 on including frame generation doubled that averaging 123 FPS which is a huge improvement. Being CPU limited the 1% lows did go up from the 41 Frames without DLSS but the gap between the 1% low and the average FPS with DLSS 3 on was a lot wider.
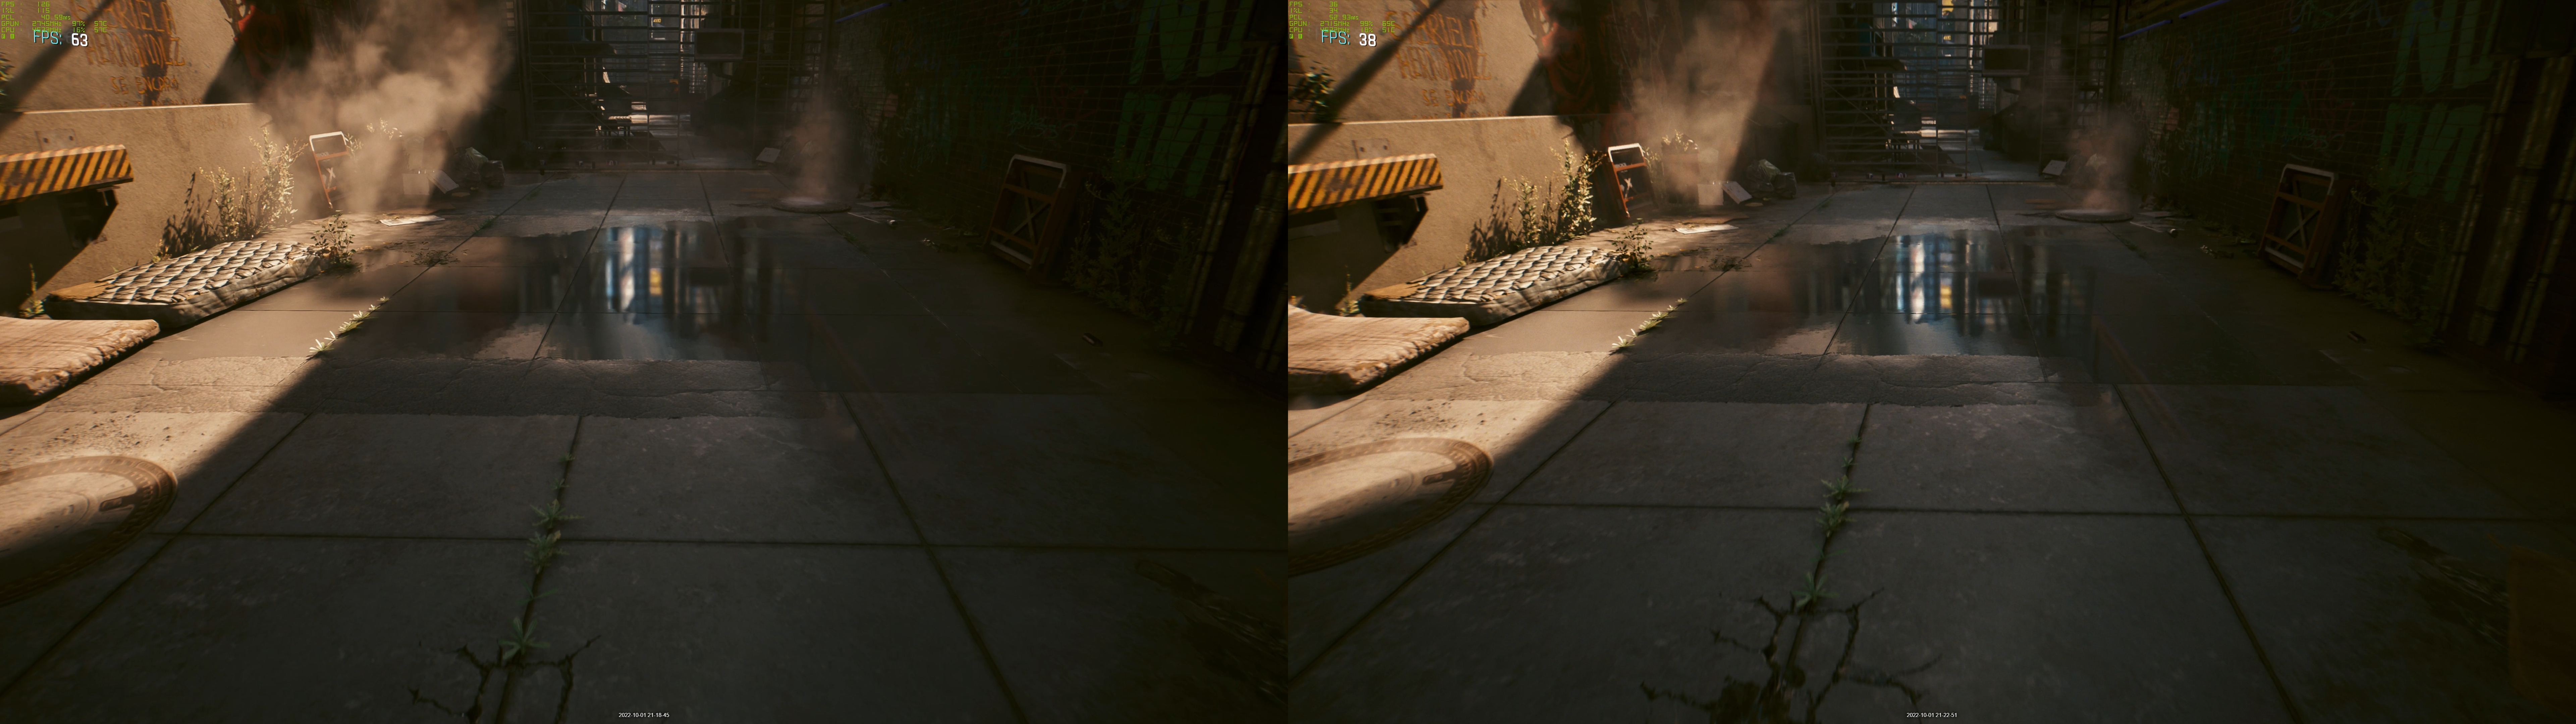
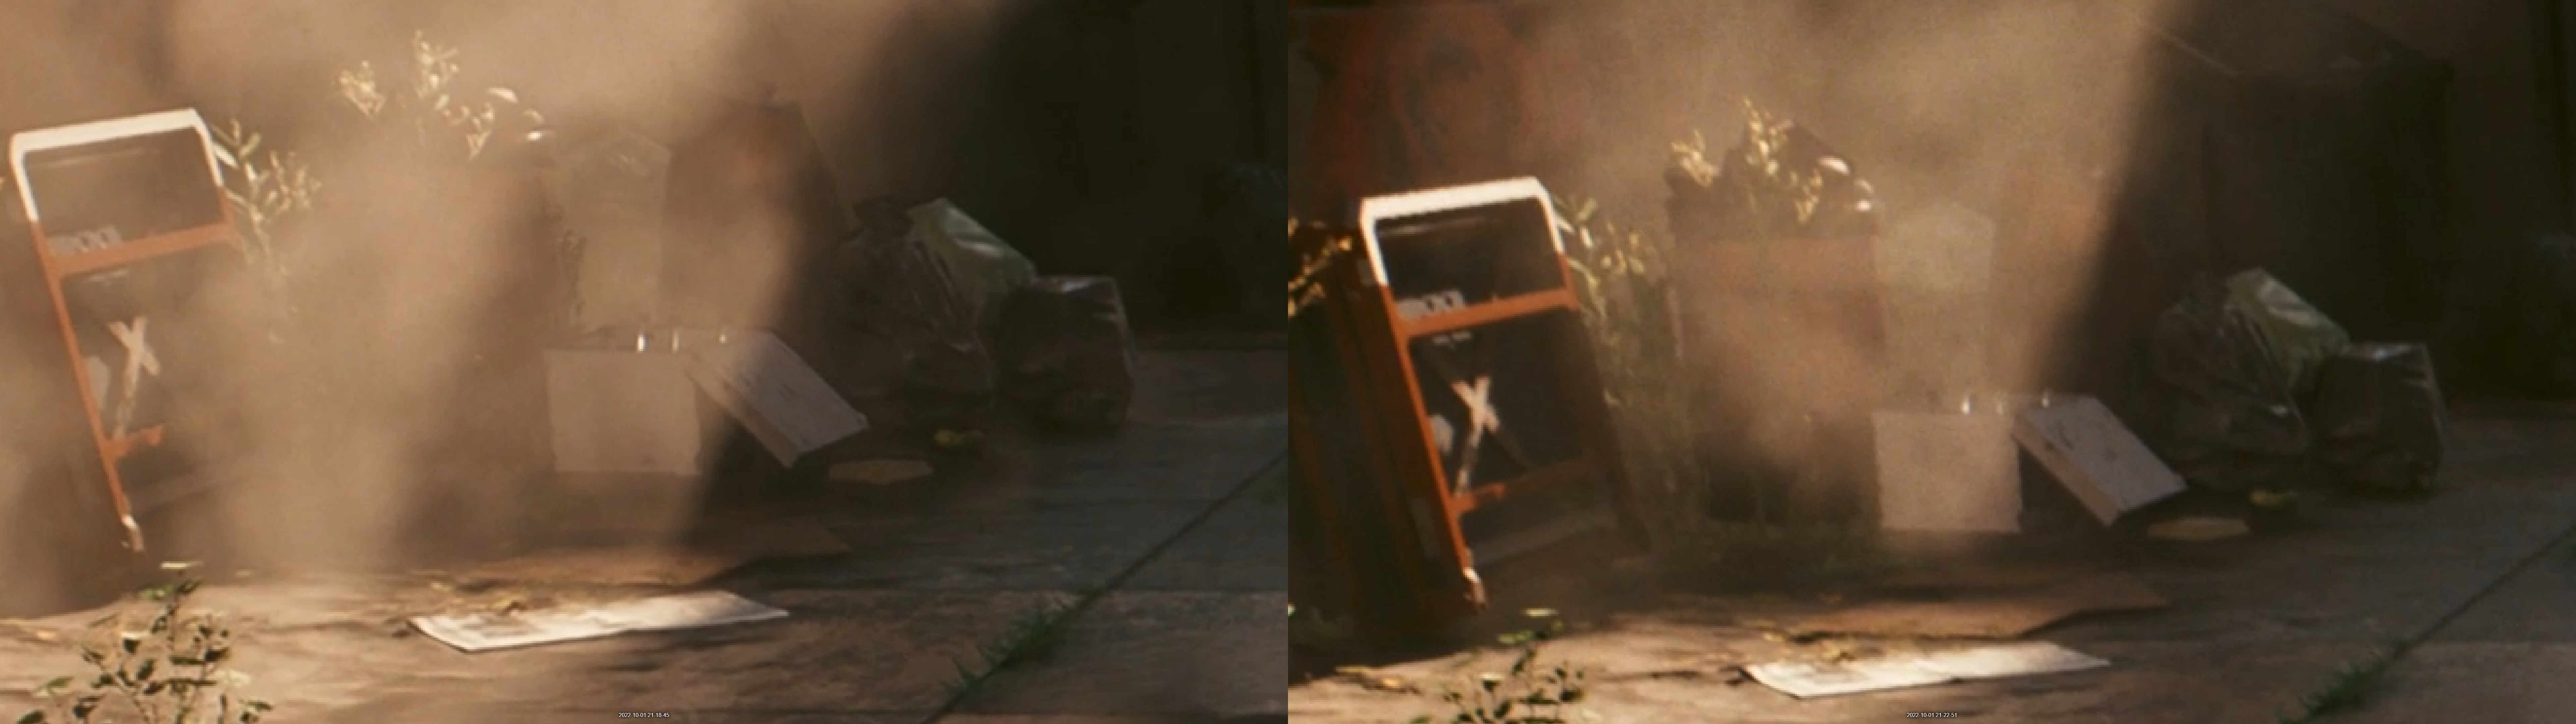
When doing my Cyberpunk 2077 DLSS 3 testing I did also run through the benchmark with DLSS 3 on and again with it off while recording video to get a few side y side images using Nvidia’s iCat tool for comparison. Recording at the highest possible detail levels with OBS at the same time as running the benchmark slowed things down significantly, especially on the non-DLSS 3 side so don’t pay much attention to the frame rates indicated. For some reason, iCat didn’t integrate the labels I put on the images as well when I created these but for the record DLSS 3 is on the left and no DLSS at all is on the right. In the first image of an alleyway at full-screen, everything looks amazing with just a few small details like the lights in the reflection being a little less crisp. Zooming into the trash cans through the smoke we can see that the colors on a few things are a little more toned down in the DLSS 3 image and if anything the trash bags are a little crisper.
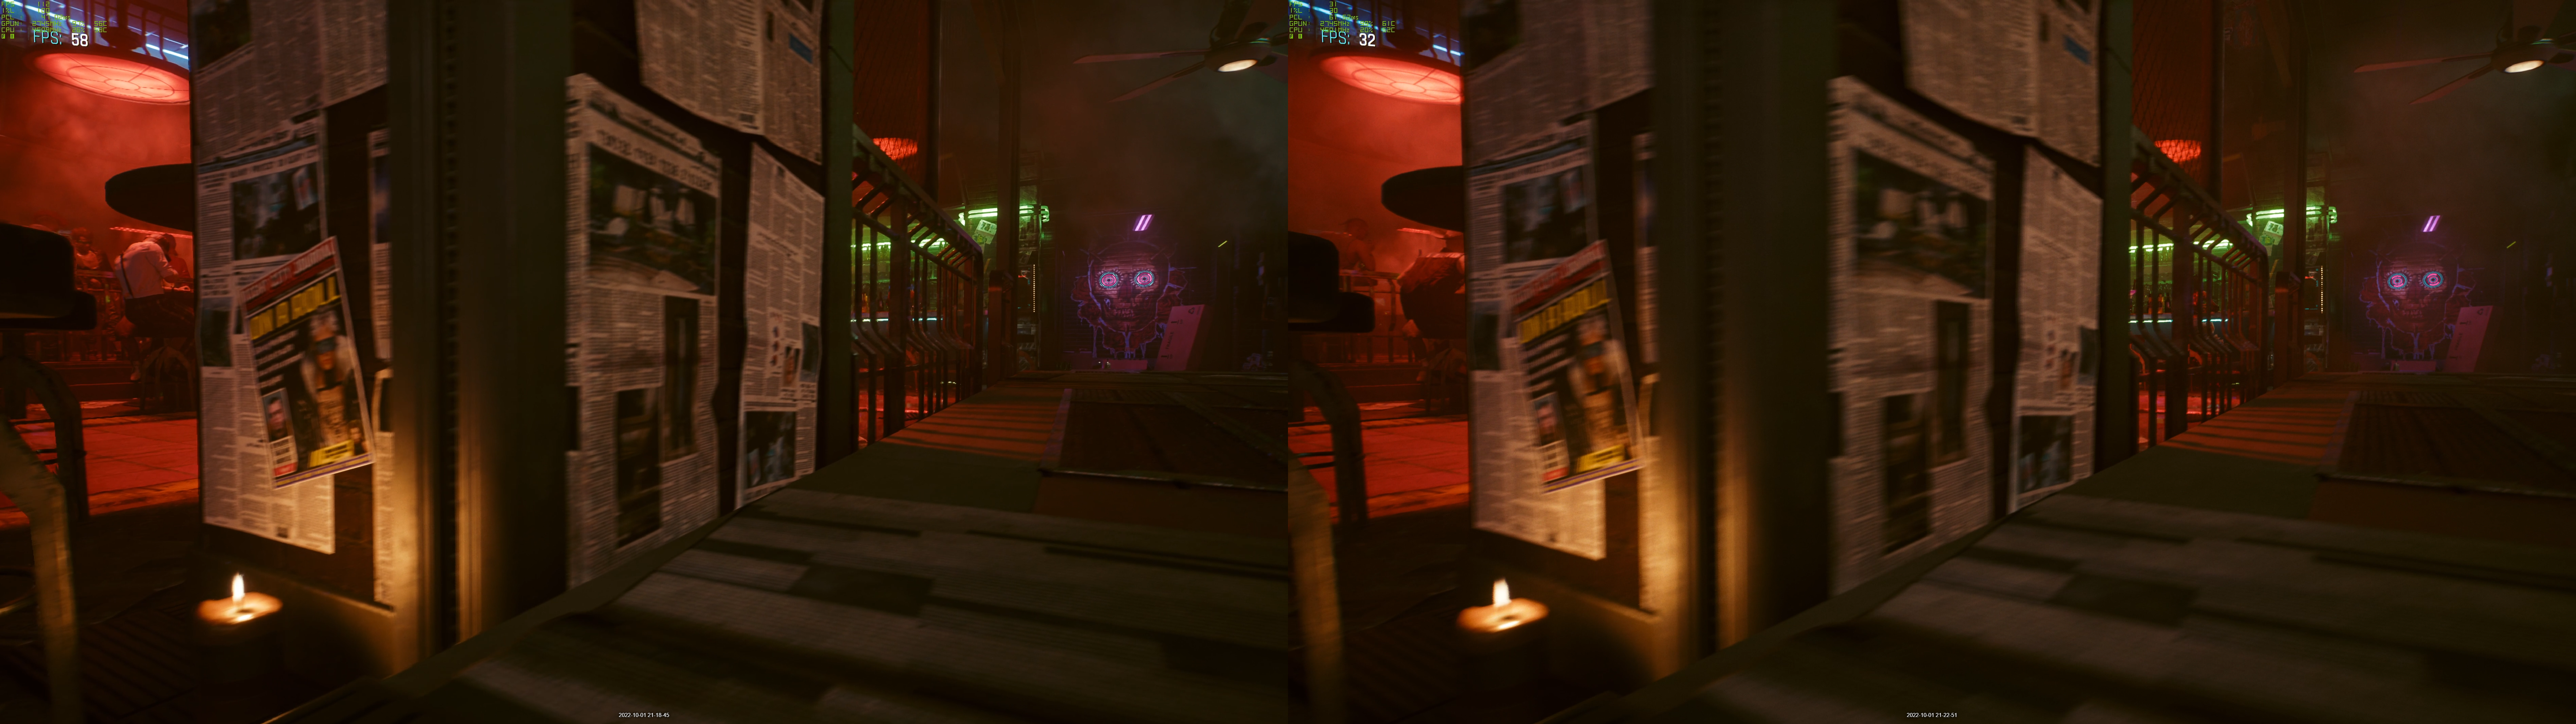
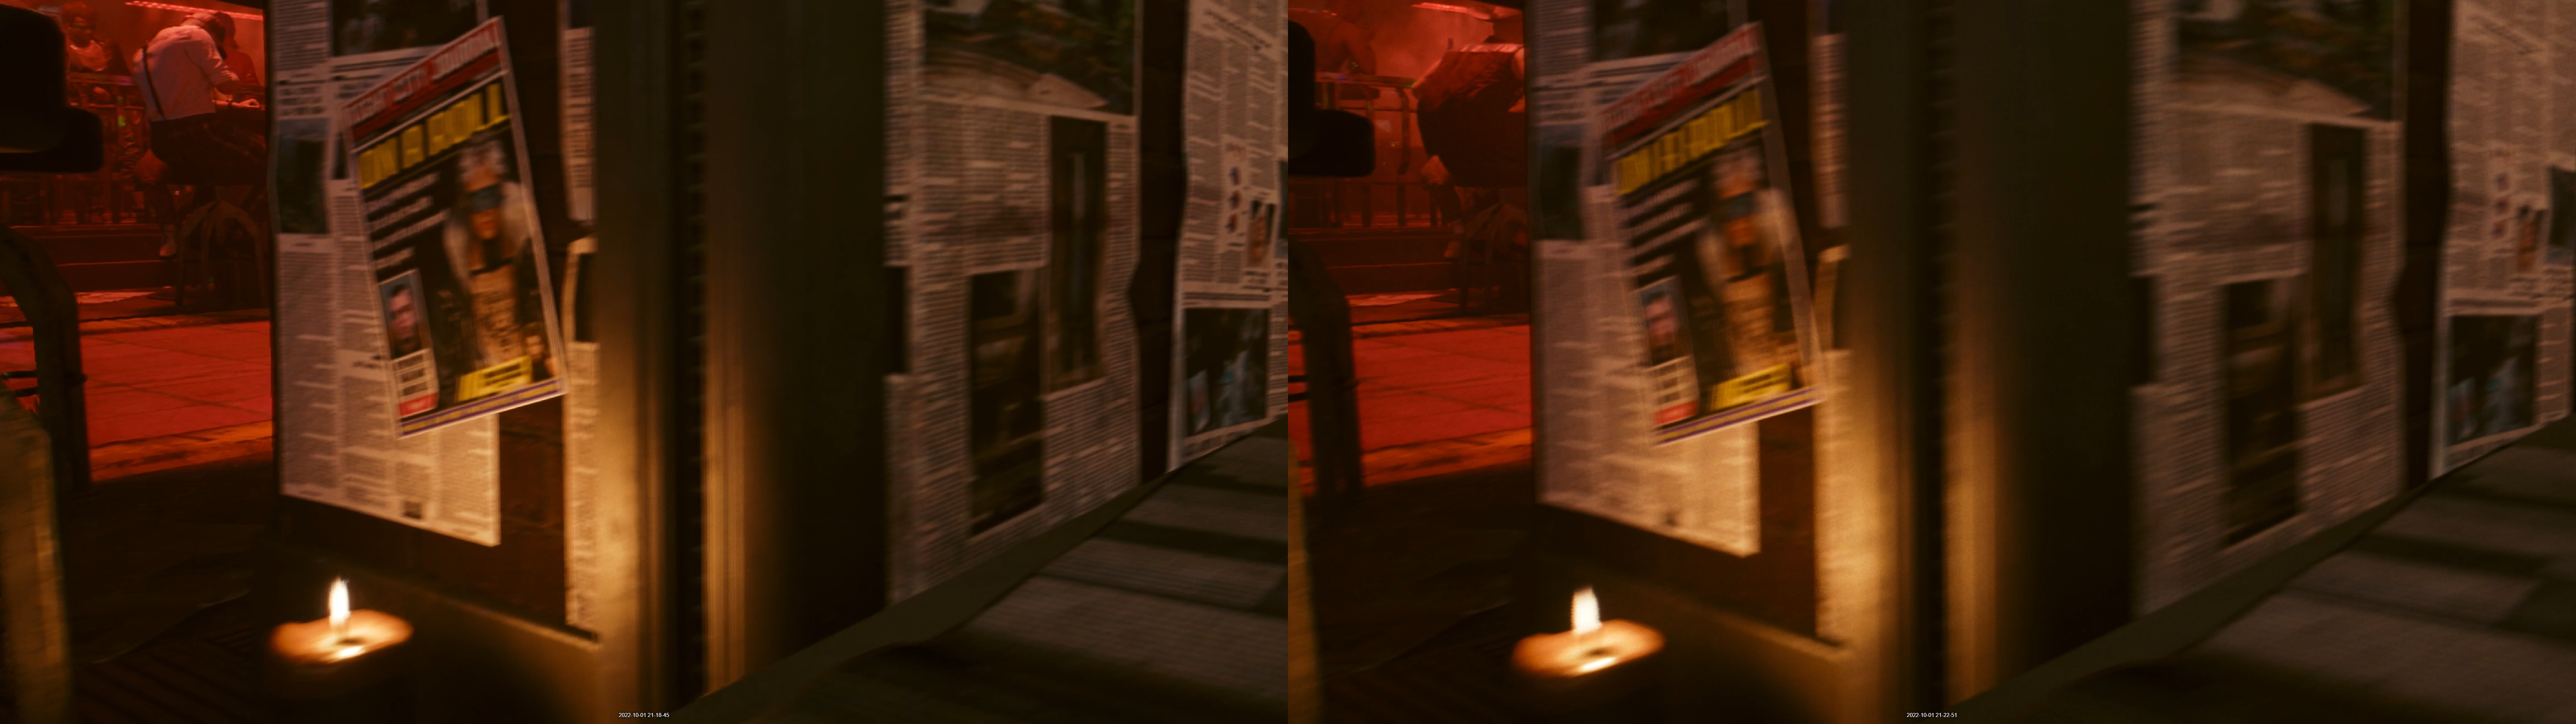
Going inside I found that the DLSS 3 on image things like the papers on the walls were crisper and easier to read. The neon lights are a little brighter on the DLSS 3 side as well.
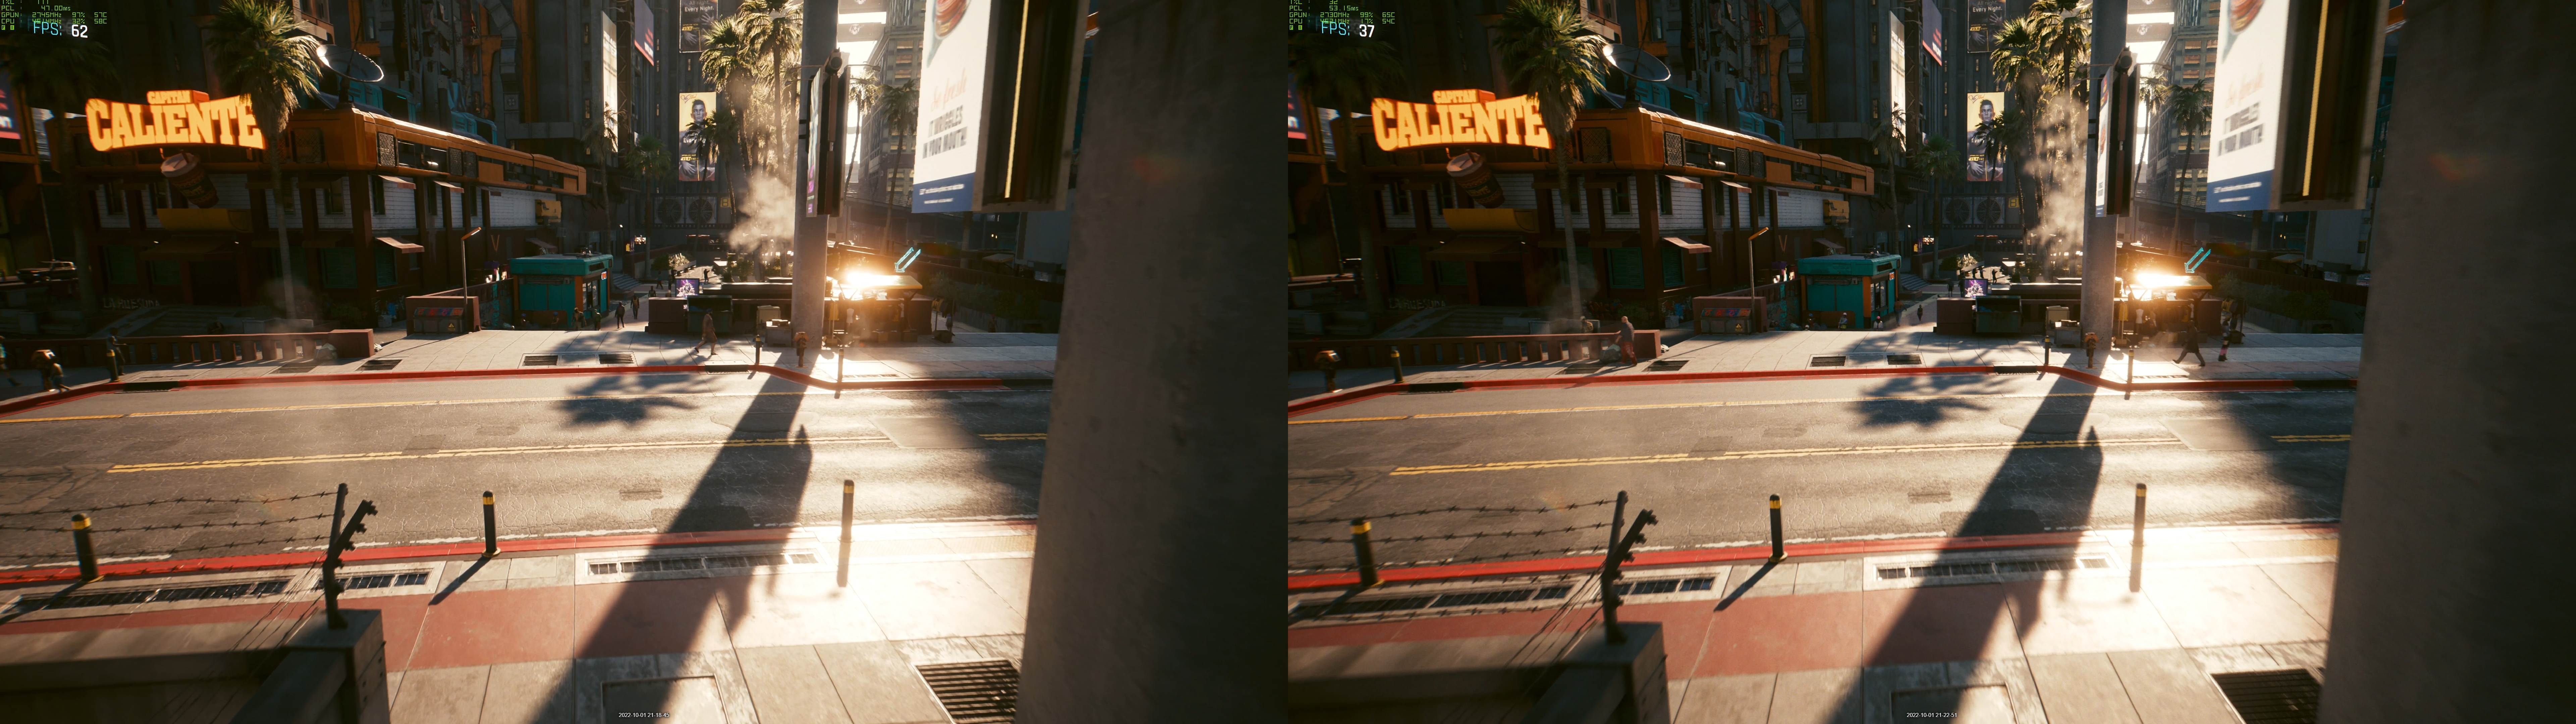
Going outside again into the street I found that the DLSS 3 image is a little sharper in details like the signing and when I zoom in on the post and shadows. There are a few colors that are richer with DLSS off but overall in all three of the examples, I found that the running DLSS 3 looks great. This was especially true when playing at speed, I couldn’t tell the difference between them at all until I had side-by-side images paused.
As of this launch, Nvidia has 10 games with full DLSS 3 support and that doesn’t count WRC Generations, Need for Speed Unbound, and Warhammer 40,000: Darktide which all have support coming before the end of the month. DLSS 3 will live or die by the games that support it and it is good to see support being added to older games as well as new games. This is especially true with games like Microsoft Flight Simulator where you can see performance gains on CPU-limited games without a CPU upgrade. Here is the full list of current DLSS 3 games.
A Plague Tale: Requiem
Bright Memory: Infinite
Destroy All Humans! 2 - Reprobed
F.I.S.T.: Forged in Shadow Torch
F1 ® 22
Justice
Loopmancer
Marvel’s Spider-Man Remastered
Microsoft Flight Simulator
SUPER PEOPLE
Cooling Noise and Power
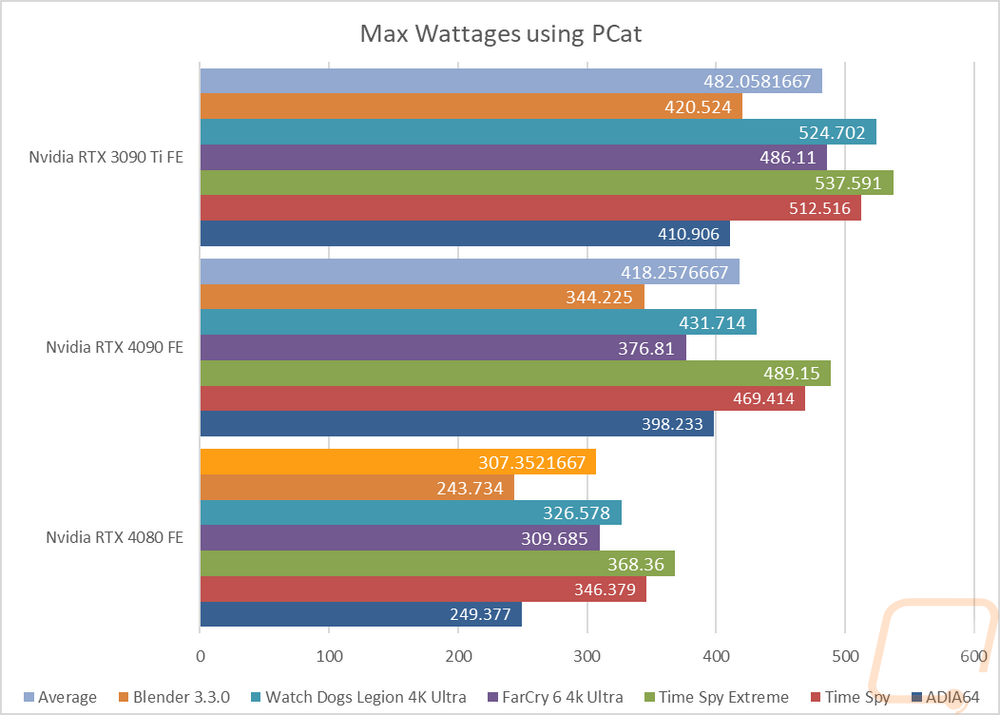
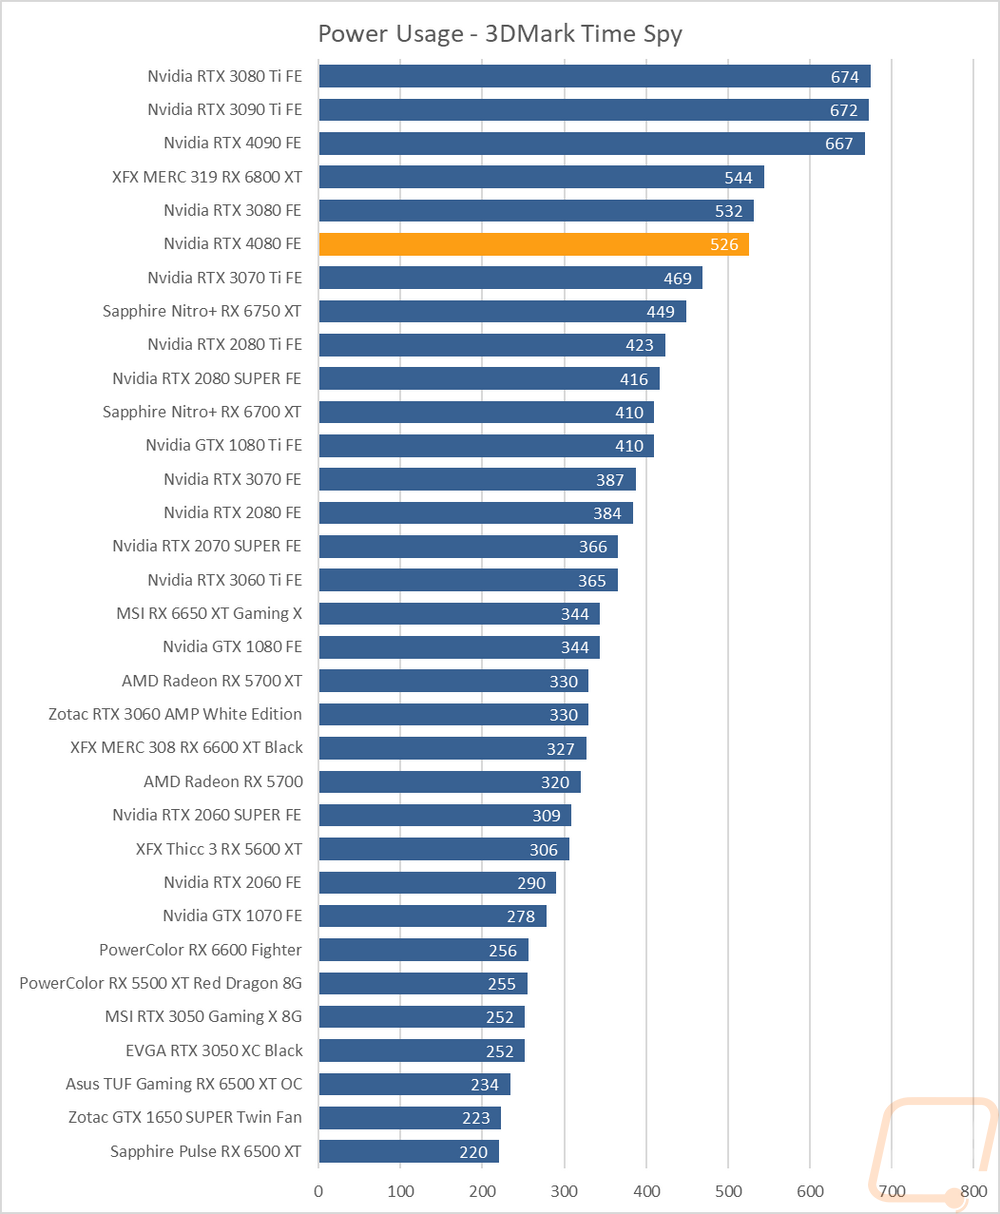
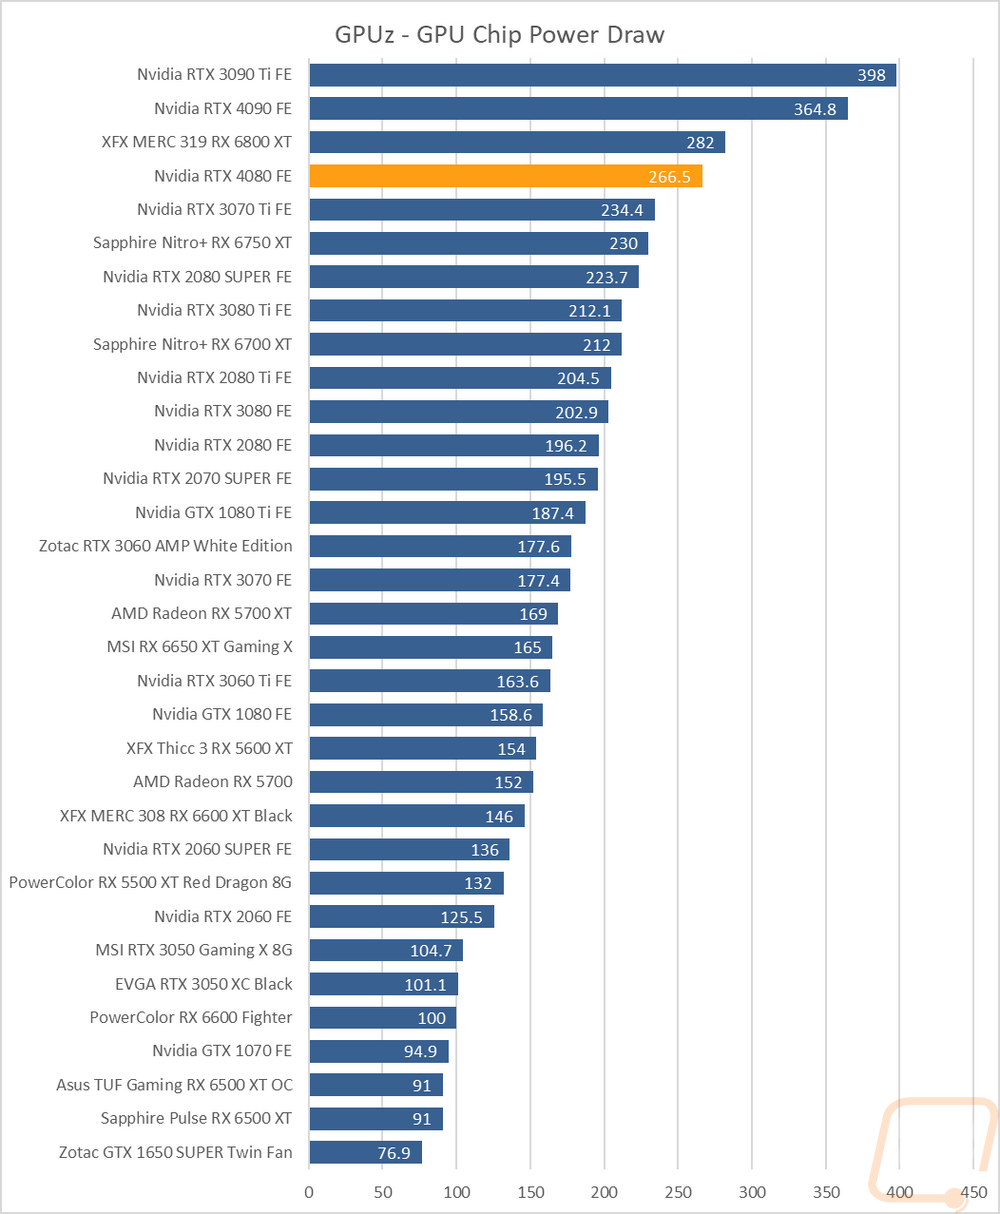
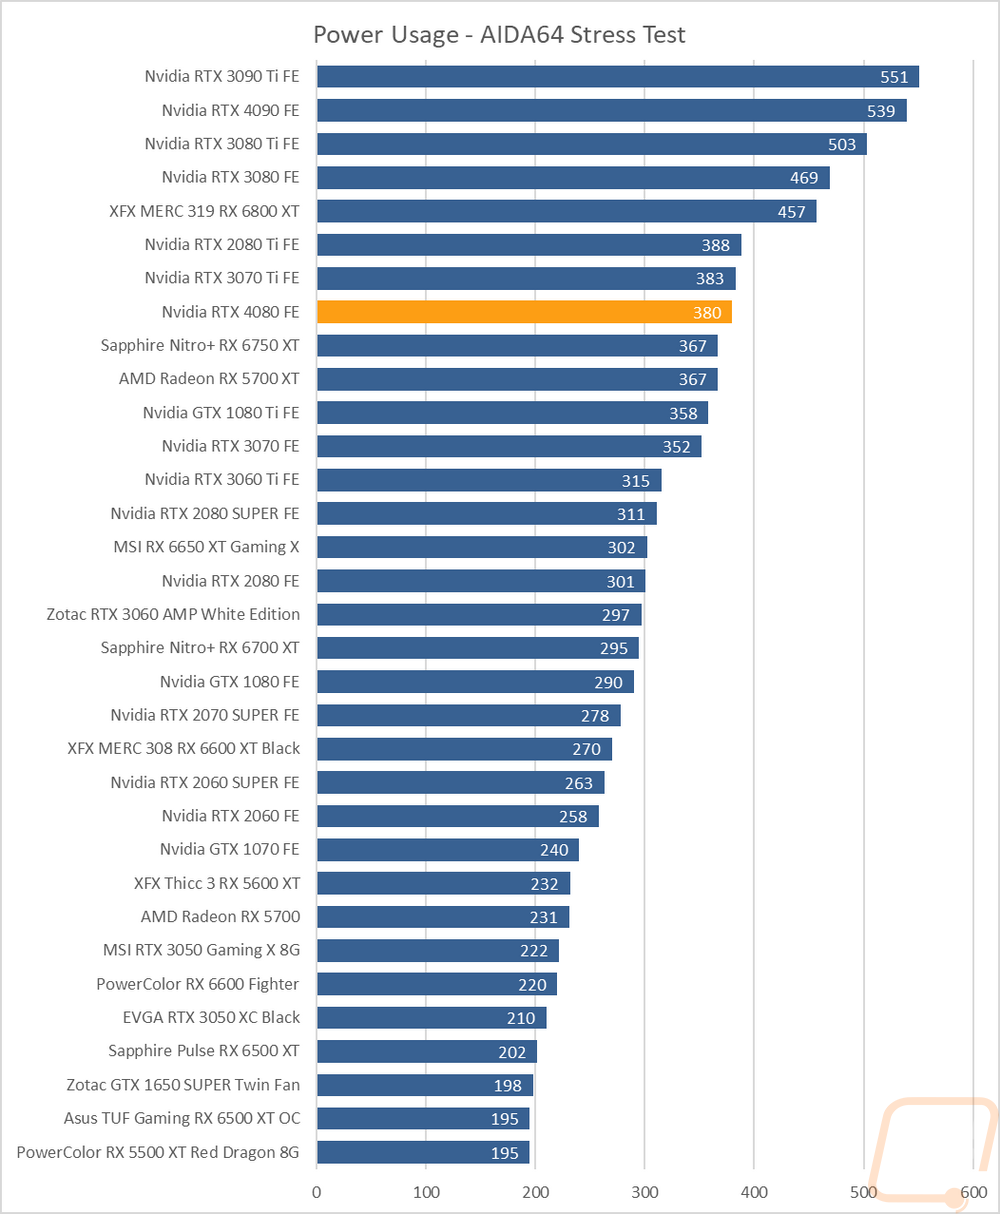
For my last few tests, rather than focusing on in game performance, I like to check out other aspects of video card performance. These are also the most important ways to differentiate the performance between cards that have the same GPU. To start things off I took a look at power usage. For this, I use our Kill-A-Watt hooked up to the test bench to record the total wattage of the system. I ran two tests with the first using 3DMark Time Spy to put the system under a load similar to normal in game performance. Here our test system with the RTX 4080 Founders Edition pulled 526 watts at peak which was surprisingly less than the same system pulled with the RTX 3080 on it. At the same time with Time Spy I also use GPUz to check out the onboard reading for GPU power draw at the chip. The RTX 4080 Founders Edition showed 266.5 watts for the GPU and 307.3 watts of total board power. I also run AIDA64’s stress test on the video card to load up only the GPU and using the Kill-A-Watt the test bench with the RTX 4080 Founders Edition pulled 380 watts which shows how much the CPU side of things is also using but to double check that I got my hands on a new PCat v2 from Nvidia to test JUST the video card power by monitoring both the 12VHPWR connection and the PCIe slot. For this one, I ran a range of tests to get a better look at power usage depending on load types. Blender surprisingly was the lowest on all three cards with AIDA64’s workload being the second lowest. Time Spy and especially Time Spy Extreme on the other hand pushed the RTX 4080 Founders Edition past its TGP of 320 watts by 26 and 48 watts respectively which does make you wonder if that is just optimization for the always popular benchmark. The in game tests fell closer to the TGP with it being 309 watts in Far Cry 6 and 326 watts in Watch Dogs. I then averaged all of the results out with the RTX 4080 Founders Edition averaging 307 watts. For comparison, the RTX 4090 averaged 418 and the older 3090 Ti was even higher at 482 watts which is crazy considering its TGP is 350 and the 4090 has a higher TGP of 450 watts.
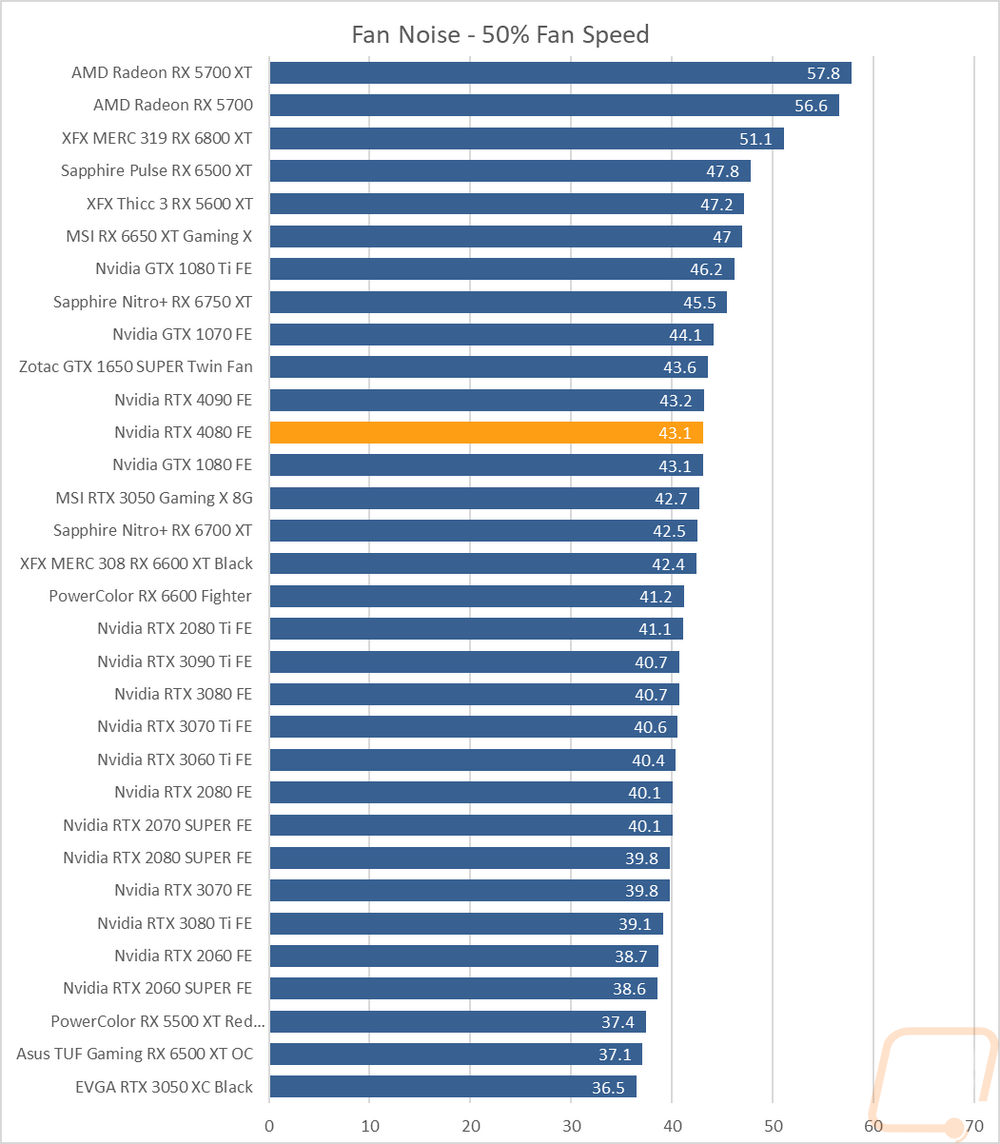
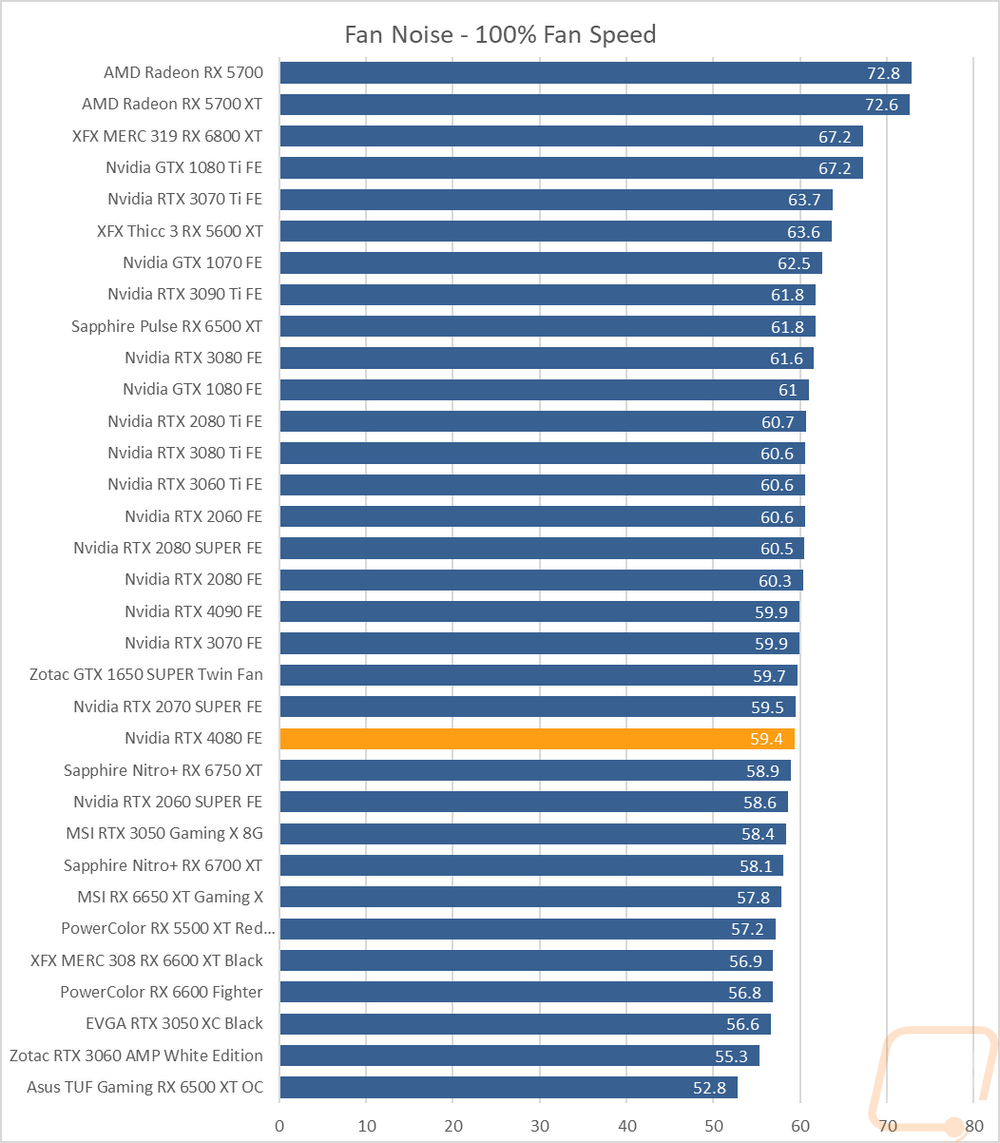
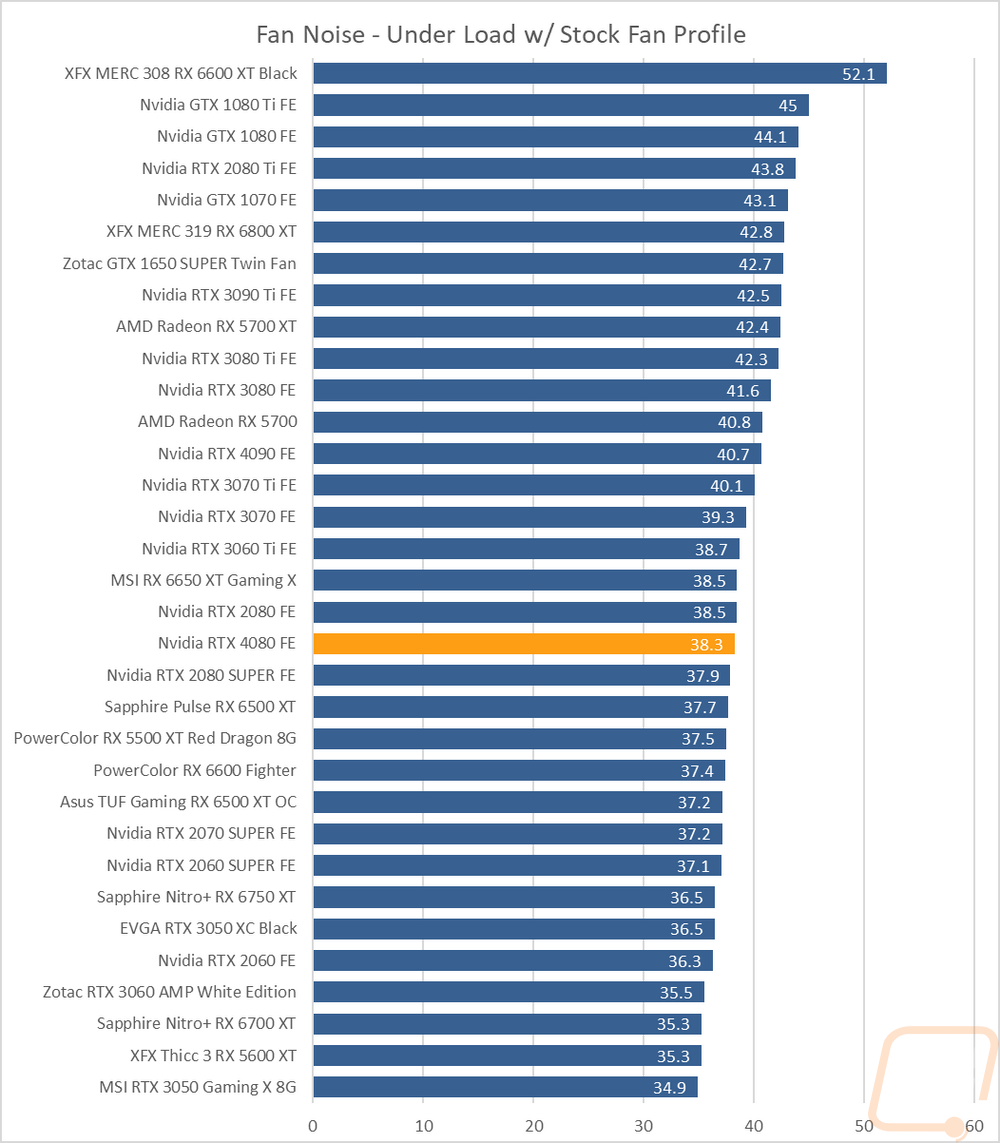
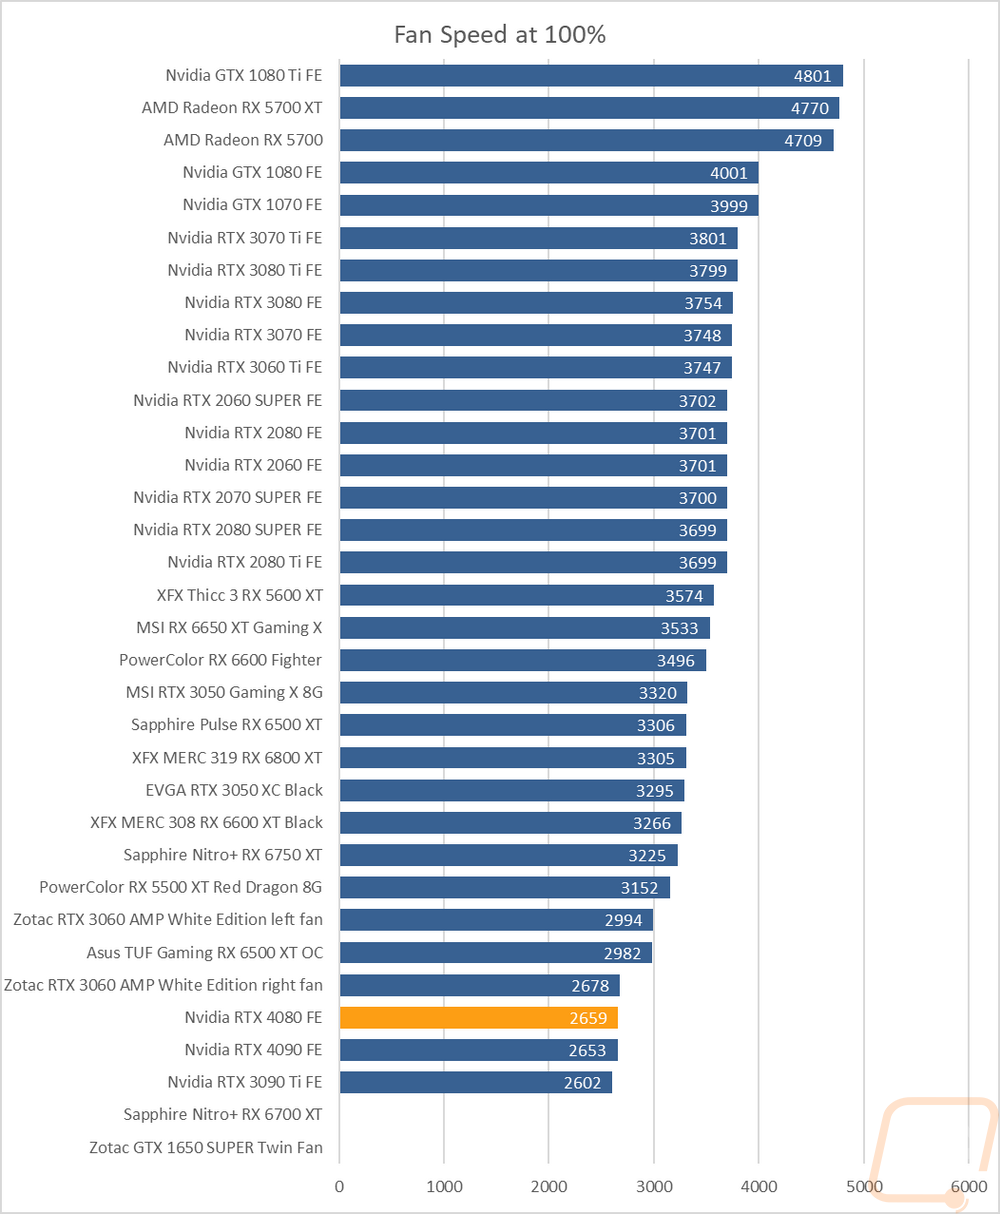
My next round of tests were looking at noise levels. These are especially important to me because I can’t stand to listen to my PC whirling. Especially when I’m not in game and other applications are using the GPU. For my testing, though I first tested with the fan cranked up to 100% to get an idea of how loud it can get, then again at 50% to get an idea of its range. The RTX 4080 Founders Edition fell in the bottom half of the cards tested when testing at 100% fan speed and was right with the RTX 4090 Founders Edition which shares the same cooler. This was an improvement over the RTX 3080 FE and RTX 3080 Ti which came in at 61.6 and 60.6 decibels. The 50% fan speed result was again right with the 4090 FE but was right in the middle of the pack. I also take a look at noise performance while under load. For that when running AIDA64’s stress test I wait until the temperature of the card has leveled off and then measure how loud things are when the card is at its worst-case scenario with the stock fan profile. Here the RTX 4080 Founders Edition did well at 38.3 decibels, 2.4 decibels lower than the 4090 FE with the same cooler but more heat. And even farther below both the RTX 3080 FE and the RTX 3080 Ti FE. The RTX 4080 Founders Edition and the 4090 were able to do this because even when cranked up to 100% fan speed the two fans are only running at 2659 RPM which puts them and the 3090 Ti at the bottom of our chart.
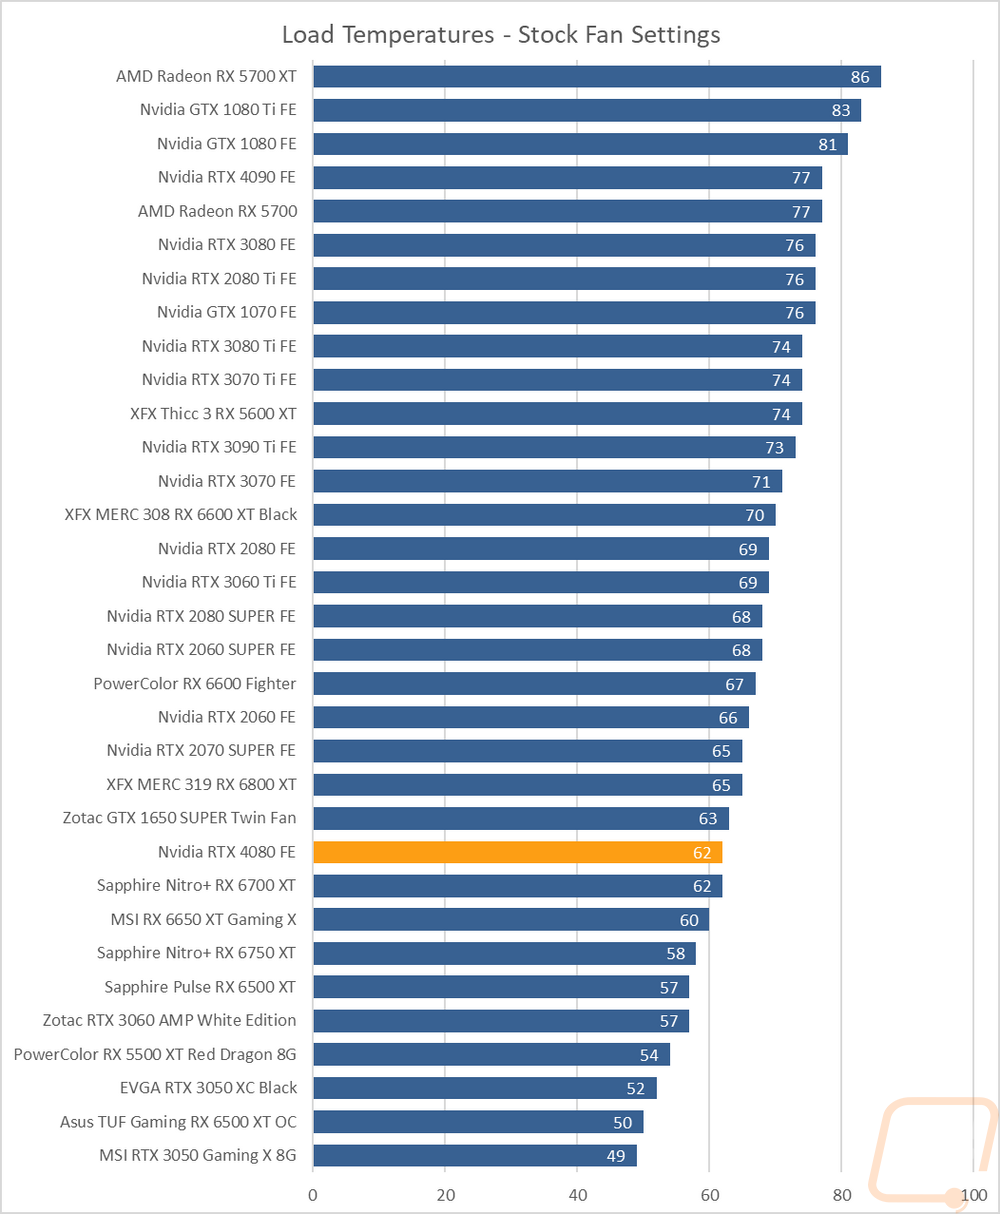
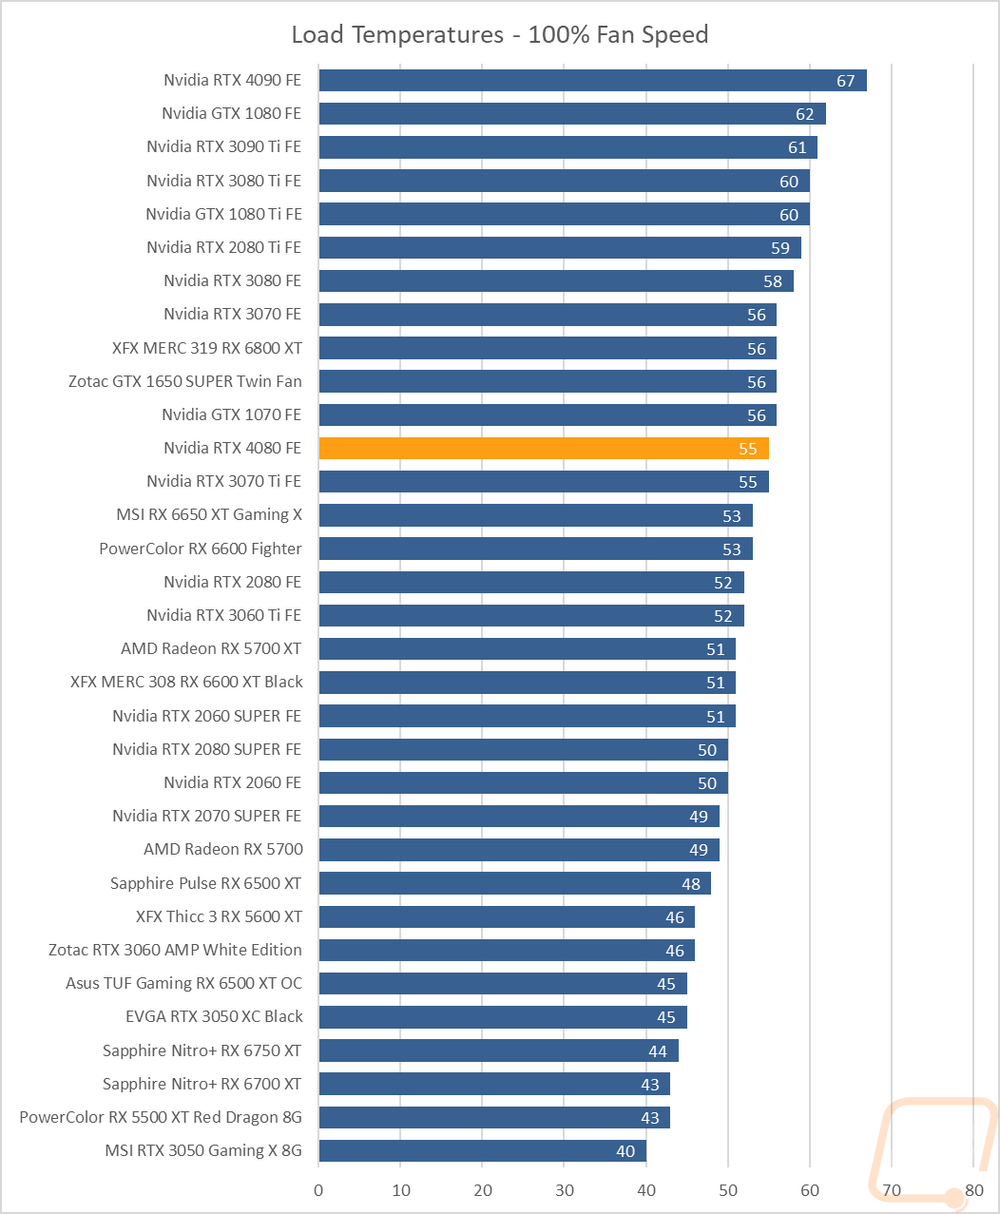
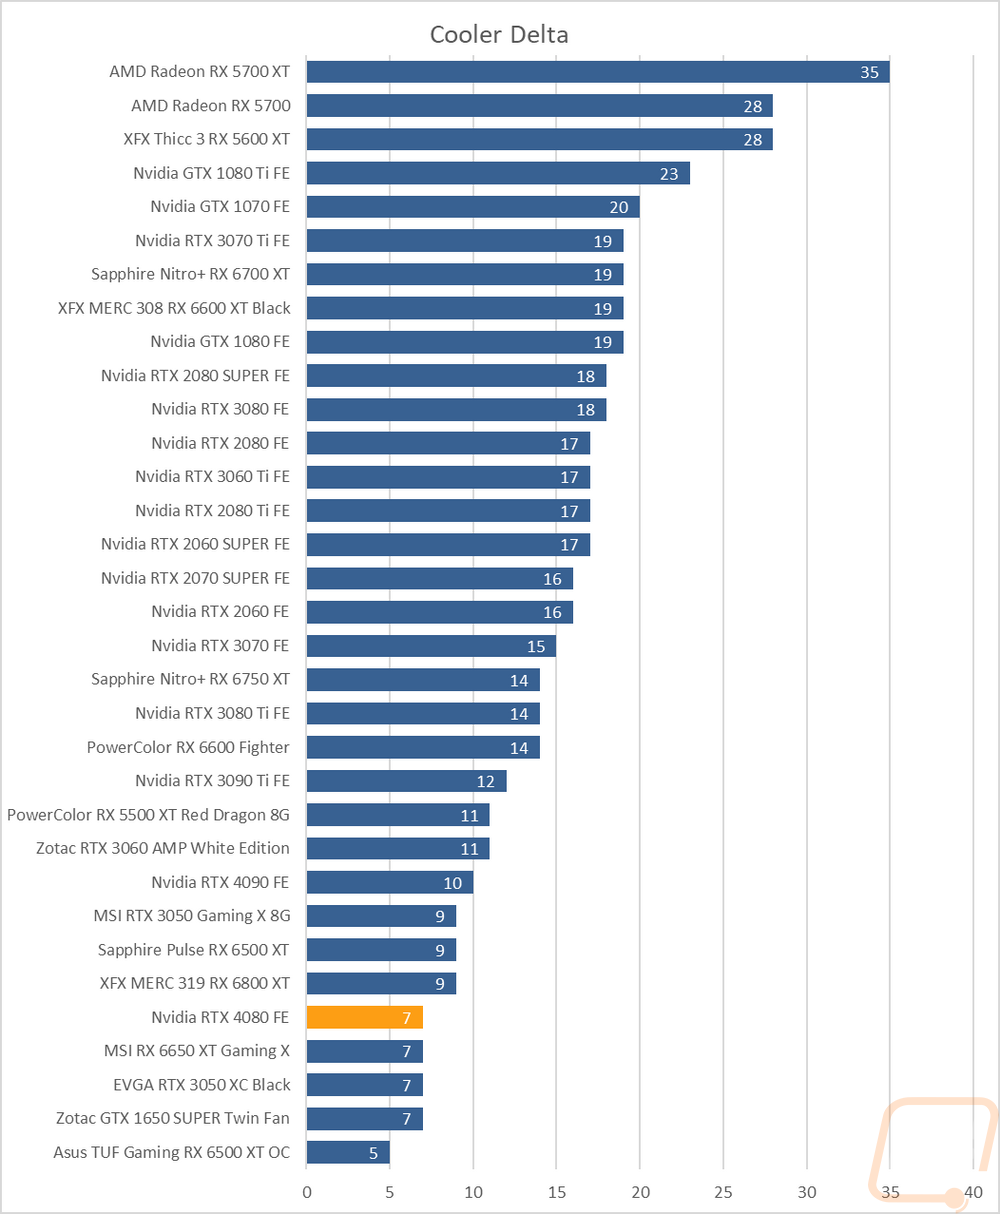
To finish up my testing I of course had to check out the cooling performance. To do this I ran two different tests. I used AIDA64’s Stress Test run for a half-hour each to warm things up. Then I documented what temperature the GPU leveled out at with the stock fan profile and then again with the fans cranked up to 100%. With the stock profile, the RTX 4080 Founders Edition leveled off at 62 degrees which was 15 degrees lower than the RTX 4090 Founders Edition and 12 lower than the 3080 Ti FE that it replaces as well. When doing this test I did also keep an eye on the GPU hotspot which was warmer at 76c. Then with the fans cranked up, the RTX 4080 Founders Edition ran even cooler at 55c, 12c less than the 4090, and 5c lower than the 3080 Ti FE. The RTX 4080 Founders Edition which ran surprisingly cool with the stock fan profile didn’t improve too much with the fans cranked all the way up with the delta being near the bottom of the chart at a 7c difference.
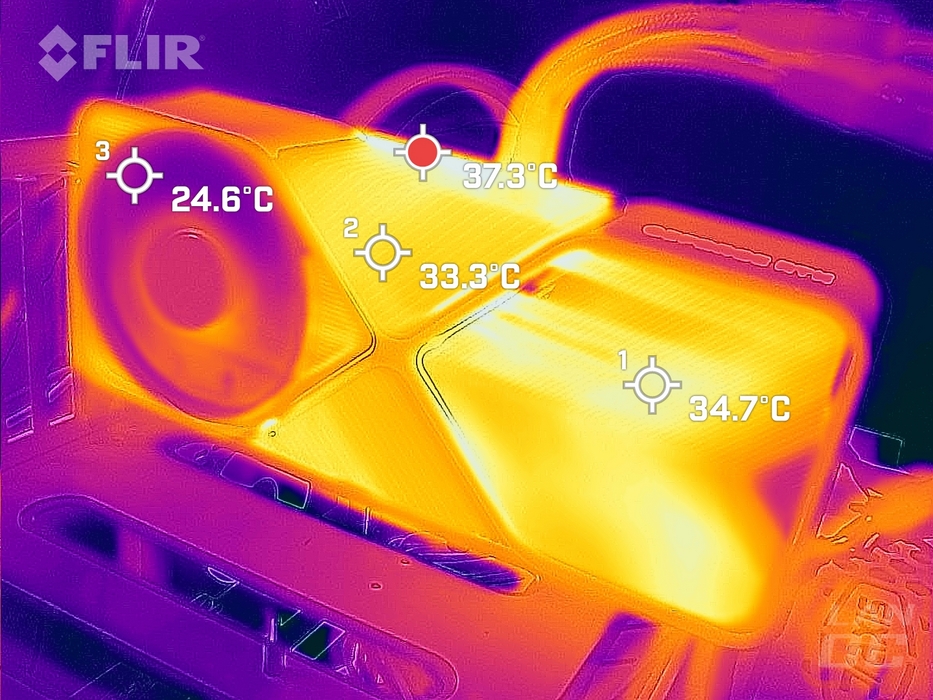
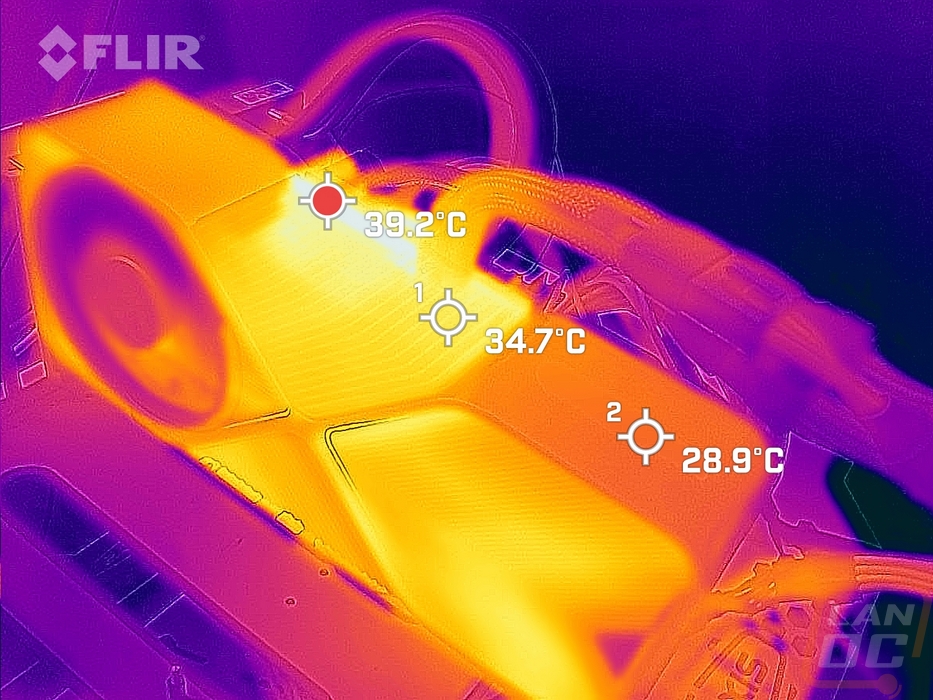
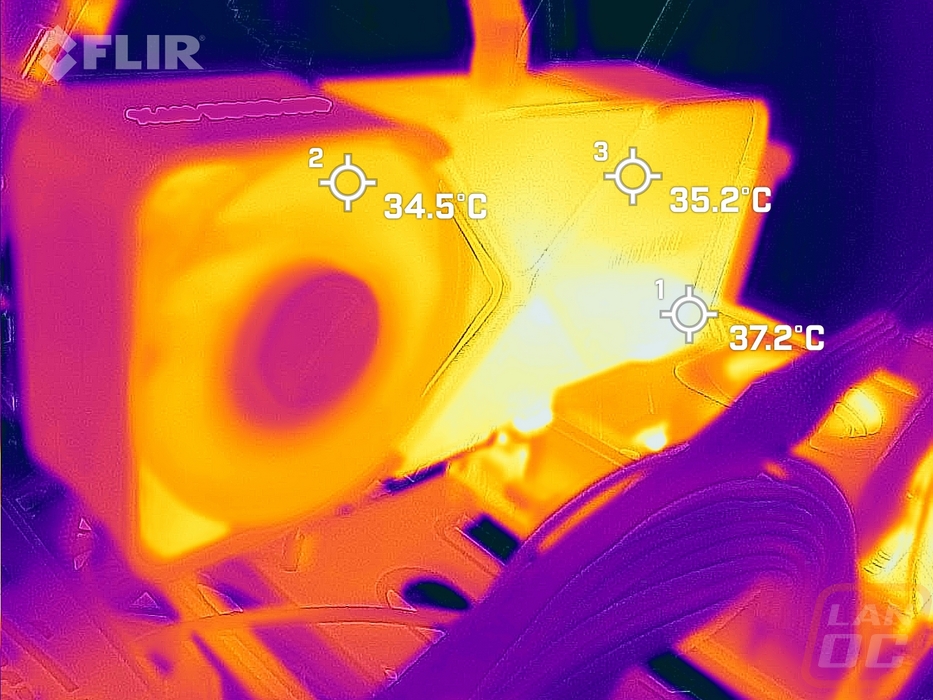
While running the stock fan profile testing I also took the time to get a few thermal images so we could see what is going on. The hottest spot from the left side profile is right at the top edge closest to the PCB but you can also see warm areas in the blow-through end of the heatsink. The top-down angle shows the PCB area being the hottest again. Then on the back, the hotspot was actually on the motherboard showing that while warm, the RTX 4080 Founders Edition wasn’t even the hottest part of the system when only putting a load on the GPU. That back view does show a slightly warmer area on the backplate in the bottom right. Because of the 4090 plug issues I was also keeping an eye in the plug area and you can see the cables getting warmer from the air being blown on them, but the cables and even the plug area weren’t too hot at all.
Overall and Final Verdict
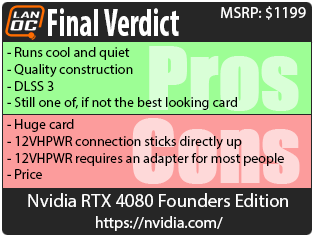
With all of our testing out of the way and having taken a closer look at the card Nvidia’s RTX 4080, Founders Edition shows once again just how capable their new Ada architecture is. The RTX 4080 Founders Edition consistently came in second across our charts behind the RTX 4090 while having 40% fewer CUDA cores. This shows just how ludicrous the RTX 4090 is, but it is also impressive that with that 40% drop the performance was only 25% less. The RTX 4080 Founders Edition has the same cooler design as the RTX 4090 Founders Edition which does mean that it has the same huge card size, but this also translated to surprisingly good cooling performance. On top of that, the RTX 4080 Founders Edition was quiet, especially when under load. The Founders Edition all metal construction is there as always and I still think this is the best looking card design on the market.
For performance, the RTX 4080 Founders Edition dwarfed the 3000 Series cards including the RTX 3090 Ti beating it by 16% in game and even more in tests like 3DMark and putting an even bigger lead on the RTX 3080 and 3080 Ti which is what the RTX 4080 is replacing. That is all before we even figure in DLSS 3 performance which while only available in 10 games offers an impressive way to increase performance, especially in CPU-limited situations like Microsoft Flight Simulator. As far as downsides to the RTX 4080 Founders Edition, like with the RTX 4090 Founders Edition, the large card size is going to make things tough to fit in a lot of cases. But having the new 12VHPWR connection facing directly up on top adds to that, especially considering most people will have to run the included adapter until more power supplies that come with the cable are available.
For pricing the RTX 4080 Founders Edition has an MSRP of $1199 which matches the launch price of the RTX 3080 Ti which dropped in the middle of the crazy GPU pricing. With that settling down now, the $1199 price does come off as expensive especially when we compare it with the launch price of the original RTX 3080 of $699. Given just how crazy the performance of the RTX 4090 was, the RTX 4080 does offer still very capable high-end 4k performance at a lower price. So while I wouldn’t consider it to be a value, the RTX 4080 Founders Edition does have impressive performance and right now at least is the cheapest way to buy into DLSS 3 as well.

Live Pricing: HERE


