In-Game Benchmarks
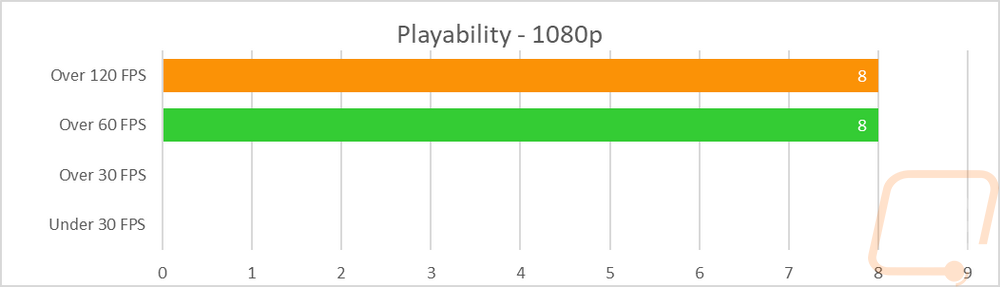
Now we finally get into the in game performance and that is the main reason people pick up a new video card. To test things out I ran through our new benchmark suite that tests 9 games at three different resolutions (1080p, 1440p, and 4k). Most of the games tested have been run at the highest detail setting and a mid-range detail setting to get a look at how turning things up hurts performance and to give an idea of if turning detail down from max will be beneficial for frame rates. In total, each video card is tested 48 times and that makes for a huge mess of results when you put them all together. To help with that I like to start with these overall playability graphs that take all of the results and give an easier to read result. I have one for each of the three resolutions and each is broken up into four FPS ranges. Under 30 FPS is considered unplayable, over 30 is playable but not ideal, over 60 is the sweet spot, and then over 120 FPS is for high refresh rate monitors.
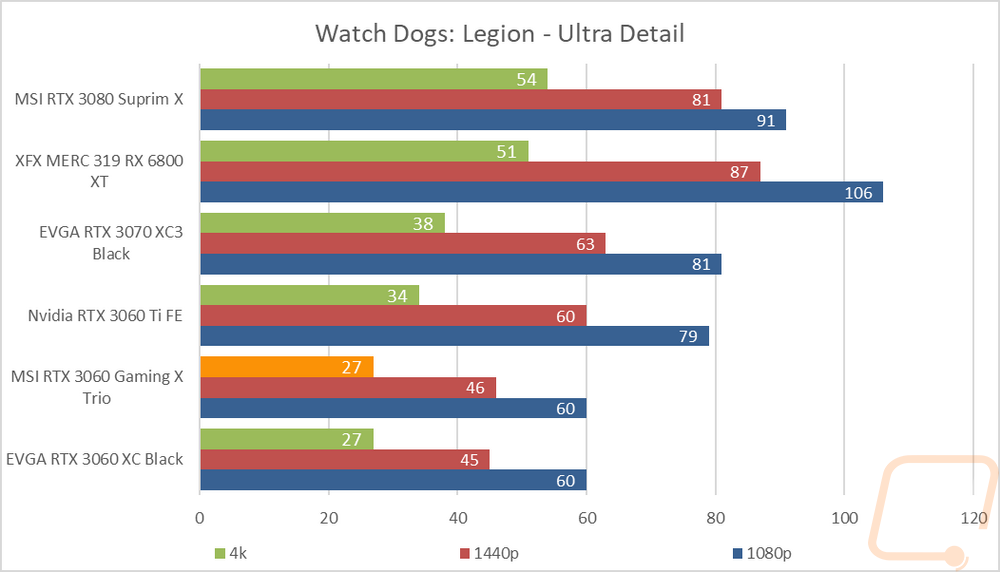
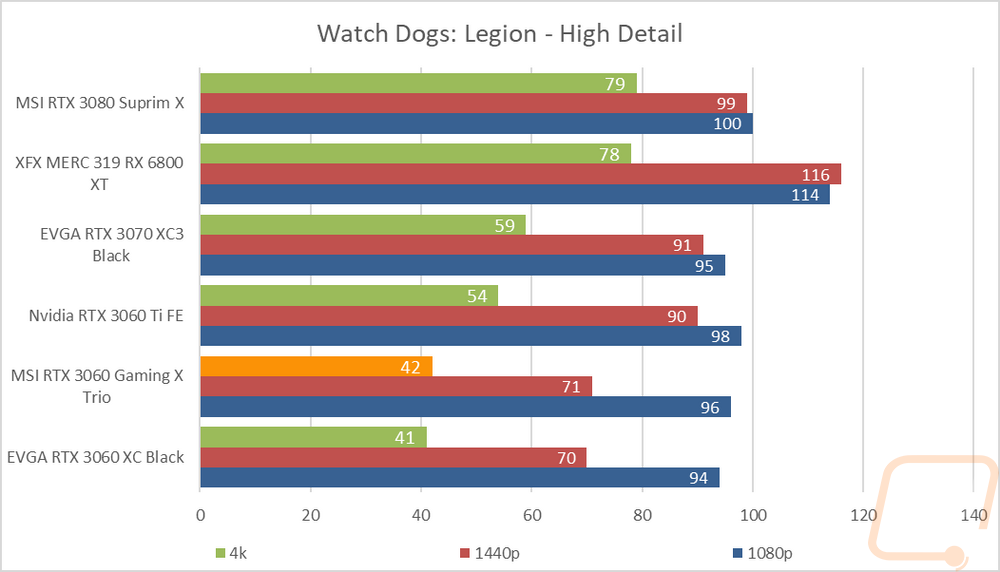
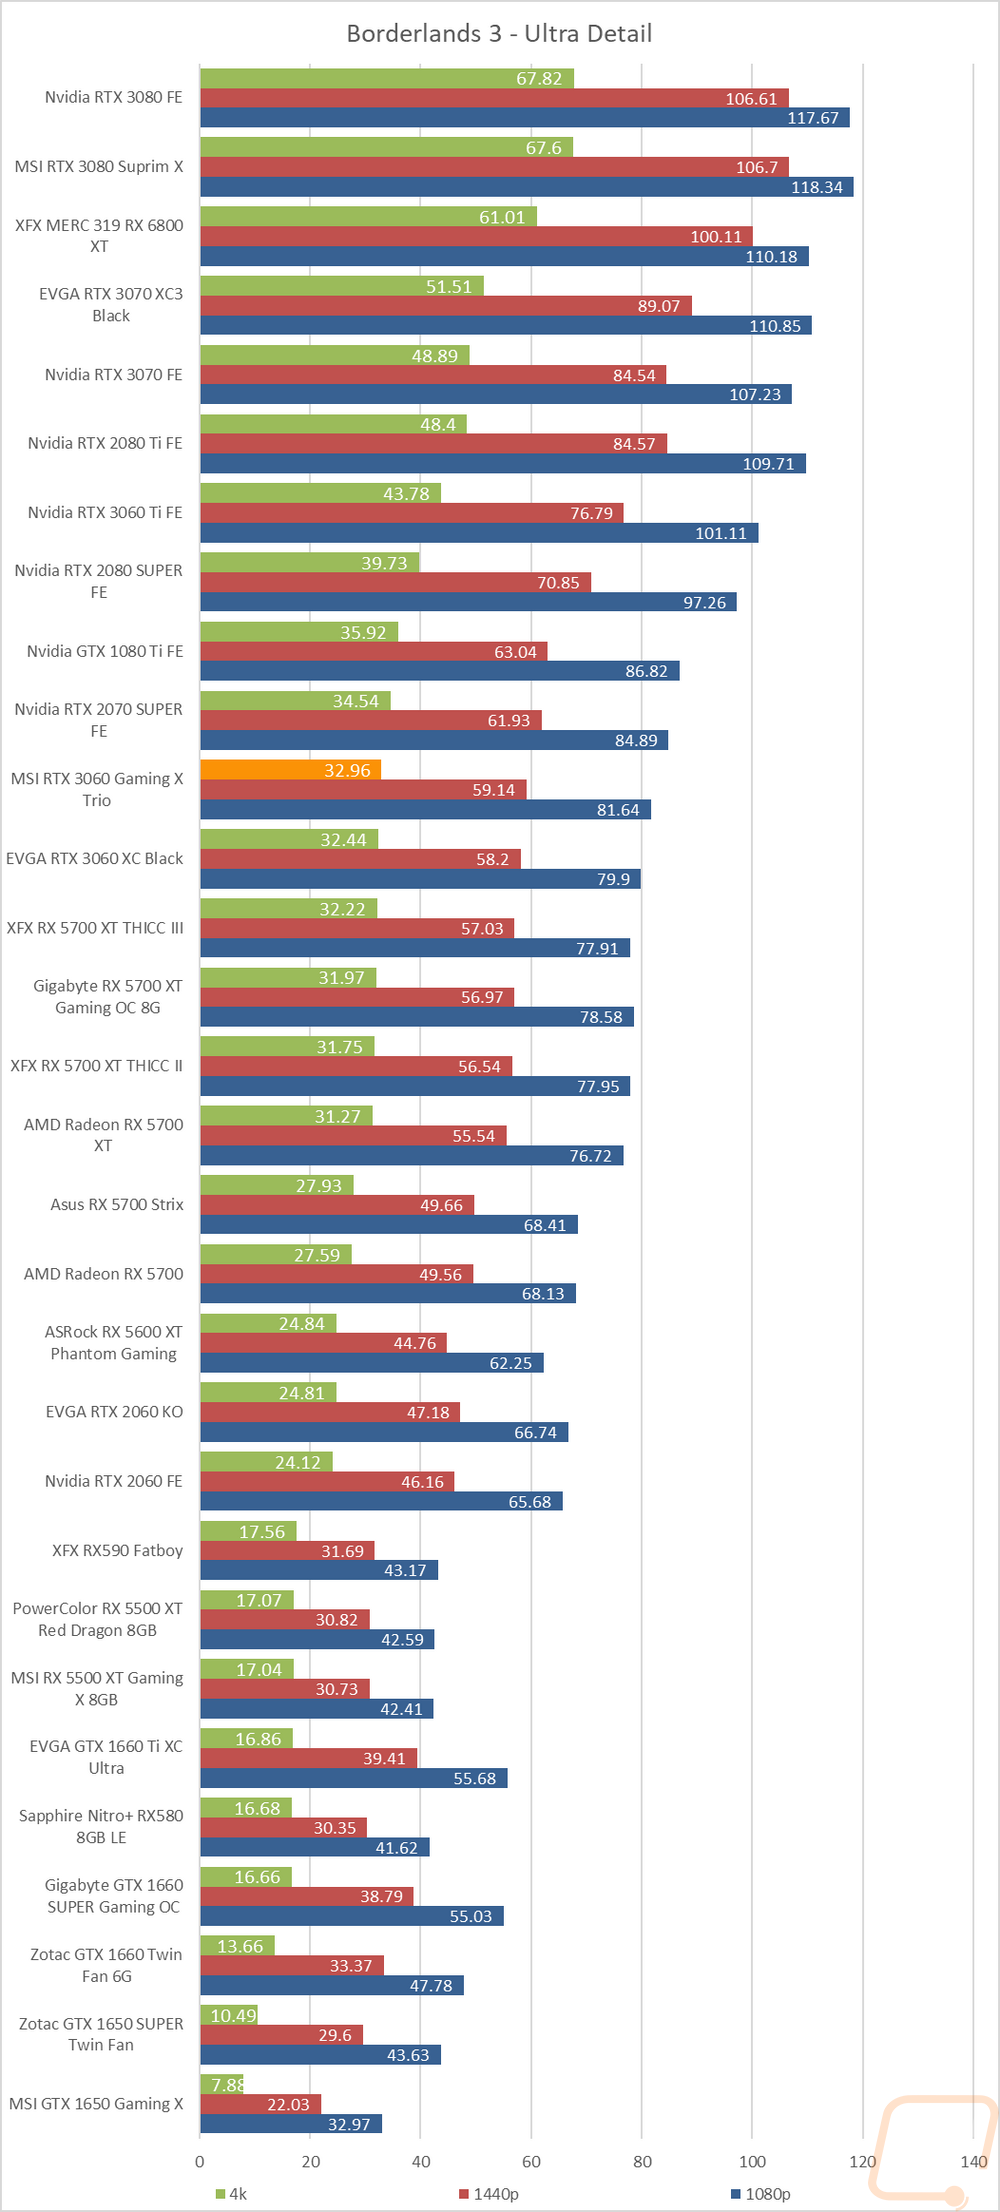
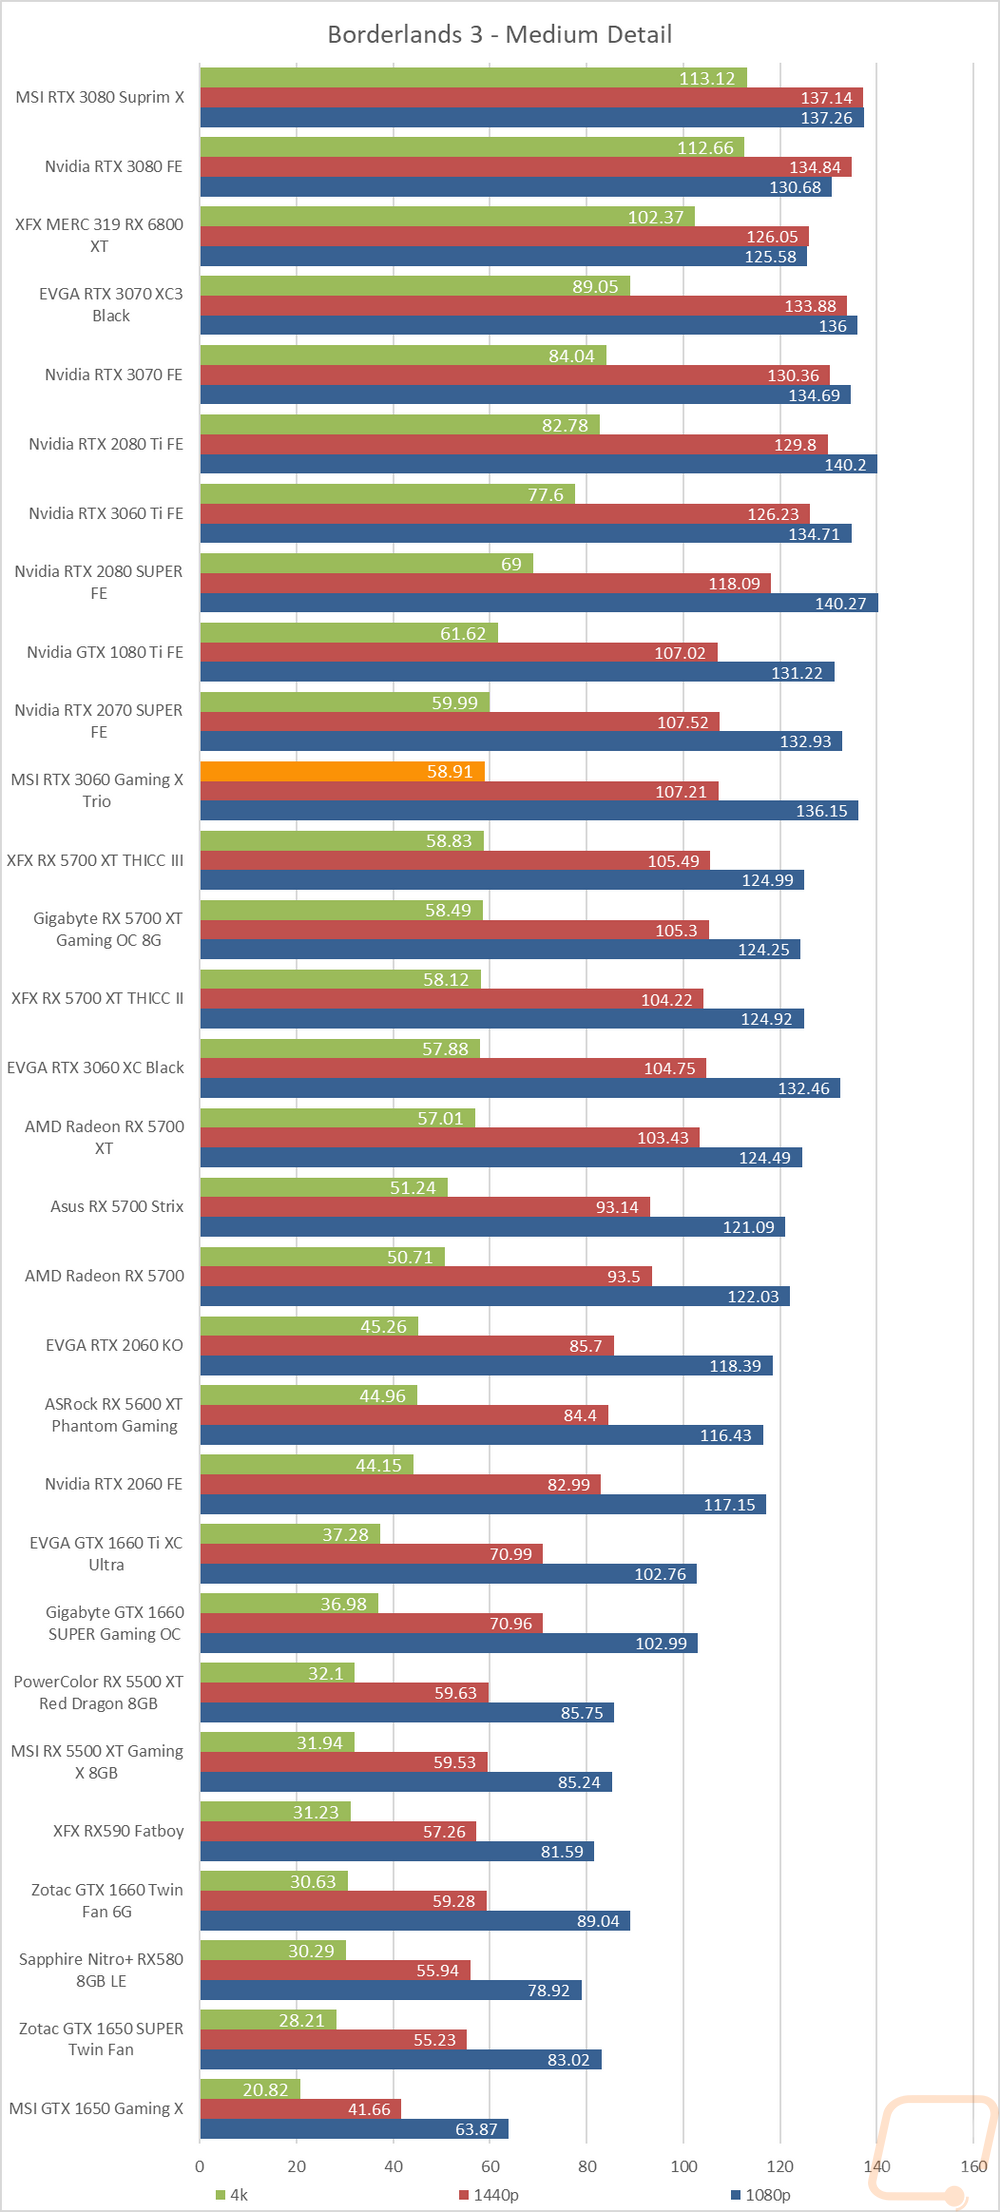
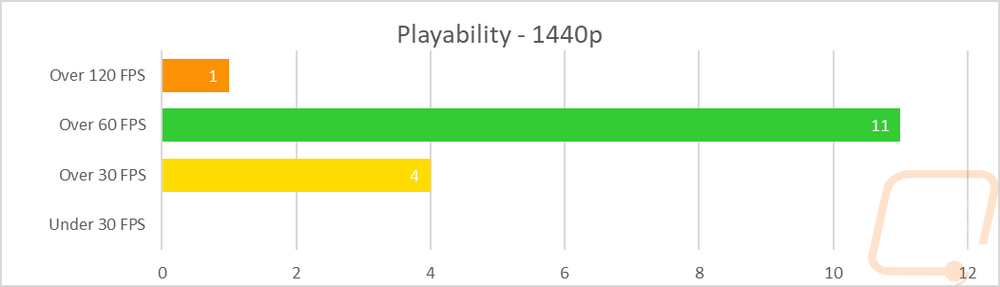
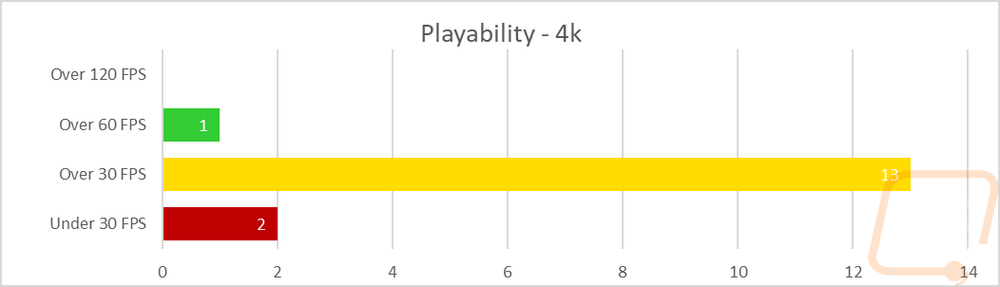
So how did the RTX 3060 Gaming X Trio perform? When compared to the stock clocked RTX 3060 I already took a look at, the overclock only made one change in these graphs. It bumped one result in the 1440p results up into the 120+ FPS range. Even still, like the stock 3060 you get amazing 1080p performance with all of the results over 60 FPS and half of those even up past 120 FPS for that buttery smooth high refresh action on even on modern higher detail games like I’ve tested. At 1440p four results are under 60 FPS (though a few are by less than a 1 FPS margin), but 11 were over 60 and one even over 120 FPS. The RTX 3060, even with 12GB of VRAM isn’t designed for 4K performance and it shows in the 4K graph. Just one result was over 60 FPS, the majority with 13 results were still playable in the 30-59 FPS range so if needed you will be able to adjust detail down to smooth things out. Then there were two I would consider unplayable at under 30 FPS.
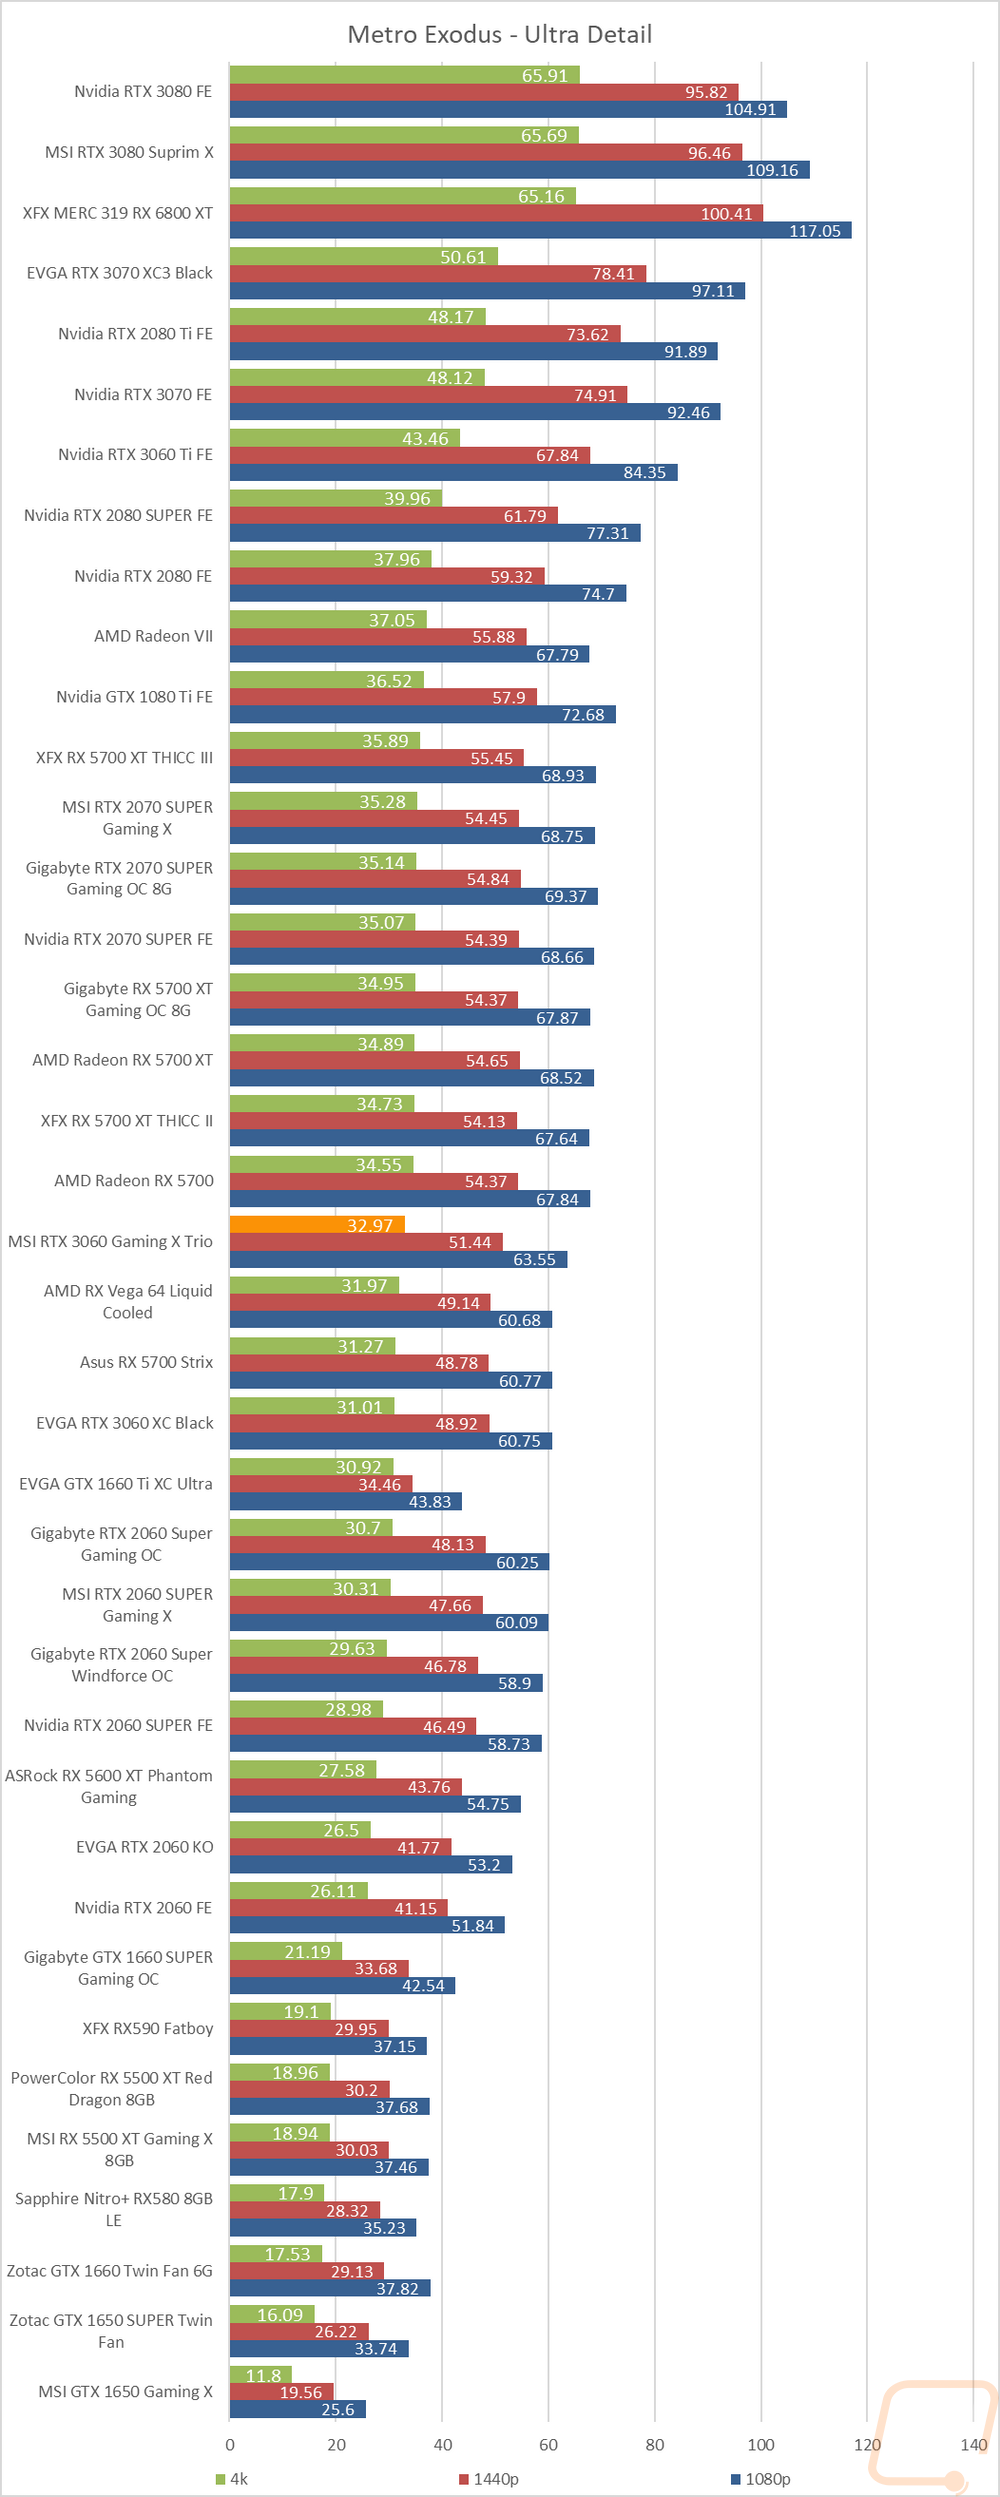
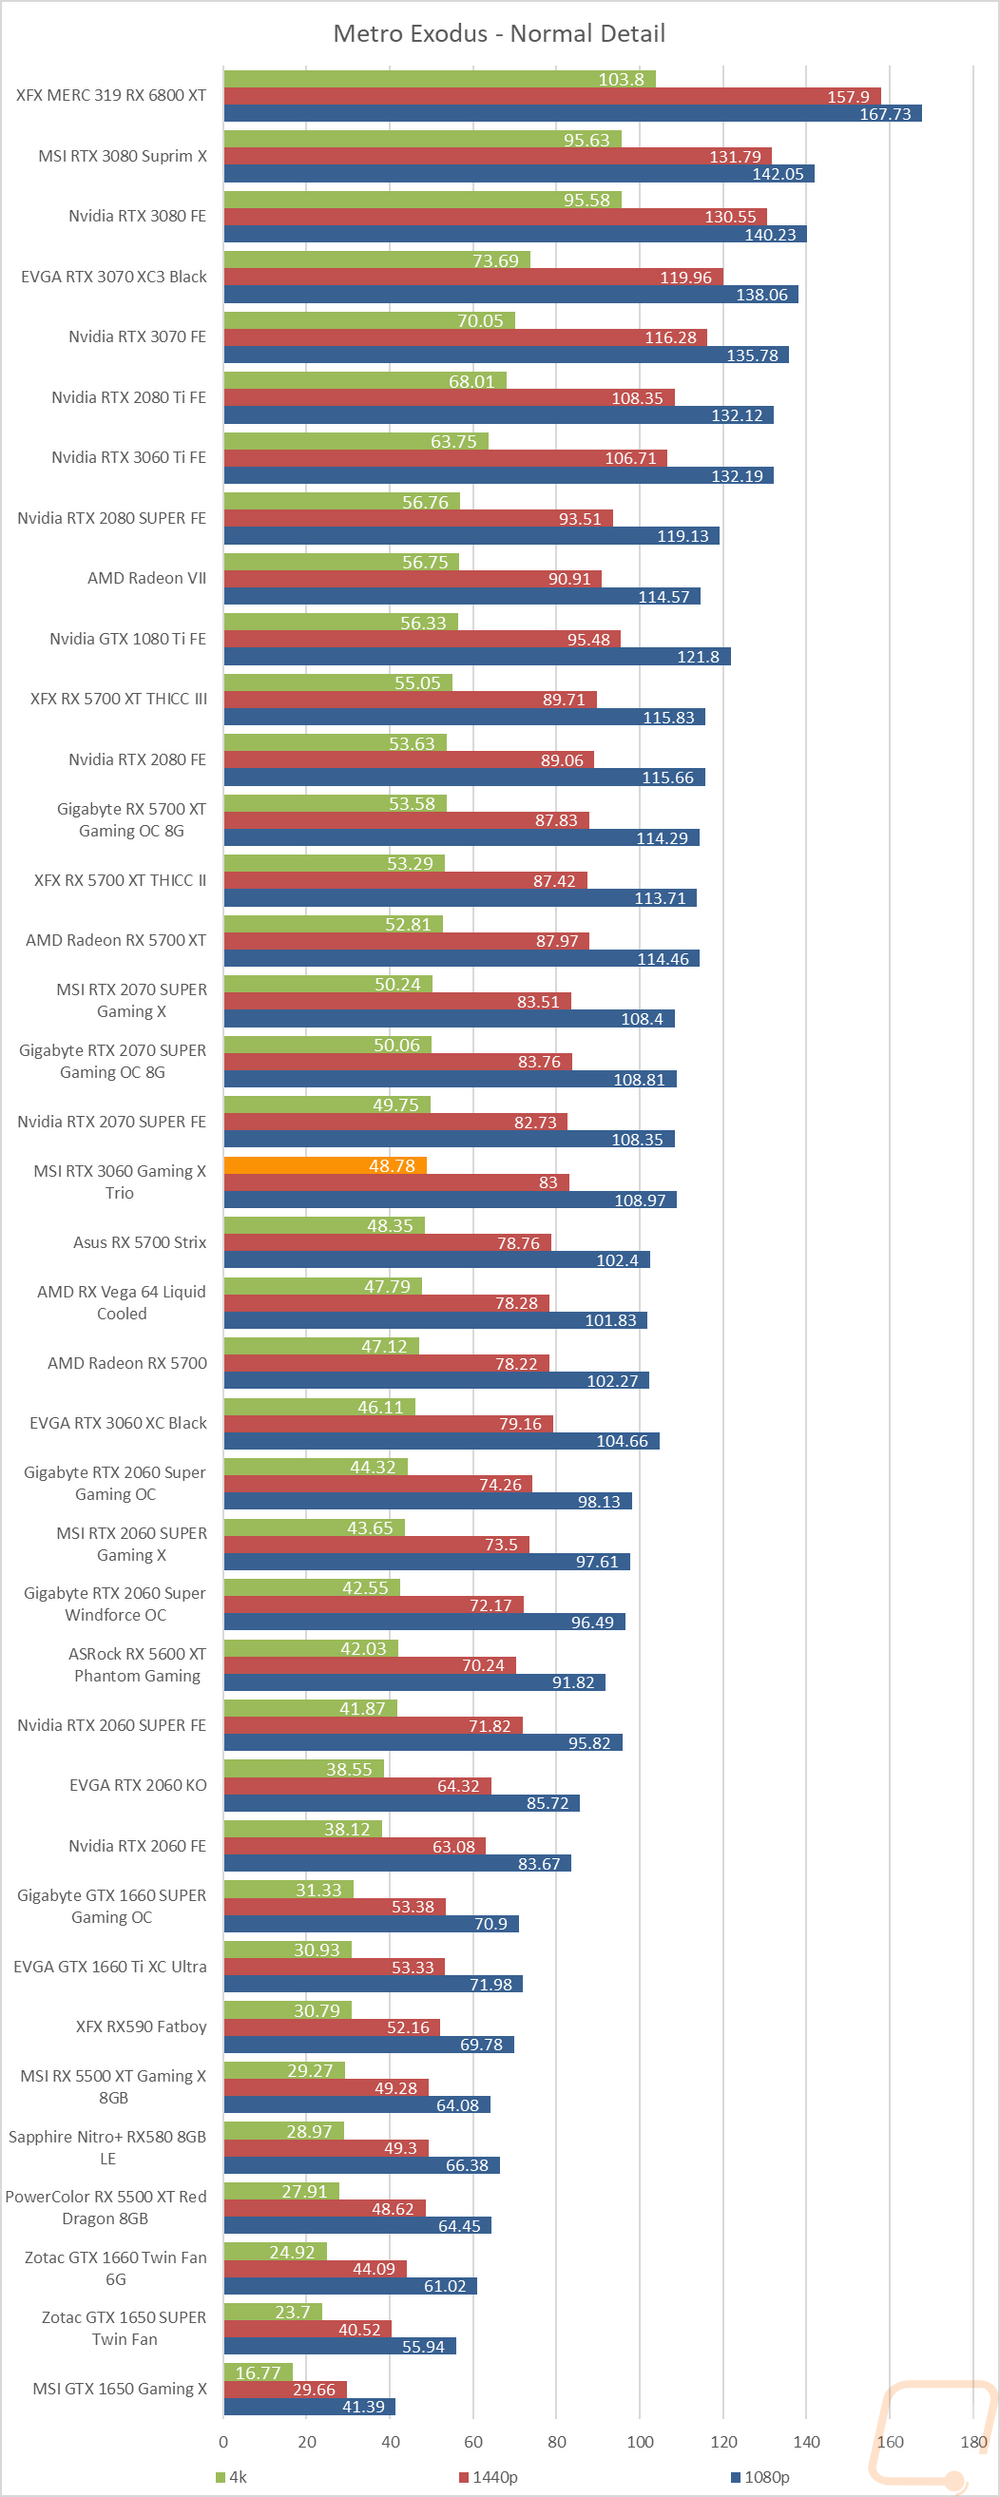
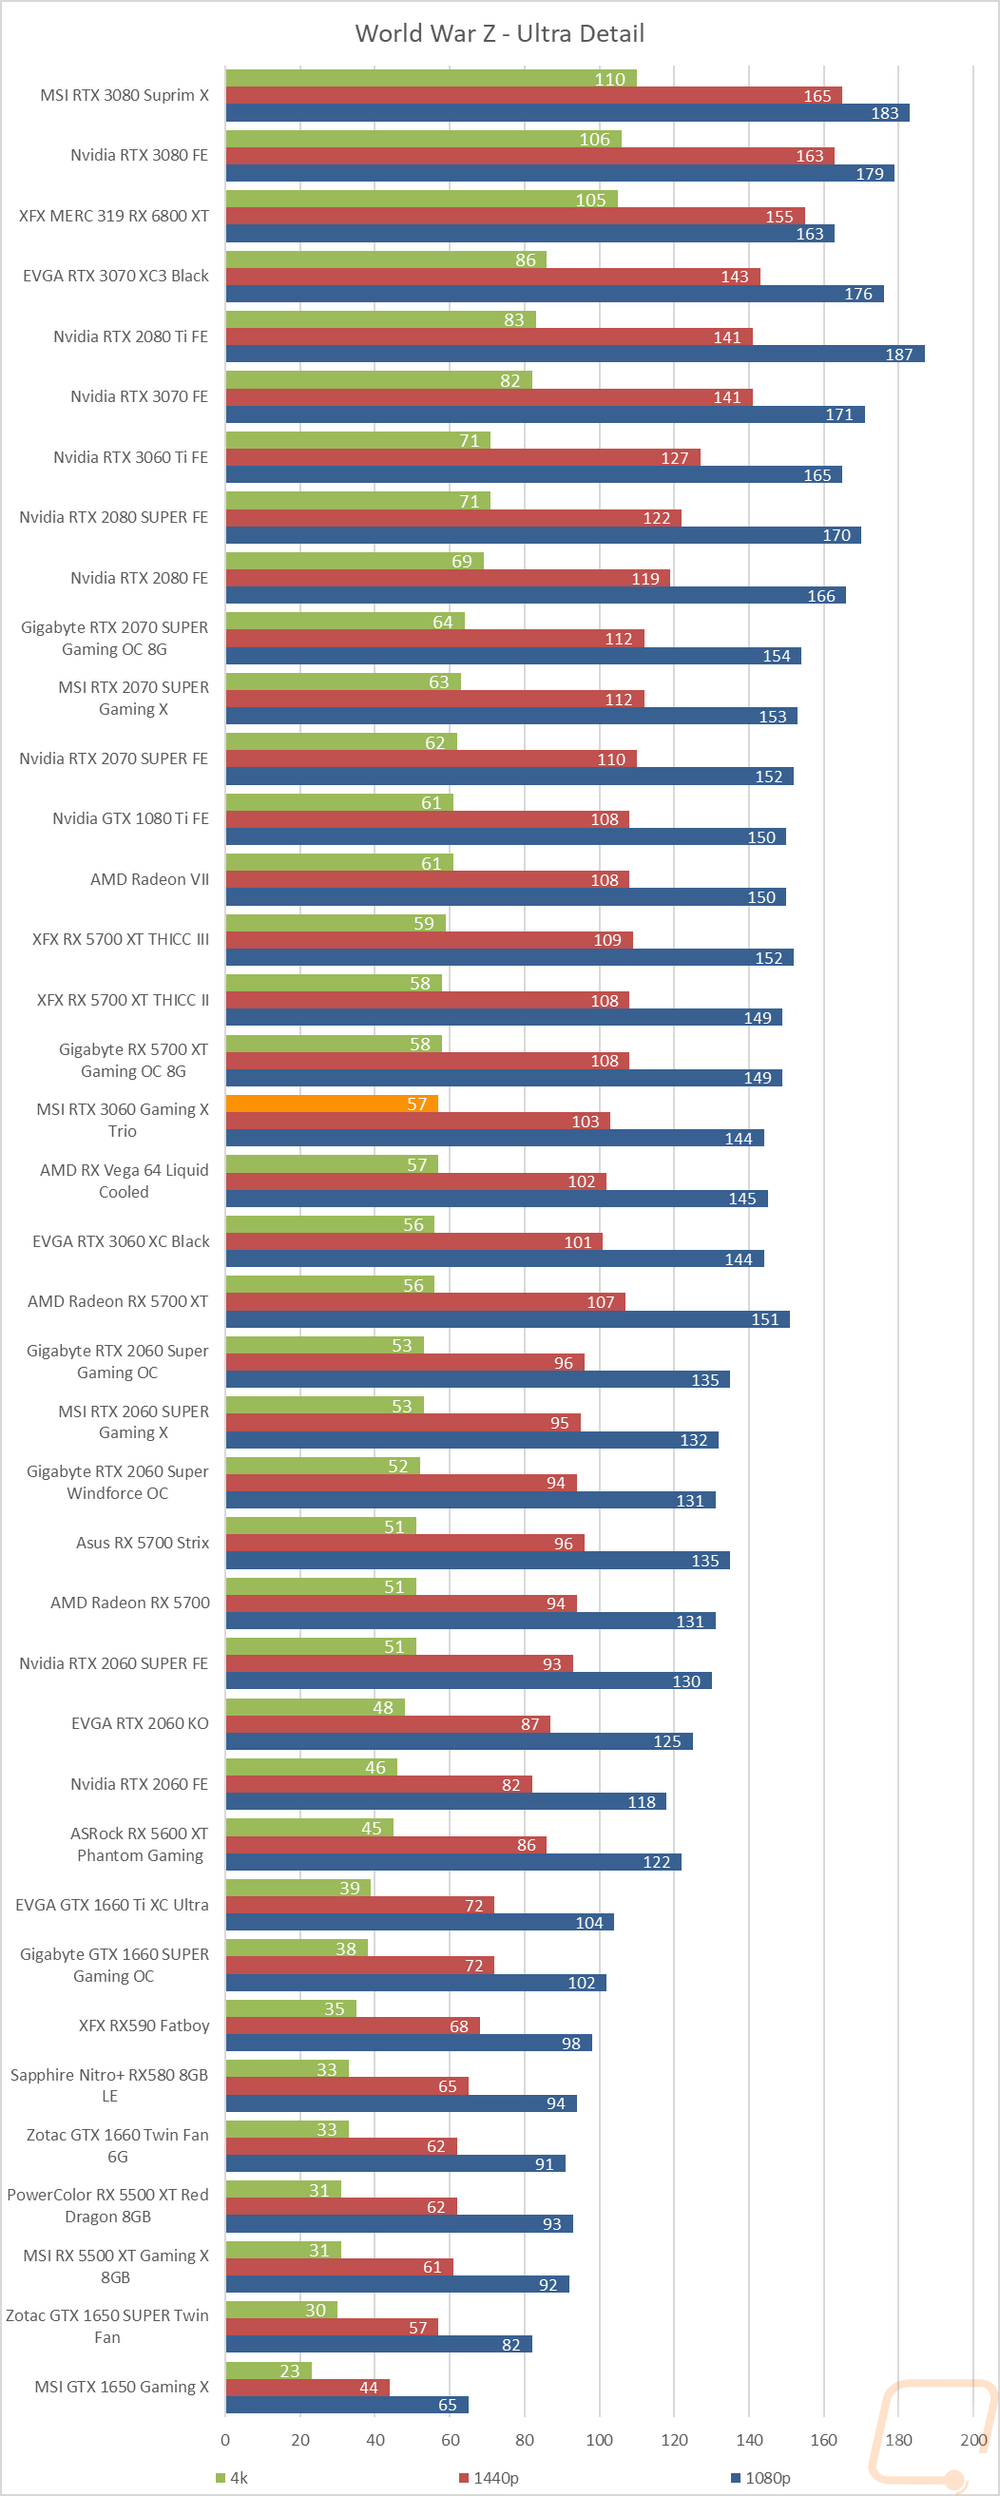
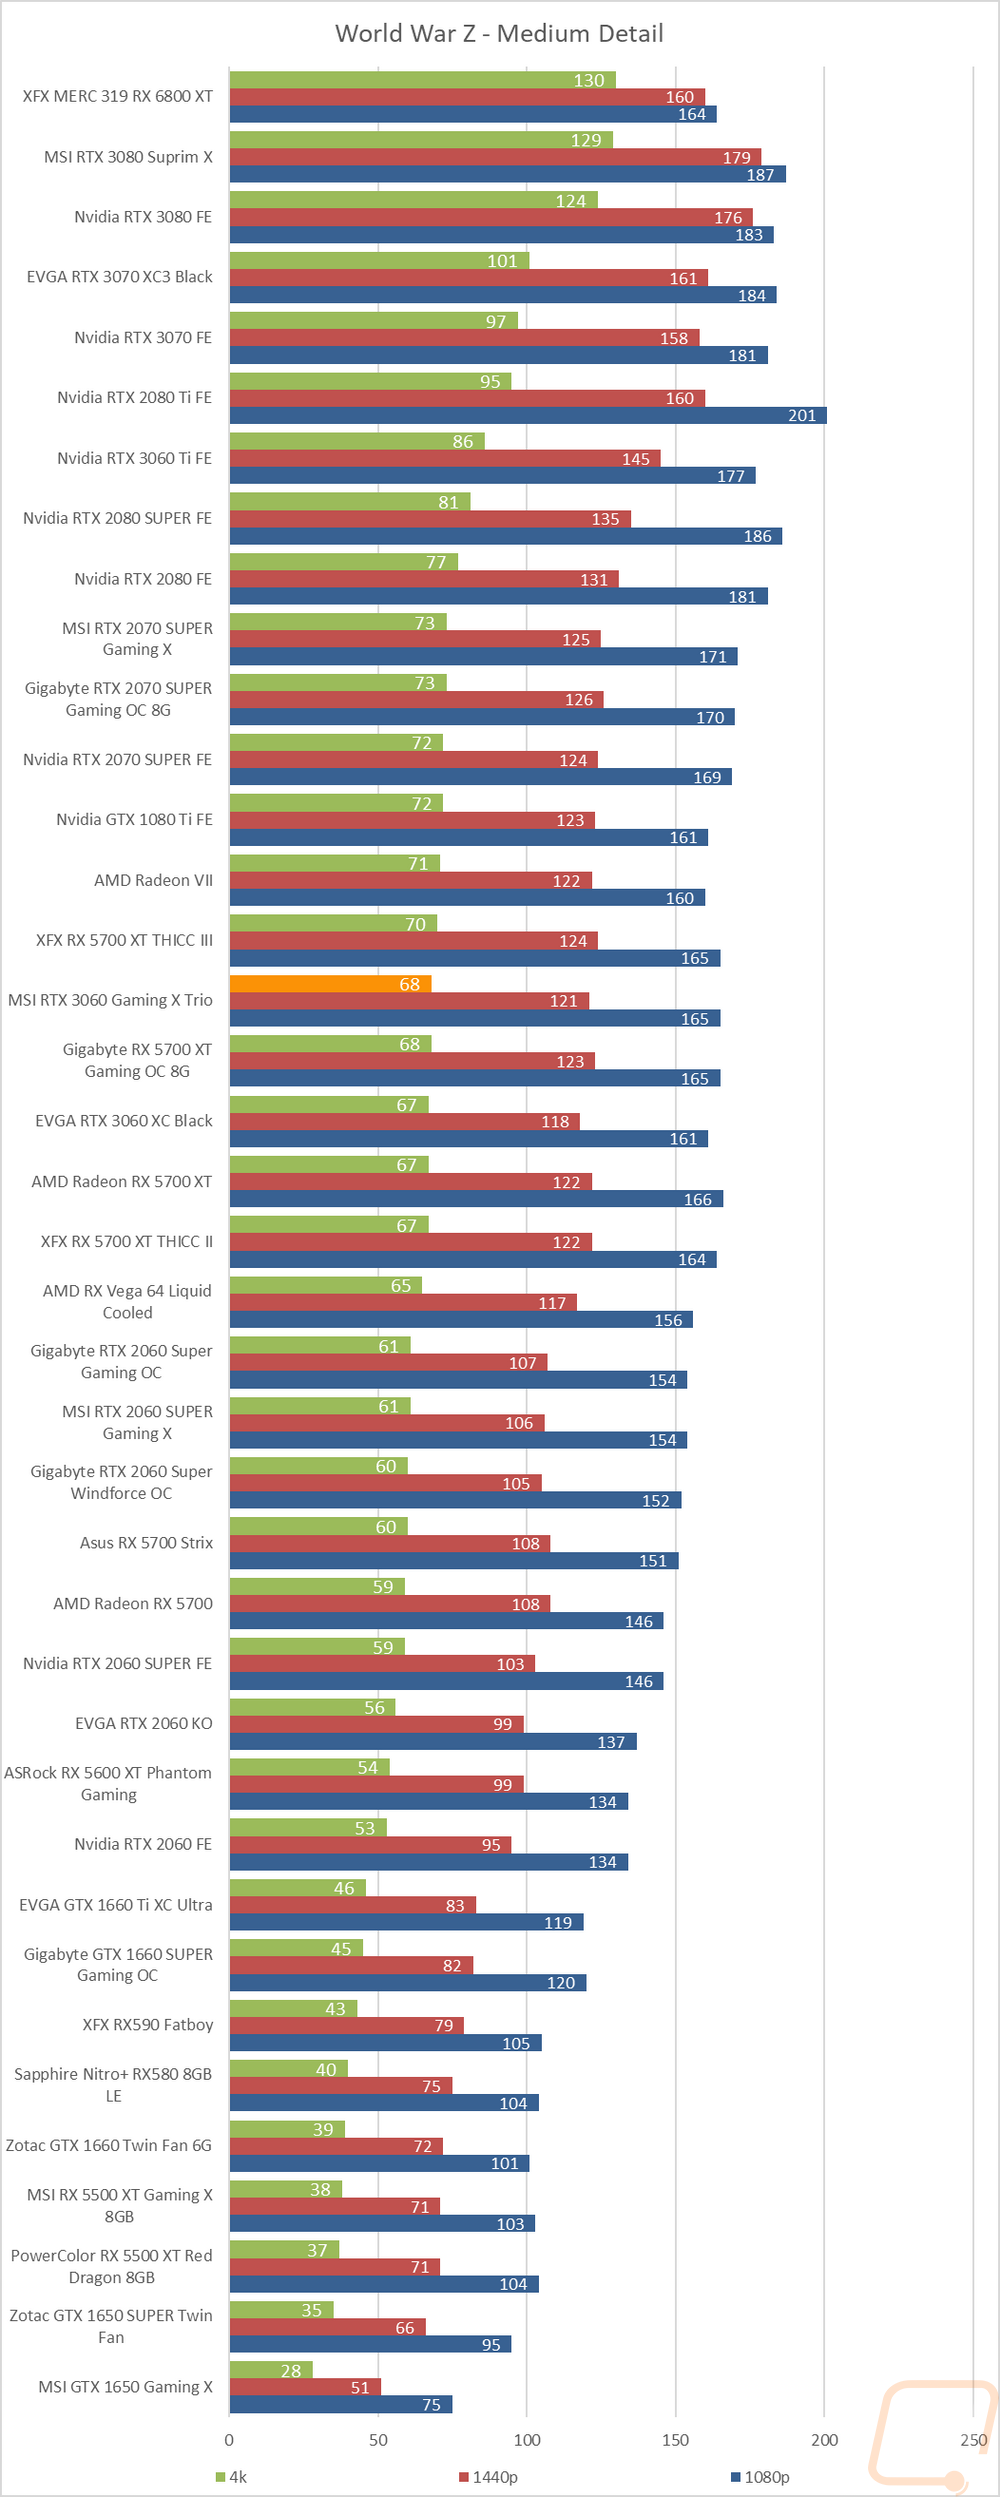
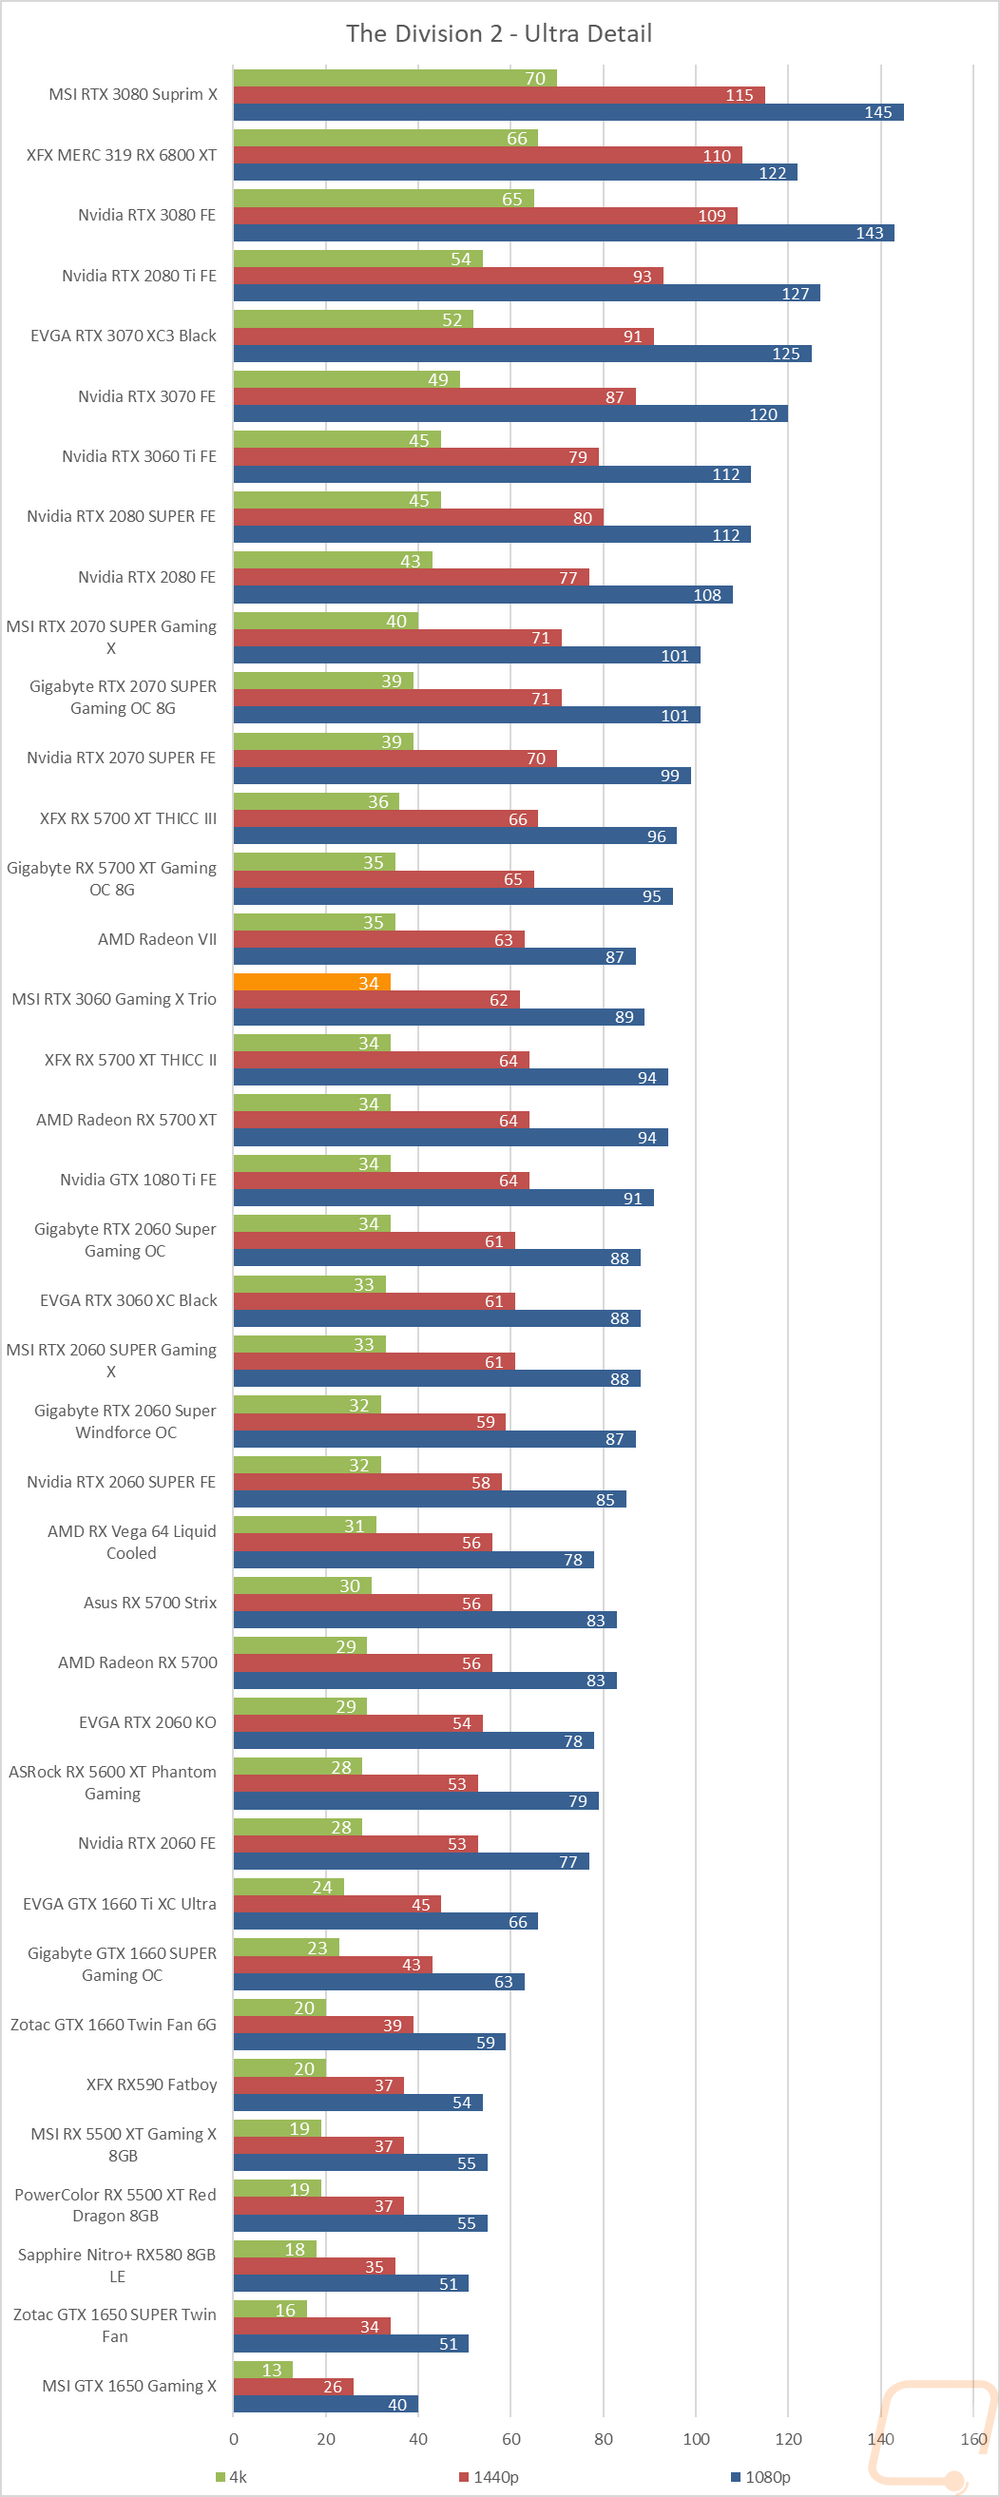
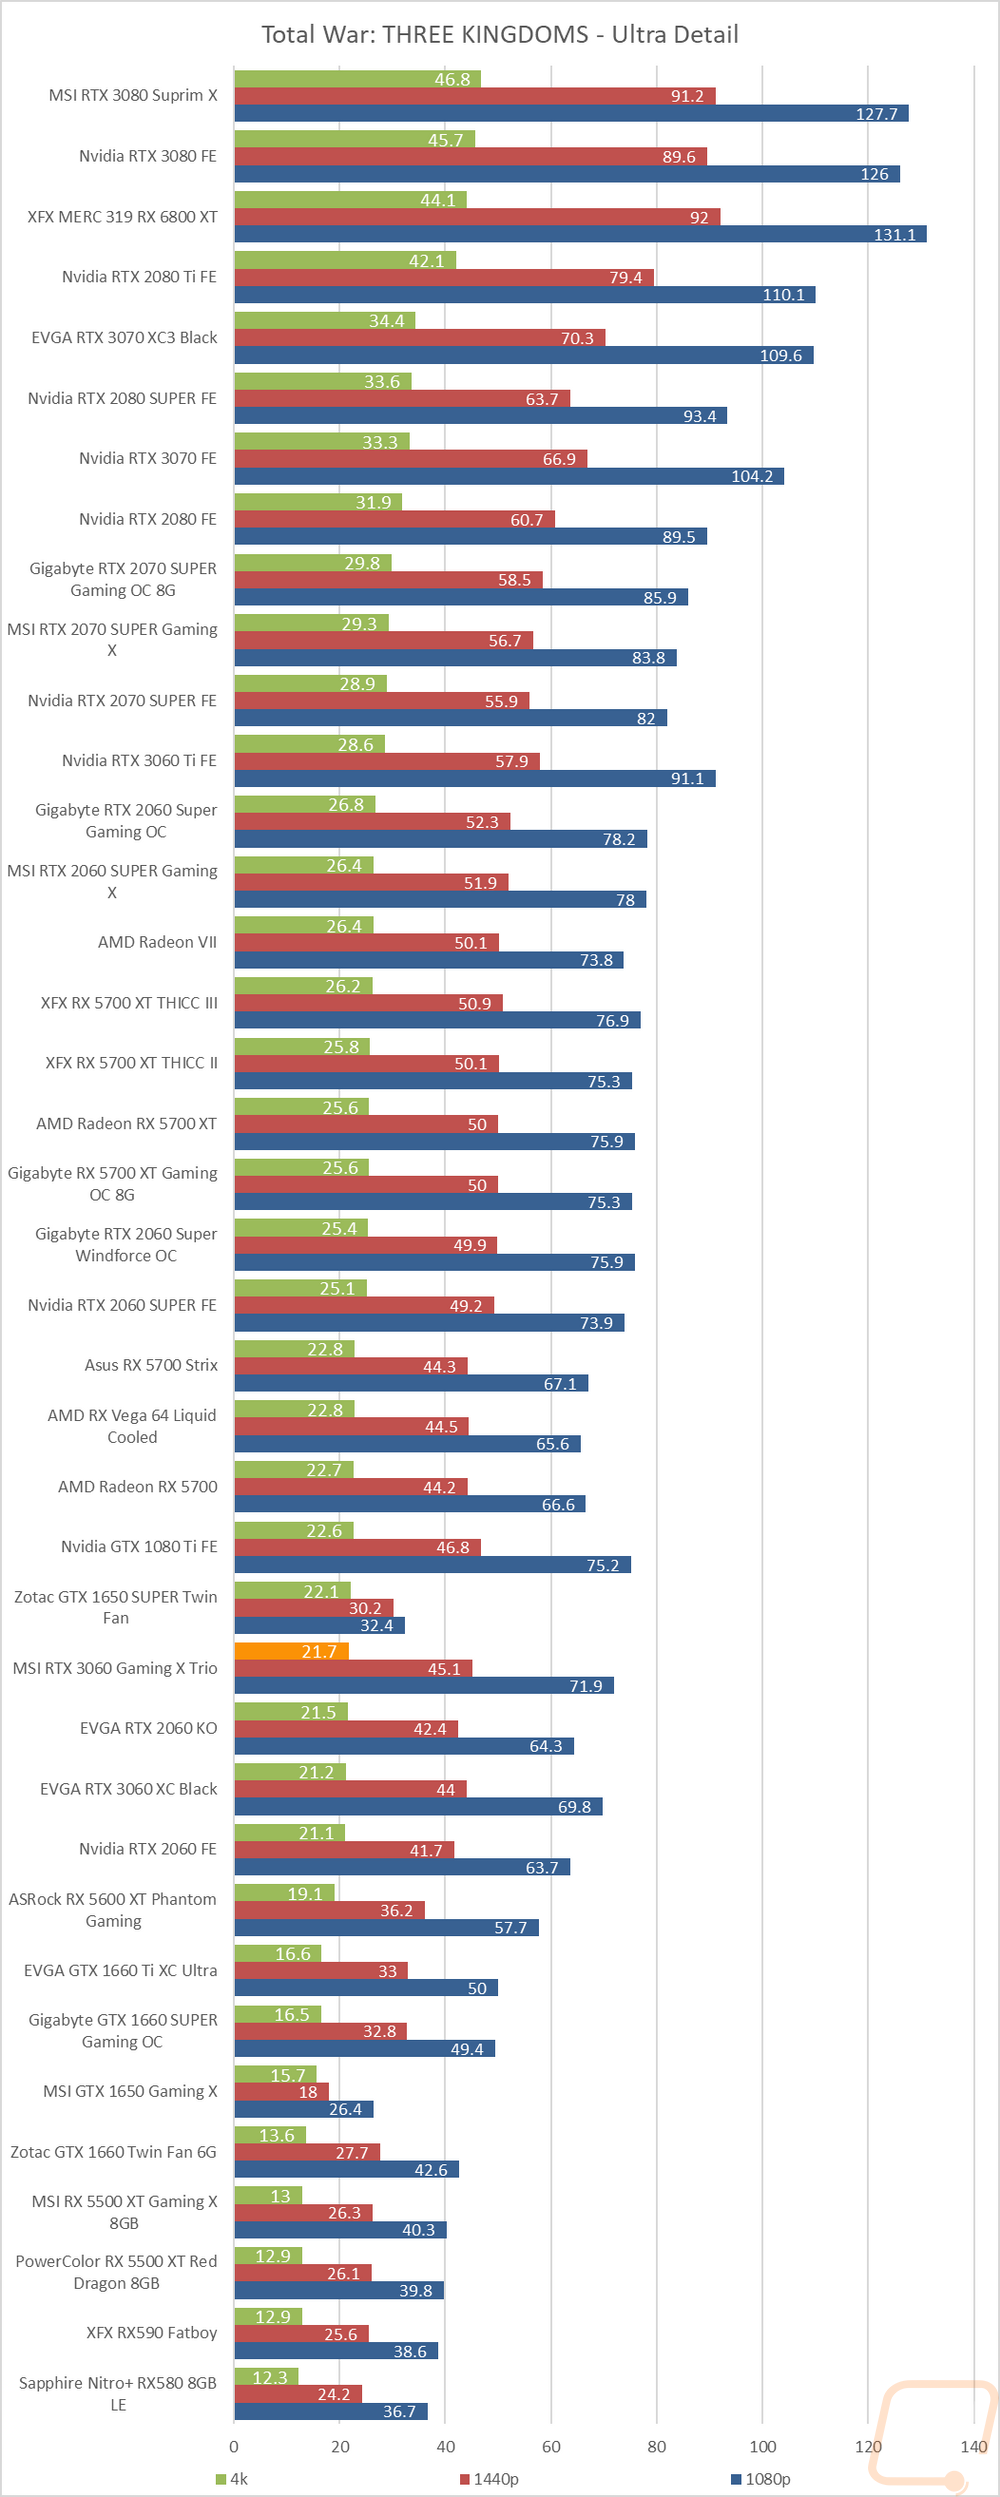
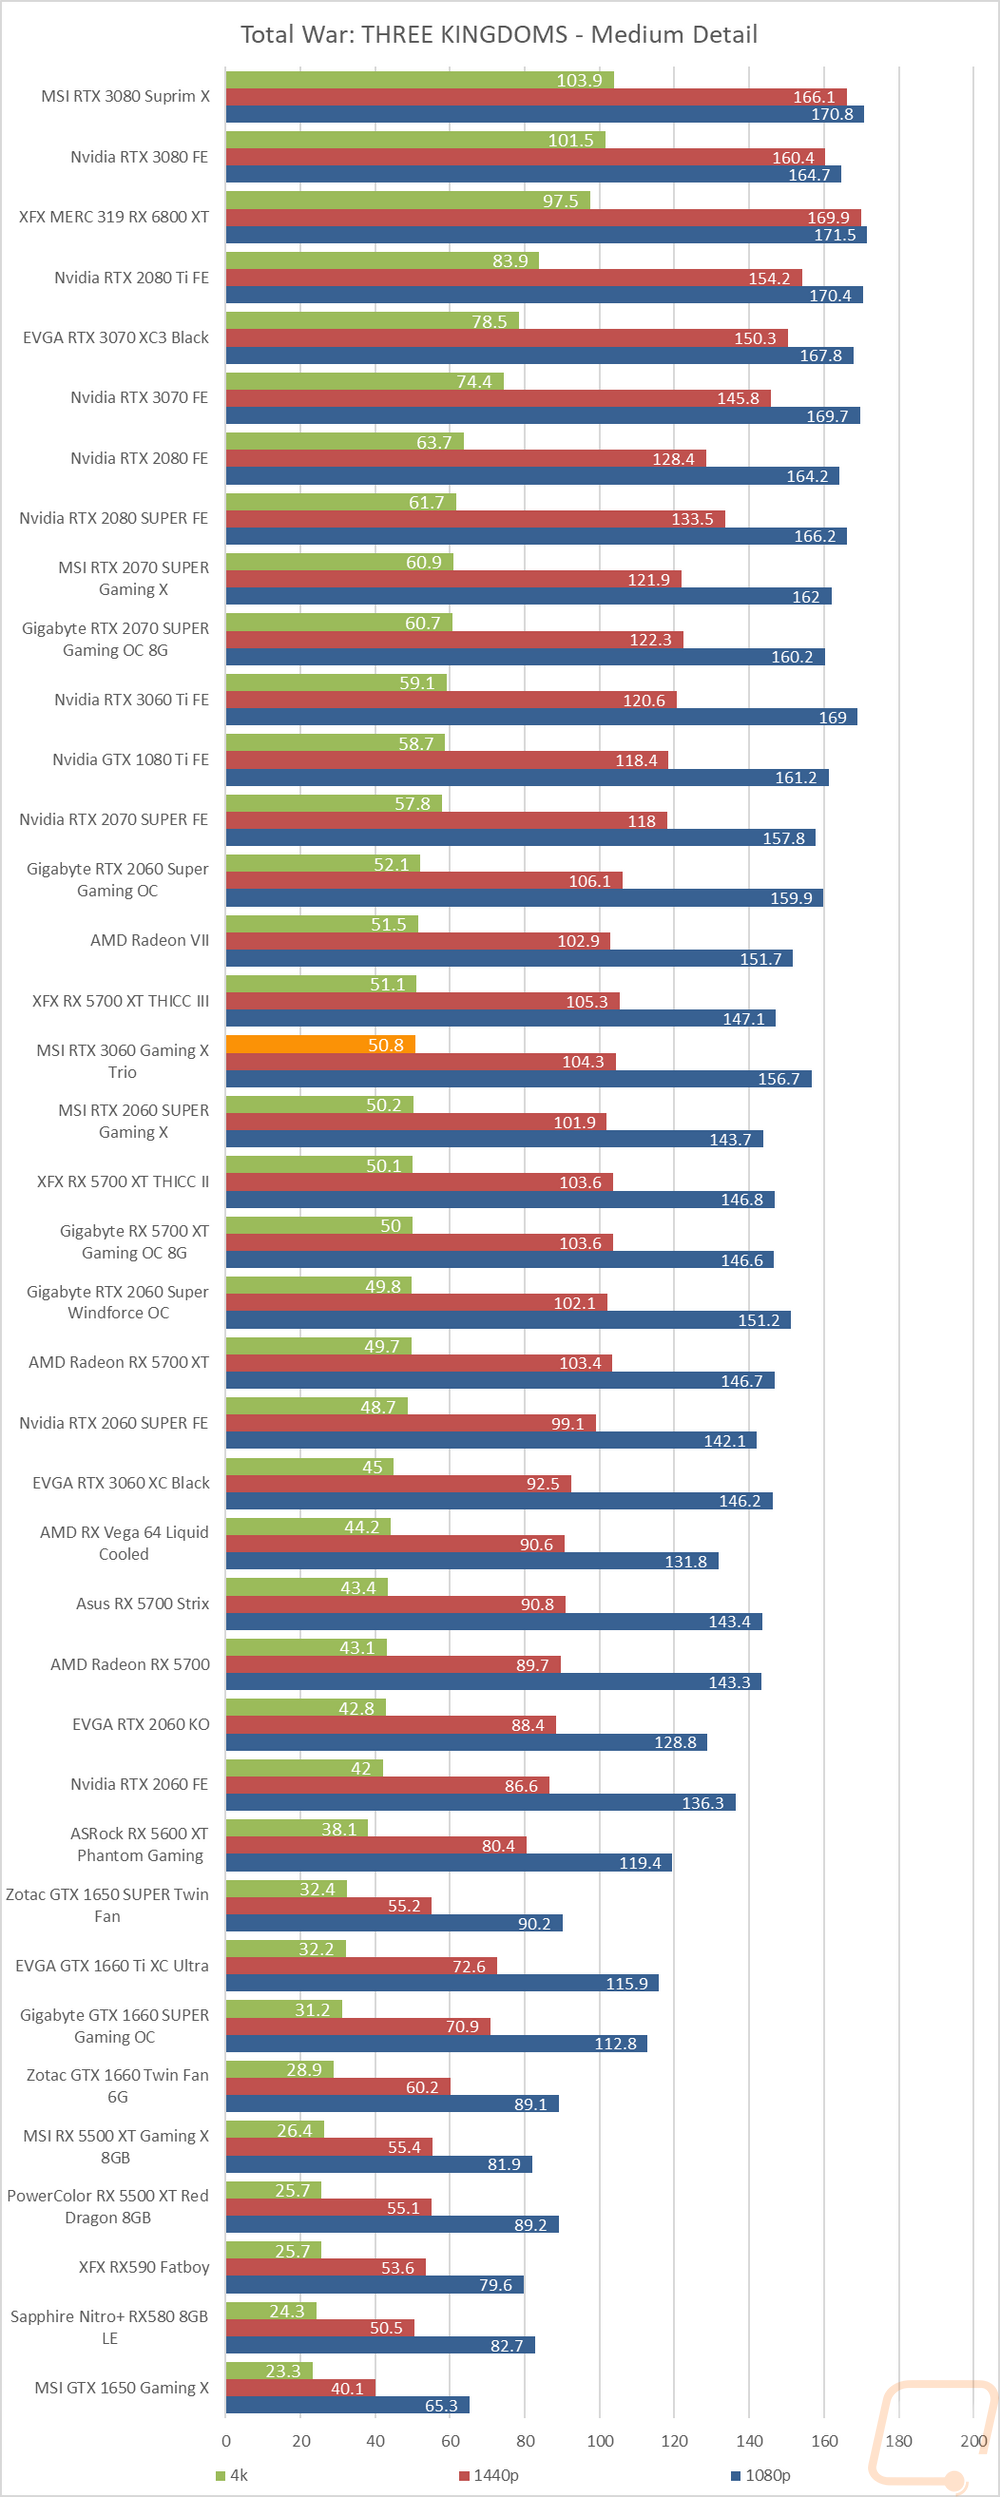
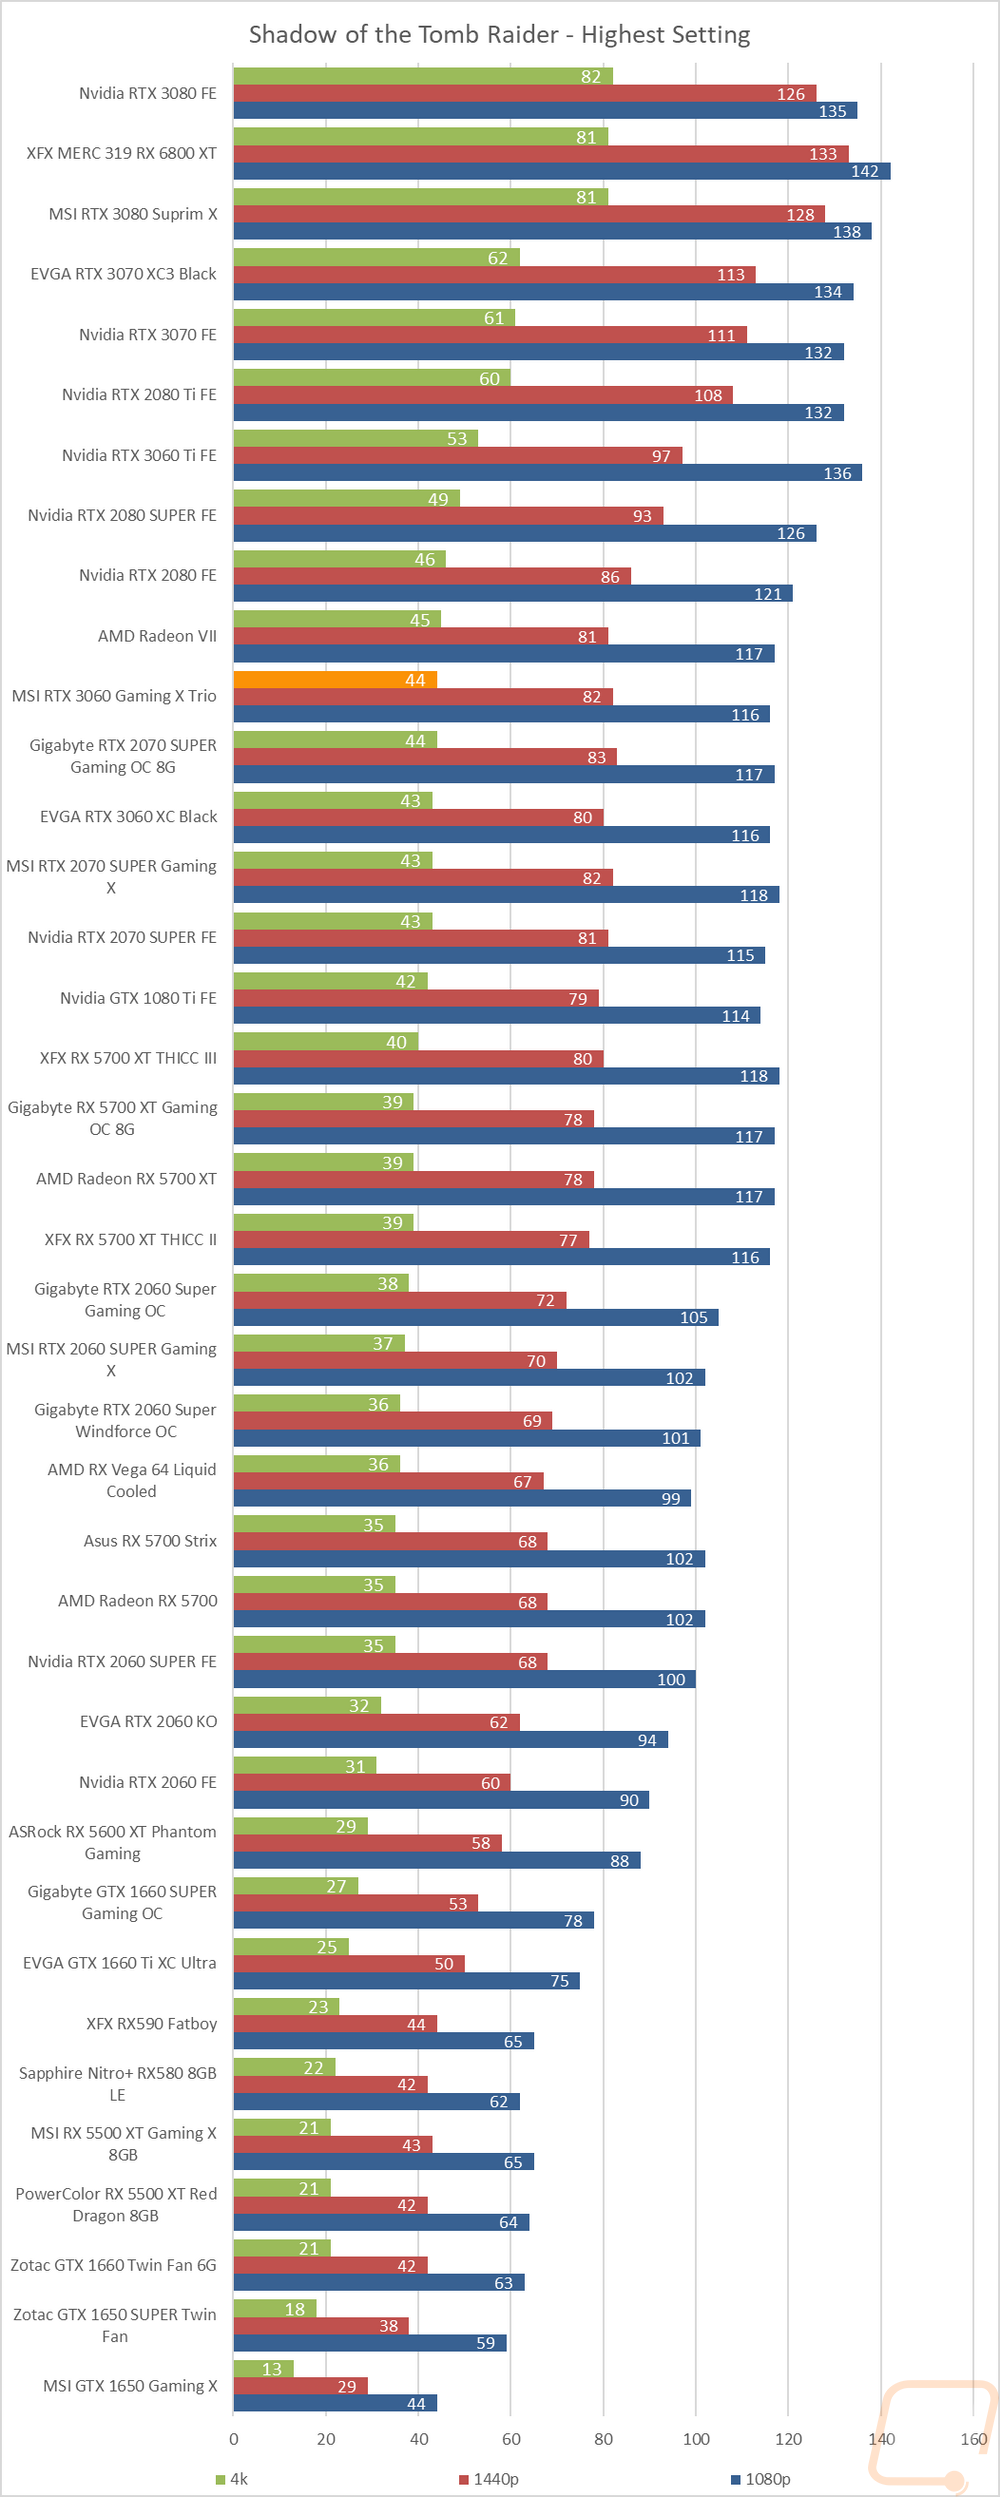
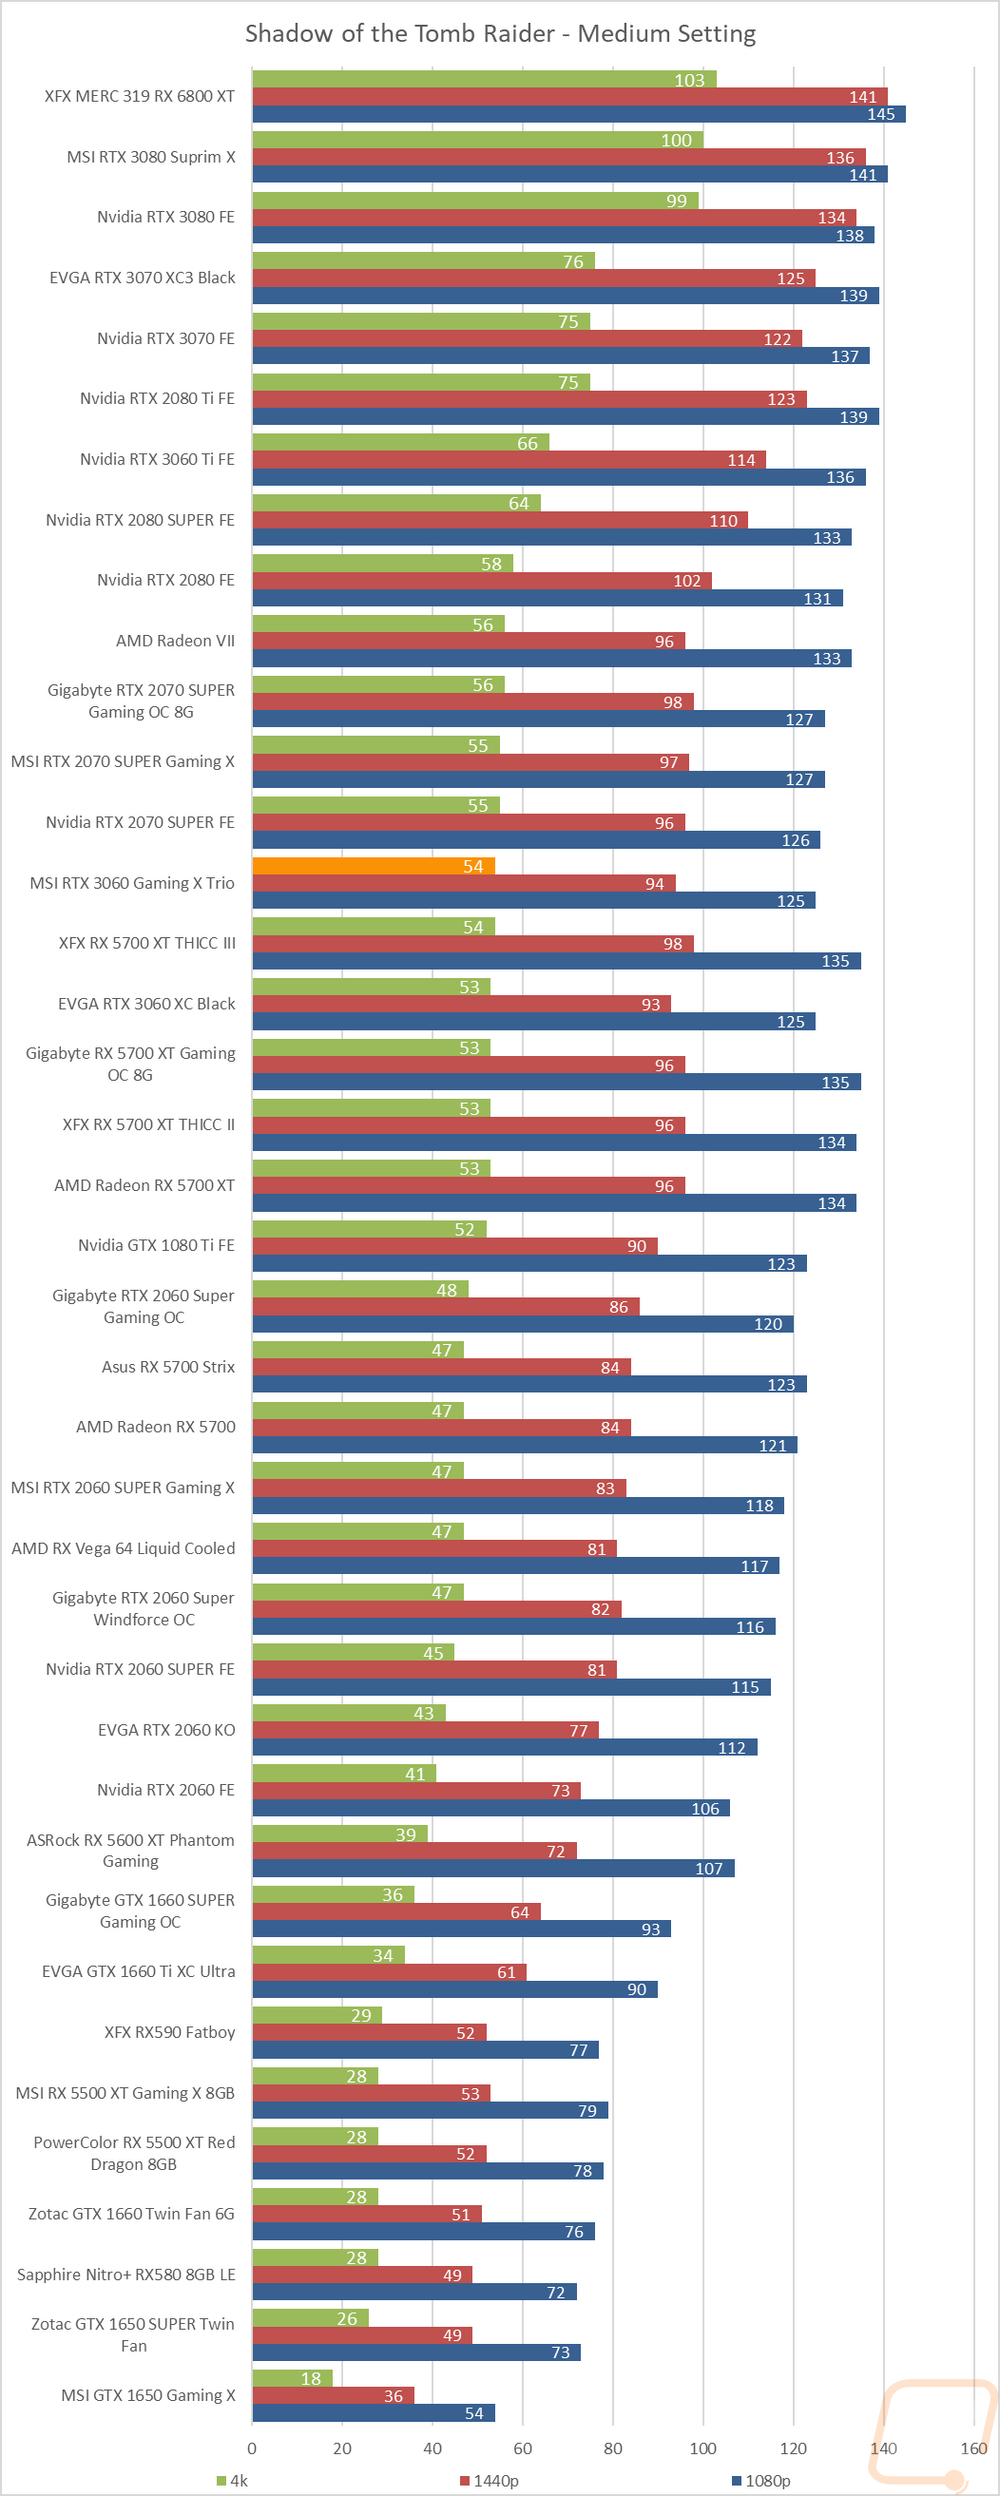
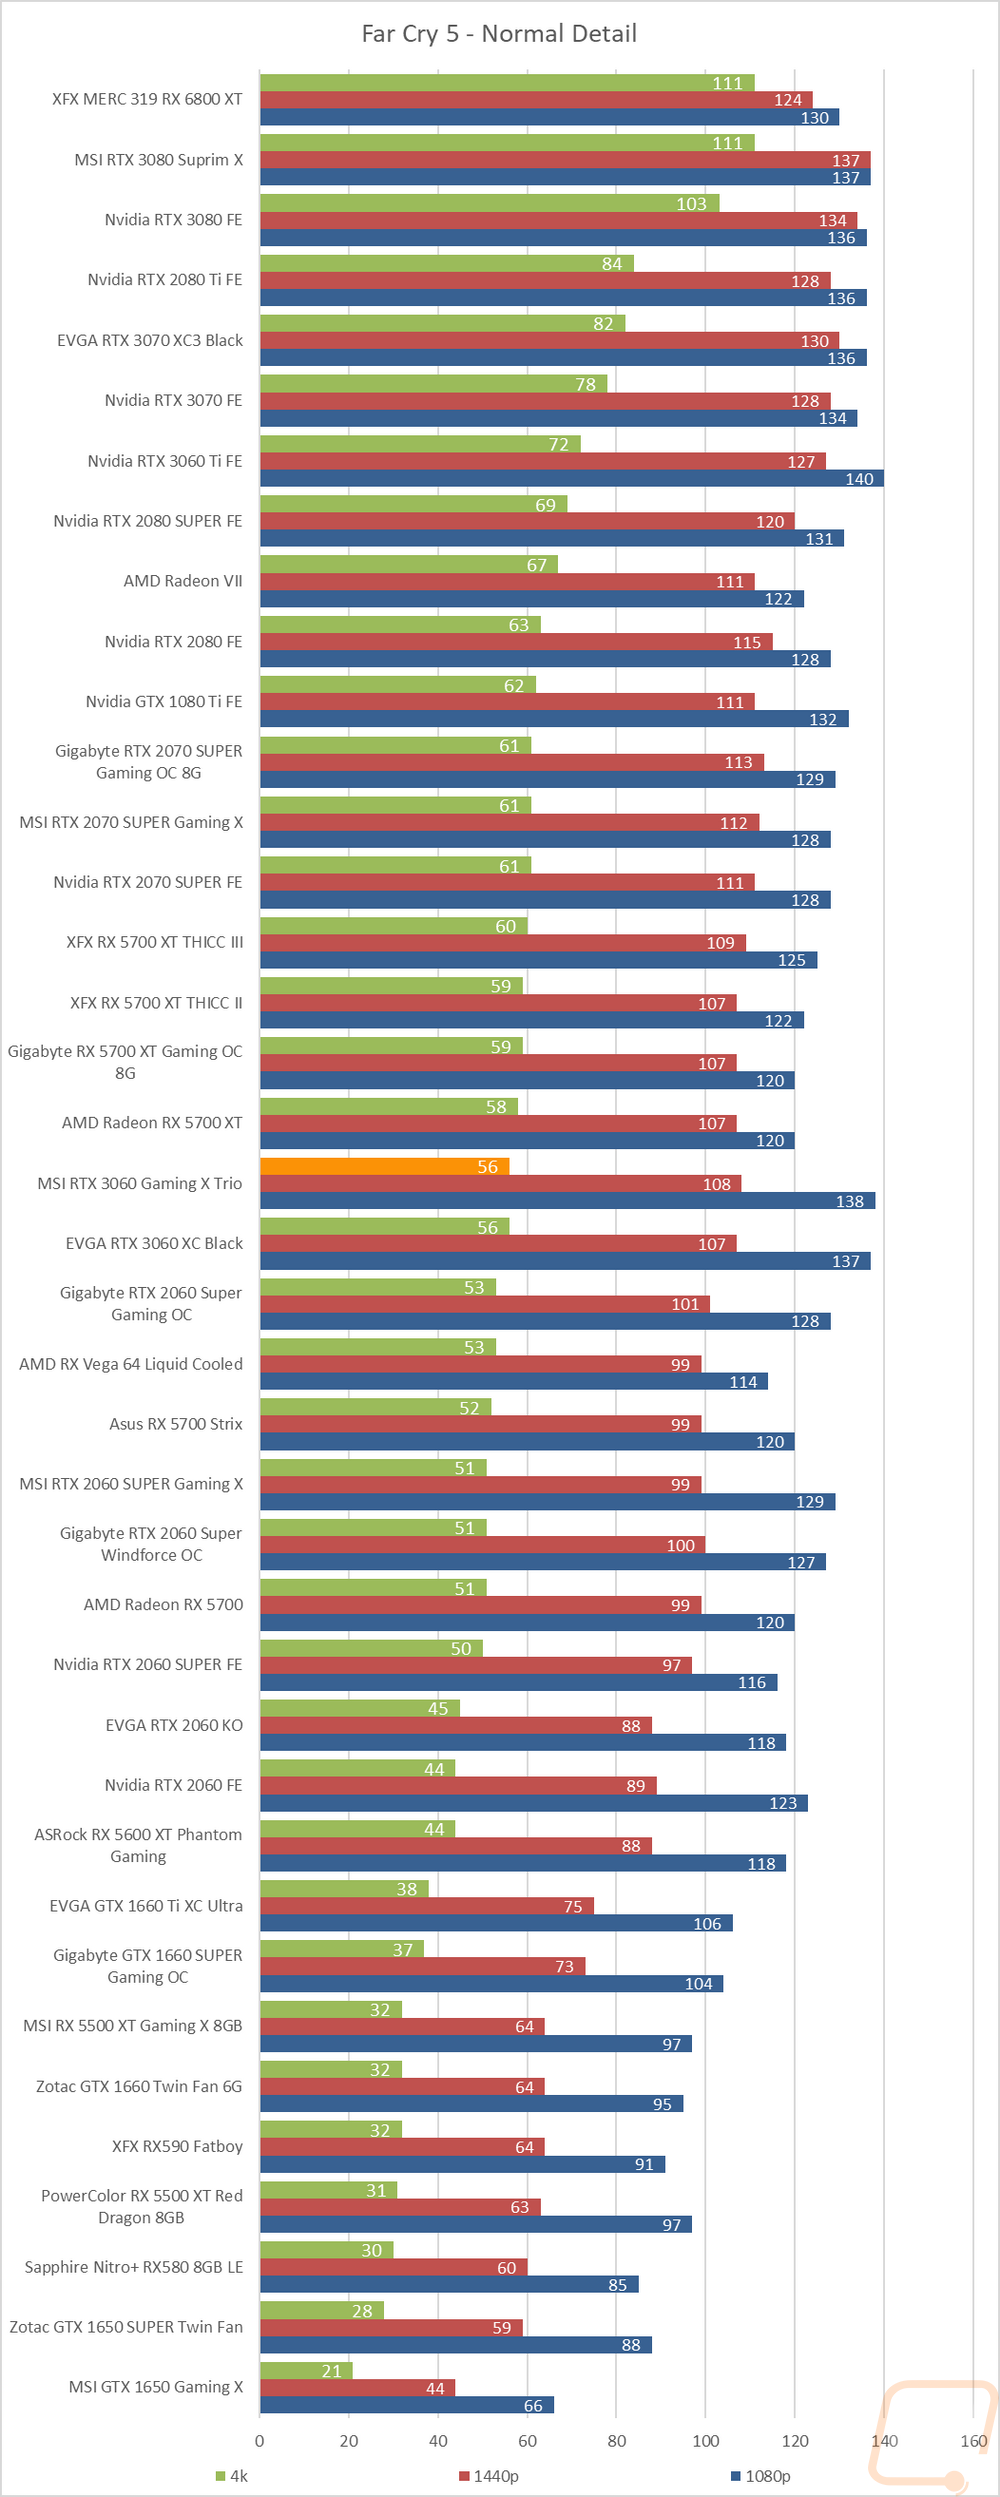
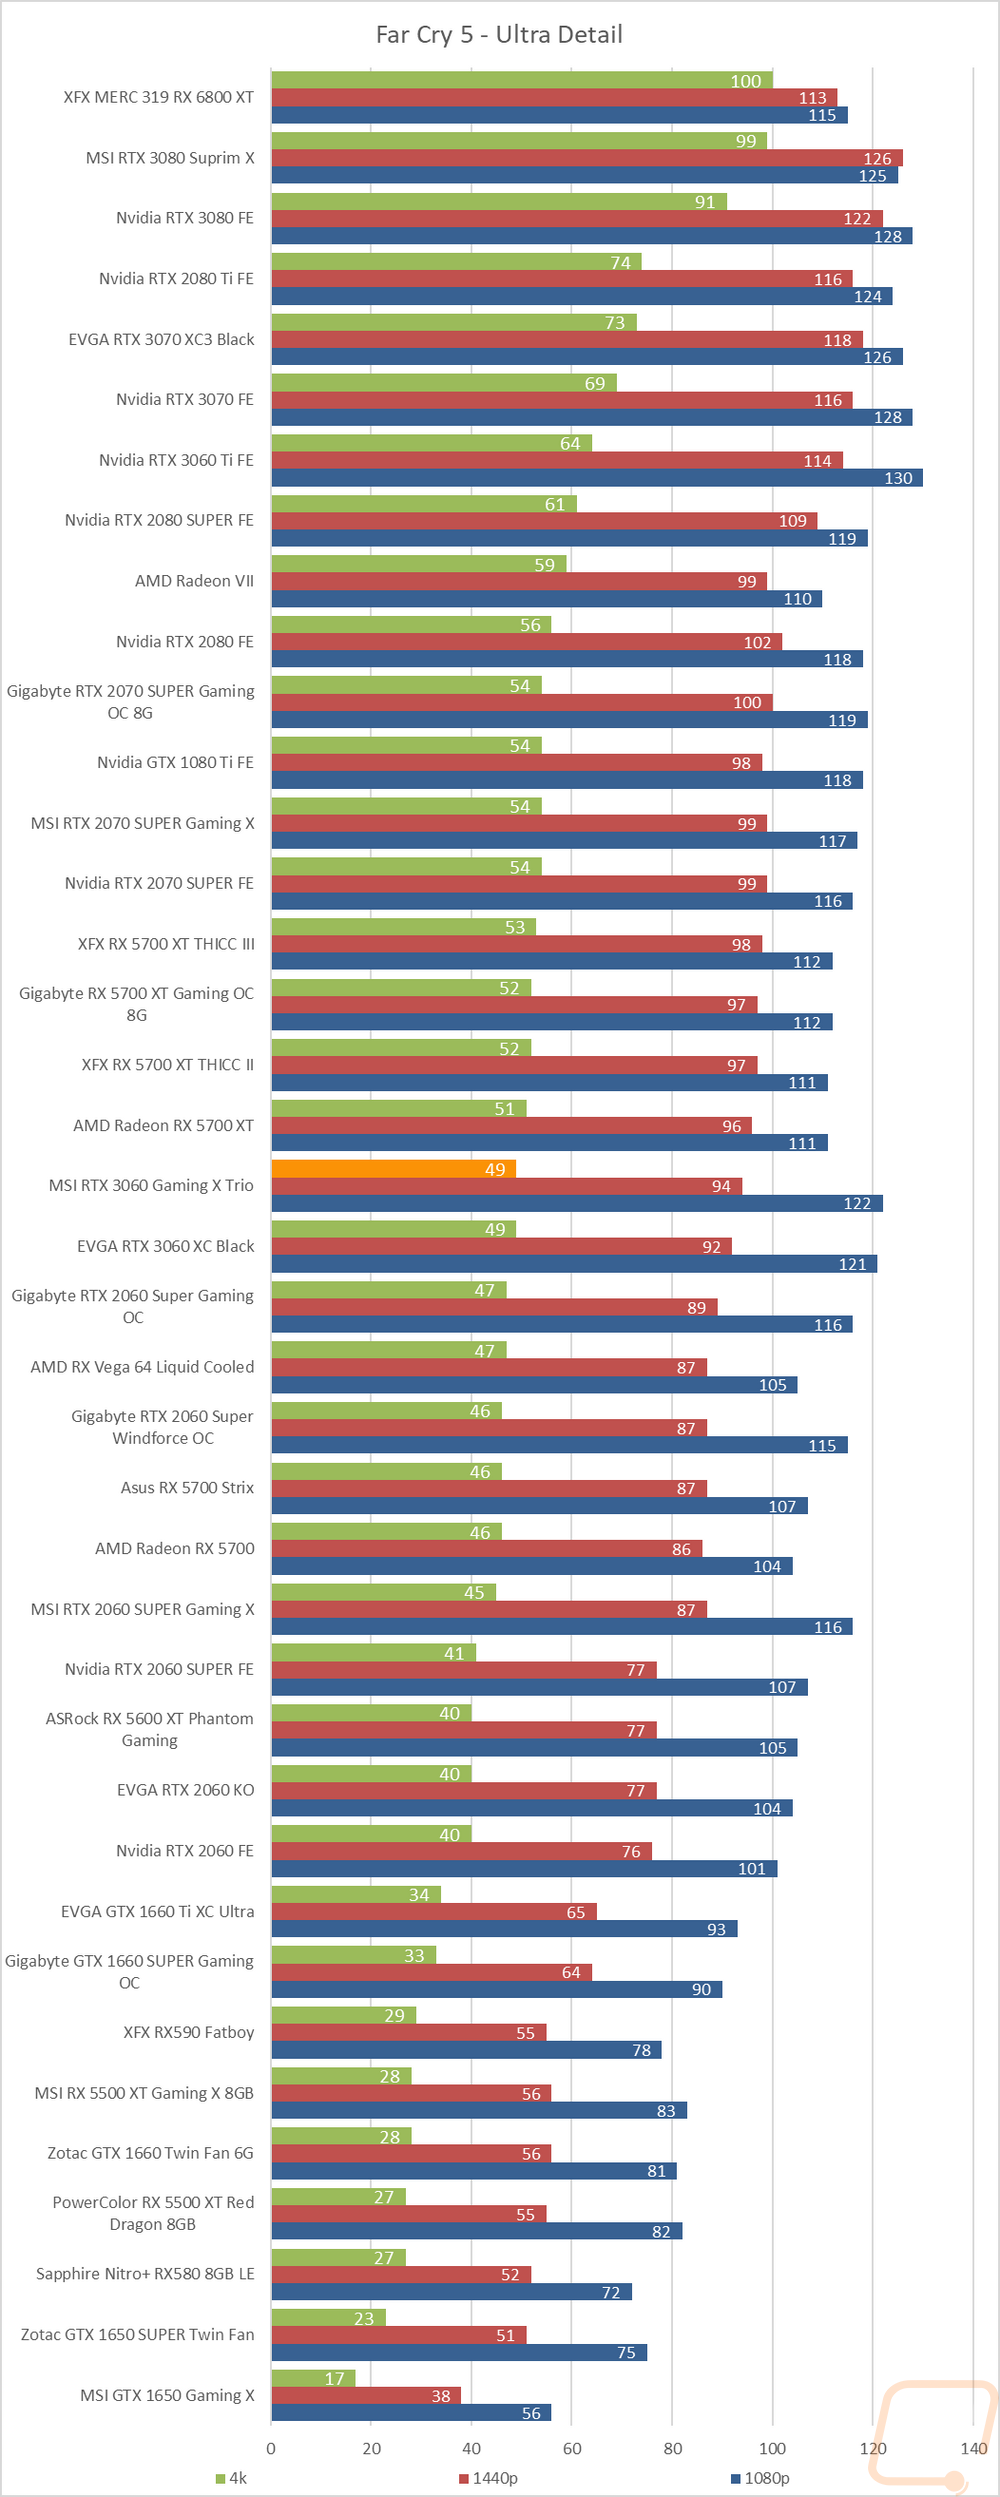
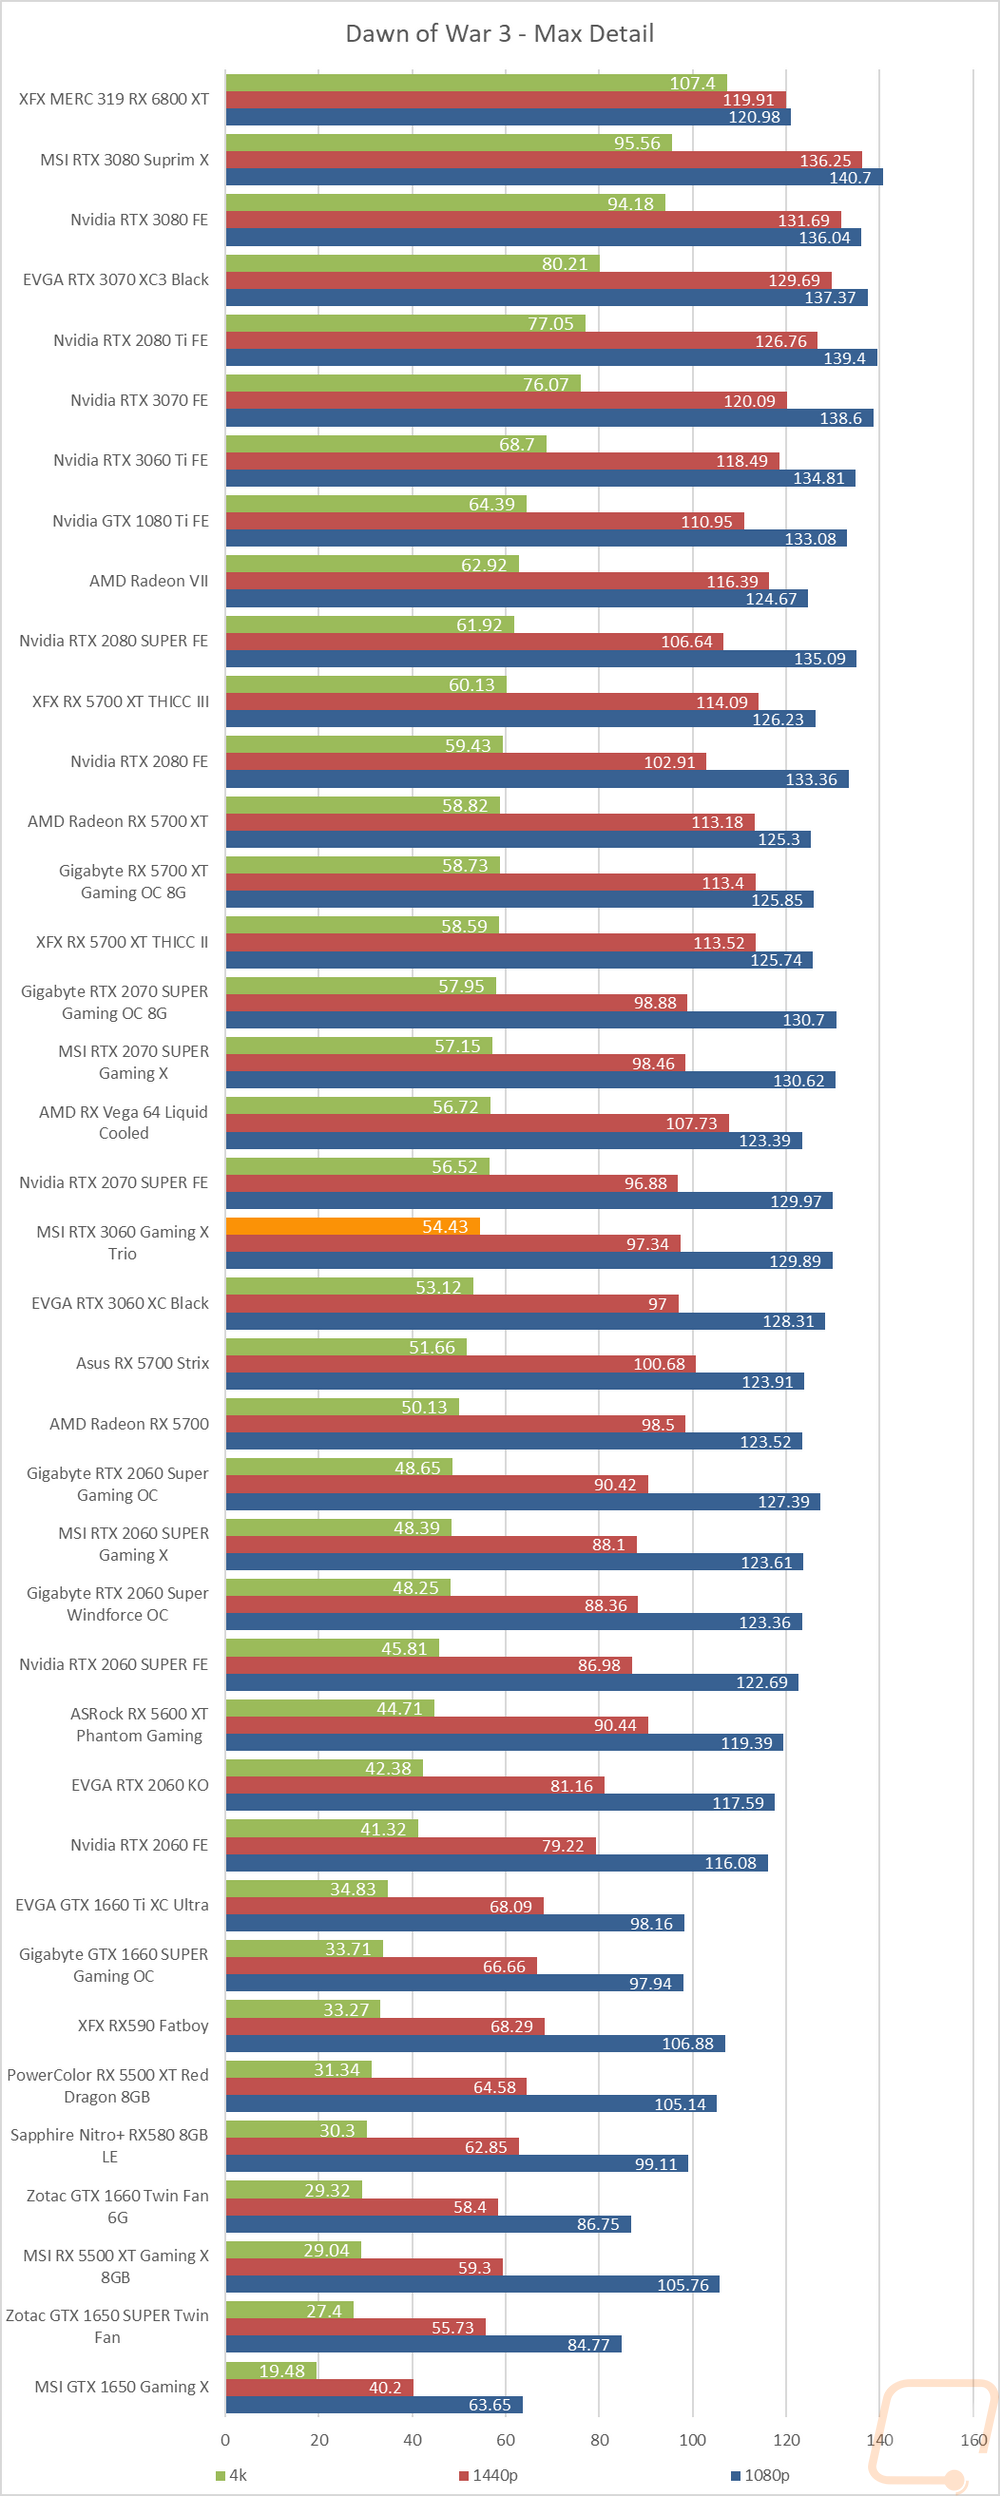
Of course, I have all of the actual in game results as well for anyone who wants to sort through the wall of graphs below. Previously I took a look at where the RTX 3060 was landing compared to AMDs cards as well as Nvidia's previous cards and what I found was the RTX 3060 bounces around a little but mostly sticks with the RTX 2060 SUPER in most games. Was the overclock enough to make any change in this? Well, the overclock ends up getting around a 1 FPS bump at 4k, 1-2 FPS at 1440p, and in some of the 1080p results which are 120+ the gap was even larger.