Getting the Crush build all together took a lot of time and a lot of coordination working with the whole list of sponsors, especially after having to pull the motherboard and CPU for our test bench. But it is all finally together, at least for now, so today is the day I finally get to see how it performs. The build didn’t end up being as crazy as The Fridge, but it did end up being a lot more usable and more practical for my office space. Plus the orange theme is something I’ve been wanting to do for a long time, it's exciting to check that one off the to-do list. Of course, I’m already looking at more things I can do to the build and I am always open to suggestions, but for now let’s see how it performed and check out the office area around it now that I gained space back from the HUGE Fridge build.
Title: Project Build: Crush – Part 4
Written by: Wes
Pictures by: Wes
Build Sponsors/Supporters: Nvidia - Gigabyte - Caselabs - Noctua - Kingston - Seagate - OCZ - Asus - Corsair - CableMods
Amazon Affiliate link: HERE
Links to other Parts: Part 1 – Part 2 – Part 3 – Part 4 – Part 5 - Part 6
Performance
So for testing, I wasn’t limited to the same tests that I normally use for video card or CPU benchmarks because I didn’t need to worry about constantly updating games not giving valid results so I was excited to see how the build would perform across a whole range of games. All of the games below were tested with SLI turned on though a few, namely Deus Ex: Mankind Divided clearly have issues in SLI. I left the results in though because I wanted to remind everyone that multi-card configurations may give great performance in some games, but there are other games that you will only see single card performance, or in this case performance will actually be worse. You have to be aware and adjust your settings to account for it.
Some of the other in game results were crazy, though. League of Legends, for example, was just off the charts, but other games like Hitman and Ashes of the Singularity had actual playable numbers with the settings cranked up, normally those are games that in our video card testing struggle on even the best cards.
|
In Game Results |
|
|
Deus Ex: Mankind Divided Ultra Settings – 1080p |
DX11 - 37.8 FPS |
|
Ashes of the Singularity |
61.5 FPS |
|
League of Legends |
1080p – 481 FPS 1440p – 452 FPS 4k – 299 FPS |
|
DOOM |
1080p – 176 FPS |
|
Overwatch |
1080p 172 FPS |
|
Hitman 1080p – DX11 - Ultra |
139.58 FPS |
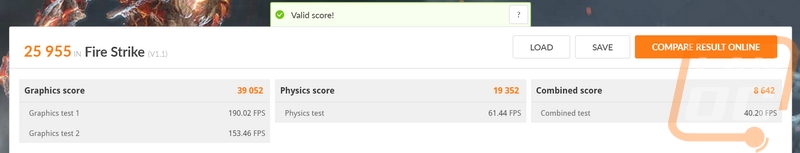
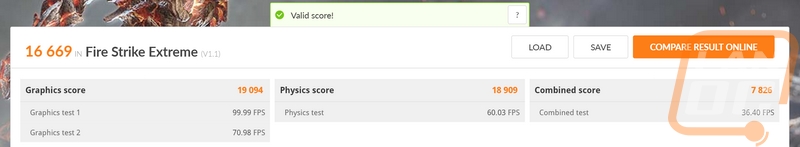
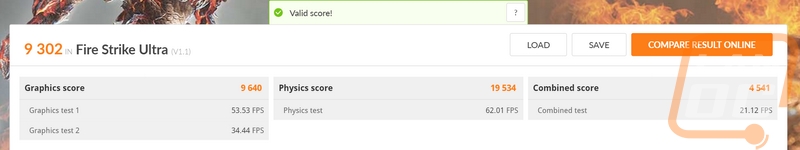
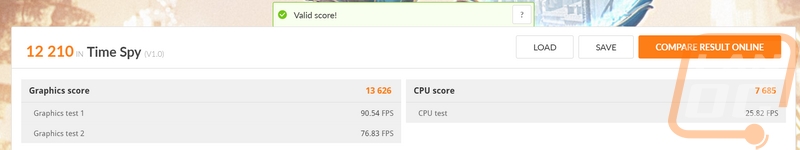
The 3DMark results were impressive as well with the results completely blowing away the performance of our Lunchbox 4 build. Here is a link to the performance results for comparison. Hell, the score at the Ultra setting isn’t far off from Lunchbox 4’s performance setting score.
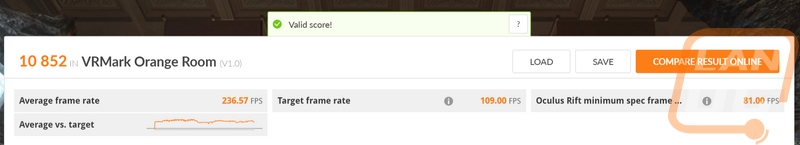
Using the new VRMark to test for VR performance, Crush doubled the target frame rates on both tests. This is actually the first time I’ve seen good results in the much more demanding Blue Room test.

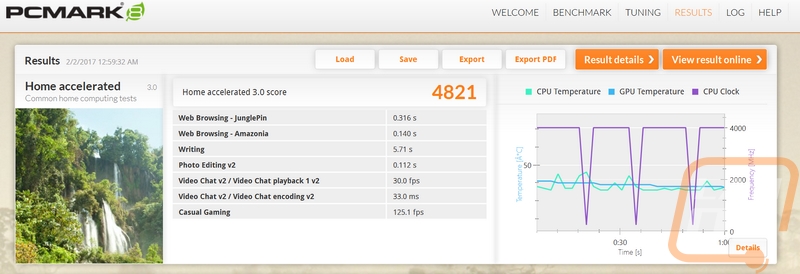
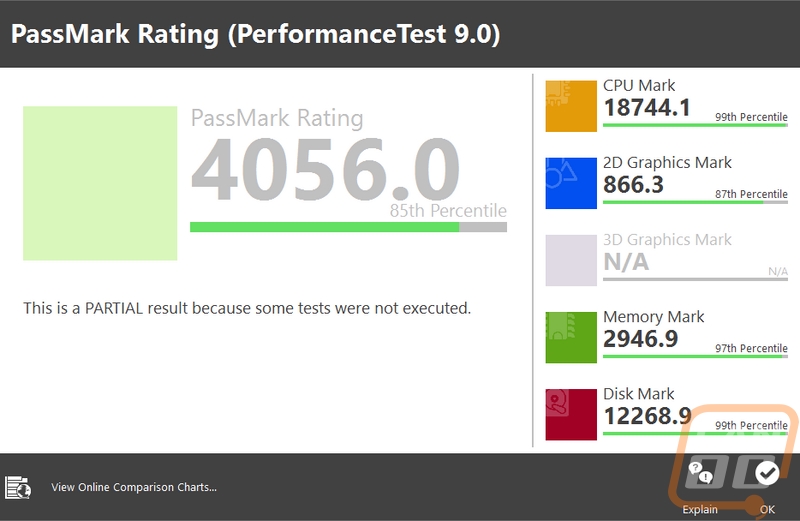
For whole PC results, I tested using PCMark and I also tried Passmark’s PerformanceTest as well. For PCMark the results were a little surprising, the Lunchbox 4 build actually outperformed Crush here. I think this is partially related to the higher clock speeds of the i7-6700K in that build, but it is also a good reminder that the X99 platform is a generation behind on build processes as well so its not even going to be as efficient clock for clock, it gains that back when taking advantage of its additional cores. There was also something interesting going on with the CPU clock speeds during the test and it wasn’t thermal. Now the PerformanceTest results didn’t end up being complete, I consistently had one test fail in the 3D Graphics portion (most likely SLI related) so I didn’t end up with a full score. I left the results in here though so everyone could see the CPU, Memory, and Disk results individually as they are all three in the 97/99th percentile.
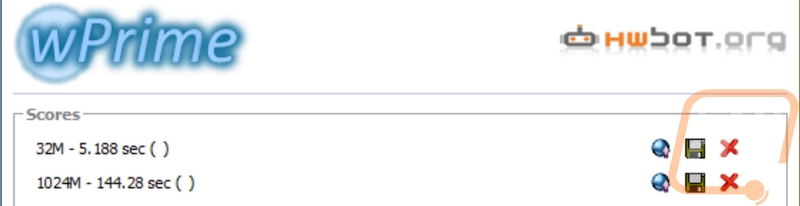
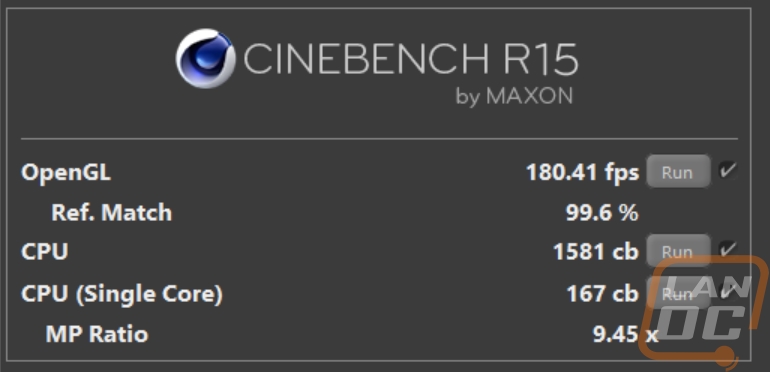
Now a big reason for the build, beyond using it for gaming, I also need to be able to photo and video edit so it was time for the 6900K to stretch its legs on a few CPU intensive loads. I did this in wPrime and Cinebench R15. wPrime is always a solid benchmark for comparison and I love Cinebench’s use of a single core test along with a multicore test to get a feel for both uses. Now in wPrime, the 6900K stomped the 6700K with a full 50+ seconds less time on the longer test. For the Cinebench R15 results I had to go back to our 6700K review for test results but the 6900K outperformed by a large margin in the multi-core test but the 6700K was faster in the single core test. No surprises here.
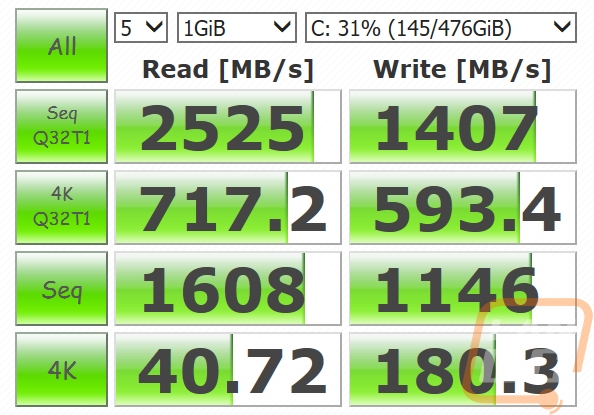
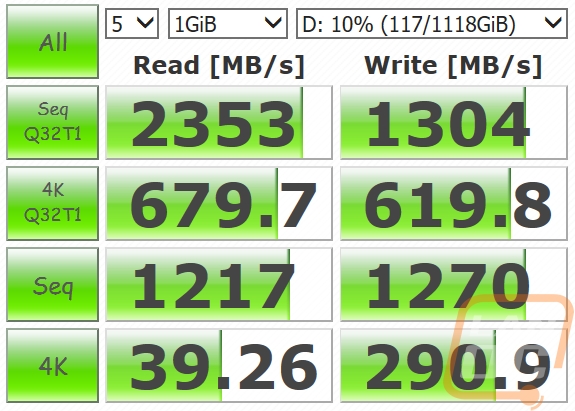
I couldn’t forget to test the storage devices as well right? This is where Crush really stands out. The two SATA based drives in Lunchbox4 have nothing on the two NVME SSDs in Crush. The OCZ drive as the OS drive had read speeds of 2525MB/s and write speed of 1407 MB/s. The scratch drive and frequently used games drive is the Intel 750 Series and it had read speeds in CrystalDiskMark of 2353MB/s and write speeds of 1304 MB/s. Really the only bottleneck is the 10 TB Seagate drive for bulk storage with its 211 read and 204 write speeds but honestly even that isn’t too bad for a traditional hard drive. Of course, its still going to take a LONG time to fill up that 10TB at those speeds.
OCZ RD400
Intel 750 Series 1.2TB
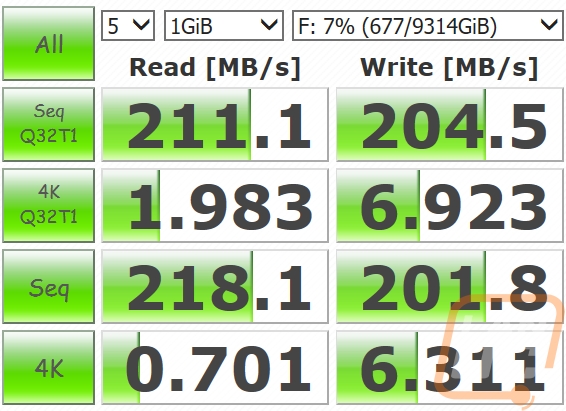
Seagate 10TB
For the last test, I was curious to find out how much power Crush would be pulling from the wall. Remember we went with an efficient power supply and the single CPU is an improvement over the Fridge build for overall power, not to mention the more efficient CPU as well. The two GTX 1080’s would be the main power draw, but even those are big improvements over past cards, especially the quad 7970’s in the original Fridge build. At idle Crush ended up pulling 148 watts and frankly, that still seems a little high, but still a good improvement. The 510 watts at load though should help with the electric bill over time. It was also not far off from the 547-watt estimation that the CM power supply calculator suggested as well.
|
Power Usage |
|
|
Idle |
148 Watts |
|
Load (peak wattage in Fire Strike) |
510 |
