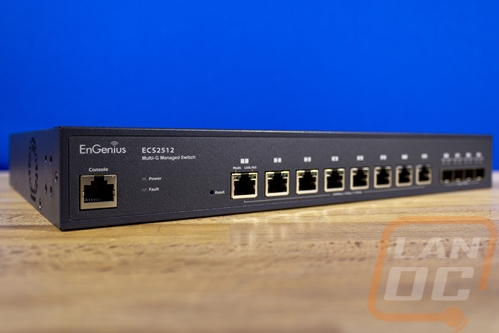
Software
With the ECS2512 being a managed switch, unlike a basic switch, the software side of things do come into play. EnGenius helps with that at least partially with it also being one of their EnGenius Cloud-based devices so the initial setup is extremely easy, especially if you already have other EnGenius Cloud devices like we do in the office. You just need to open up the app and click add device and scan the QR code on the bottom of the ECS2512. From there you tell it which network you want to add it to and it will be linked to your account. This will sync other switch settings if you have them set up.
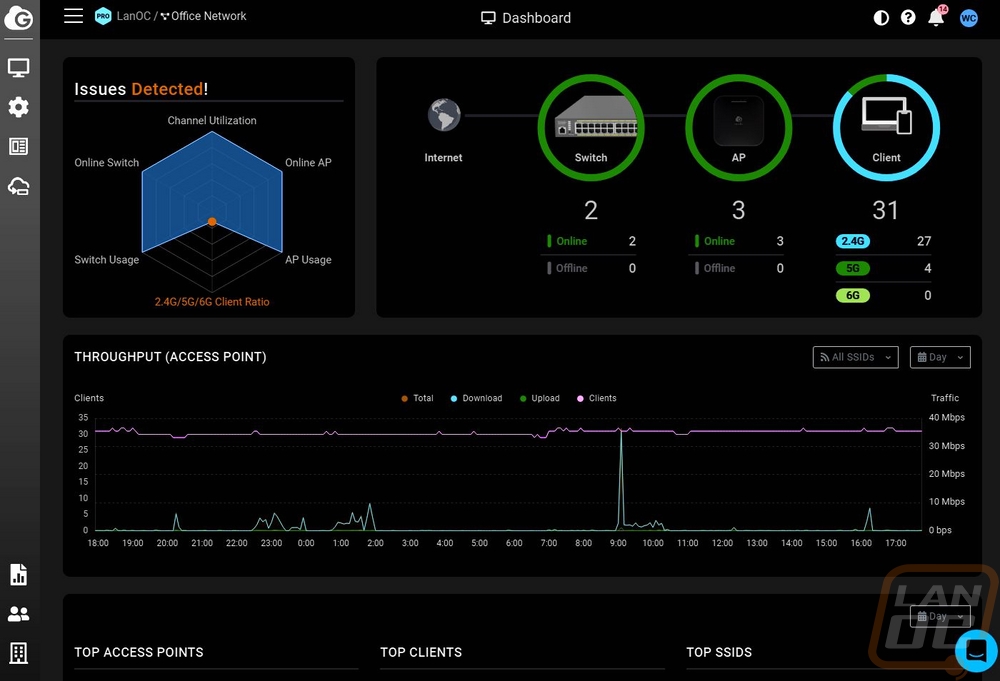
The home page for EnGenius cloud gives you a landing page and a quick update on your entire network. They let you know if you have any switch or AP issues in the top left corner which for ours we always have a client ratio issue due to the number of smart home devices on the network that will only work with 2.4Ghz. You can see the number of switches and access points online and the number of clients on wireless. They also graph out wireless traffic and show you the top AP and clients for the day on that same page. Up in the top right corner, you can switch between lite or dark mode and you have a bell that will let you know if there are any notifications, clicking on that will list them out.
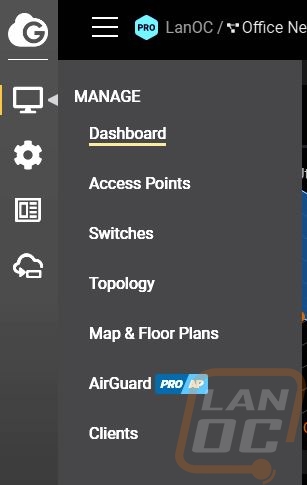
On the left, there is a menu that pops out when mousing over it. The first one is the manage section which lets you select which type of device you want to manage. You can do access points or switches. You can see a topology map that it creates, though I do wish they would let you add to it manually to map your entire network out. Speaking of maps you can make a floor plan and show where APs are using the floor plan or a satellite view. The AirGuard page is pro only and only if you have a security rated access point and then you have the client list.
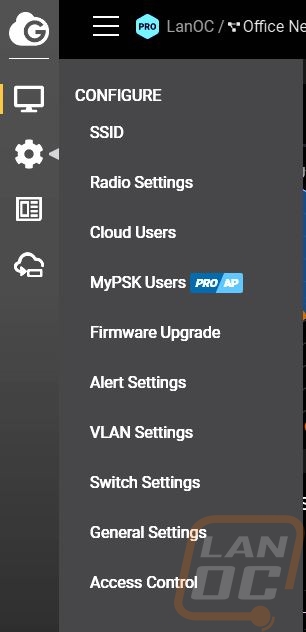
The second option is where you can change access point settings like your SSIDs and radio settings. The firmware upgrade page lets you see all of your devices and what firmware version you are on. You can select if you want stable updates or beta updates, set the time and date for updates and you can also manually set any specific device to be beta updates with the rest on stable if you want. The switch settings page is the only page specific to the ECS2512 as well as VLAN settings if you are looking to set that up. The switch settings page is where you would set up switch settings that you want to be used across the entire network which will auto-update all switches.
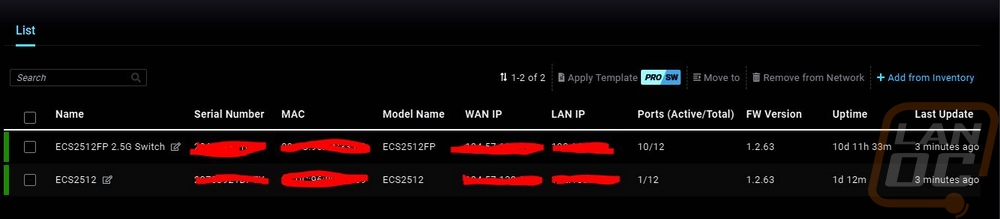
The switch list under the manage tab is where you get most of your control. The main page lists all switches on your network along with their serial number mac address, model, WAN and LAN, firmware, uptime, last update, and the total number of ports and ports active. Mousing over any switch here will bring up four options. You have a details page, diagnostic page, reboot, and replace. Reboot is obvious but what is replace? Well, you can have additional switches added to your account ready to swap out and this will do it.
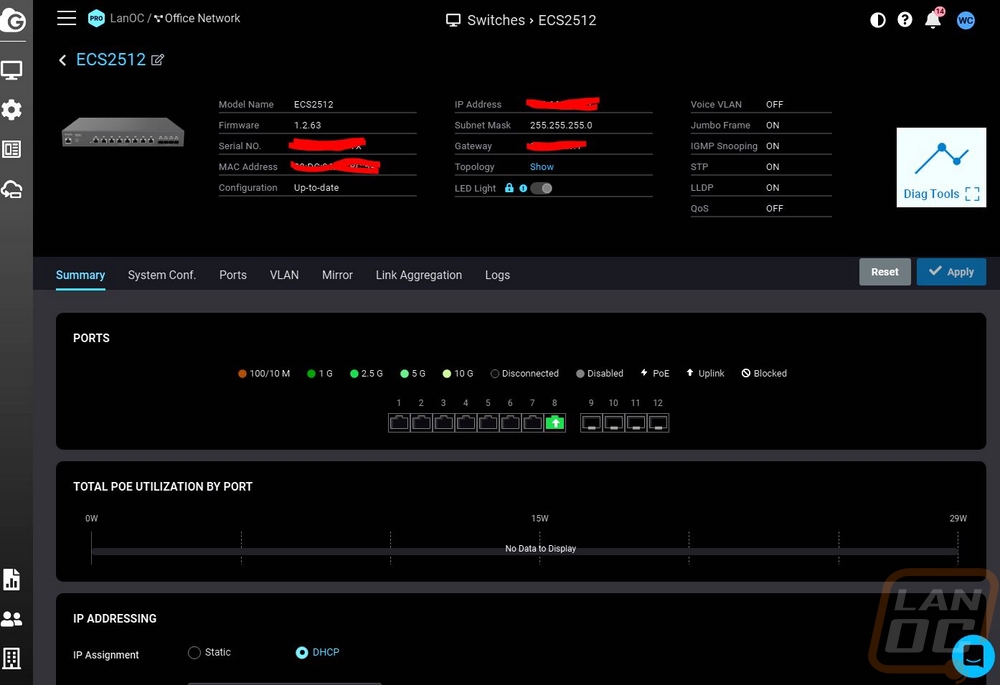
The details page opens up what you see below. This lists all of the details up at the top and even has on or off lists for key features and the option to turn the LED light on or off. Below that there are tabs to flip through other pages. The summary page has a line drawing of the ports that shows you the status of each port including connection speed. Below that is where they would show POE usage but the ECS2512 doesn’t have POE. Then you have IP settings for DHCP or static on the switch.
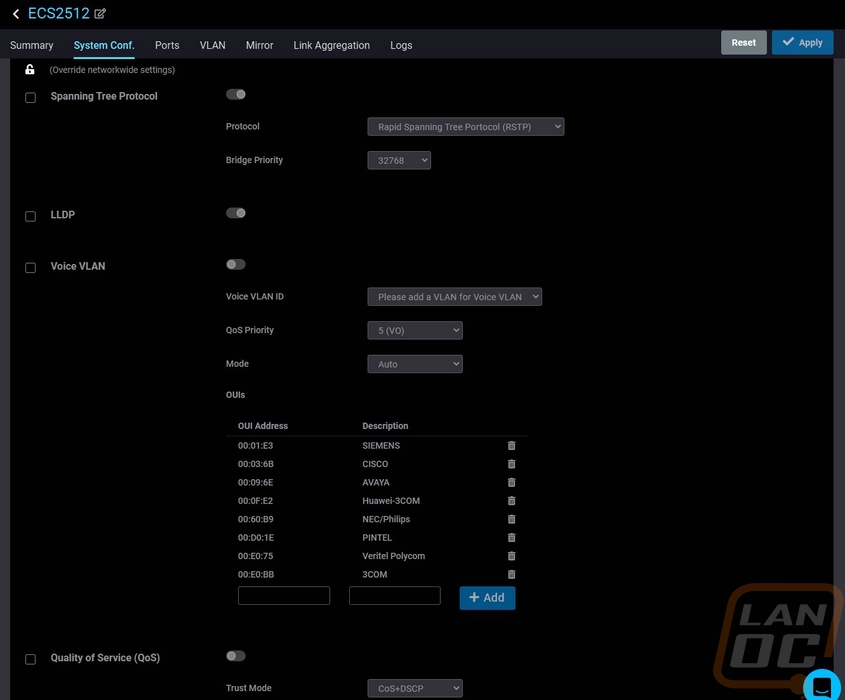
The system config tab has all of the same options that you get on the total network switch settings page. The check box on the left is where you decide to override any specific setting over the global settings. Once you do that the rest of that setting lights up and you can make changes. This is for spanning protocols, LLDP, voice VLAN settings, and QoS settings.
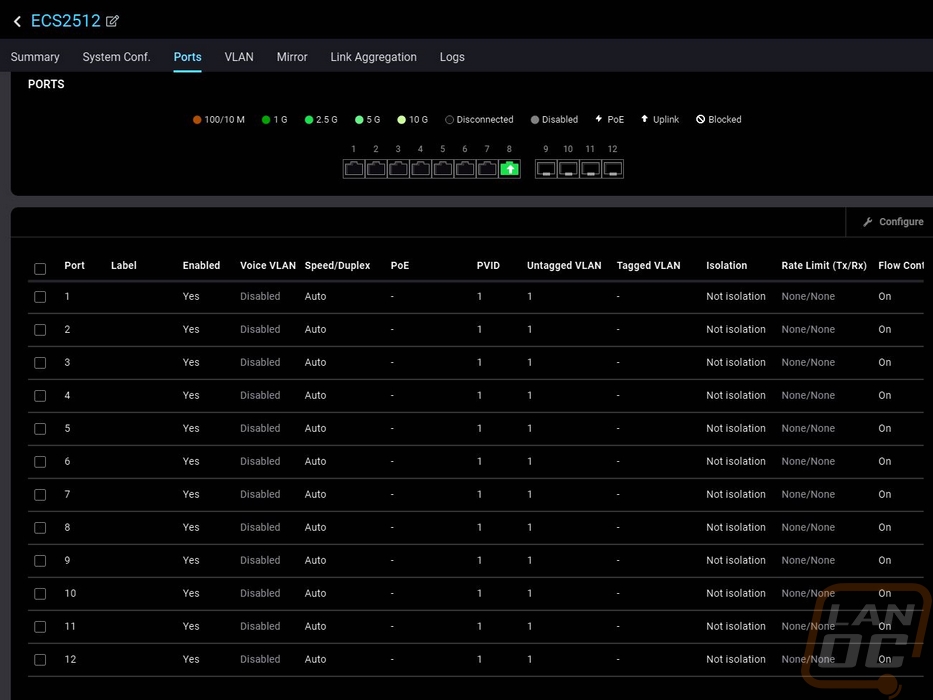
The ports tab has that same line drawing and status indicators for each port. This is where you can change settings for each port individually. You can go in and label each port once you have things hooked up so you know what is on that port and you can change that port's VLAN, force its connection speed down to a lower level, set QoS values specific to each port, and even set rate limits for upload and download if you want.
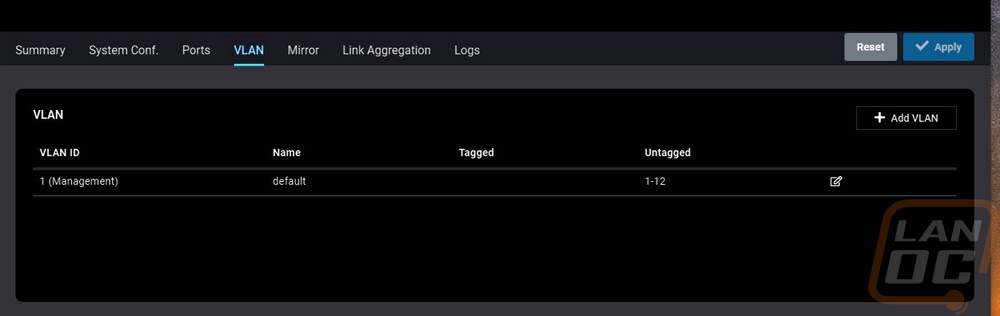
The VLAN tab defaults to just the one VLAN but here you can add additional VLANs with just a VLAN name and VLAN number. Once that is set up by clicking on the VLAN edit button you can also tag specific ports that should be on that VLAN as well.
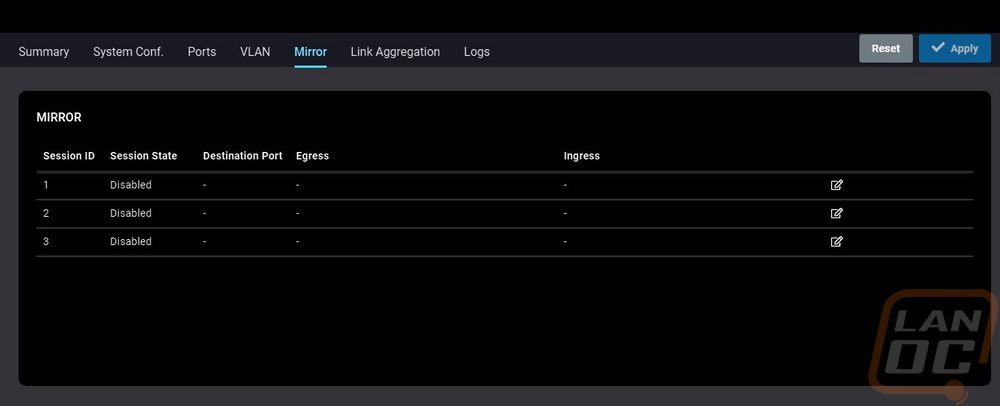
The Mirror tab is where you can set up mirror connections for analysis. You can select the port you want to mirror and which port it should be going to.
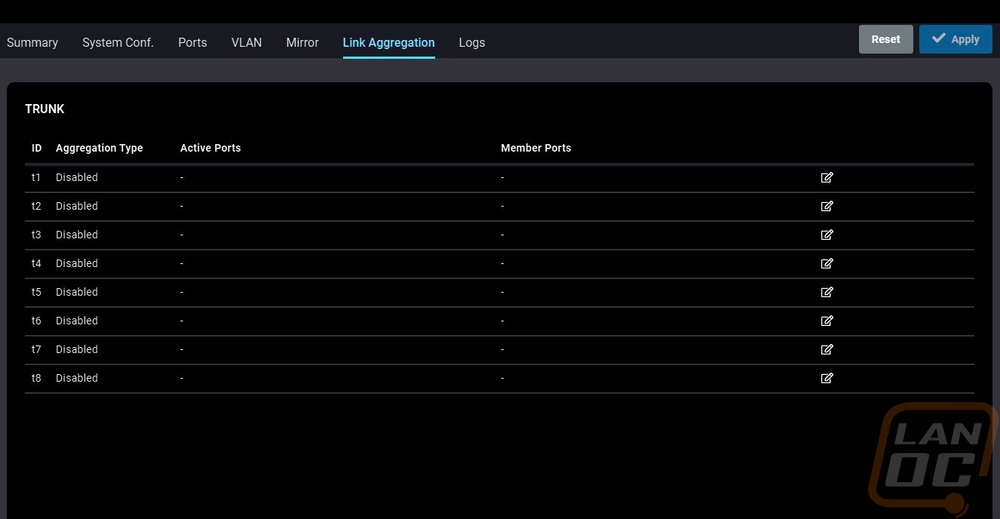
The Link Aggregation tab is where you can setup you guessed it link aggregation. You can select a port to be tied with a second port assuming they both go to the same end location to double your bandwidth and to be able to have redundancy if one of the connections fails. You have the option for a static connection of LACP mode which will handle things automatically.
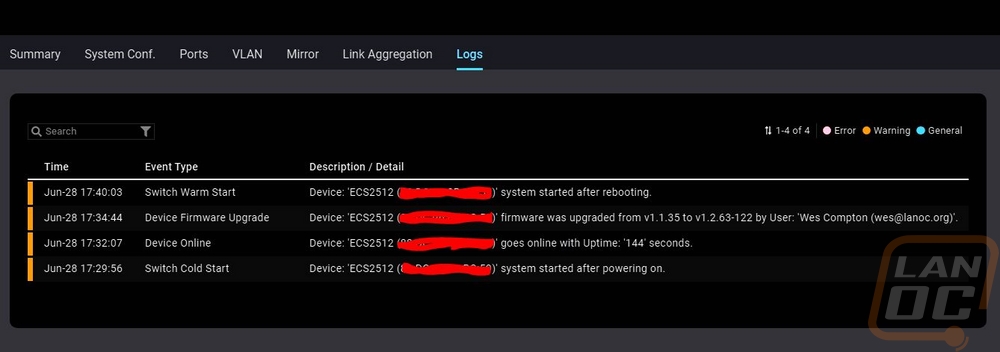
Lastly, there is a logs tab that lists off activity from the switch. You can see here our ECS2512 powered on was up for 144 seconds then the firmware was upgraded and then it rebooted.
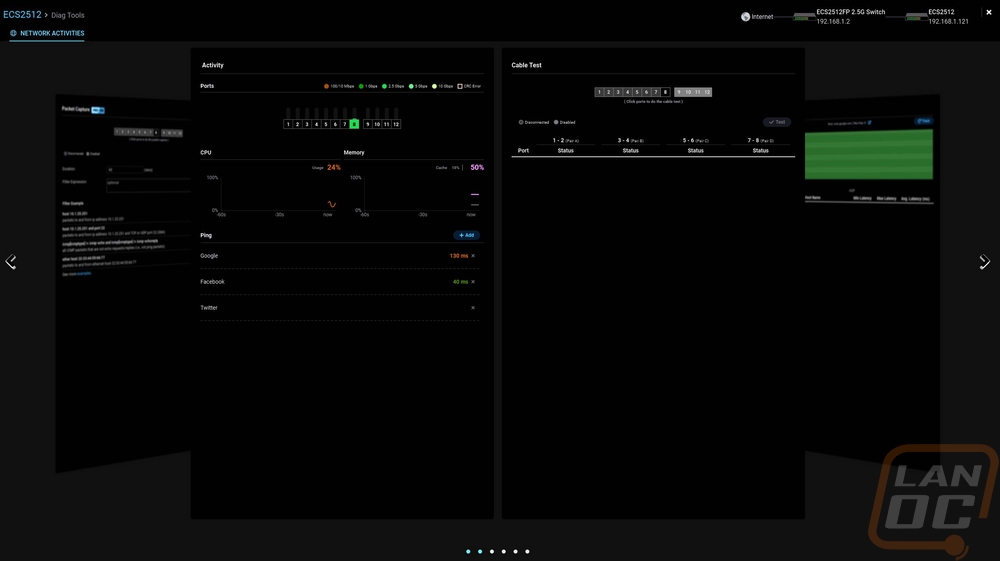
From the switch list page or the switch details page you can open up the switch diagnostics. These will go full screen right away and you have options that you can arrow side to side to check out. You start with the activity page which shows which ports are active and their connection speed. This also shows your CPU and memory usage on the switch and a graph of those over time. Then at the bottom, it has pings for Google, Facebook, and Twitter but you can add additional pings if you want as well for on network or online. The second page visible here is then the cable test you can run a cable test on any port and it will let you know how each pair of wires is working. This is a quick way if you have a slowdown on one port to see if the wire is bad.
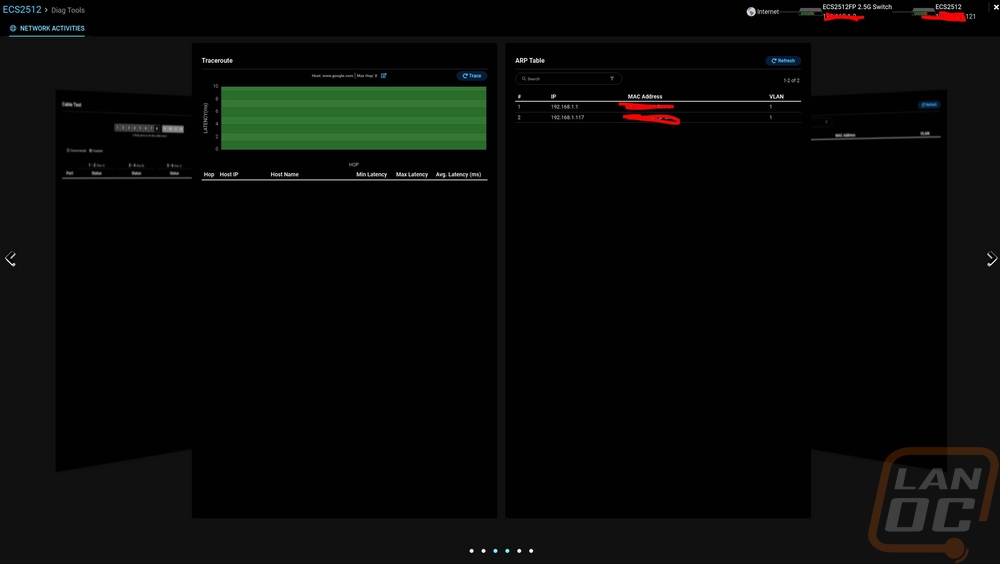
Arrowing over two times we have the traceroute page which by default is set to google.com and 8 hopes but you can change the target and run a traceroute which will graph out the time it takes for each step and list it all out at the bottom like a traditional traceroute. Nex to that is the ARP table or Address Resolution Protocol table which will list out all of the IPs of devices connected by port number and their mac address, this is nice for figuring out where a port goes if you don’t already know.
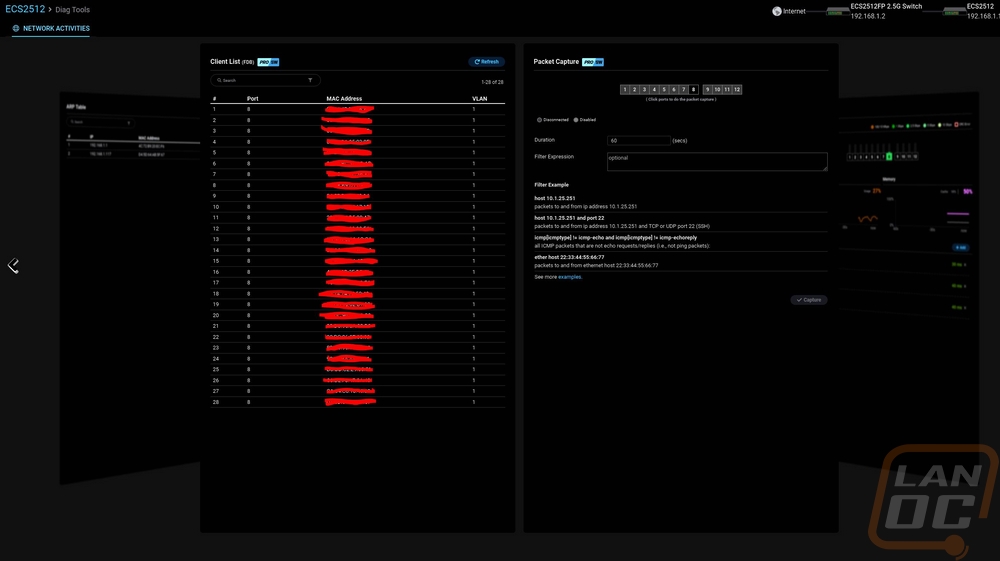
For EnGenius Pro users which is a paid service they also have the client list which uses the FDB tables or layer two functionality. This saves the mac addresses for all devices that have been hooked up to the switch and to what port. This lets you see who was but is no longer hooked up to the switch. Then besides that, we have packet capture which you can select any active port and set the time limit and see what activity that port has.
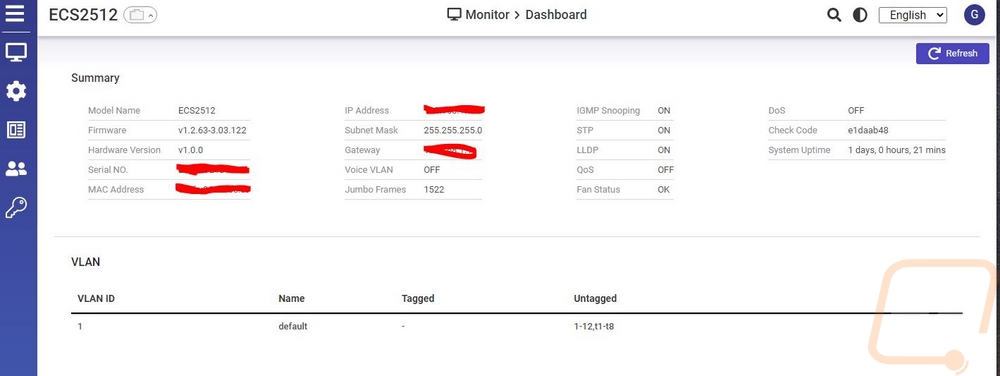
In addition to the EnGenius Cloud side of things, the ECS2512 does have its web interface as well assuming you don’t have that option turned off on the cloud side. A lot of the functionality here is the same as from the cloud, but this has a more traditional layout of things. The dashboard is a lot like the switch details page where you have all of the information and main settings listed right at the top. The login information is the same as your cloud login because after setup that has been stored as well.
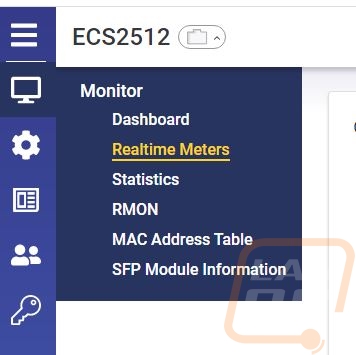
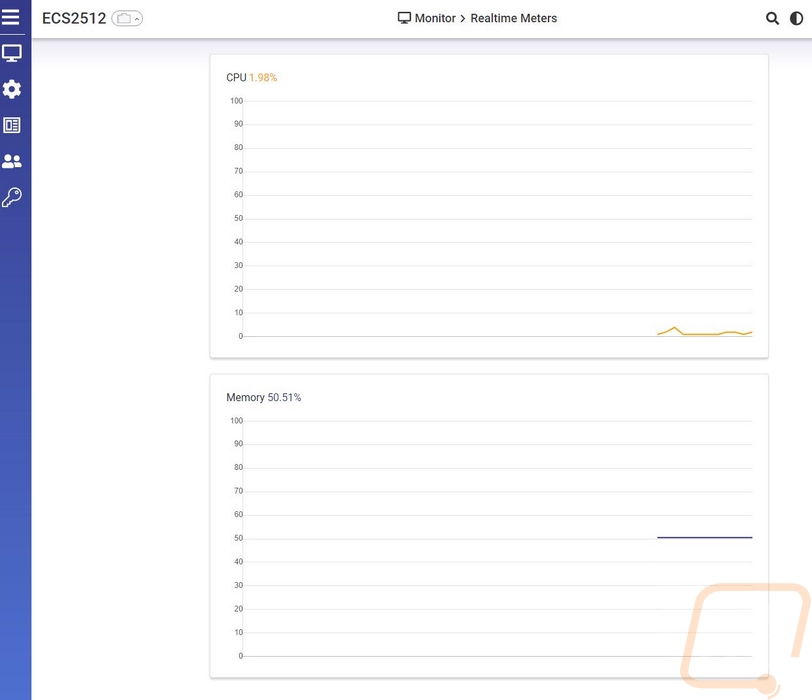
The menus are similar to the cloud as well only there are more options here. Like the real-time meters which are the CPU and Memory usage graphs from the diagnostics page.
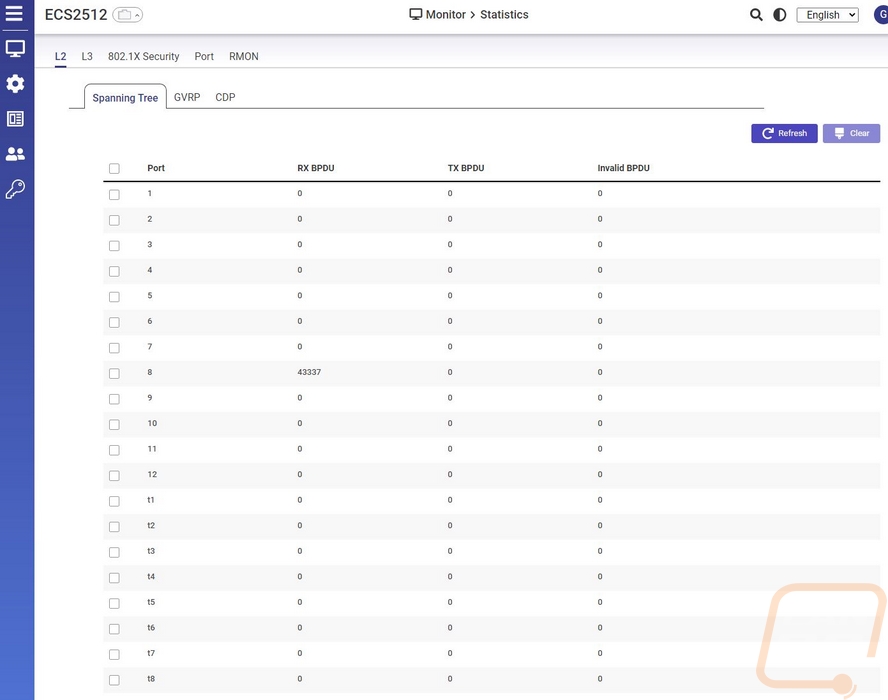
The statistics page lets you dive into total traffic port to port and you can see up top you have access to GVRP stats for VLAN performance stats and CDP for Cisco Discovery Protocol. Layer 3 stats are up top as well as 802.1X and RMON as well.
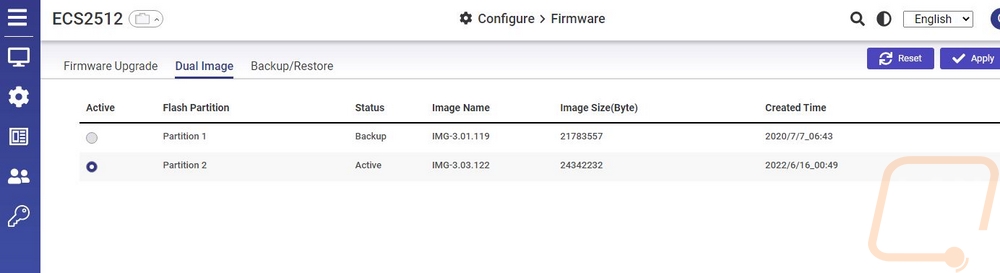
The Firmware page lets you backup and restore firmware’s or set your settings just like the cloud does. The one big difference here is that you can see that the ECS2512 does have dual firmware images and you can control them here so if you have an issue you can switch to the backup image.
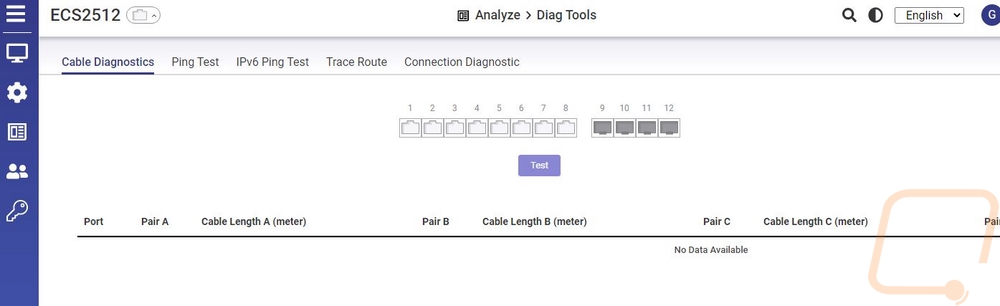
The diag tools page has most of the rest of the diagnostic page tools like testing cables, ping tests, traceroute, and connection diagnostics.
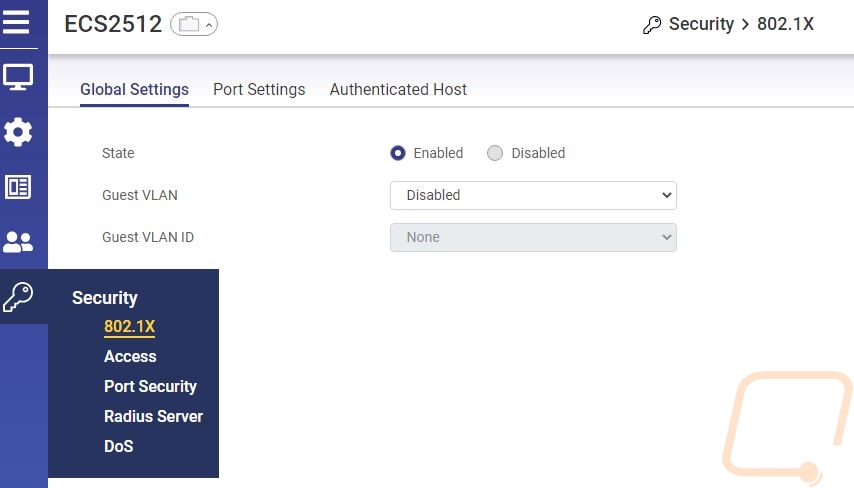
You can also get into your security settings for setting up guest a guest VLAN here as well which is one thing I don’t think I saw in the cloud settings.