CPU Performance
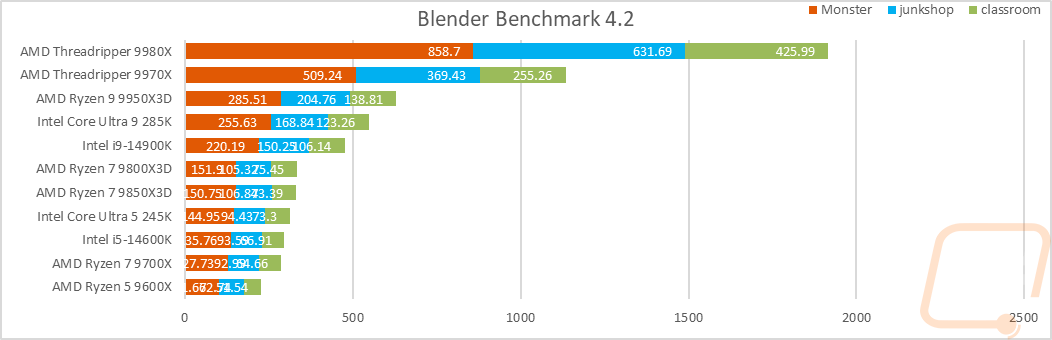
To start off our testing, I went with the rendering-focused Blender benchmark, specifically the latest version, Blender Benchmark 4.2. To get a good look at the overall performance, I have all three of the results stacked together, and in this test, the Ryzen 7 9850X3D is sitting right with the 9800X3D here, with both most likely not taking advantage of their boost clock here.
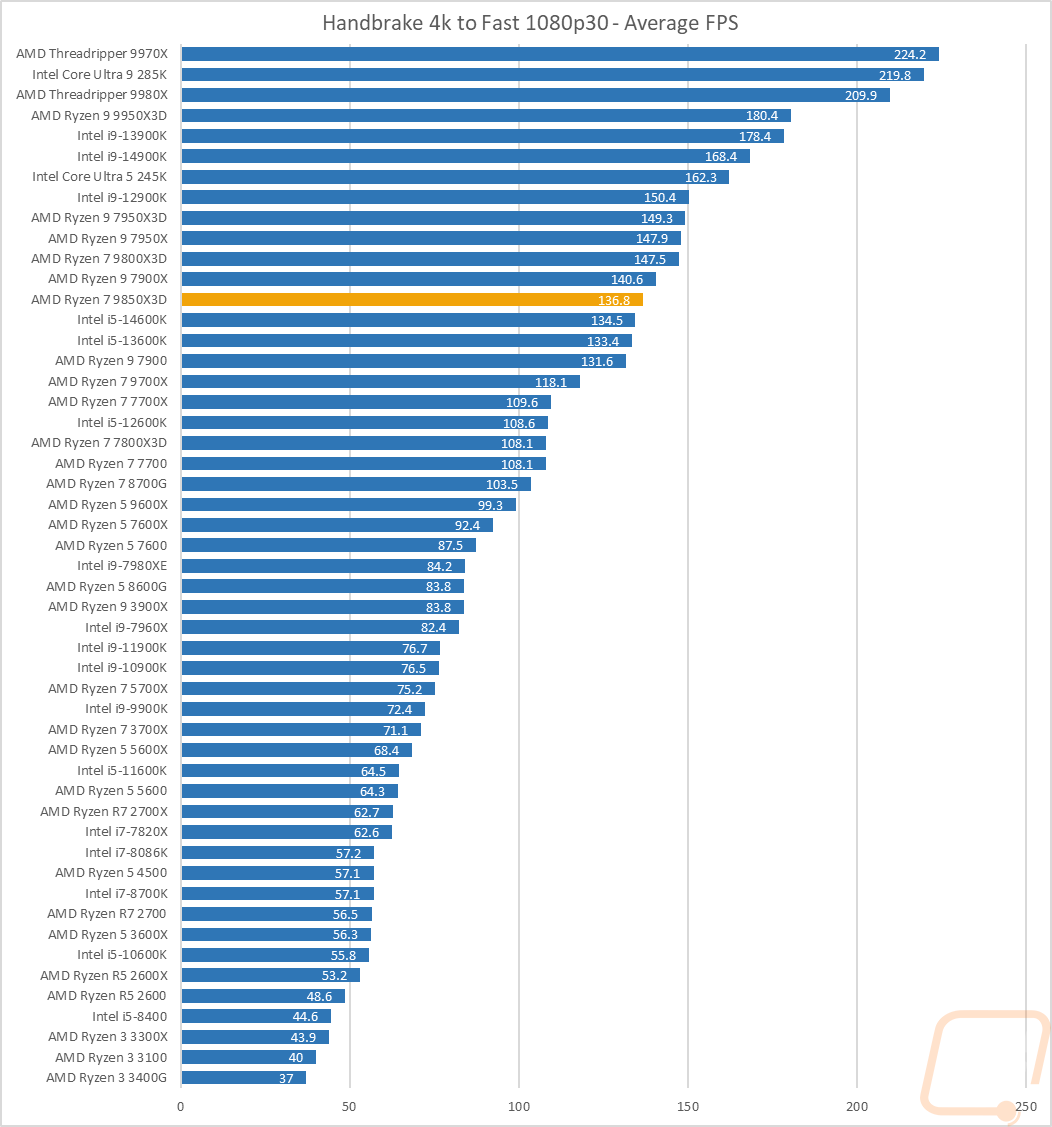
Continuing with the video encoding theme, I also have Handbrake which is an open-source transcoder. For this test, I am taking a 4k video down to 1080p 30 FPS, and the results are the average FPS of that task. The Ryzen 7 9850X3D came in just behind the 9800X3D here and ahead of the 14600K.
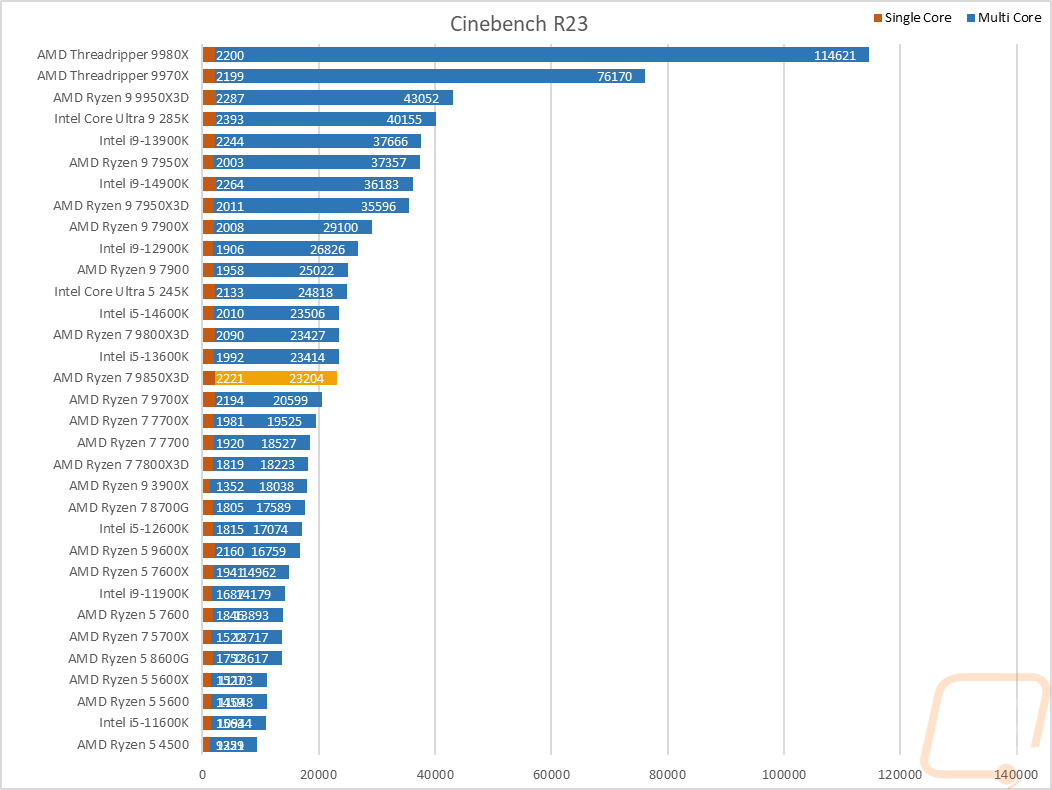
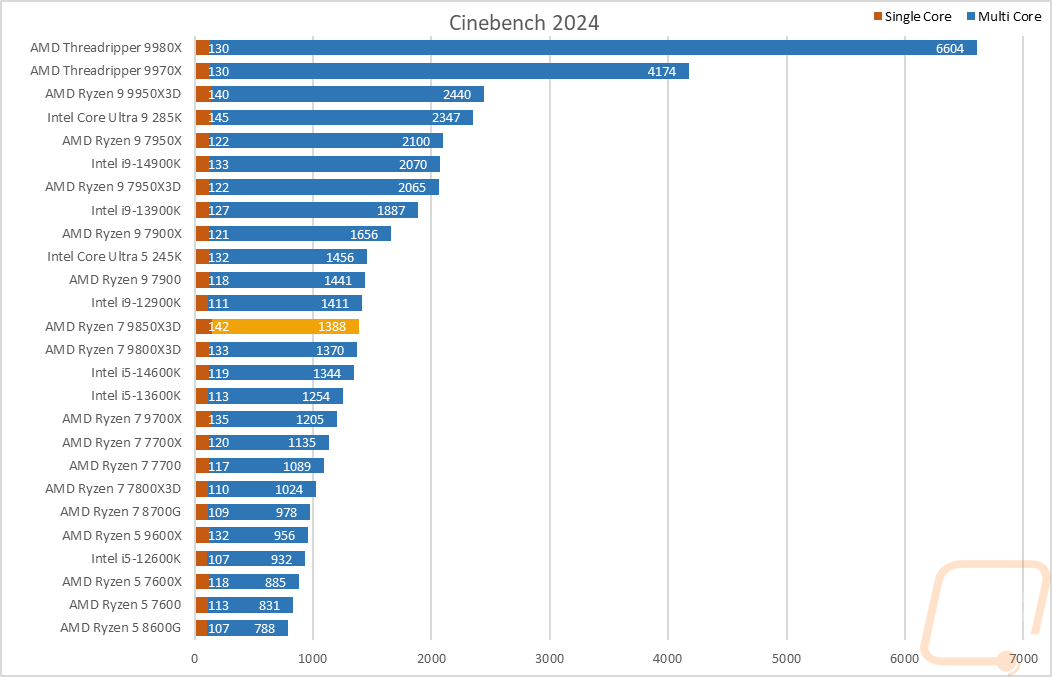
For the always popular Cinebench, I am testing with the older Cinebench R23 as well as the 2024 edition as well. I always like Cinebench because we have multi-core and single-core performance which gives us a good look at the performance of the whole CPU and IPC performance. In both tests, we see something interesting when we compare the Ryzen 7 9850X3D to the 9800X3D. With the multi-thread tests, they perform similarly, but with the single thread tests the Ryzen 7 9850X3D stands out in both tests. In R32, its single-core result was 2221 to the 98000X3D’s 2090, and the Cinebench 2024 test was similar, with 142 to 133.
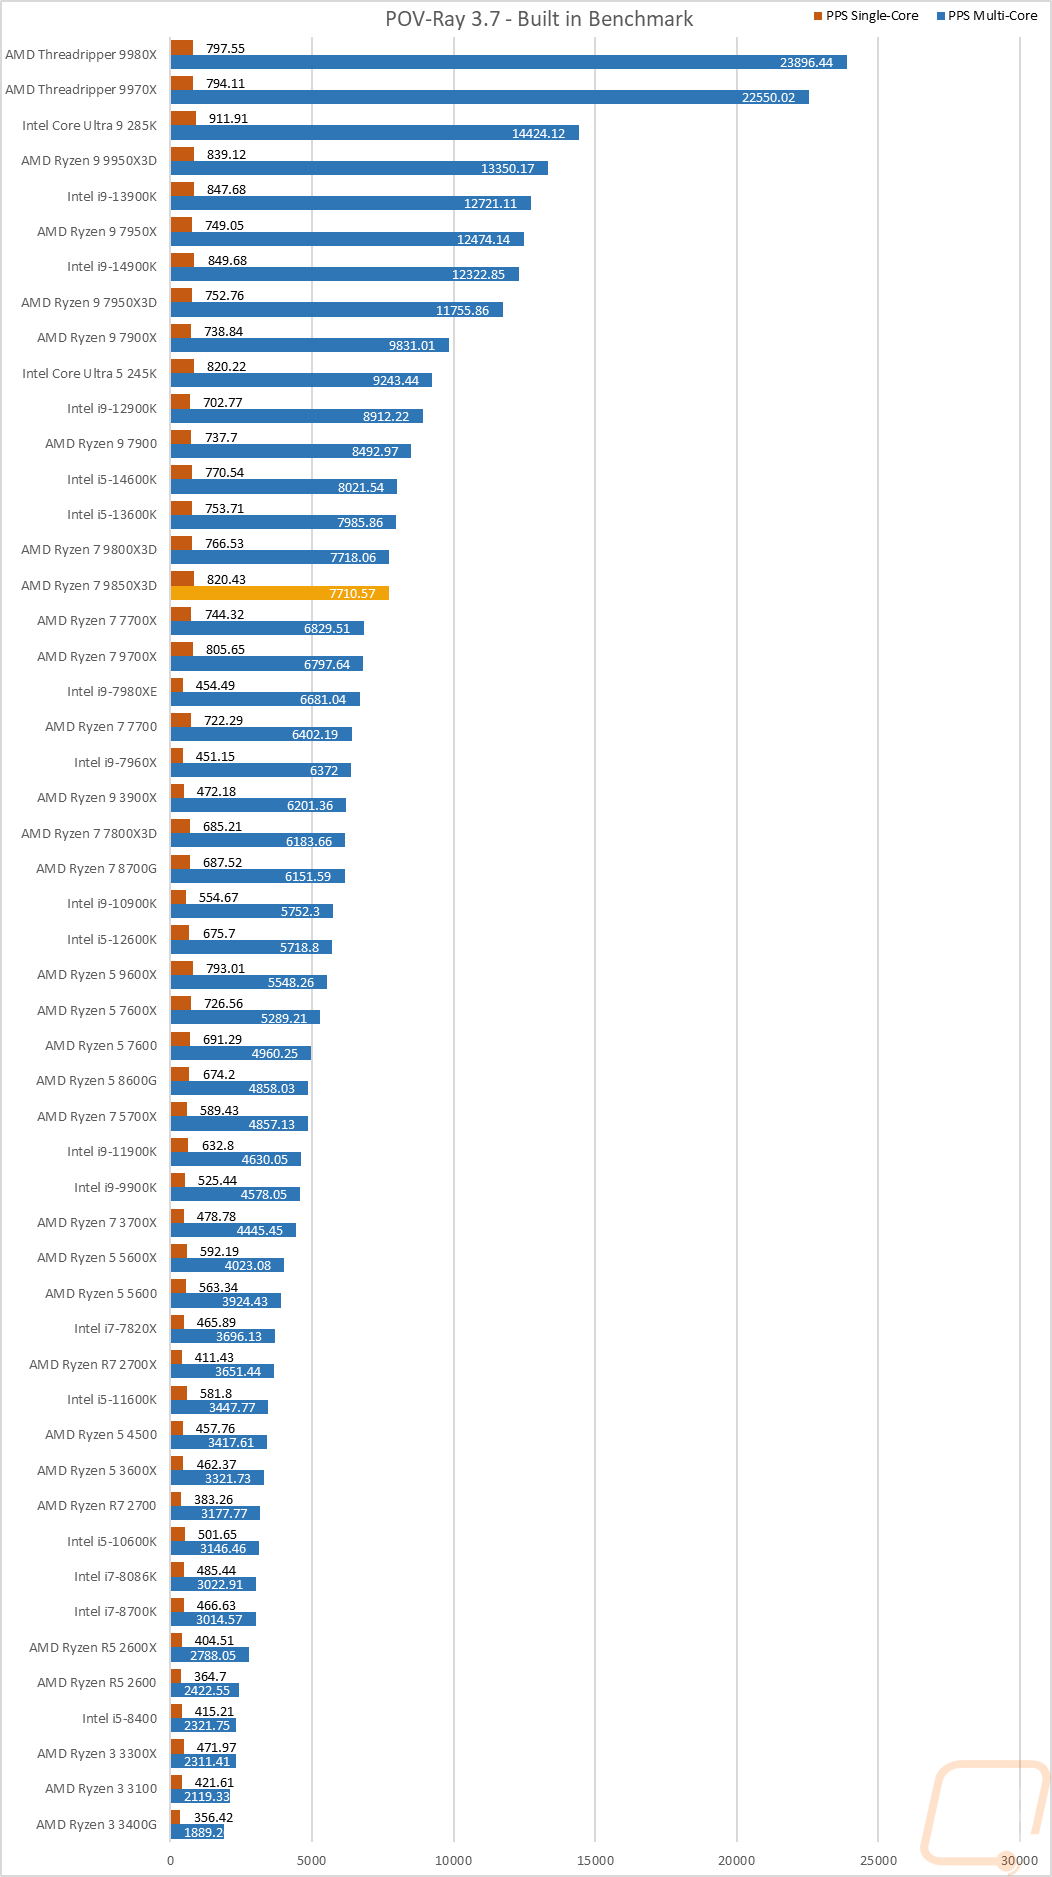
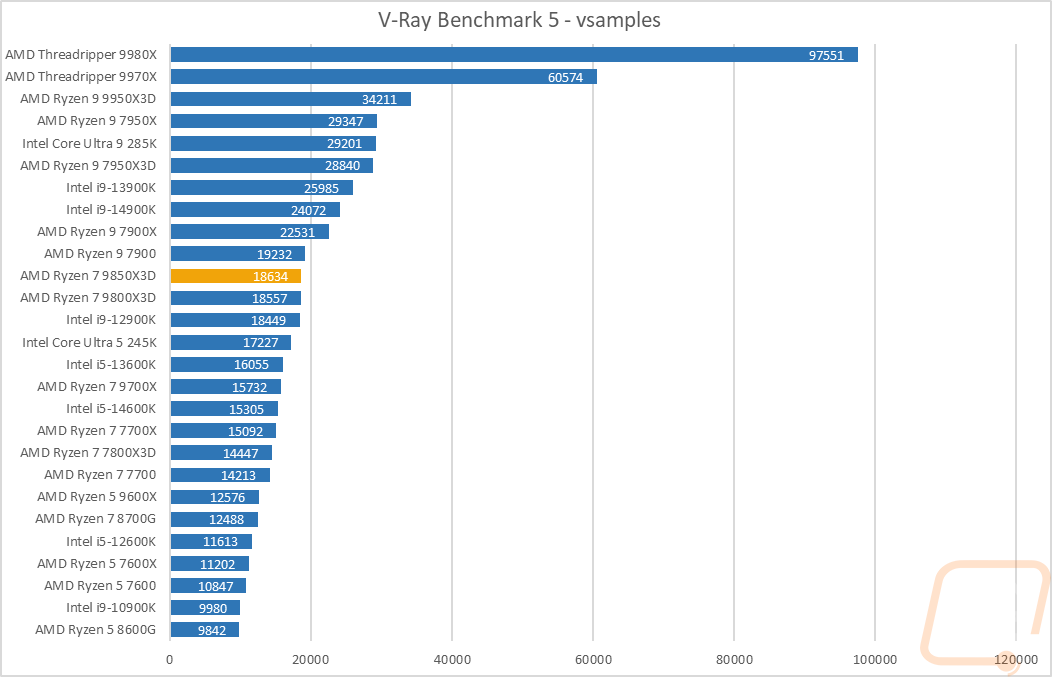
Next up, we have ray tracing-focused rendering benchmarks. Here I tested the CPUs in POV-Ray and V-Ray Benchmark 5. POV-Ray was also tested with a single core and across all of the cores. The Ryzen 7 9850X3D performed similarly to what we saw with Cinebench here. It’s basically on par with the 98000X3D in the multi-threaded test, but stands out significantly with the single-core test. V-Ray Benchmark was similar as well with the Ryzen 7 9850X3D just ahead of the 98000X3D but still sitting below the older 7900 and 7900X, which are both 12-core CPUs.
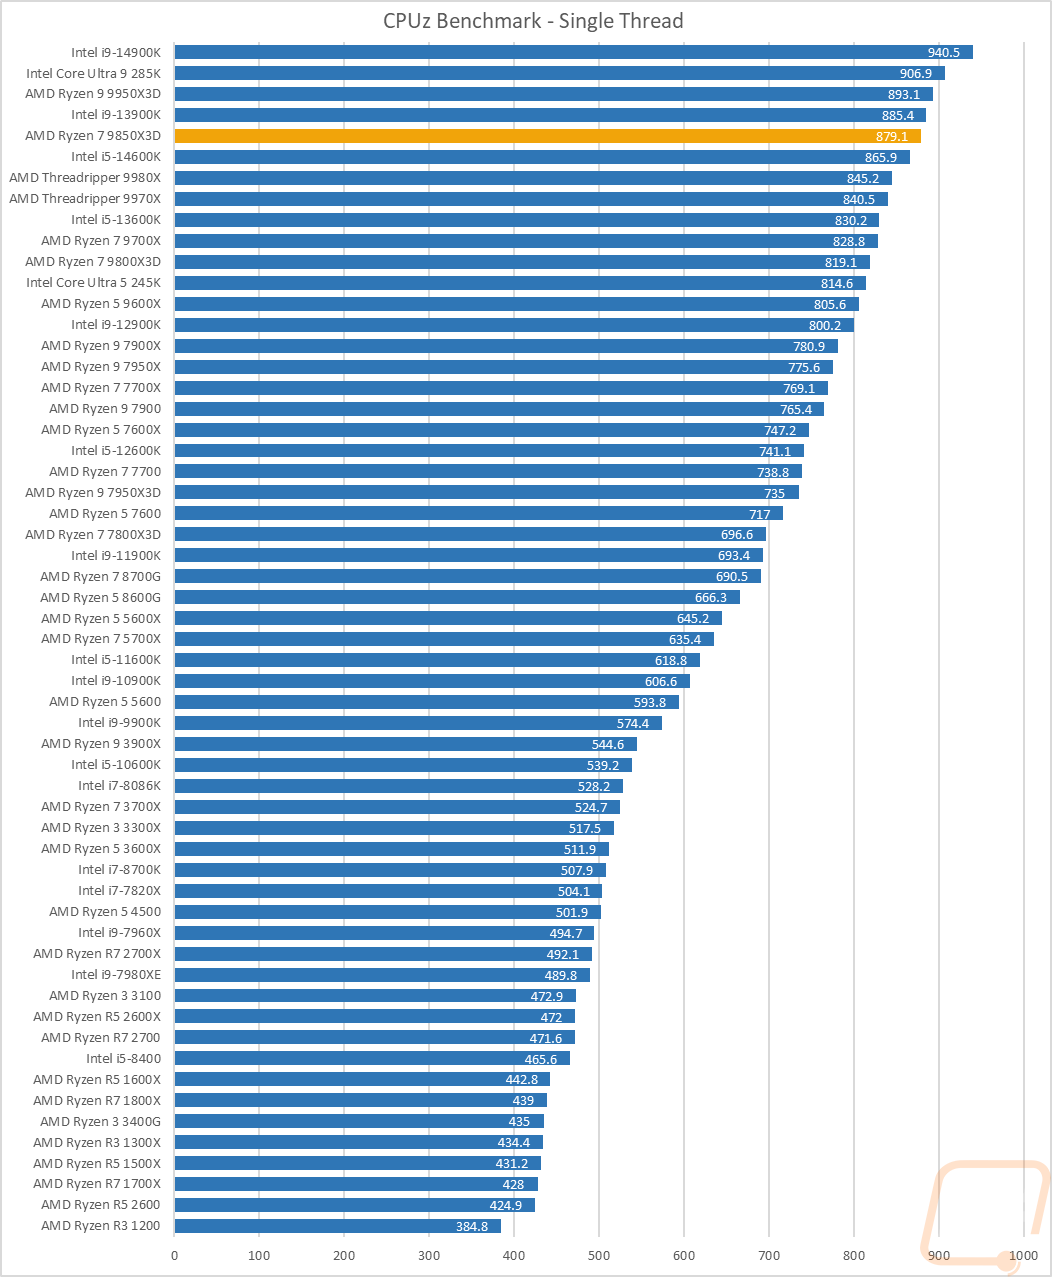
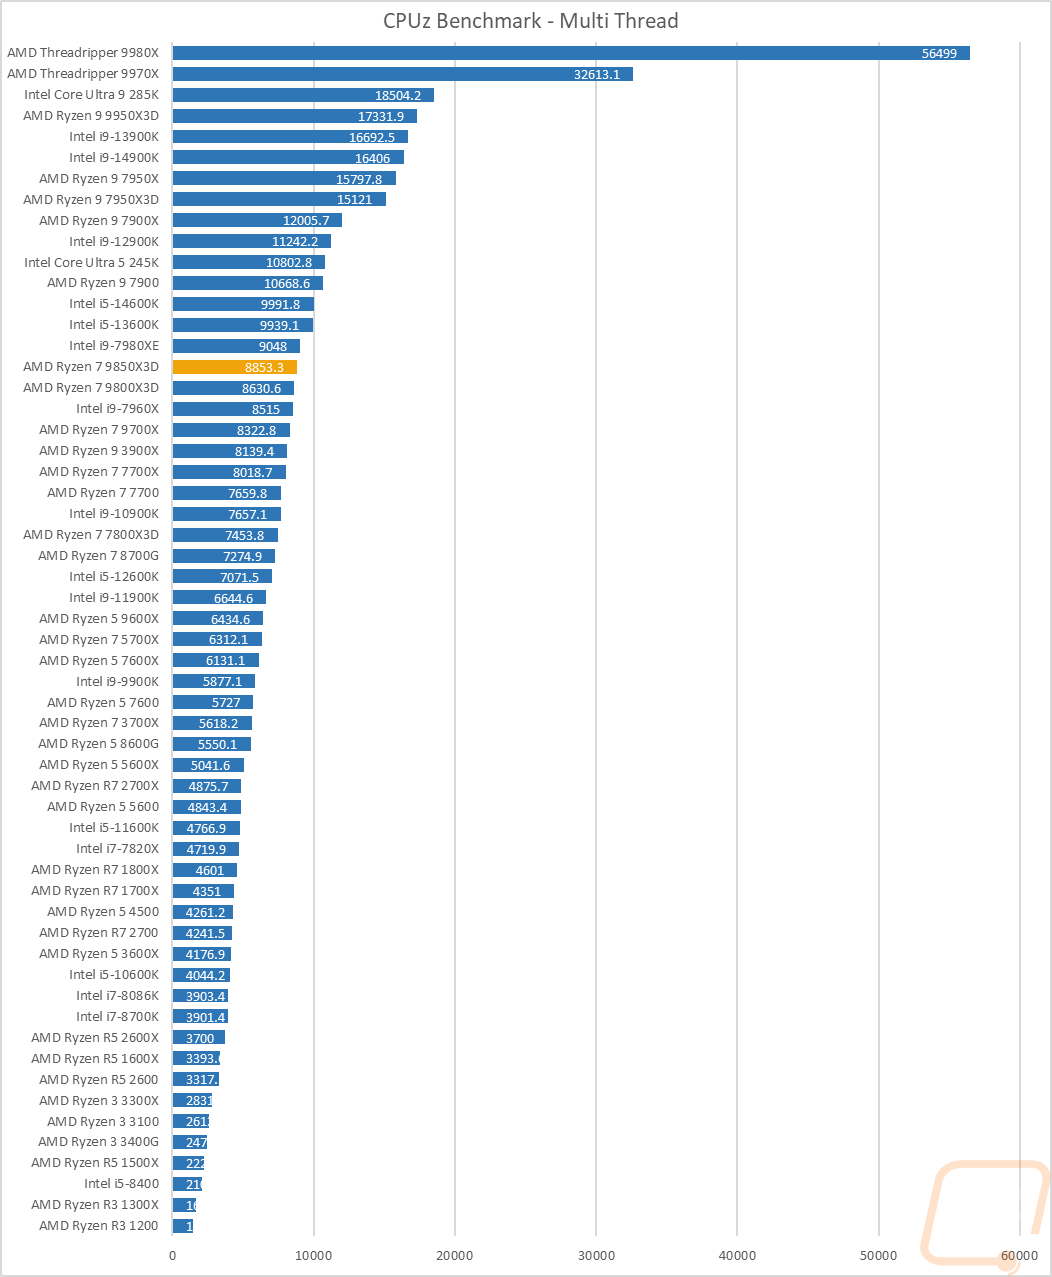
I also tested using the CPUz’s built-in benchmark, which runs on a single thread and with all threads. In the multi-thread test, the Ryzen 7 9850X3D is sitting ahead of the Ryzen 7 9800X3D, but with a little bit of a gap between the two. But once again, the single thread test is where we really see it excel with the Ryzen 7 9850X3D sitting up in the top five of the CPU tests and 60 points ahead of the 9800X3D.
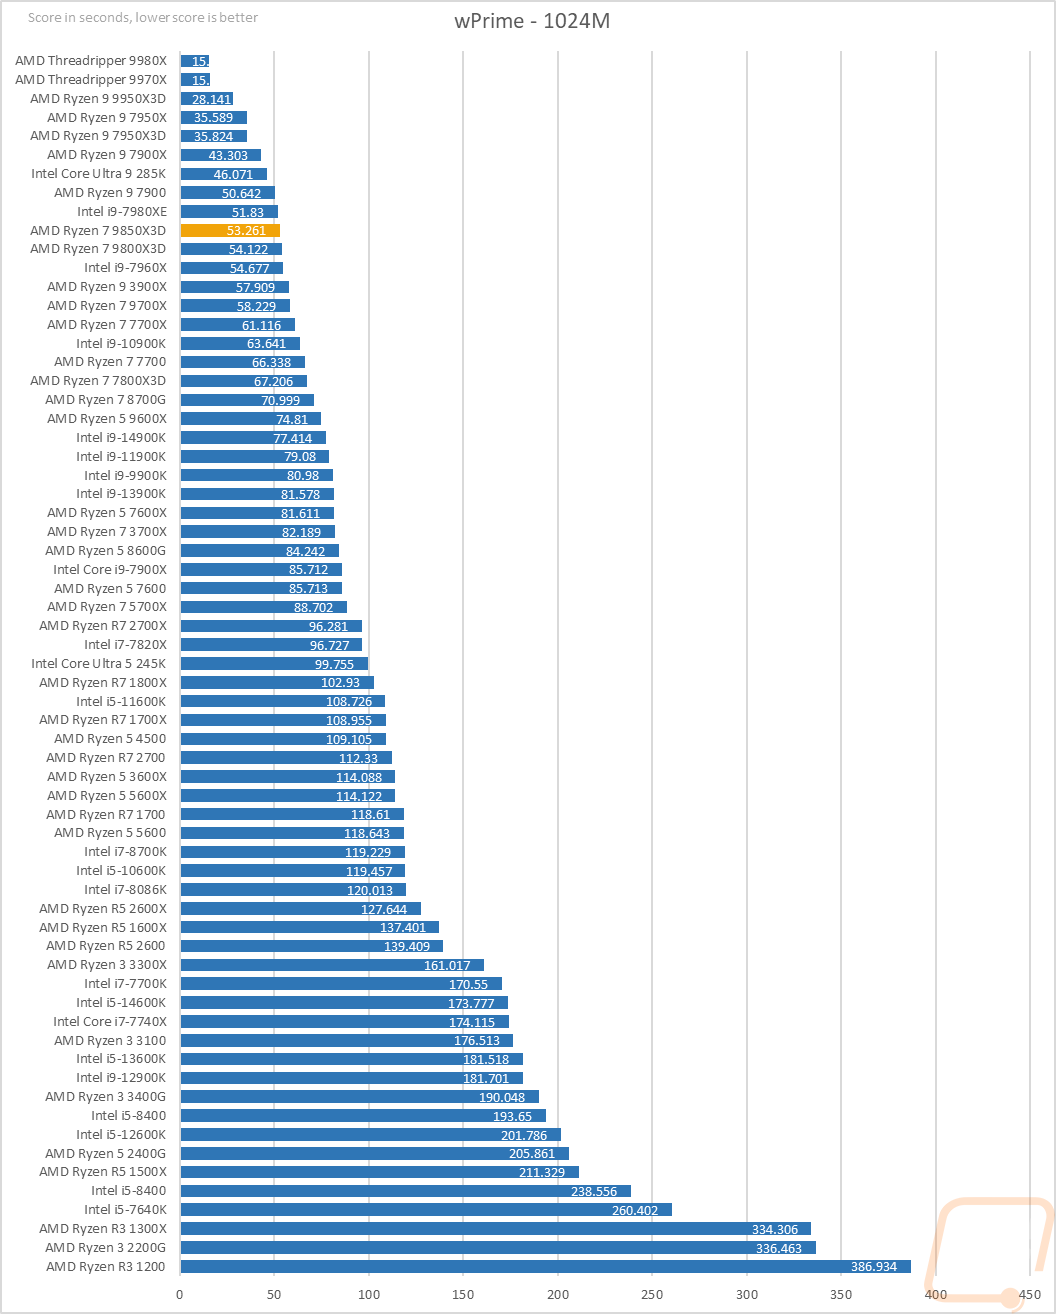
Next, we have wPrime, which is a classic overclocking benchmark that calculates pi out to 1024 million digits and is timed. This is a multi-thread heavy test which has the older high-core count CPUs still all over the top of the charts, and you can see that with the top CPUs sitting at 8 or more cores. The Ryzen 7 9850X3D finished the test in 53.261 seconds, which was almost 1 second faster than the 9800X3D, putting it in behind all of the 12-core and higher core count CPUs but at the top of the 8-core CPUs.
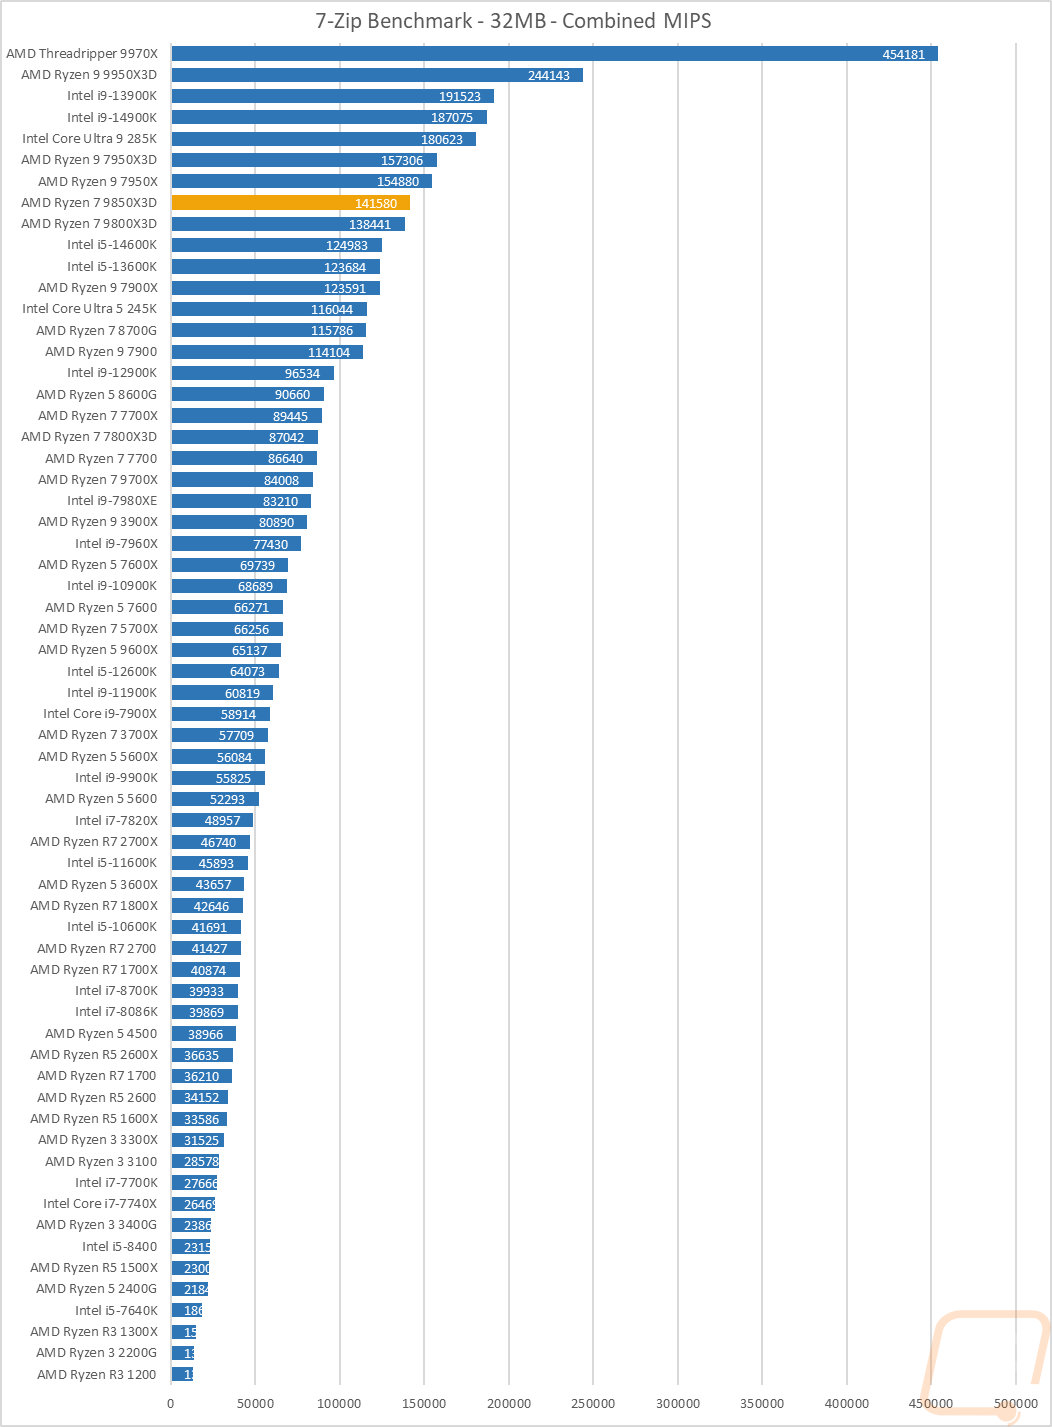
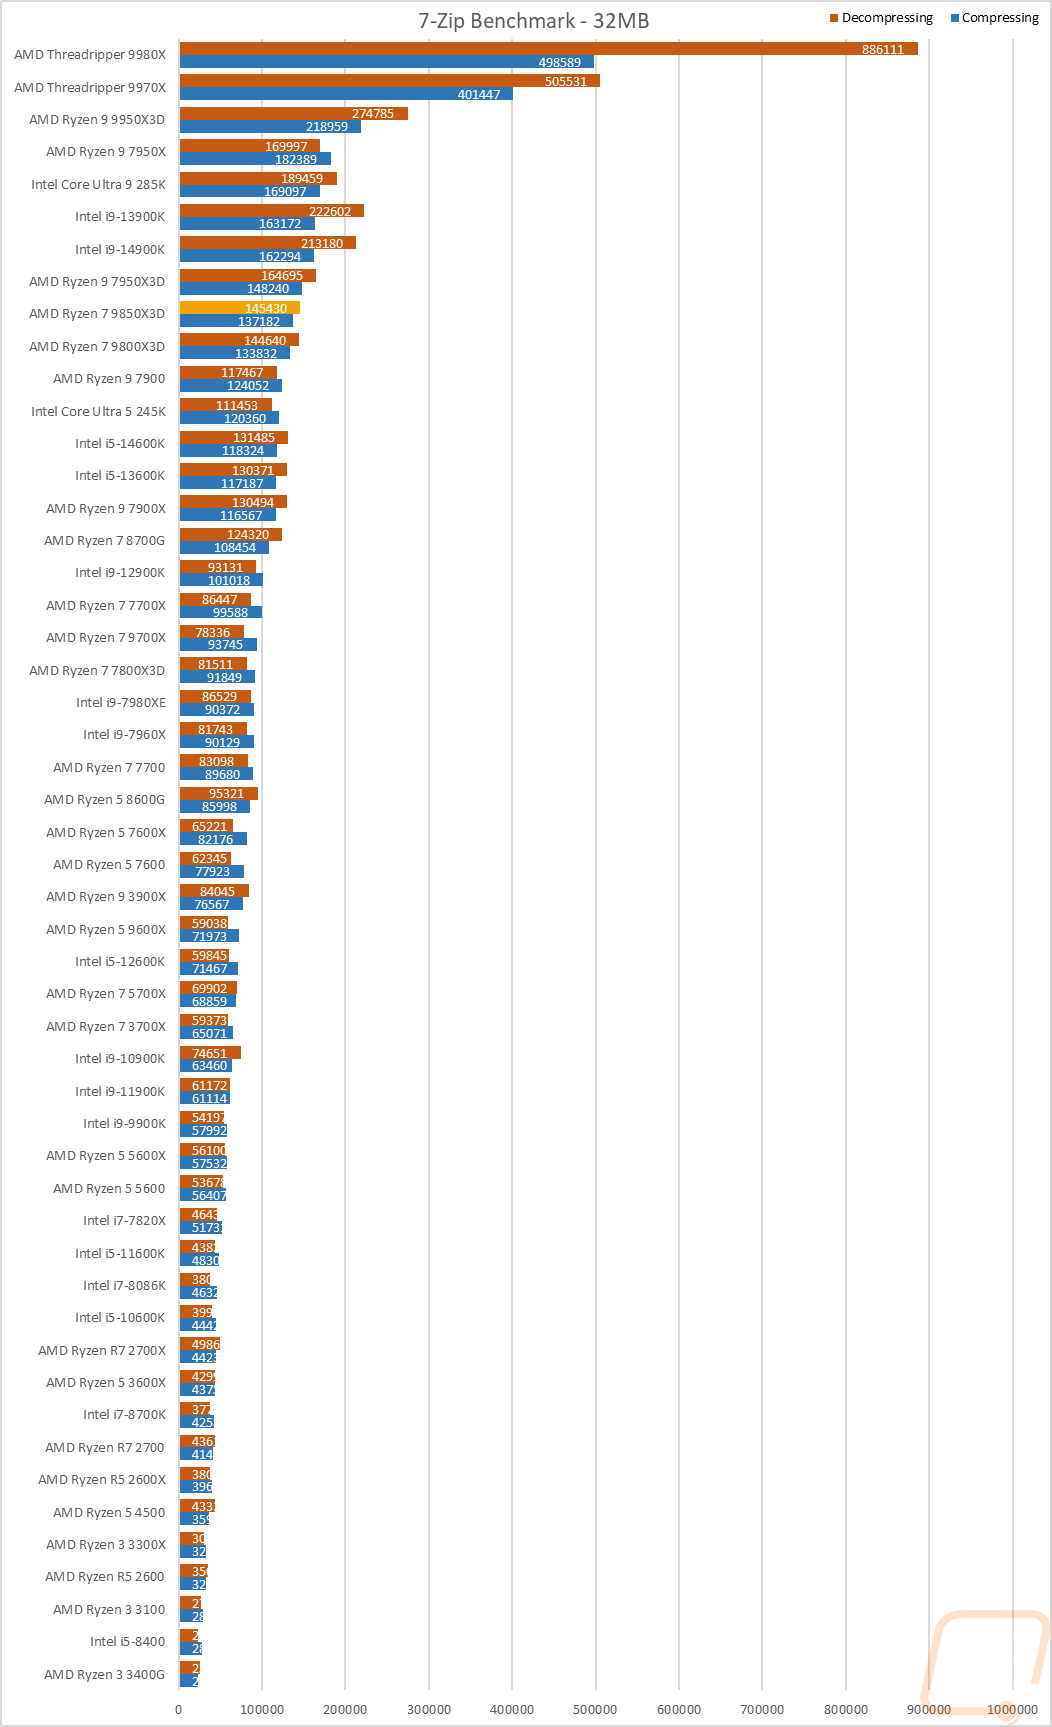
7 Zip is another open-source program, this time for compressing and decompressing all of your files. Here, I have run the benchmark and we have three results. The combined MIPS is a combination of compressing and decompressing performance. Then I have it broken down between the two. The combined results have the Ryzen 7 9850X3D sitting behind the older 16-core 7950X and ahead of the 9800X3D with a noticeable gap between those two. On the second chart, the decompressing results have the Ryzen 7 9850X3D ahead of the 9800X3D by 1000 points and 3500 points on the compressing results.
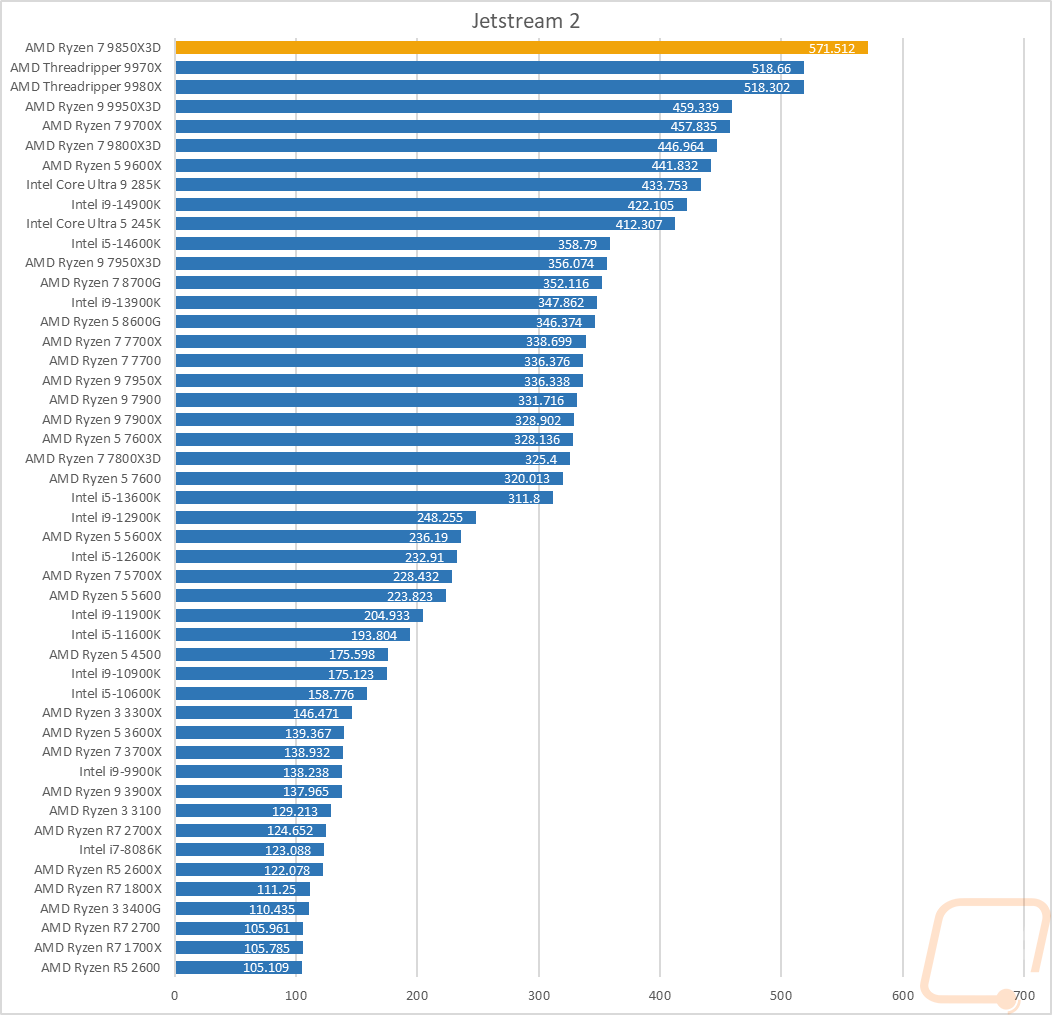
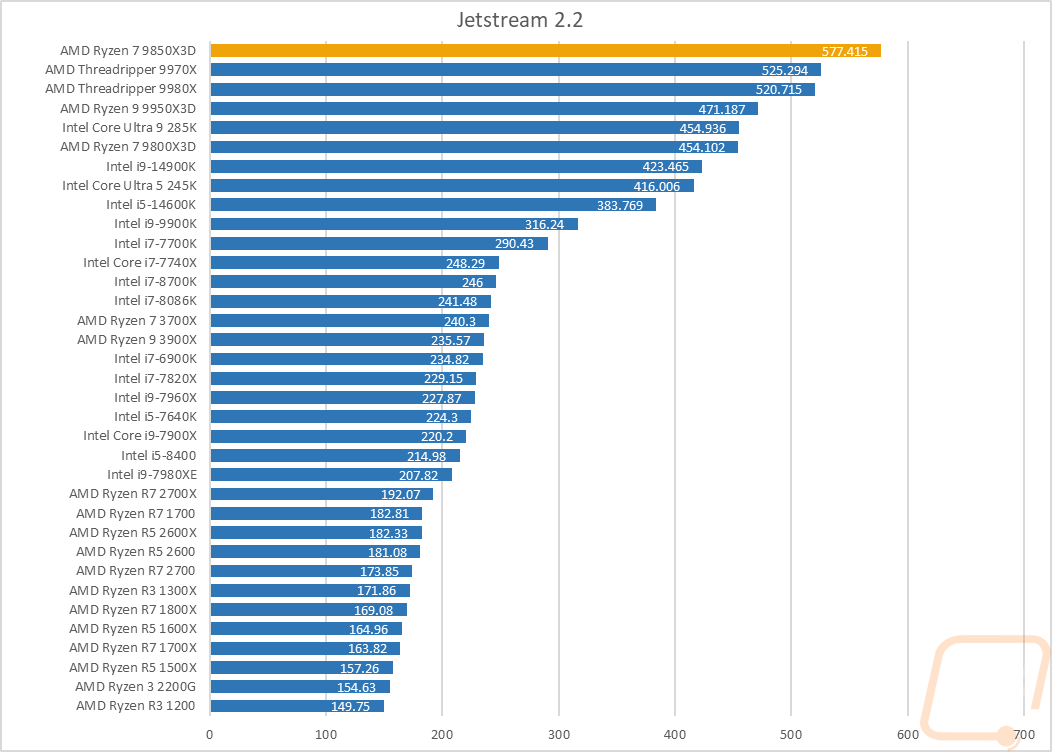
Jetstream is a compilation benchmark that takes a long list of HTML5 and Java in-browser tests and runs them all three times to put together an overall score. I love this benchmark because let's be honest, most people are using their browser more than any other game or program. Jetstream gives some interesting results sometimes but it tends to prefer high IPC or single-core performance and there are some situations where it prefers lower core-count CPUs. In this case, the Ryzen 7 9850X3D did extremely well on both the 2.1 and 2.2 tests, sitting at the top of the chart with both tests and not by a small amount. The extra clock speed helps a lot here, but we may also be seeing the fruits of the drivers maturing here as well. Either way, though this is one of the tests that shows how web browsing may feel, I’m curious to see if we see similar results in the other tests later.
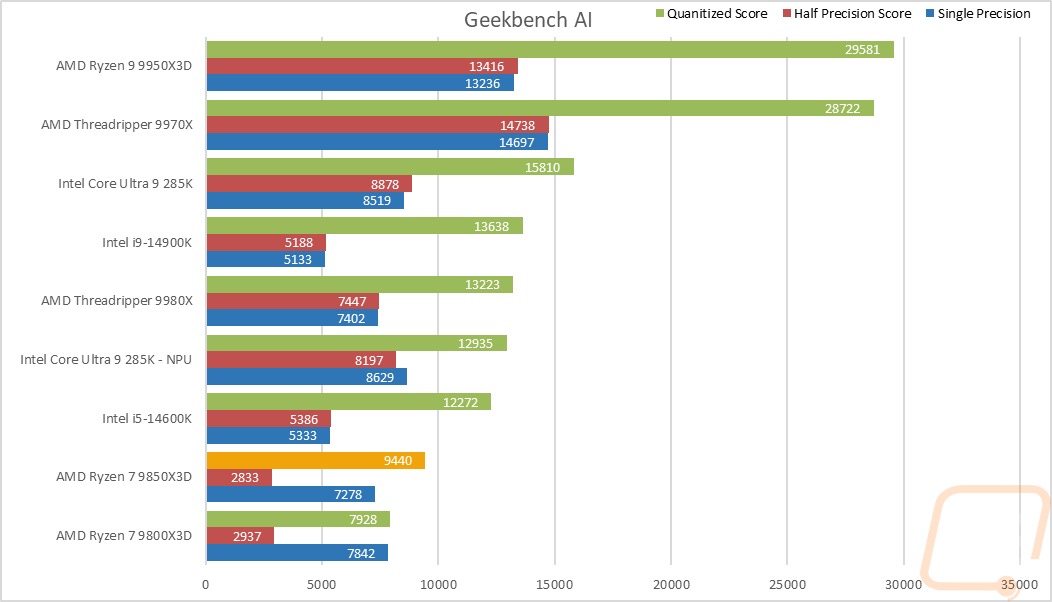
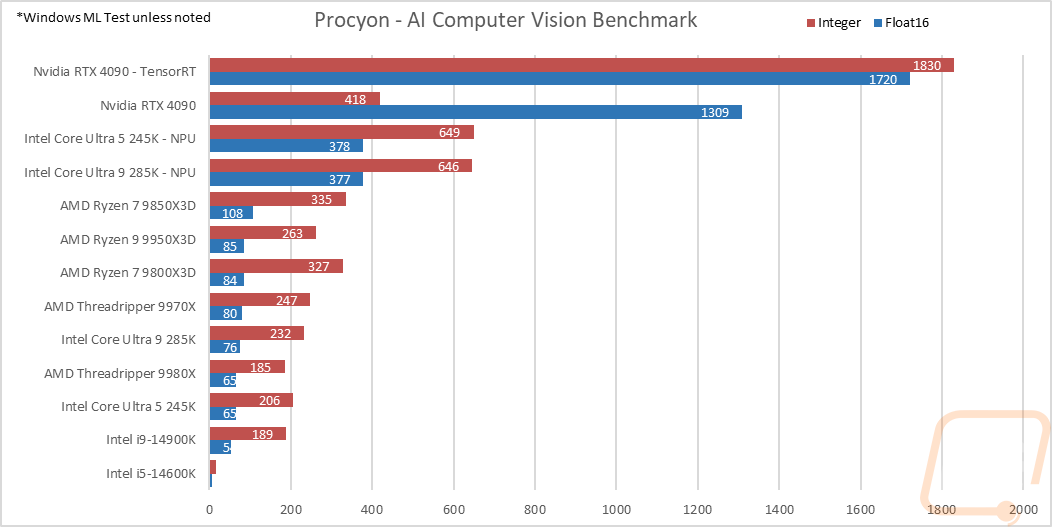
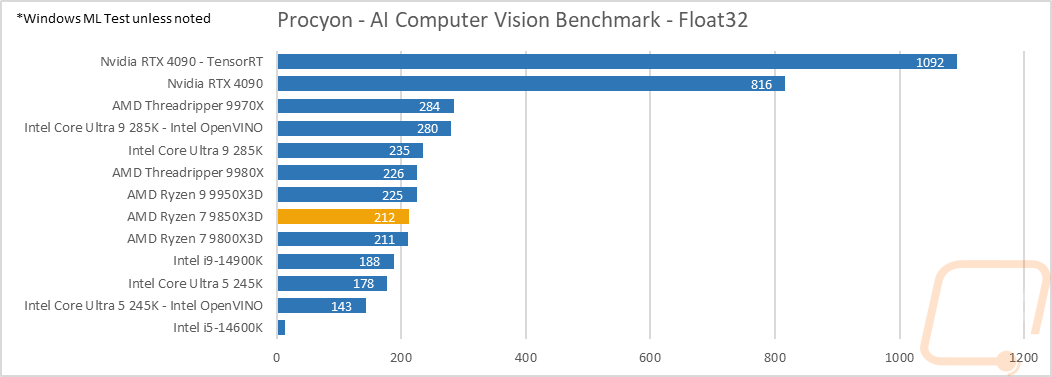
AI has been the big buzzword, I have to include some testing there as well. I have tested with Geekbench AI and Procyon’s Computer Vision Benchmark. The Geekbench AI test looks at single and half-precision performance with scores for each and a quantized score as well. They test using 10 different workloads to create their score. The Procyon AI Computer Vision Benchmark focuses on machine vision tests using neural network models like MobileNet V3, Inception V4, YOLO v3, DeepLab V3, Real-ESRGAN, and ResNet 50. I test those using the Windows ML setting, and in cases that support it, I test built-in NPUs as well. I have also included Windows ML and TensorRT results using an RTX 4090, as well as a reference point where these CPUs compare to a high-end GPU. For Geekbench AI, the Ryzen 7 9850X3D does come in sitting ahead of the 9800X3D, but we do see that with the quanitized result, it takes a big step forward but interestingly dropped down slightly with the single precision result. With Procyon, the Ryzen 7 9850X3D improved on what the 9800X3D did in both the integer and Float16 tests, enough so that it jumped ahead of the 9950X3D. The Float32 results on the other hand have them just one point apart.
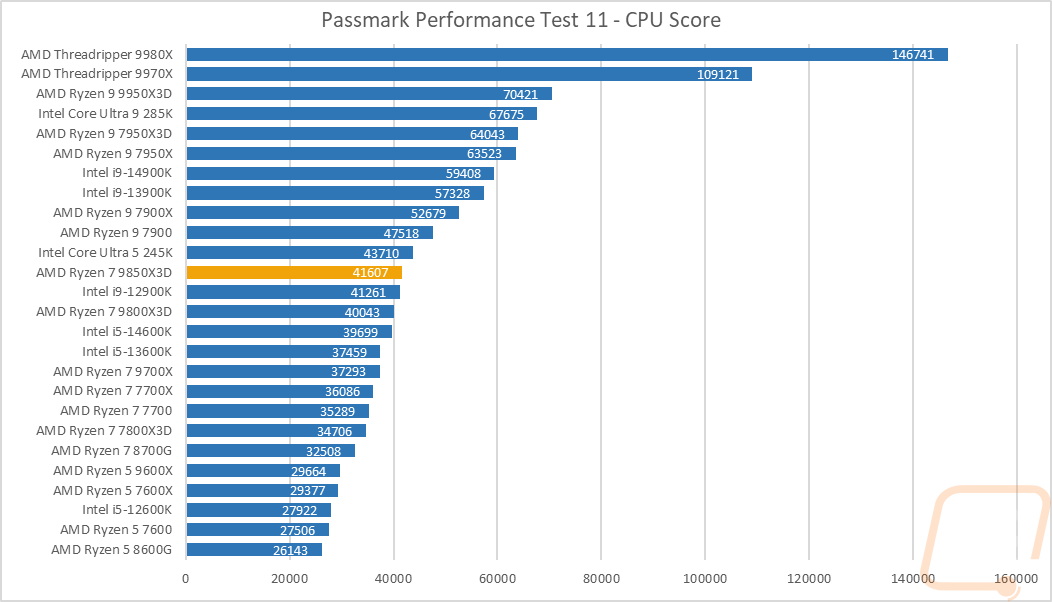
For Passmark Performance Test I used the latest version, Performance Test 11. I only look at the overall CPU score, which takes a few different synthetic benchmarks and combines the results to put together an overall score. This is a test that favors multi-threaded performance over IPC. In Performance Test 11, the Ryzen 7 9850X3D improved on the 9800X3D’s score by 1600 points, pushing it up over the 12900K as well.
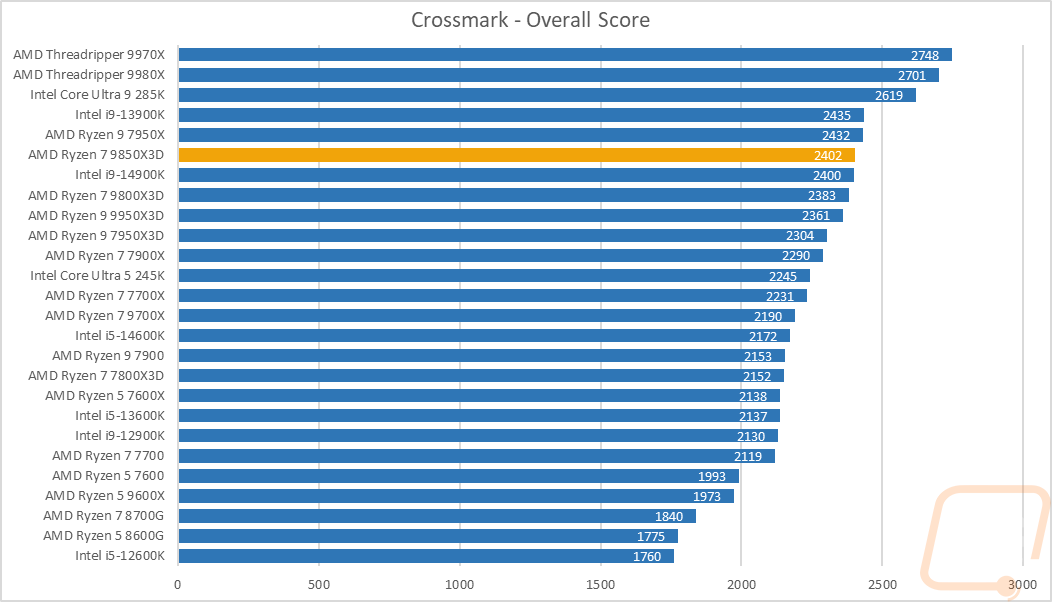
Crossmark is from BAPCo, which also makes SYSmark, and this is a cross-platform test where you can compare performance between phones and both Windows and Mac computers. This is the start of our overall PC benchmarks, and Crossmark uses a mix of real-world tests to output an overall score. The Ryzen 7 9850X3D scored a 2402, putting it in over the 14900K and the 9800X3D as well.
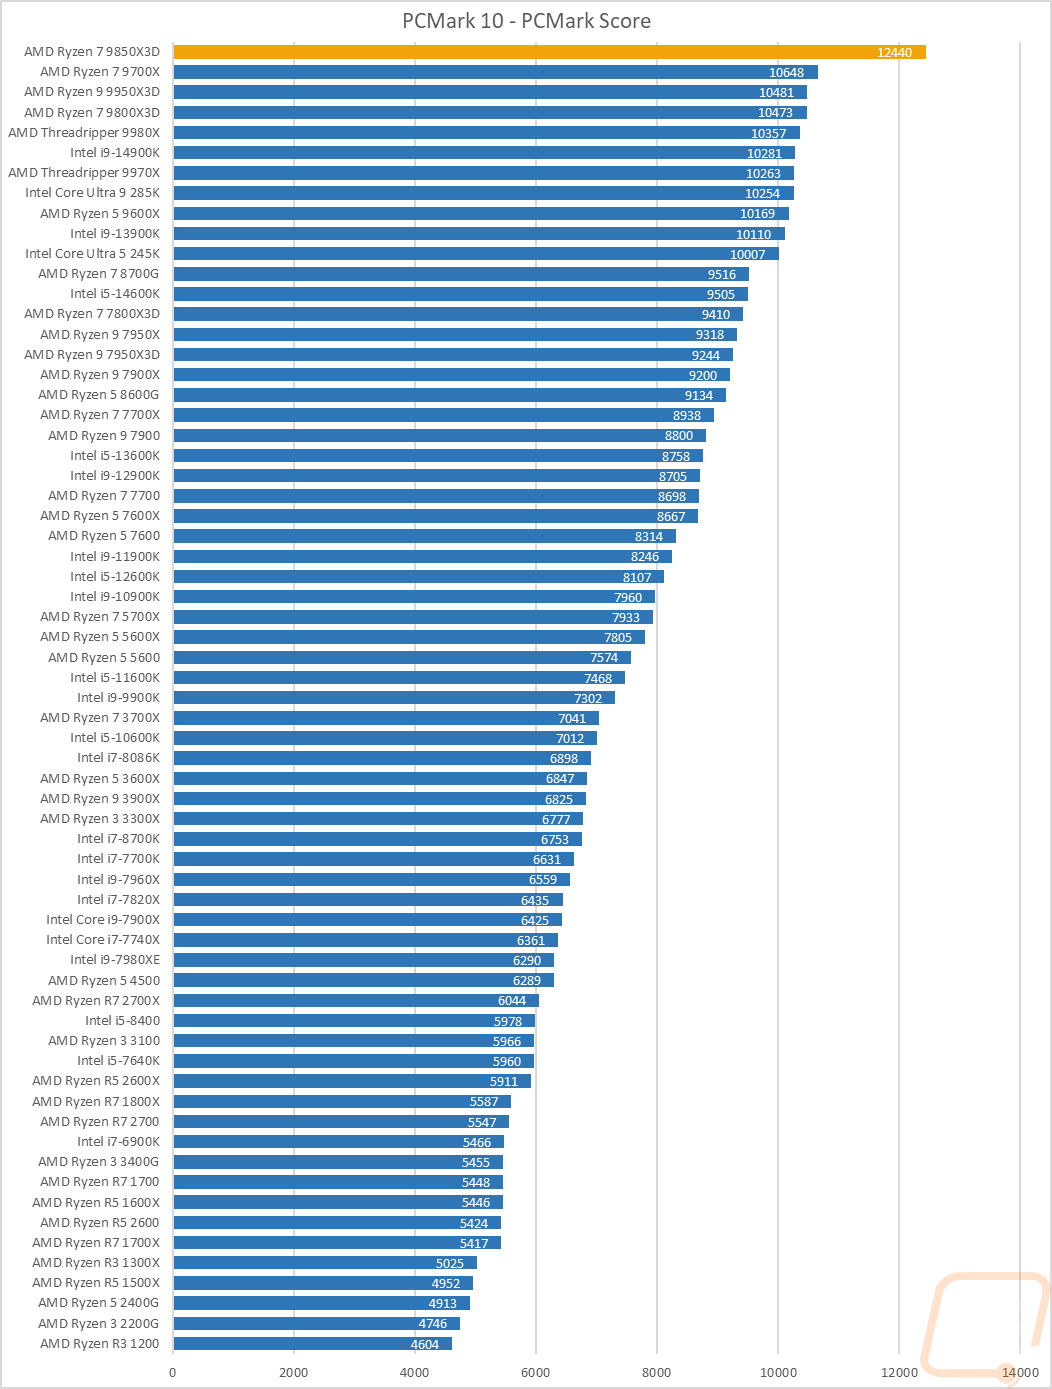
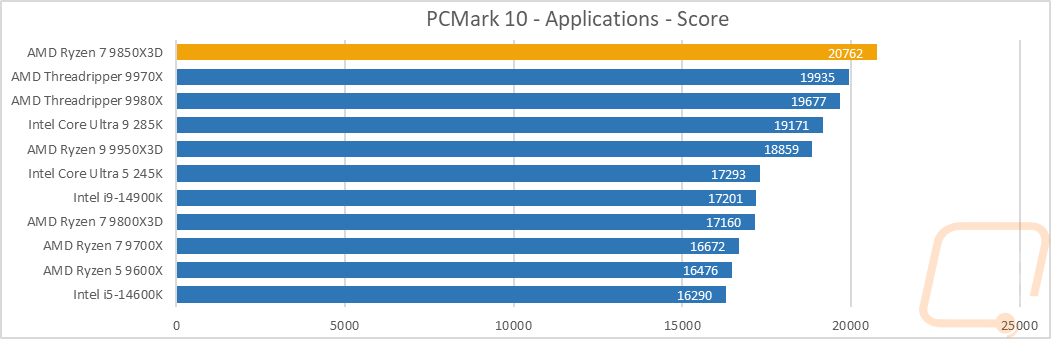
PCMark 10 is a great test because it tests things like video calls, browser performance, Excel, and Word performance to give an idea of real-world performance. It tends to like higher clock speeds, but does take raw core count into account as well, which you can see. The Ryzen 7 9850X3D did very well here, and this is partially showing us how much the drivers have improved, but the increased boost clock speeds are helping here as well. The same goes for the PCMark Applications test results, and those results are the most interesting to me because they are using real-world applications. The Ryzen 7 9850X3D with its clock speed and the 3D V-Cache performed really well with Microsoft Office.
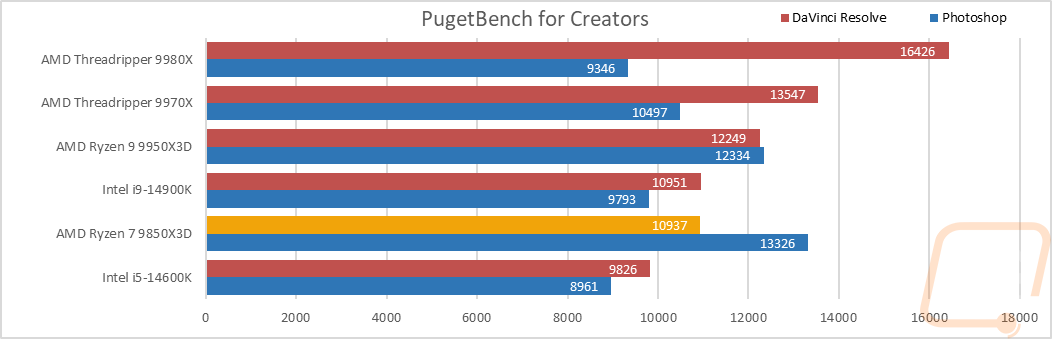
The PugetBench for Creators is another real-world benchmark using the most current version of DaVinci Resolve, as well as Adobe Photoshop, which for me, are both programs I use often for editing my photos for this and with DaVinci I use it for editing videos on other non-LanOC related content as well. With that in mind, performance in both are very important for me, and the results for the Ryzen 7 9850X3D were interesting. I have the graph sorted with the DaVinci Resolve results, and those matched the 14900K and are a little behind the 9950X3D, but the Photoshop results have the Ryzen 7 9850X3D doing even better!
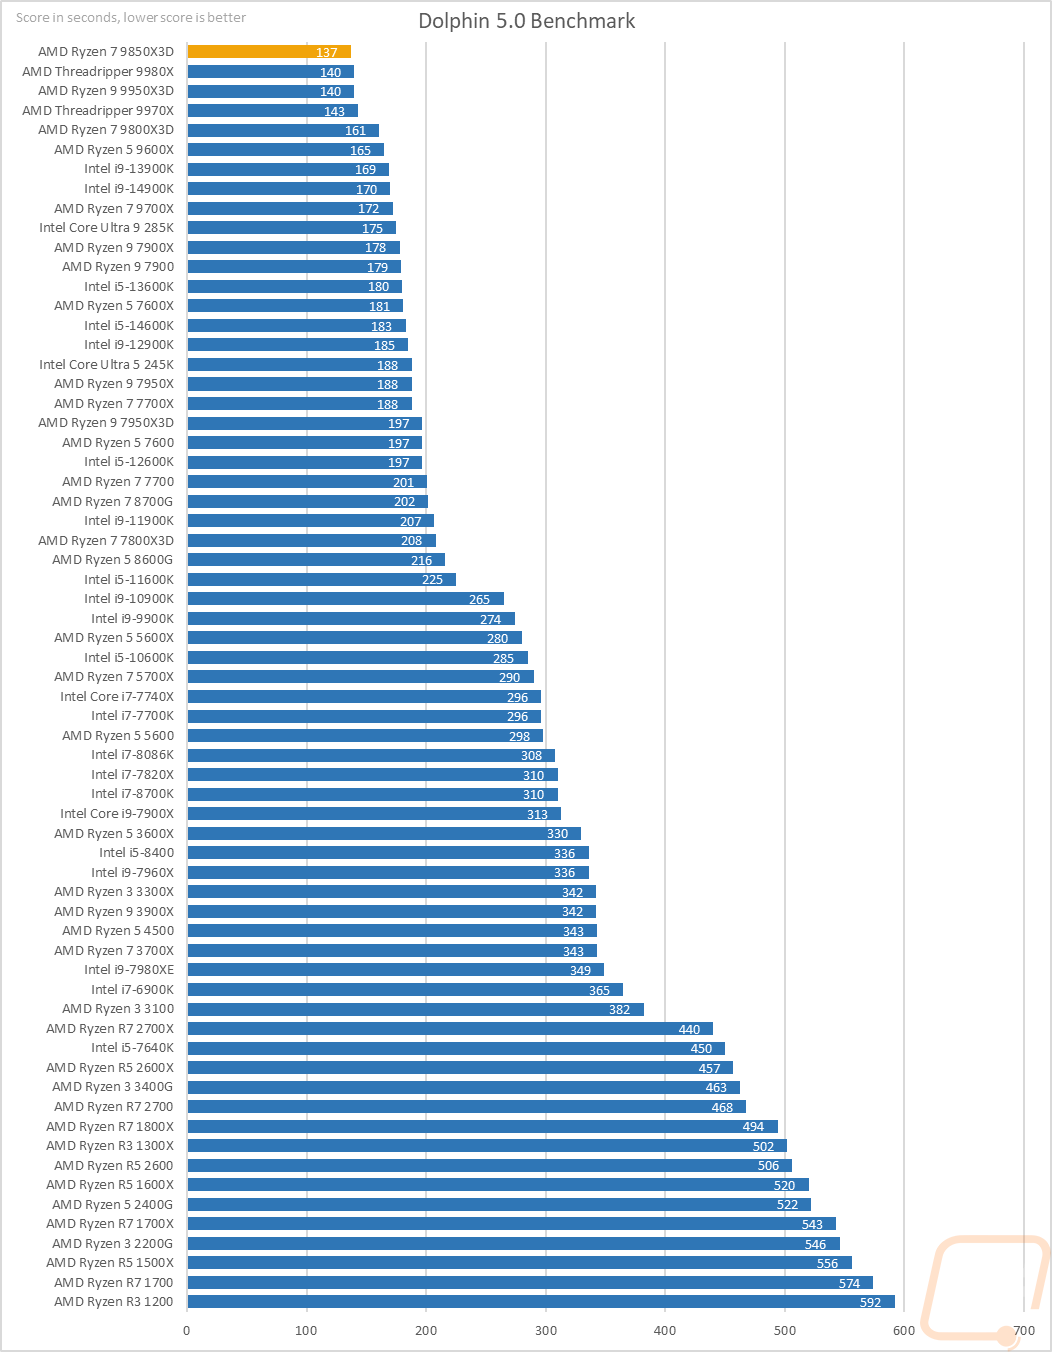
Moving the focus over towards gaming, my next test is using Dolphin 5.0 Benchmark. Dolphin 5.0 is a Wii emulator and like most emulators, it doesn’t care about high core counts at all. In fact, it only runs two in total. Clock speeds are king here most of the time, which is why all of the 5 GHz+ CPUs are at the top of the chart here. The Ryzen 7 9850X3D, with its high boost clock speed and lower (in relation to the 9950X3D) core count topped the chart sitting ahead of the Threadripper 9980X by three seconds. This was 24 seconds faster than the 9800X3D even, but you will notice that AMD has the top of this chart completely dominated.
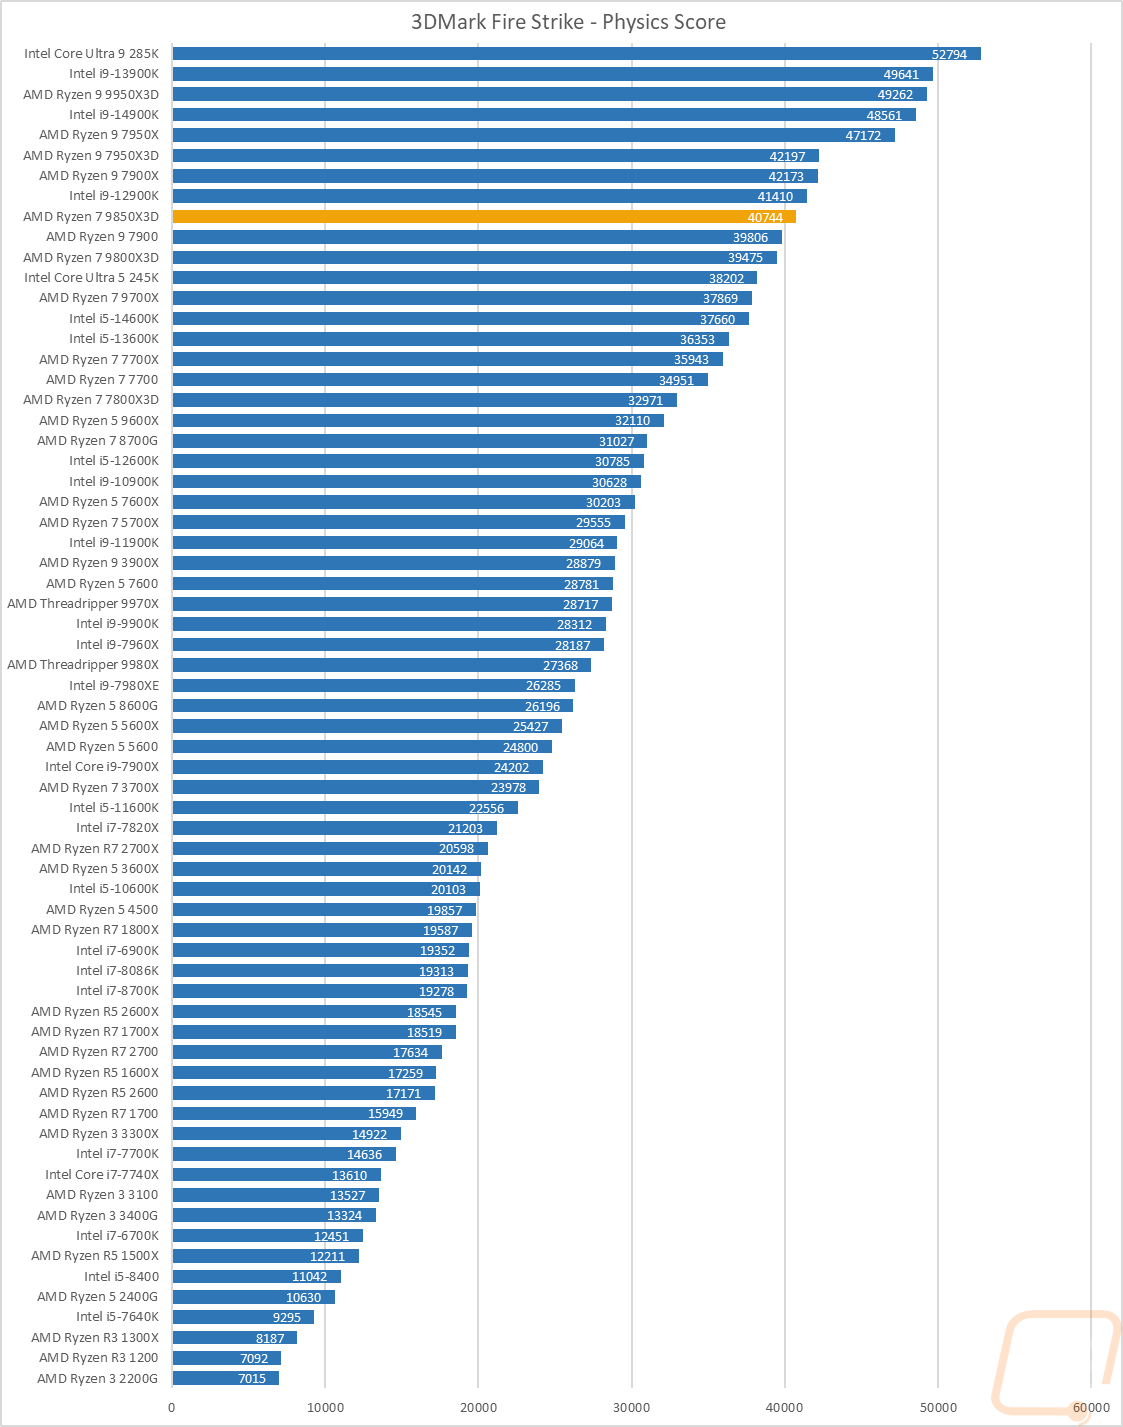
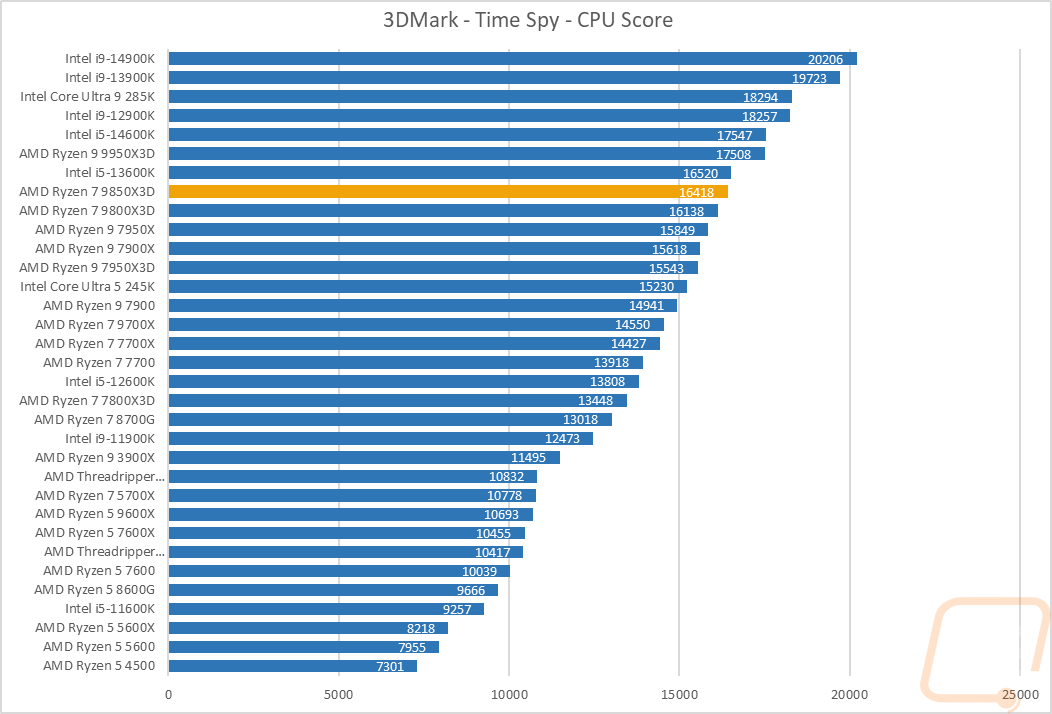
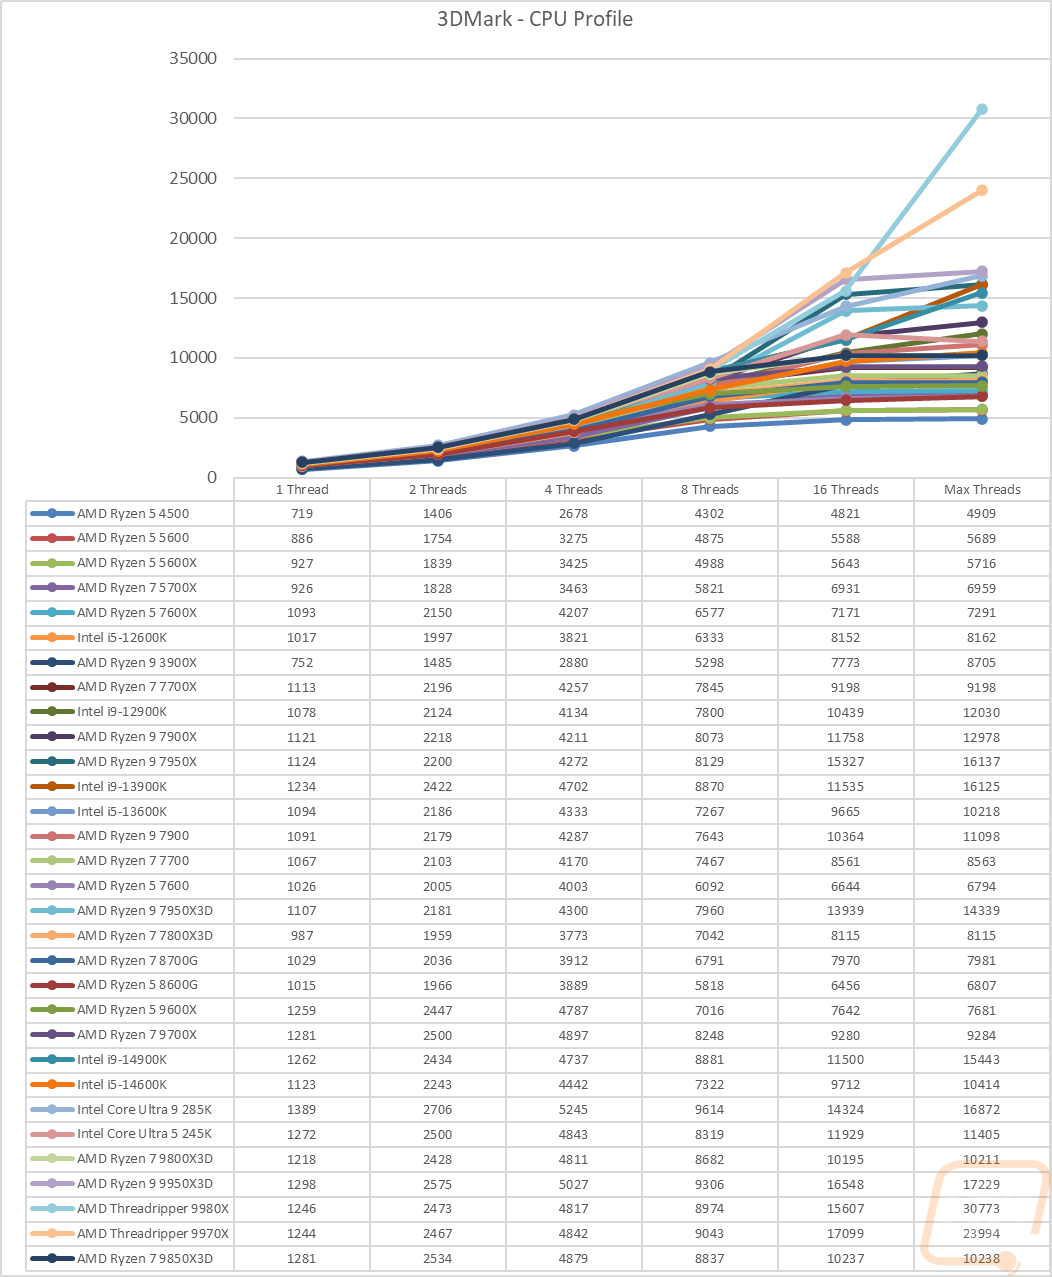
Before diving into game testing, I wanted to check out synthetic performance using 3DMark. I tested with the older DX11 Fire Strike test as well as the newer DX12 Time Spy. I also added the new 3DMark CPU Profile benchmark into the mix as well which does a good job of showing the full range of thread counts that you might see being used in games as well as a max threads option that does everything above 16 threads. In the Fire Strike test, the Ryzen 7 9850X3D scored a 40744, this was 1269 points over the 9800X3D but just below the 12900K. In Time Spy, the performance was similar with a nice margin over the 9800X3D, but still slightly down the chart and behind the 13600K this time. For the CPU profile at 1 thread, the Ryzen 7 9850X3D did well with just the 9950X3D and the 285K sitting ahead of it. As the threads get added in falls into the middle of the pack with all of the CPUs with more cores outperforming it in the 16-thread and max threads tests.
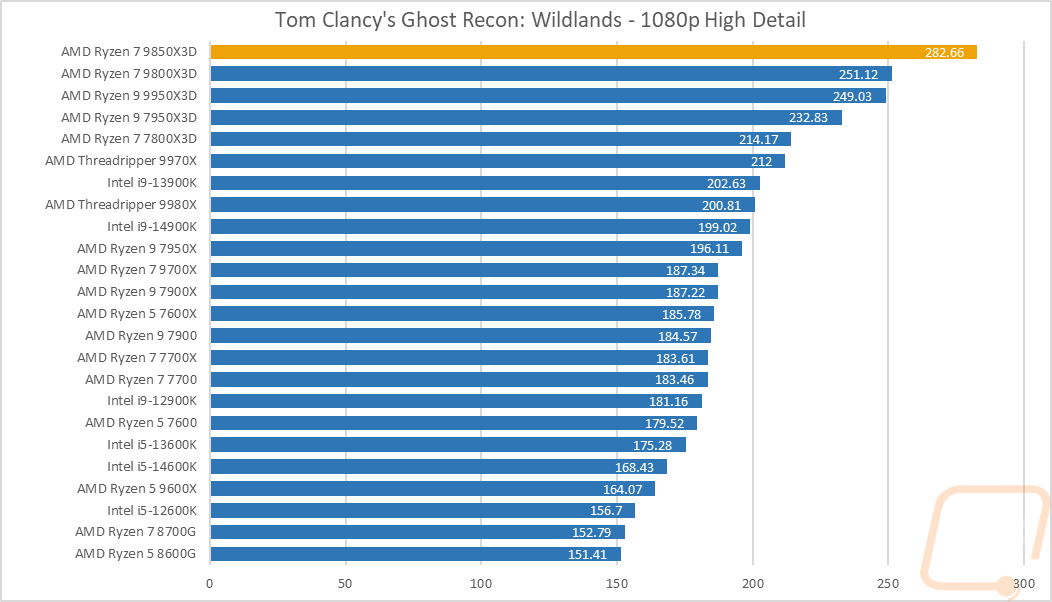
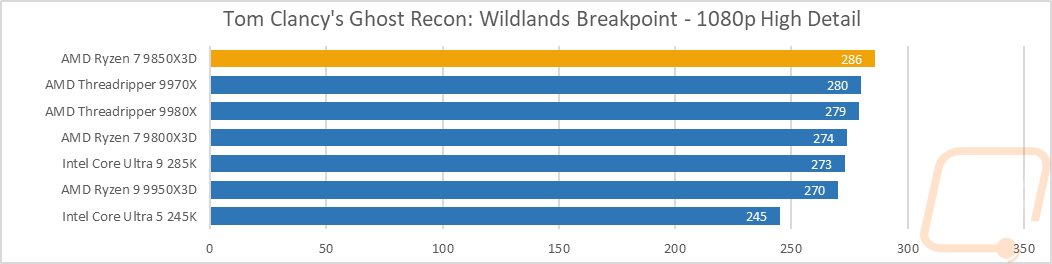
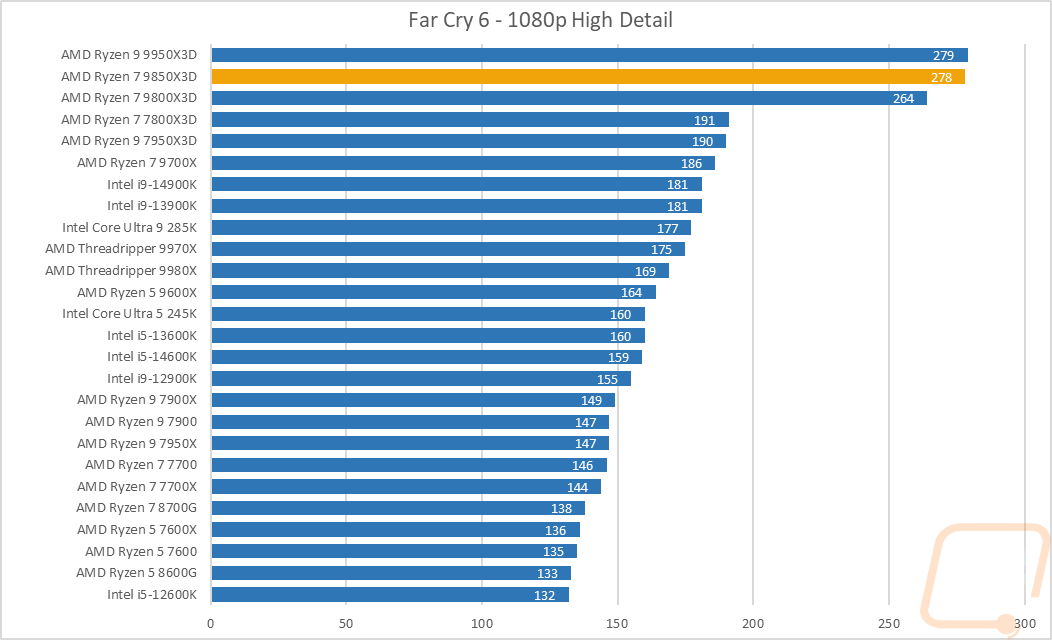
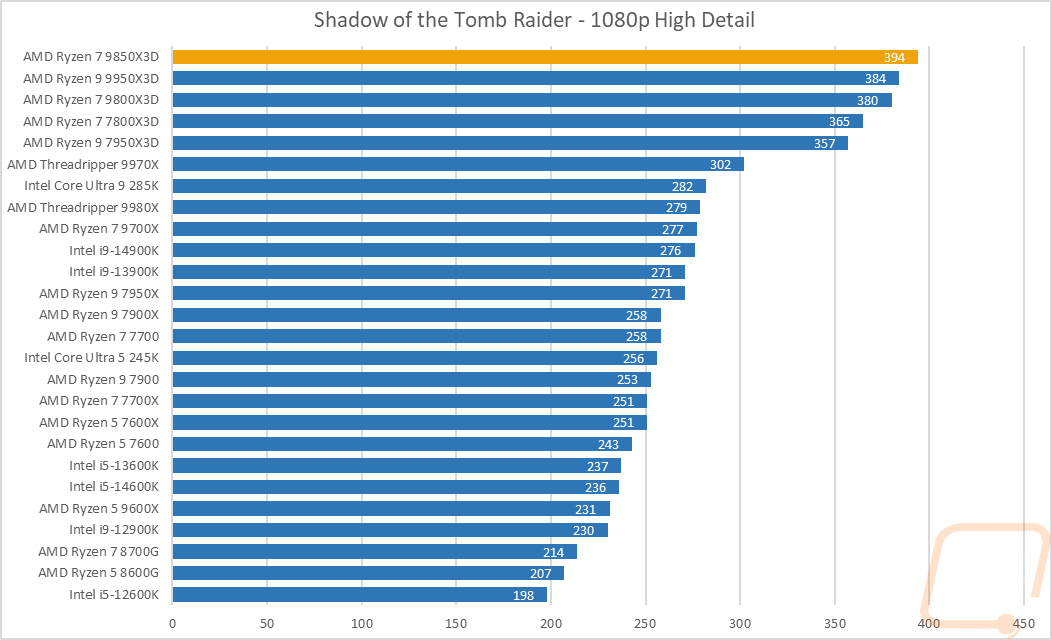
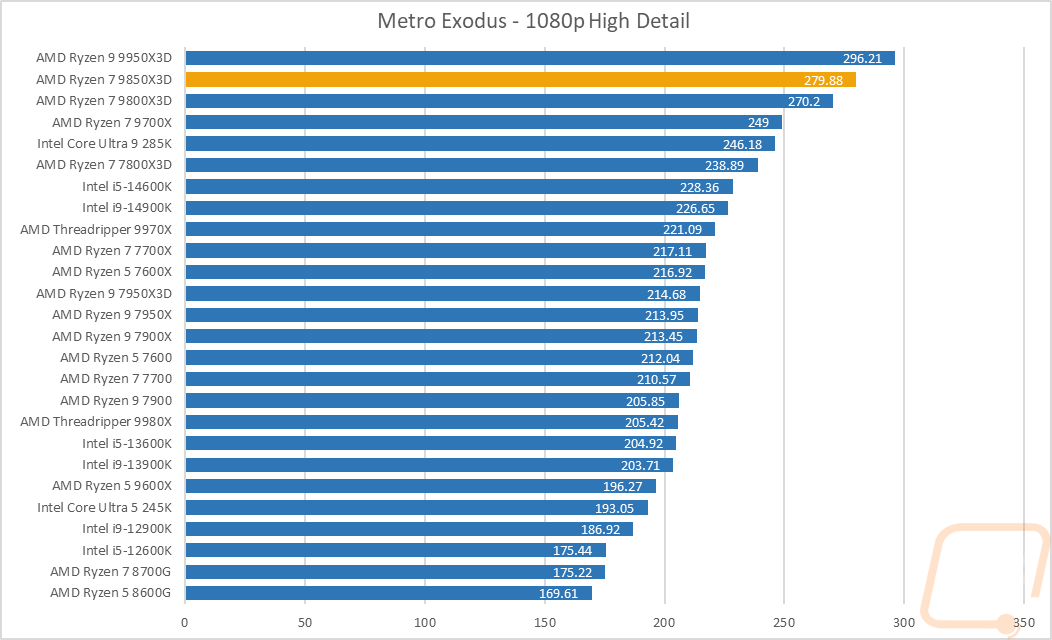
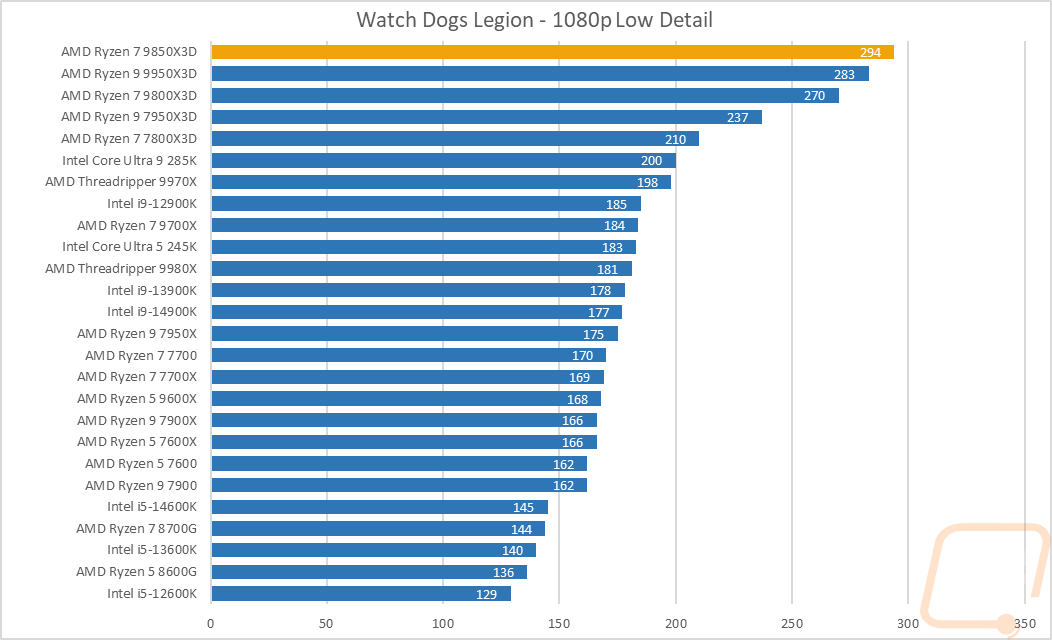
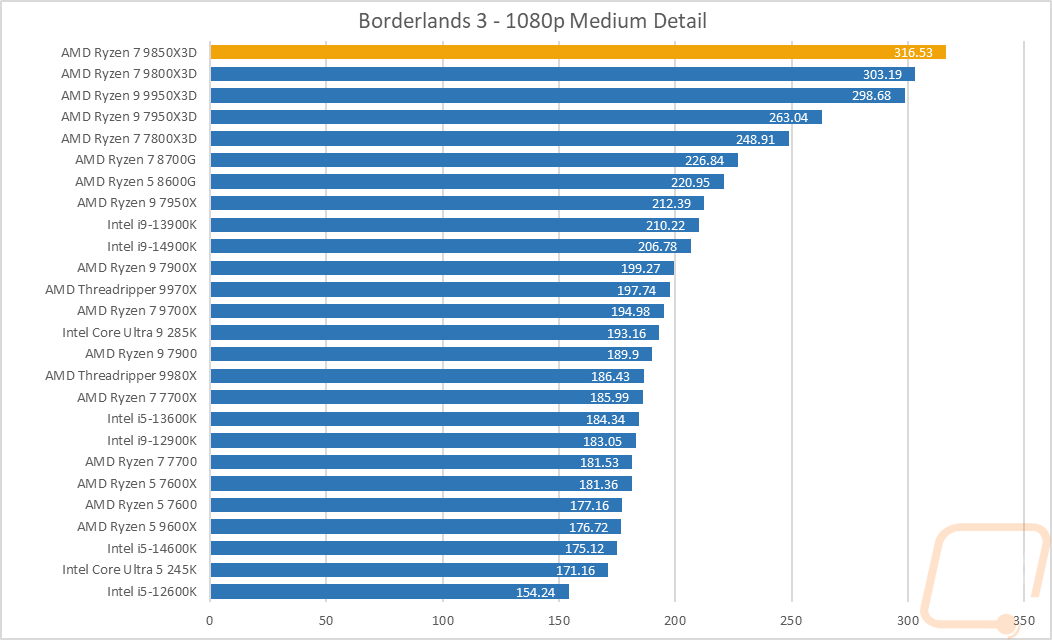
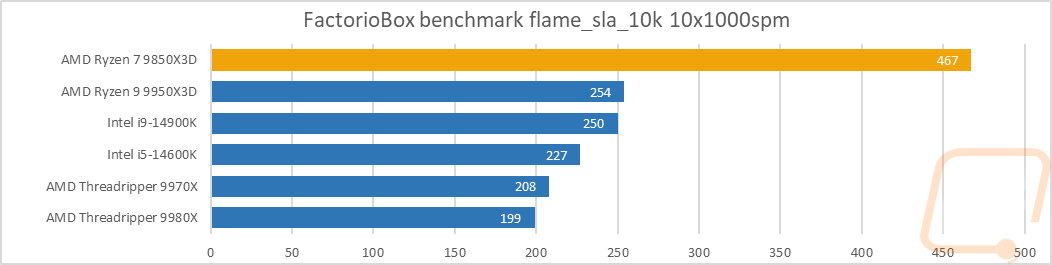
After that, I dove into in-game tests which for any 3D V-Cache CPU, like the Ryzen 7 9850X3D, is its bread and butter. Adding in the extra clock speed is just a bonus here, almost all of the games tested have all of the X3D CPUs filling up the top of their charts, and except for two, the Ryzen 7 9850X3D came in top in them all. AMD's claim of this being the new fastest gaming CPU is true, and when comparing it to what Intel has to offer, it isn’t even close.
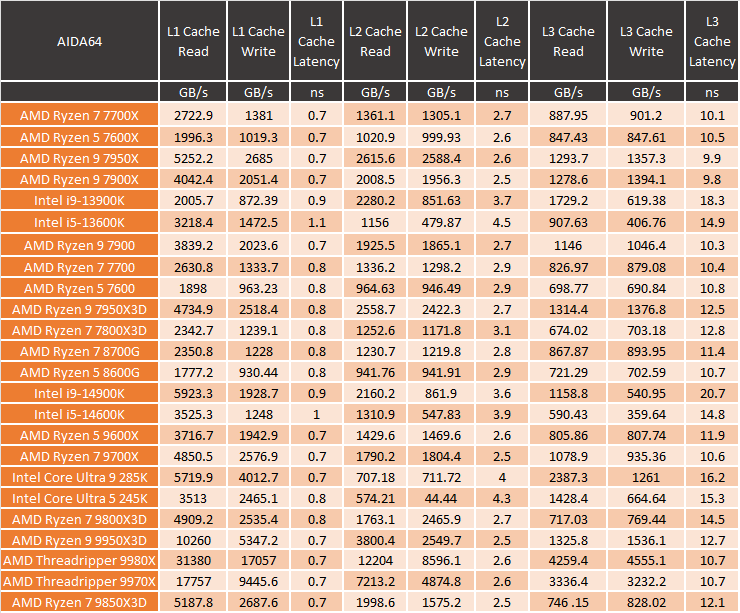
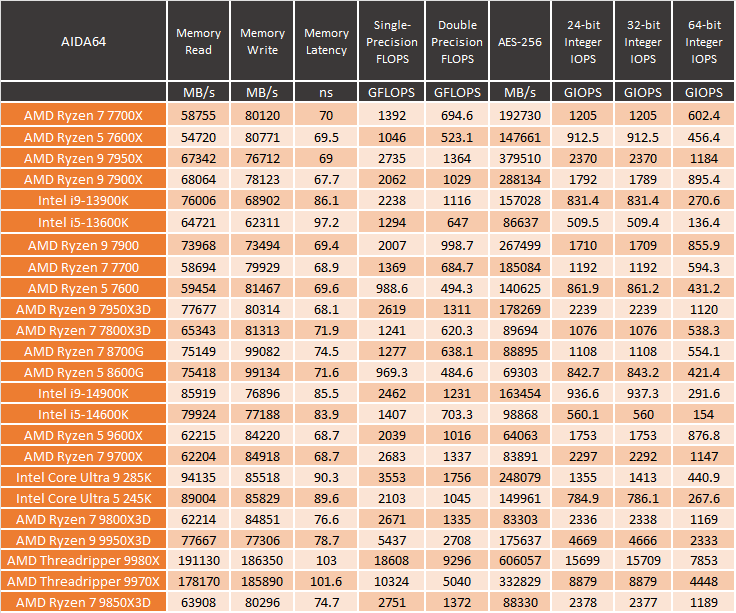
Lastly, I also ran the AIDA64 benchmarks as well. These give us a great look at a few aspects including the full range of cache performance, memory performance, and more. The Ryzen 7 9850X3D’s cache performance was a little better than the 9800X3D, which is interesting because they have the same cache size. That must be improvements in the driver in the time between those launches. The extra clock speed helped with the single and double precision FLOPS. But all of the IOPS tests are still about the same.