3DMark
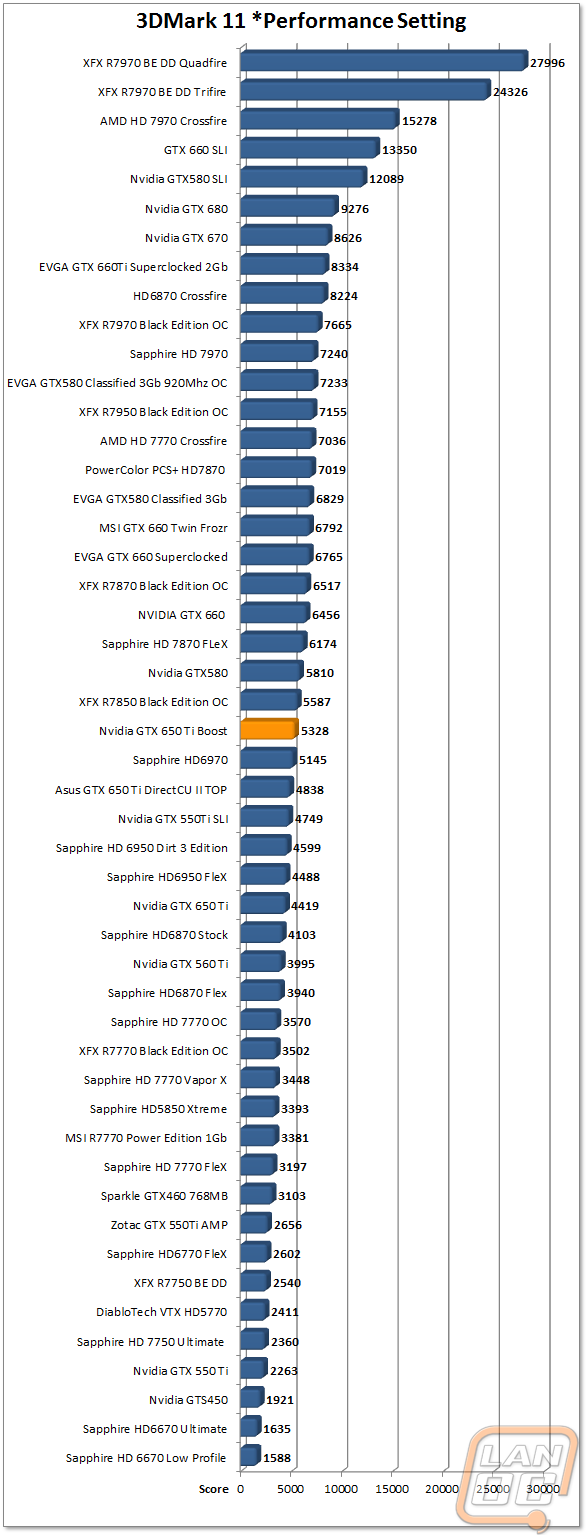
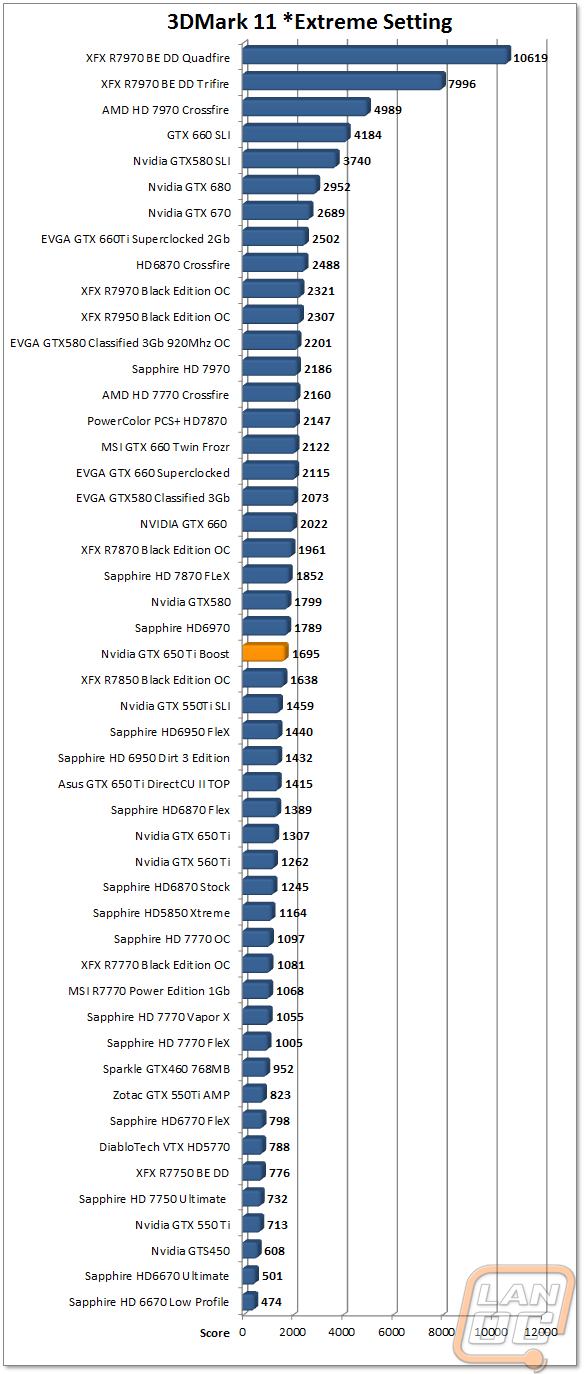
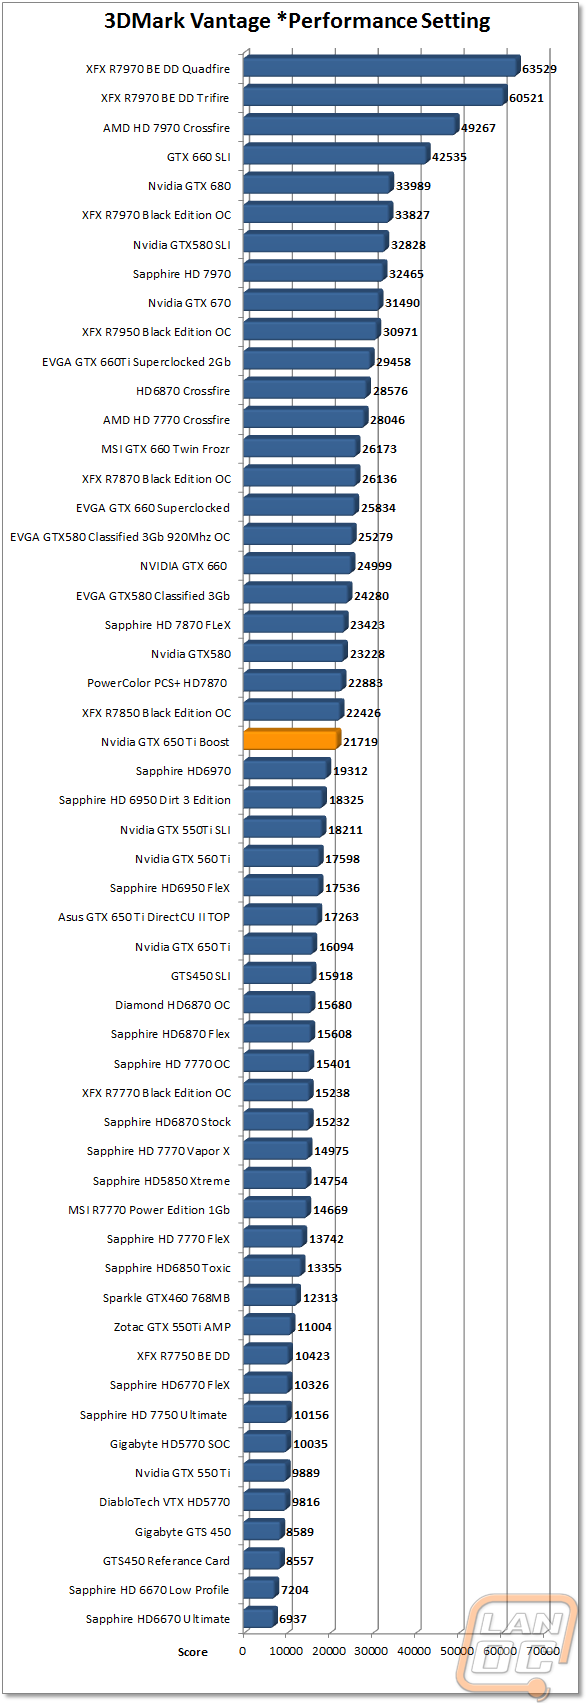
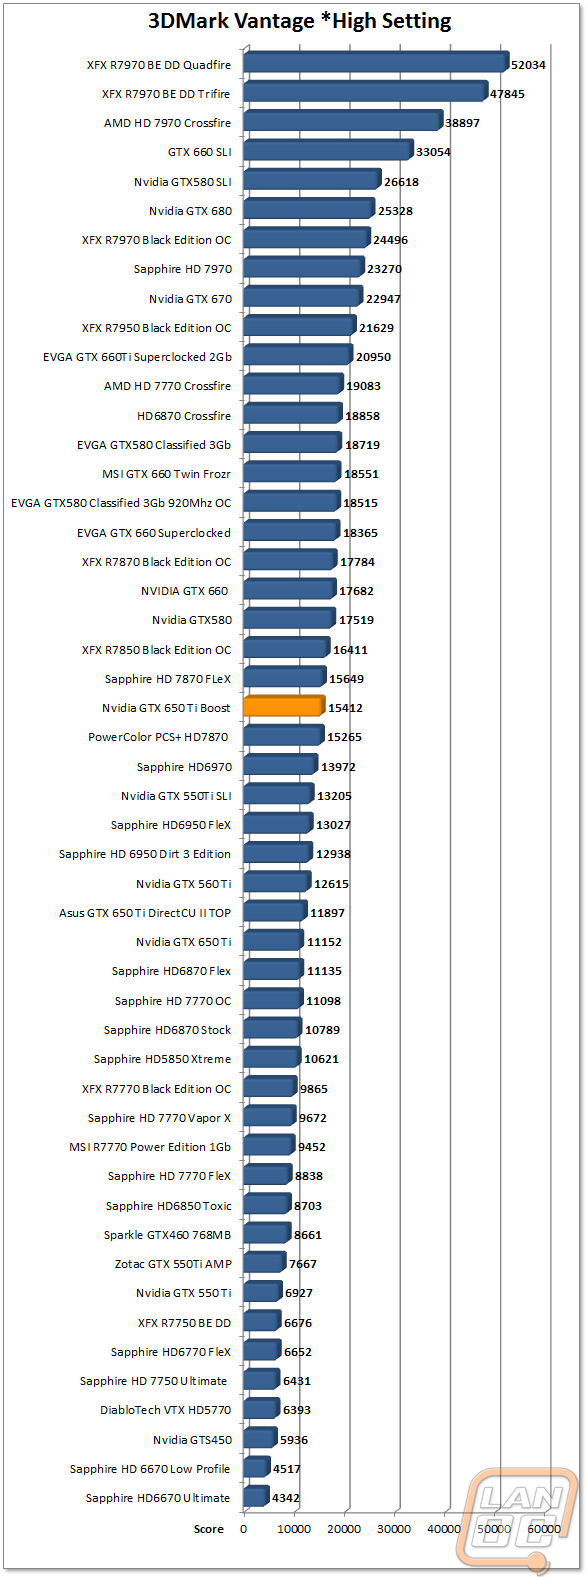
We know where the Boost falls theoretically; let's take a closer look at the numbers. Marketwise, the Ti Boost is almost literally priced at the median of the GTX 650 Ti and the GTX 660 (based off the 2GB sample we were provided). Our synthetic and in-game testing results tell a very similar tale. 3DMark 11 shows about a 1000 point gain over the 650 Ti and 1000 lag under the GTX 660 in Performance mode and 400 points in the same manner in Extreme mode. Vantage follows suit, approximately 3000 points in between Ti and the 660 using High settings and 5000 points in Performance. Frames per second in game testing discrepancies are little more varied, but typically show a gain of 10 to 15 frames over the Ti and around 10 frames under the 660.
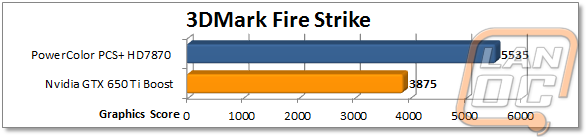
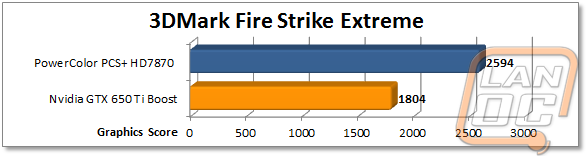
How does the GTX 650 Ti Boost stand up to the competition? Unfortunately, we're still waiting on our sample of the AMD 7790 (we'll cover benchmarks comparisons between the Boost in that article), but the 7850 and 7770 are still good comparisons. The GTX 650 Ti Boost comes in well above the 7770 all of our 3Dmark testing, while our sample of the XFX 7850 Black Edition OC came in just a little above the Boost.