In-Game Benchmarks
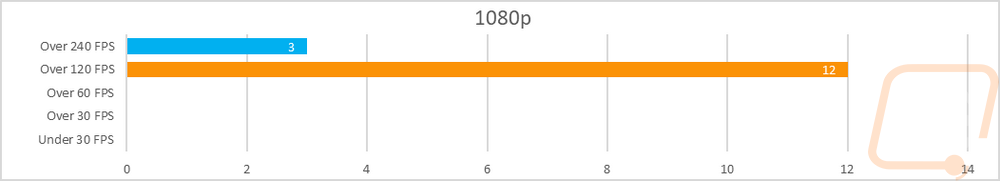
Now we finally get into the in game performance and that is the main reason people pick up a new video card. To test things out I ran through our new benchmark suite that tests 8 games at three different resolutions (1080p, 1440p, and 4k). Most of the games tested have been run at the highest detail setting and a mid-range detail setting to get a look at how turning things up hurts performance and to give an idea of whether turning detail down from max will be beneficial for frame rates. In total, each video card is tested 42 times and that makes for a huge mess of results when you put them all together. To help with that I like to start with these overall playability graphs that take all of the results and give an easier-to-read result. I have one for each of the three resolutions and each is broken up into four FPS ranges. Under 30 FPS is considered unplayable, over 30 is playable but not ideal, over 60 is the sweet spot, and then over 120 FPS is for high refresh rate monitors.
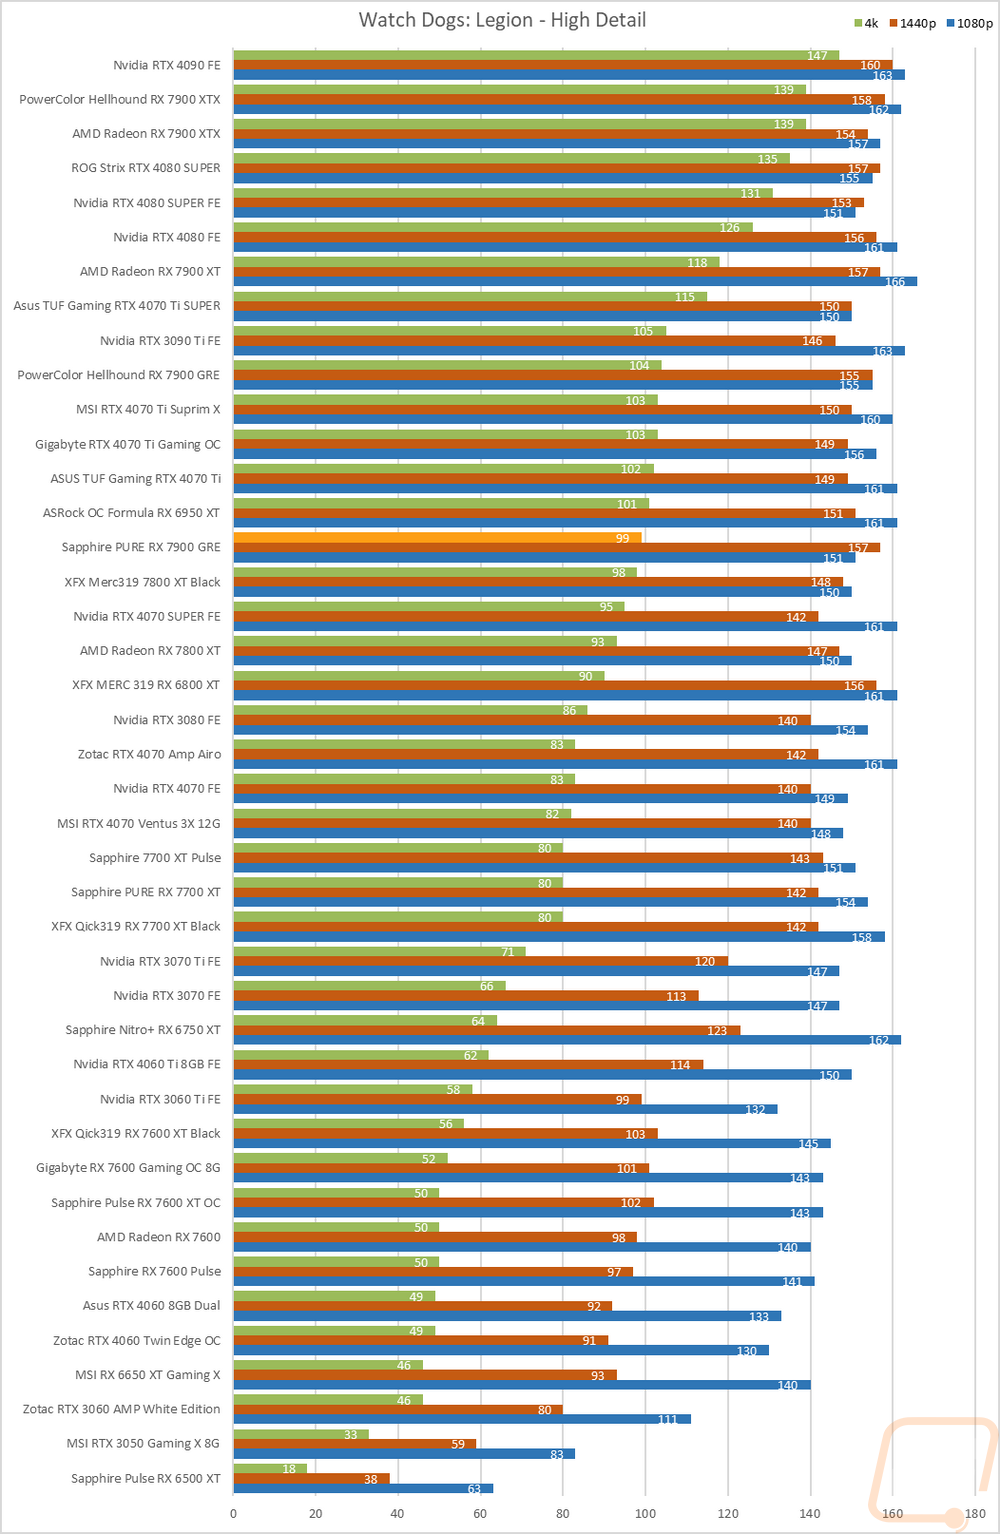
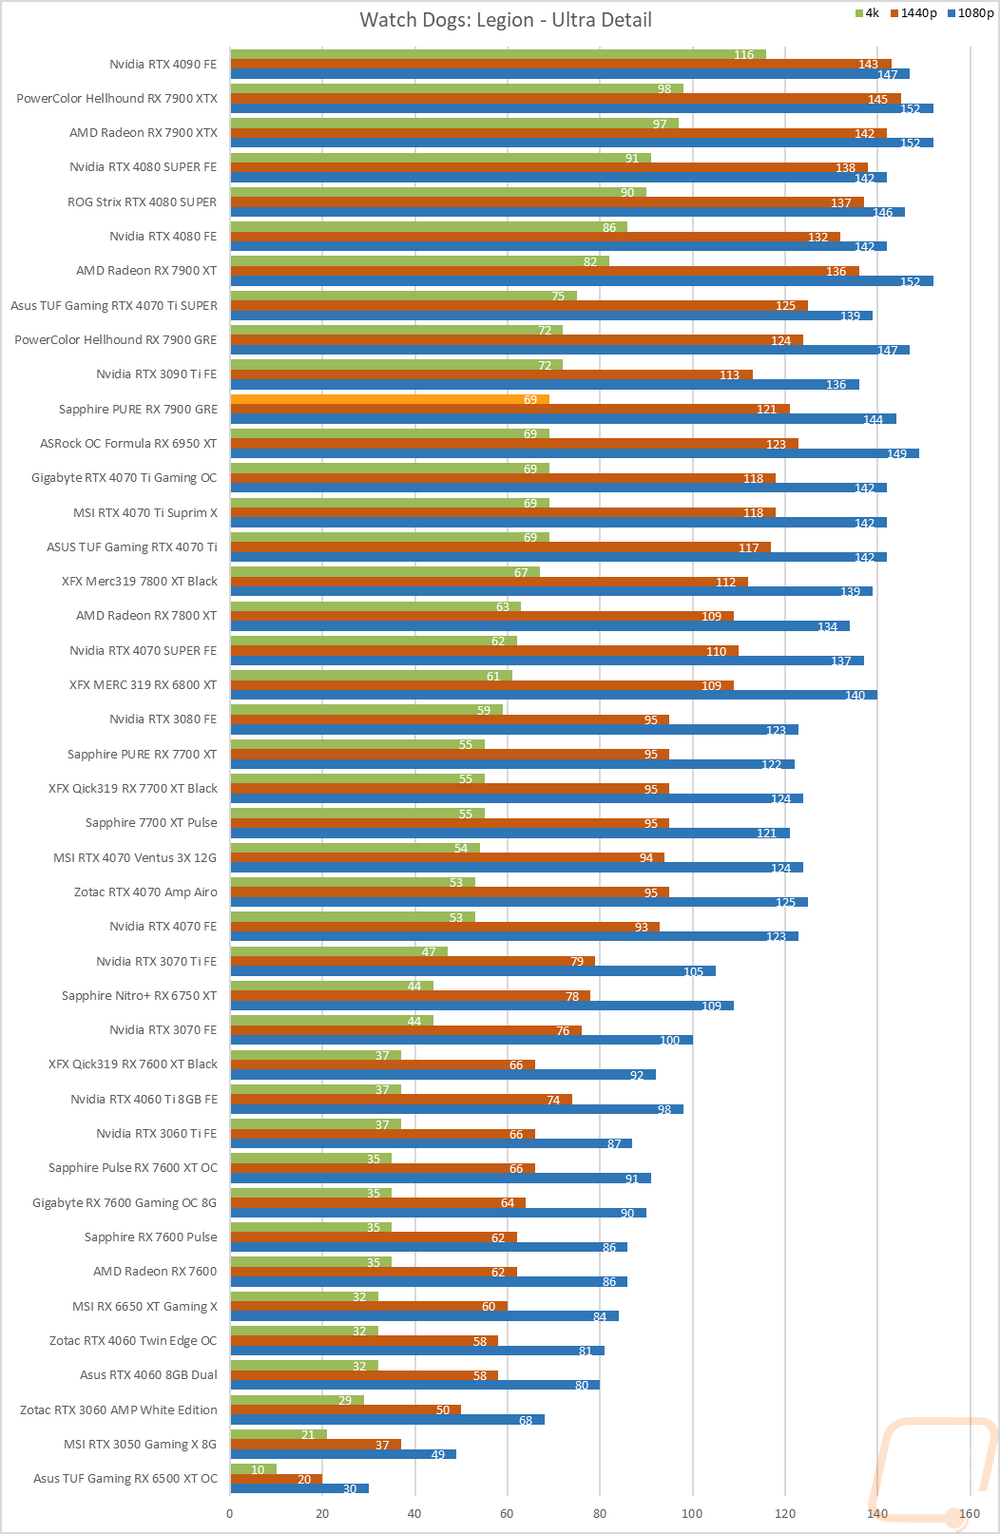
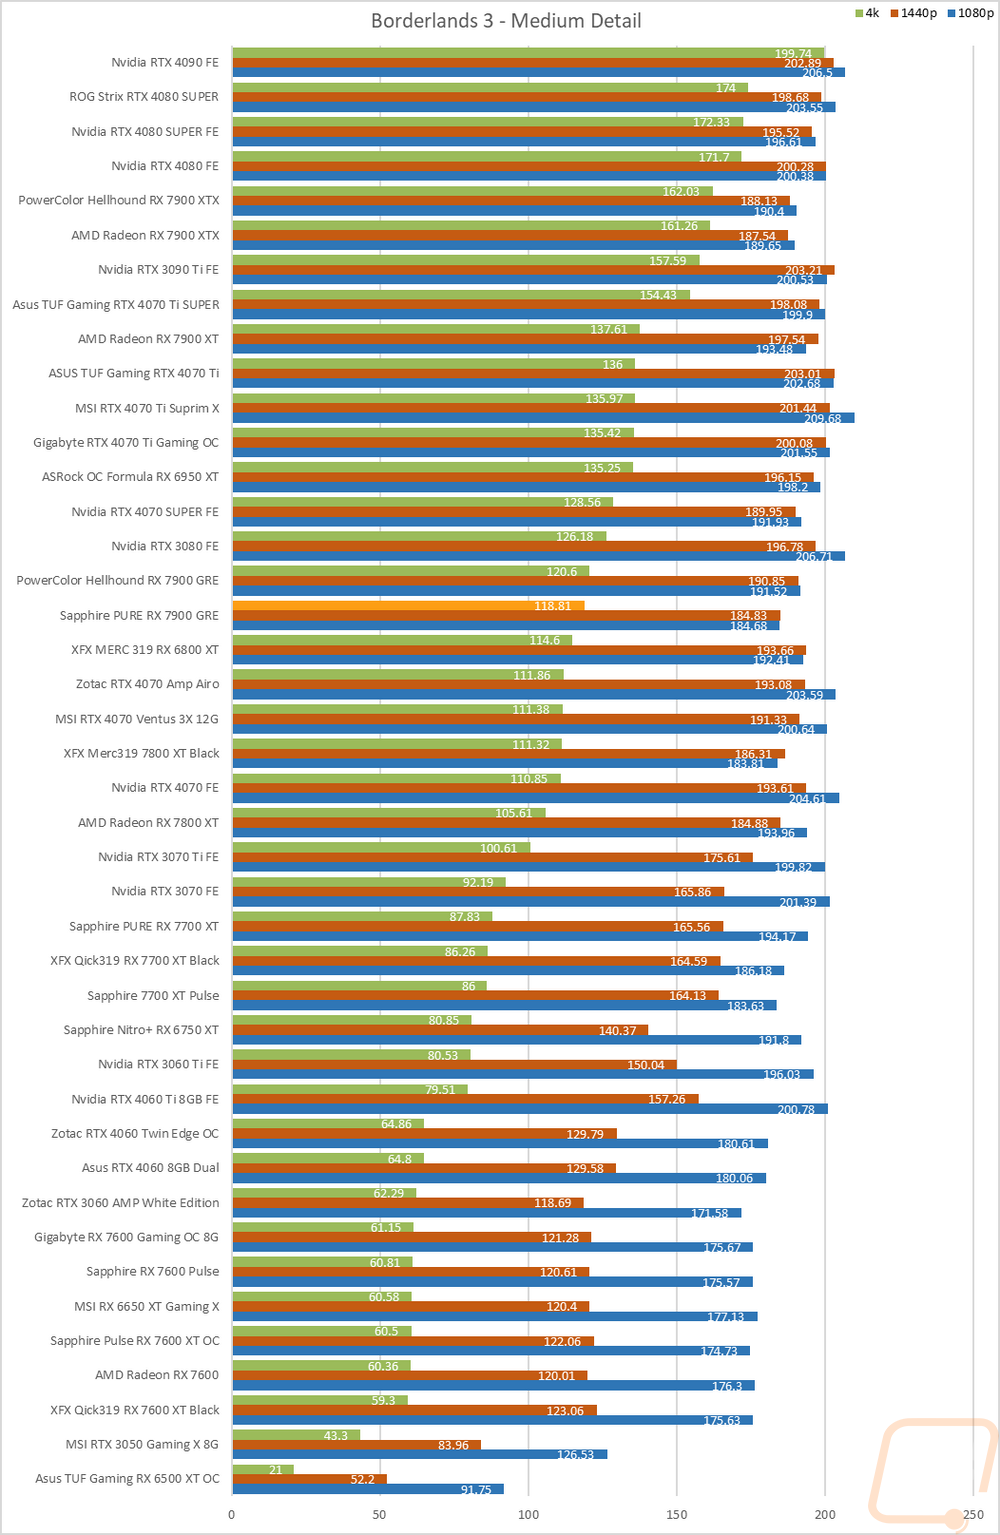
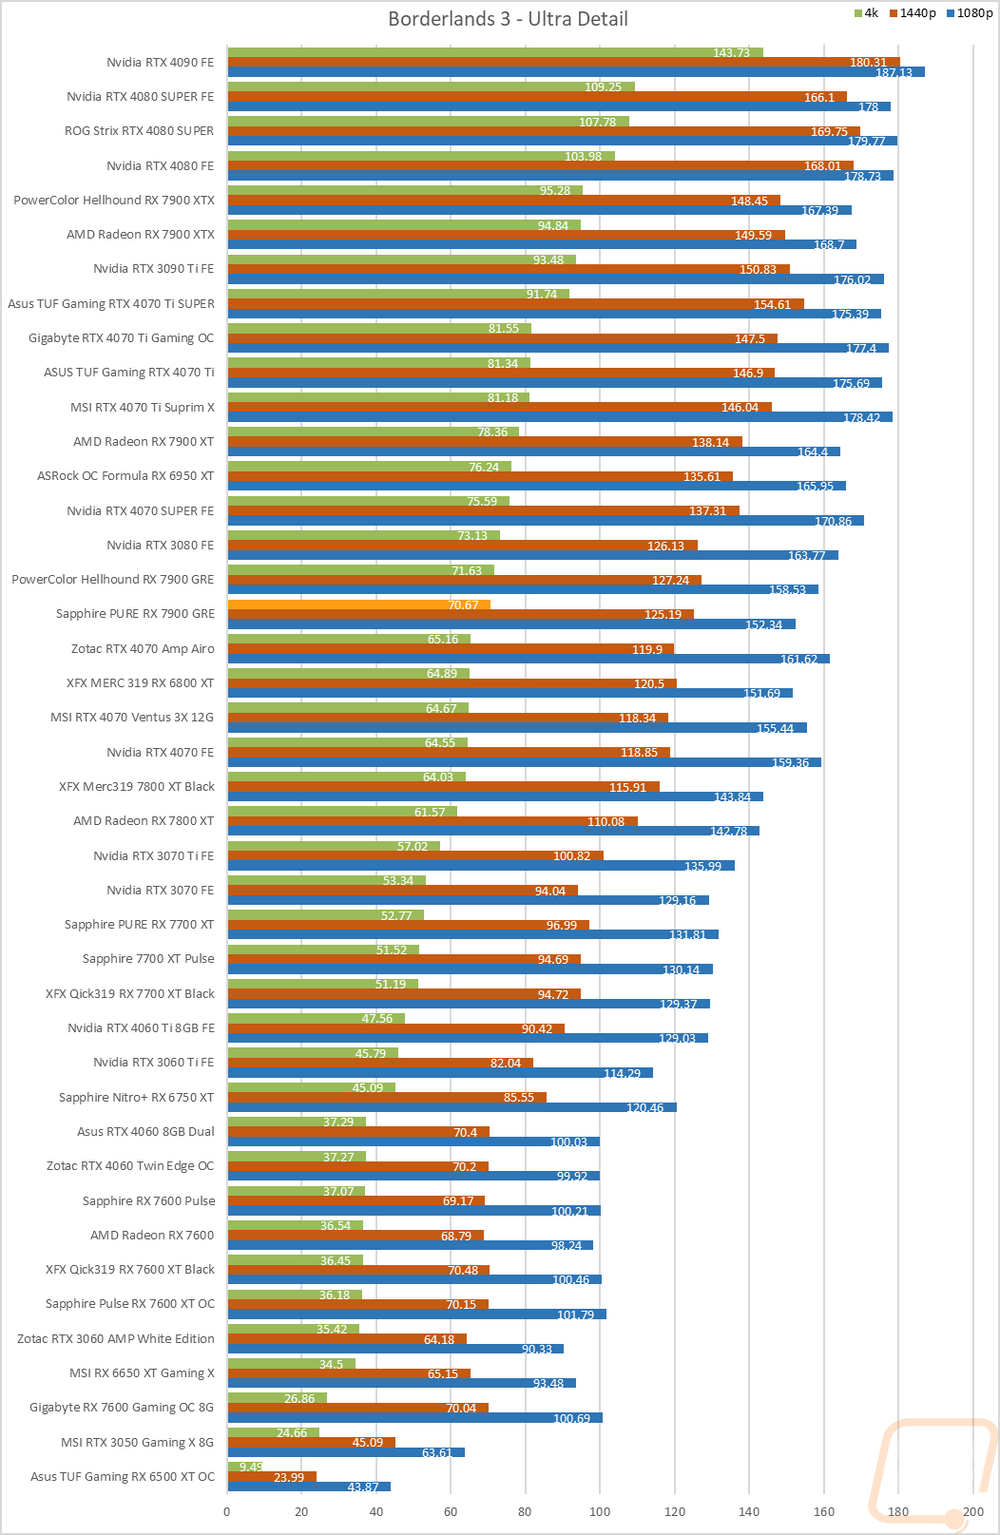
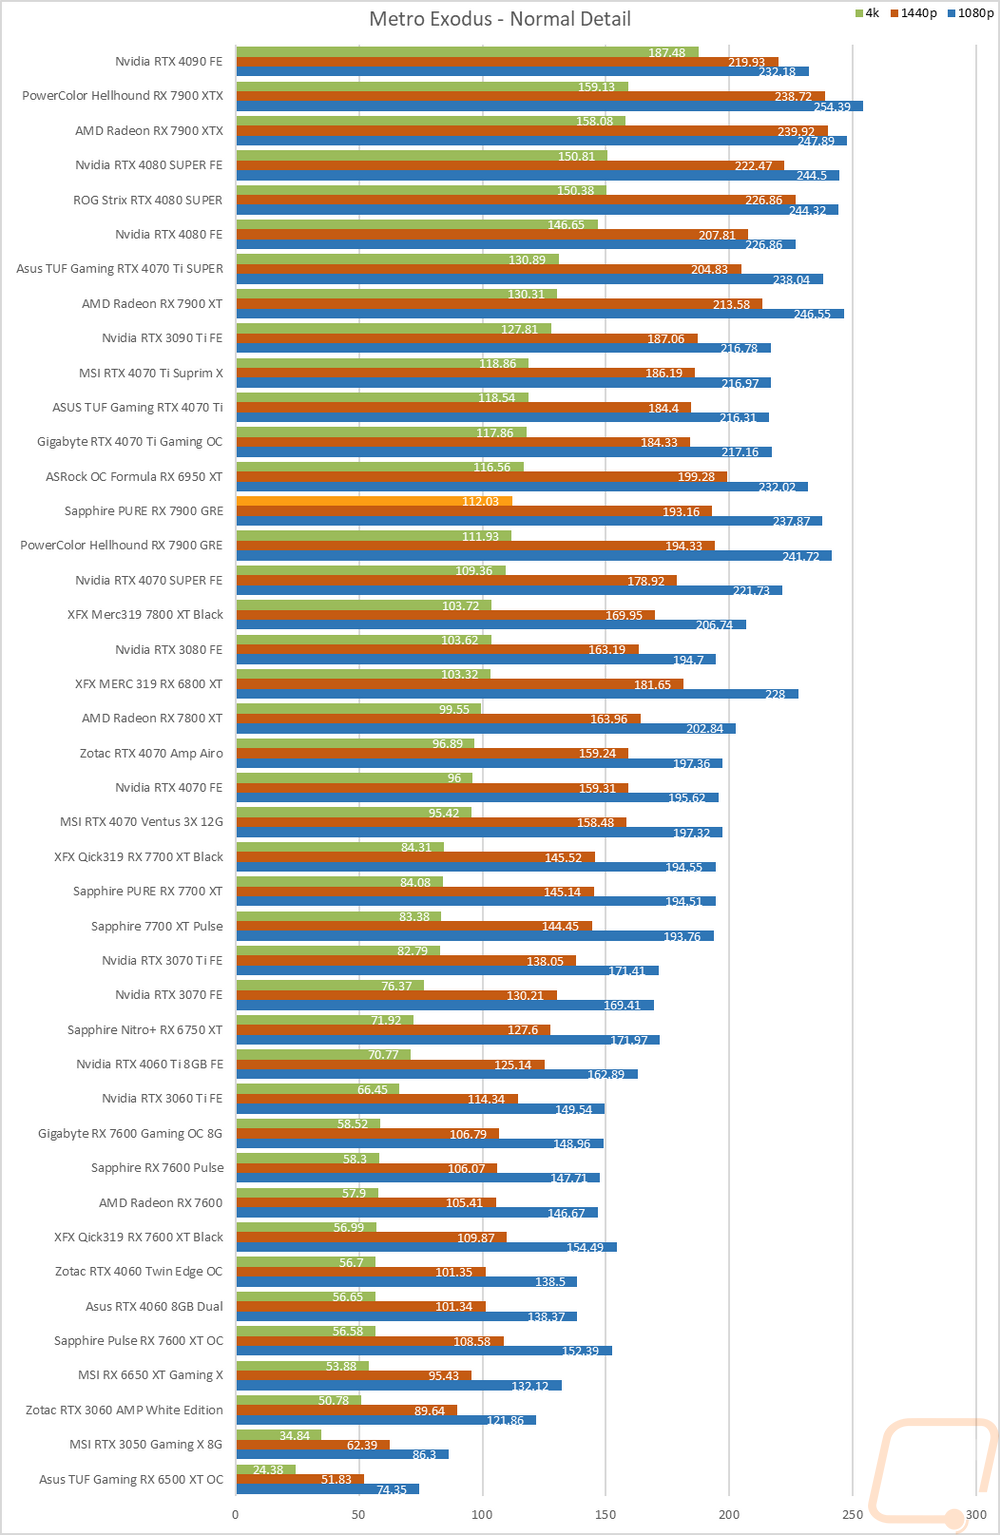
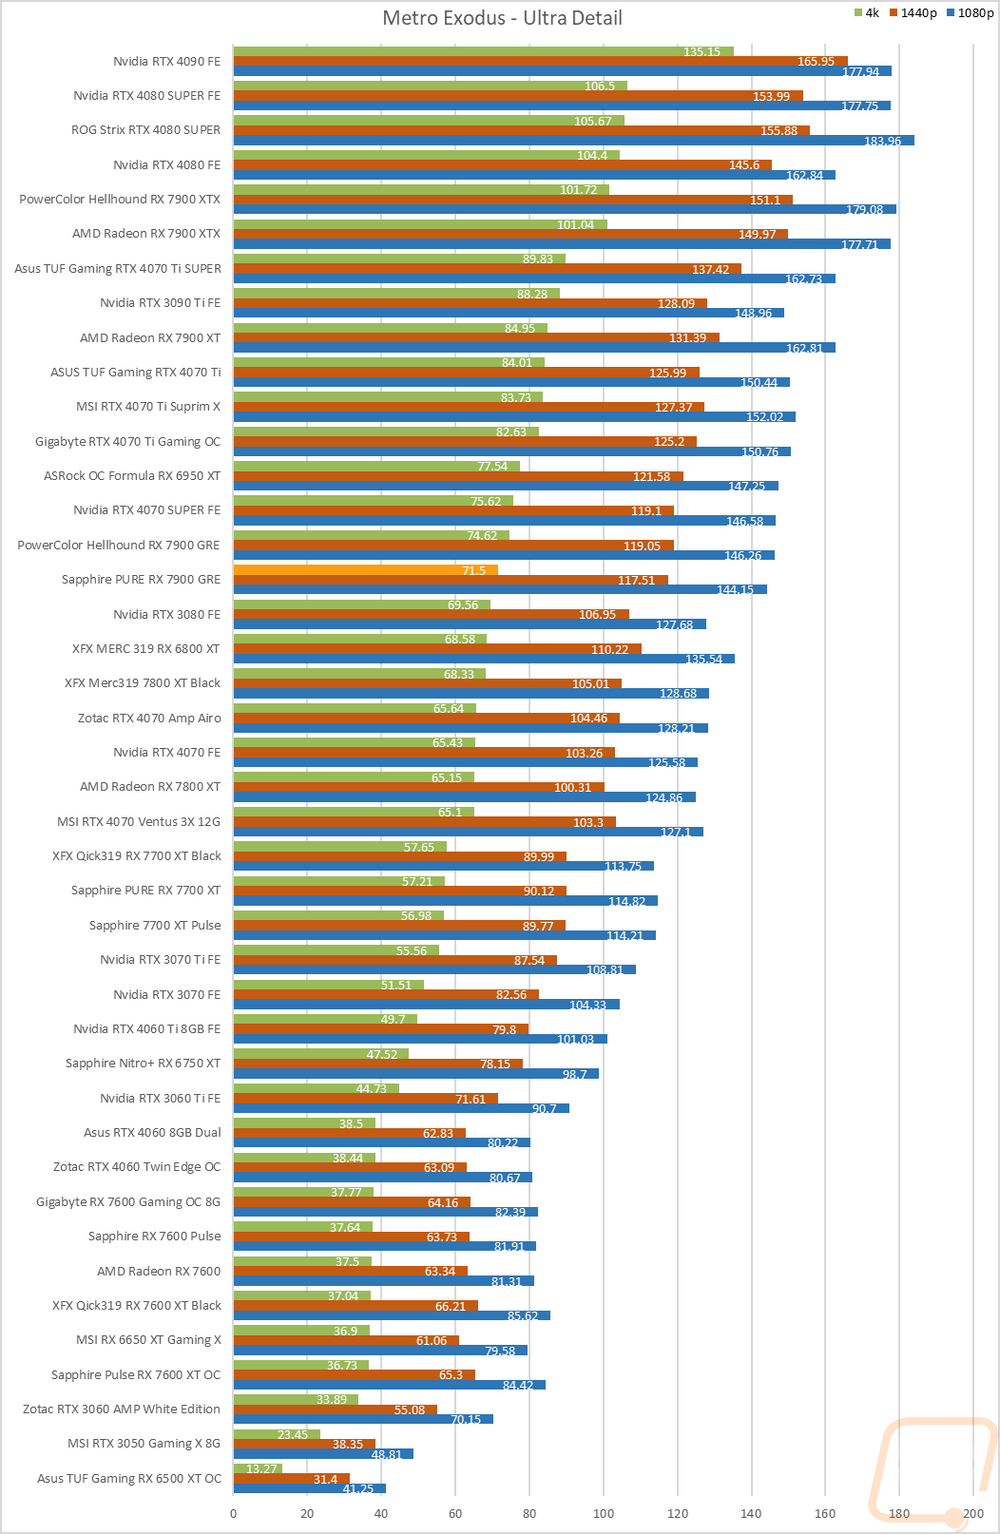
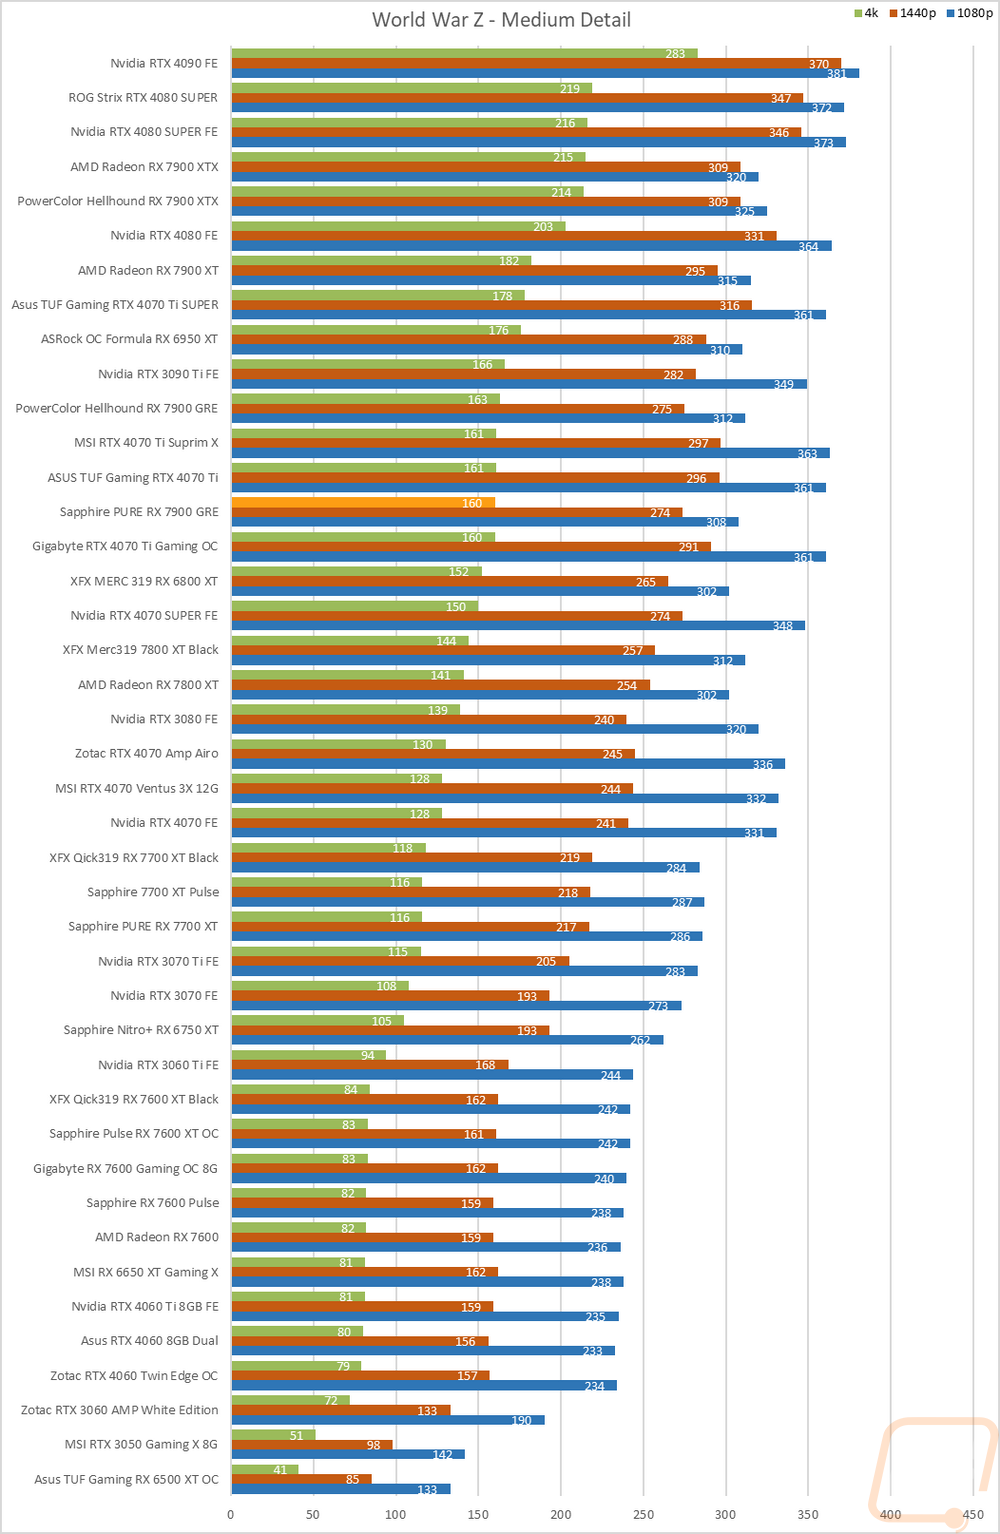
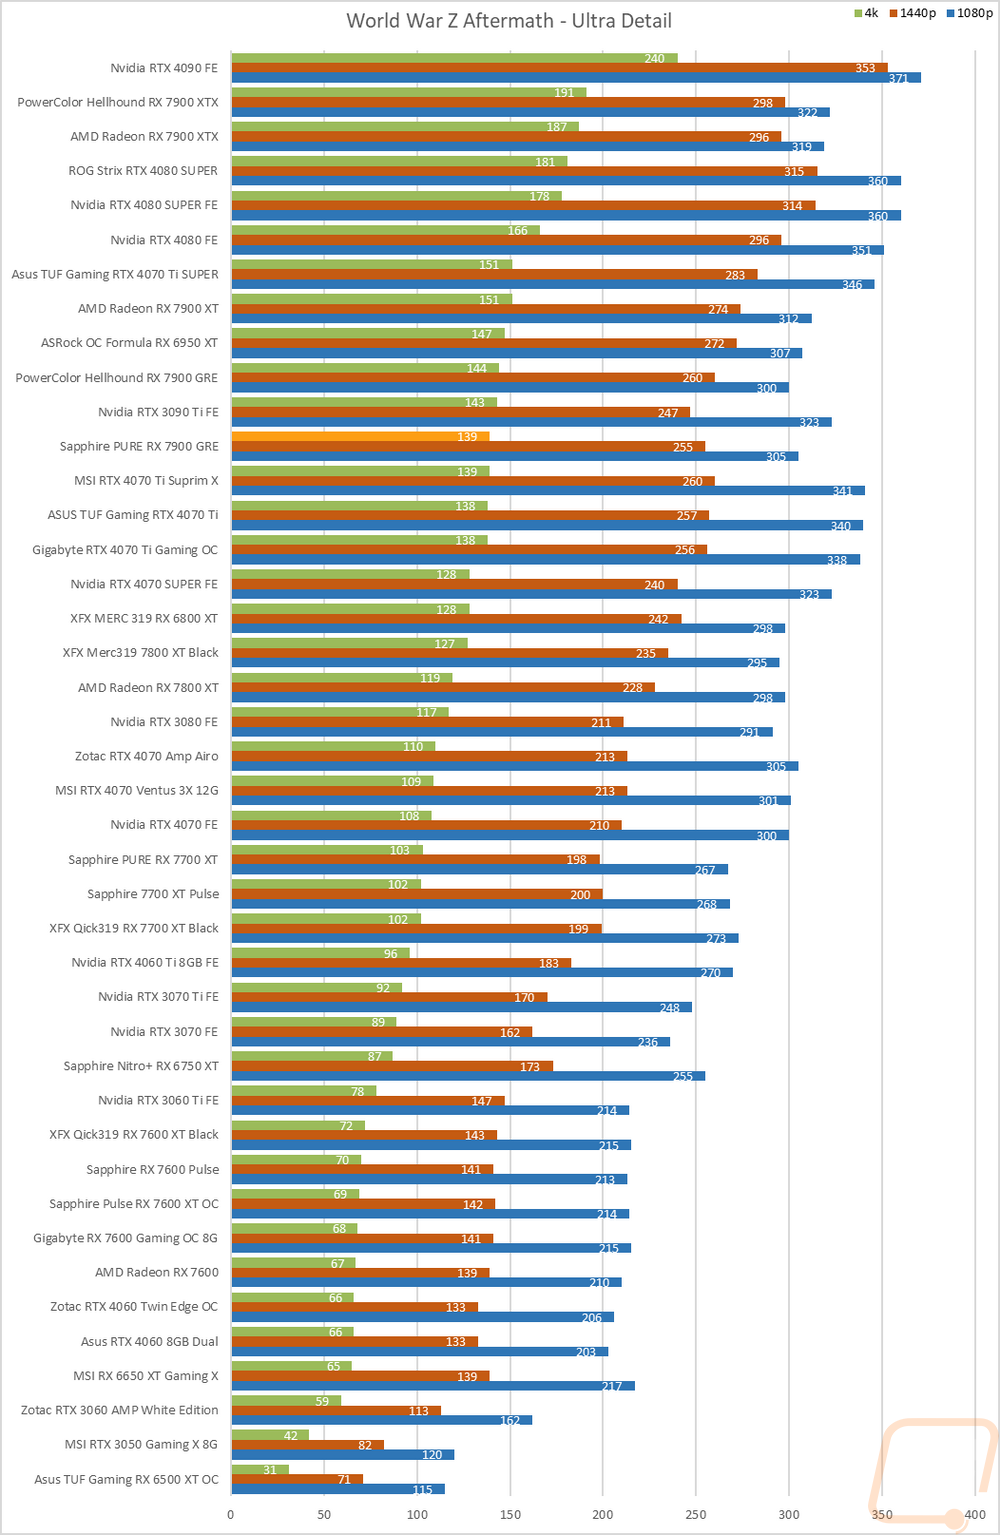
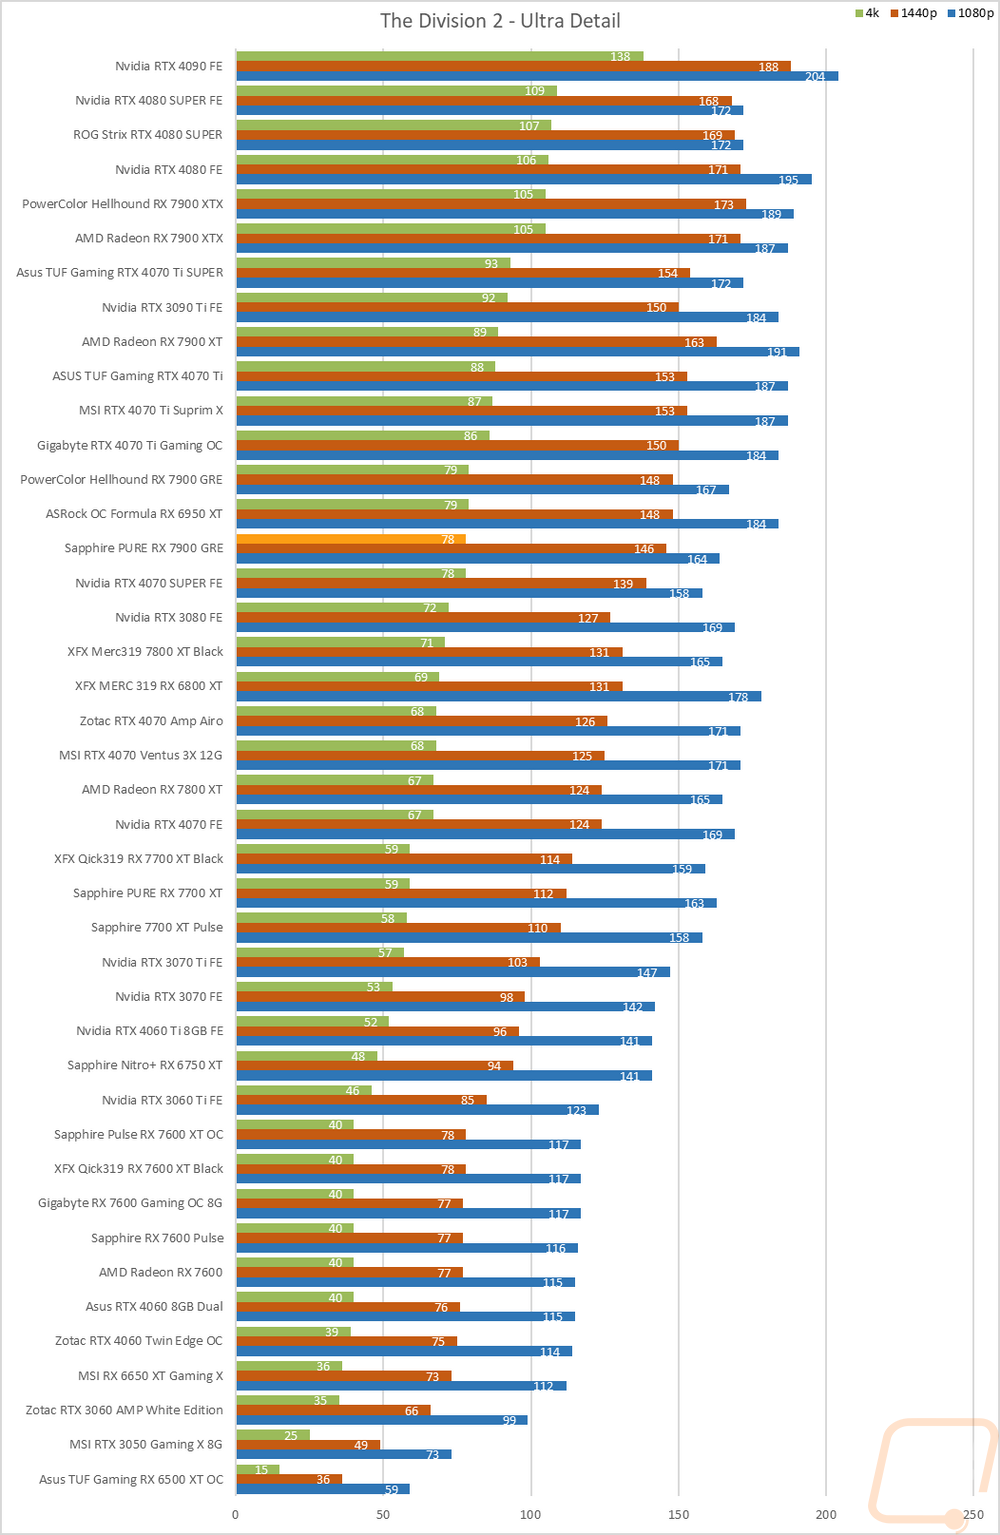
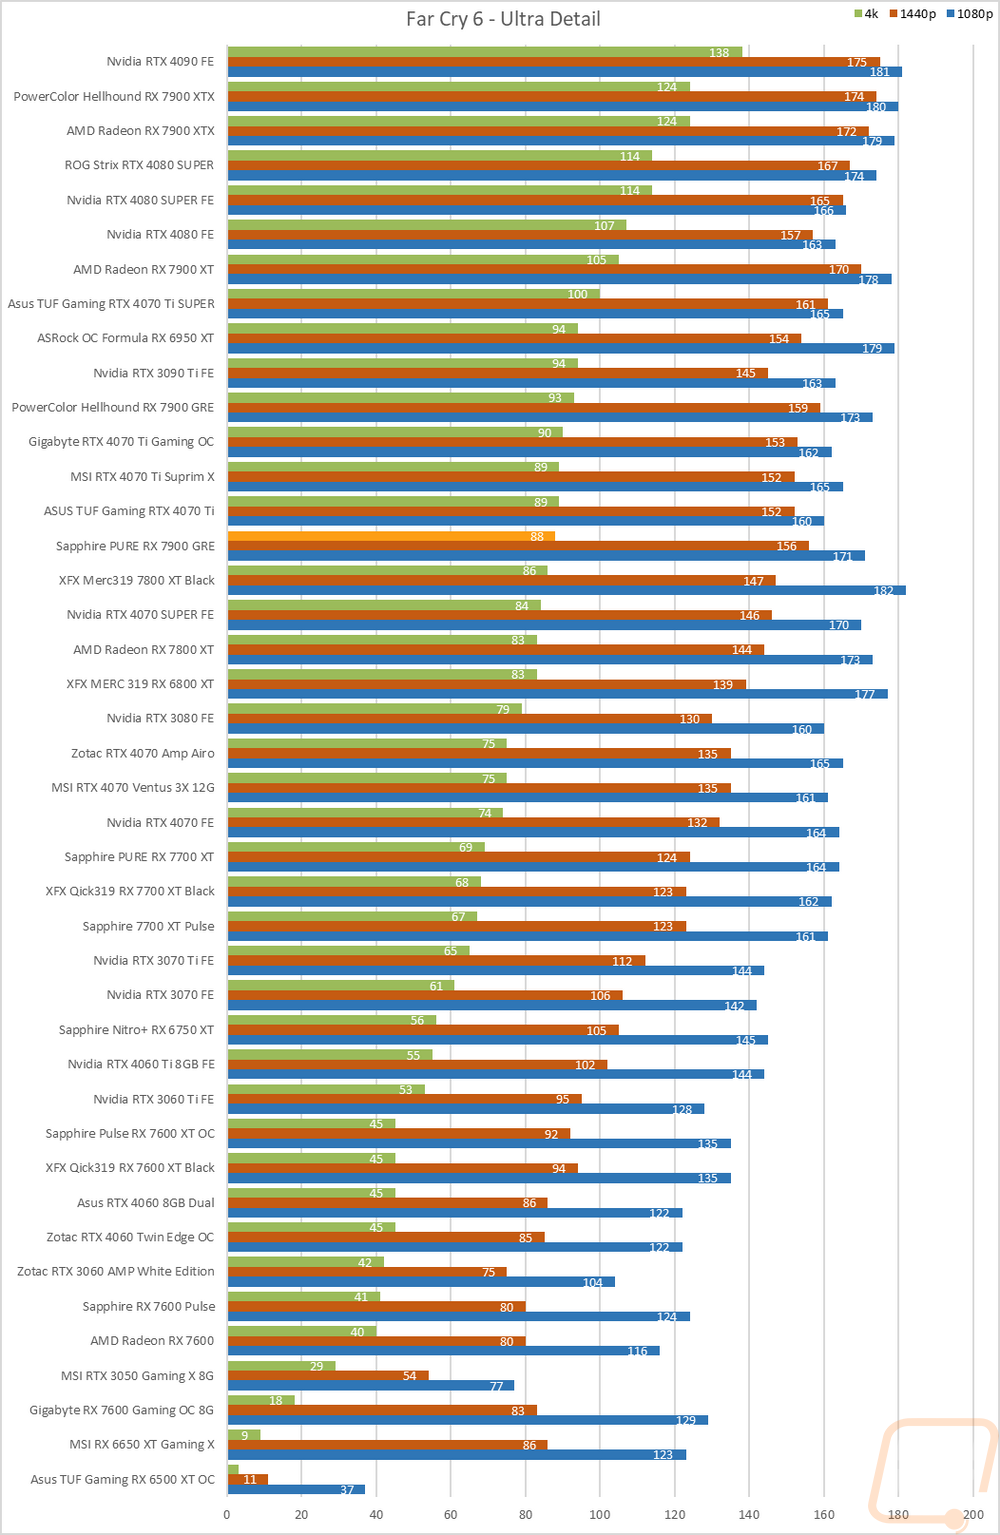
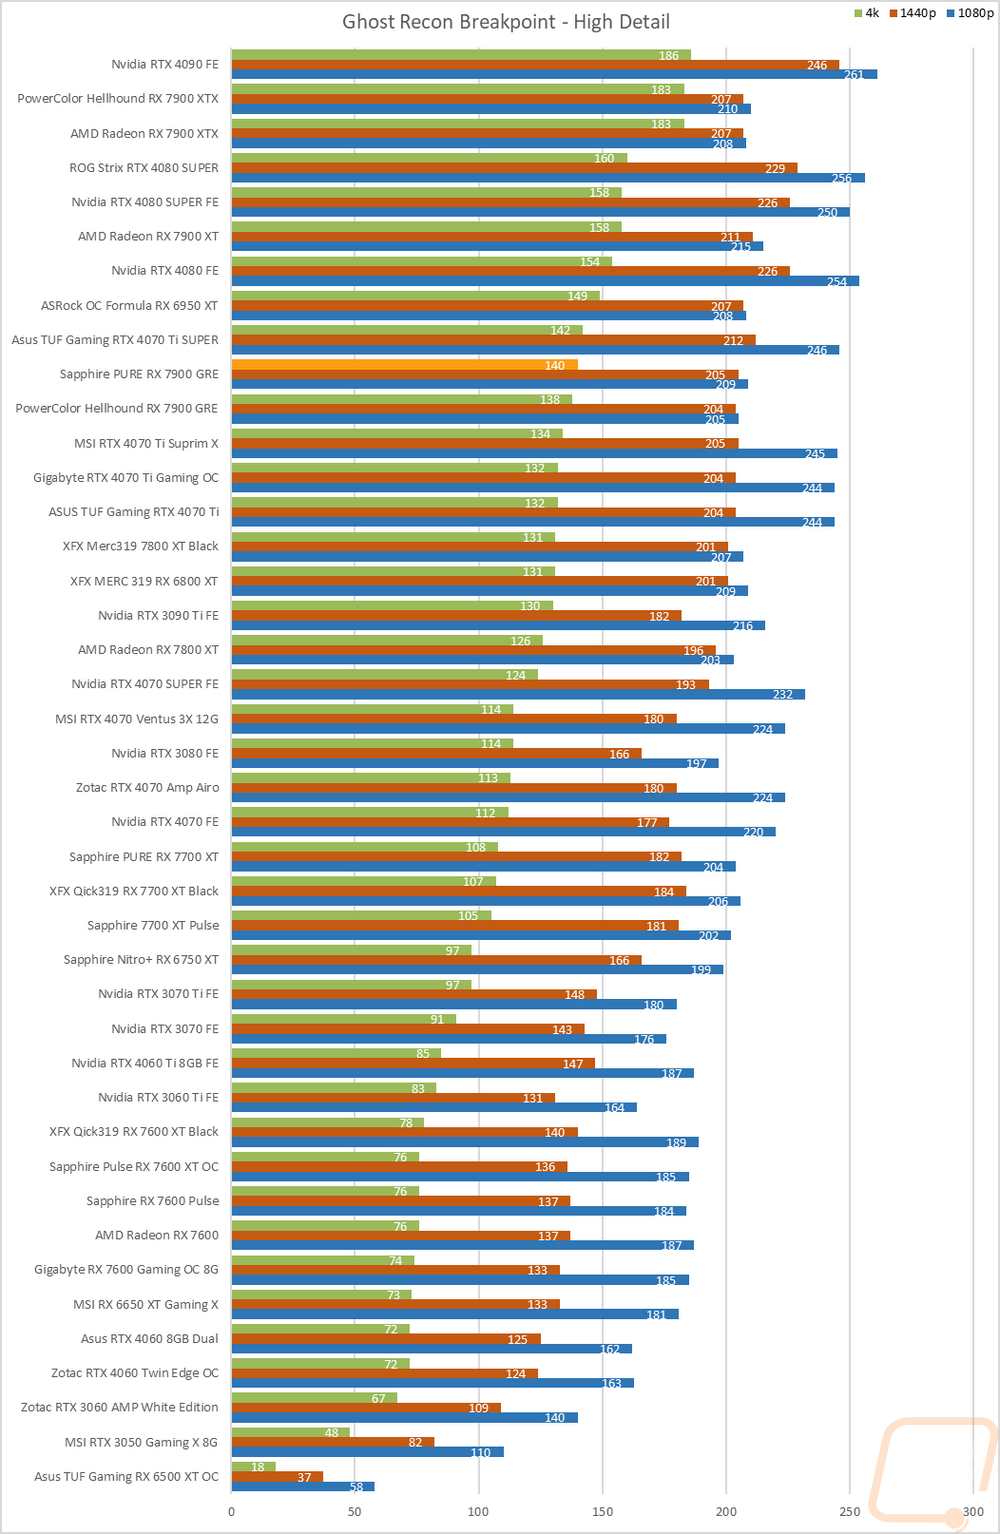
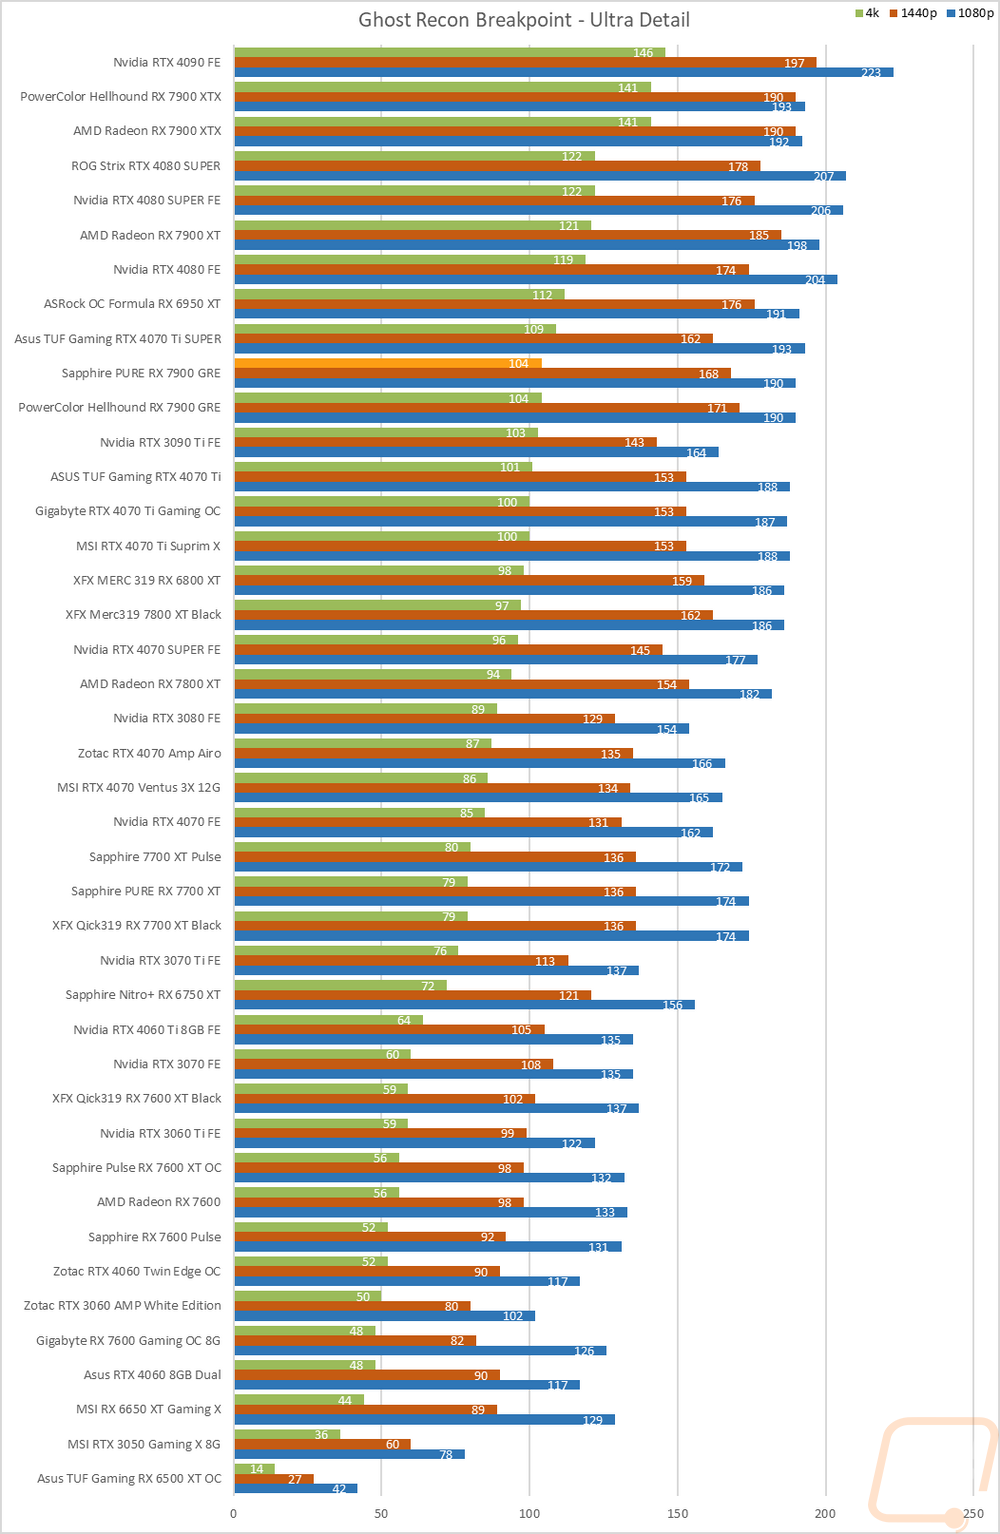
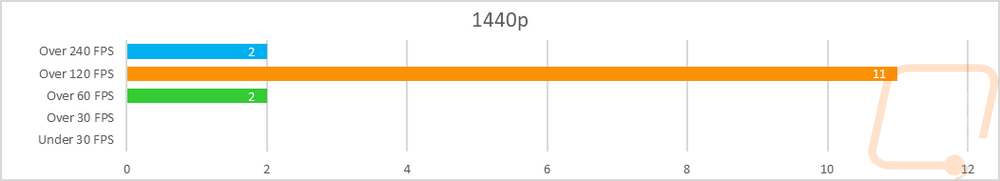
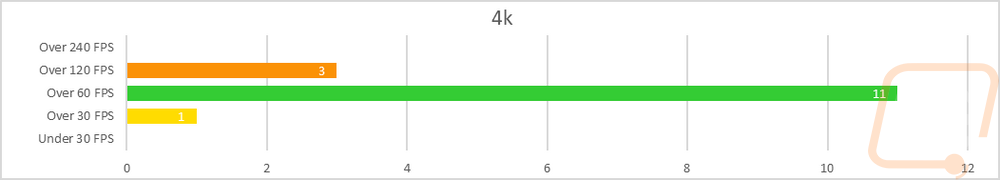
So how did the PURE RX 7900 GRE do when we look at its performance by resolution? Well no big surprises at 1080p, this is another card that is CPU limited in a lot of our 1080p tests. All of the results were up over 120 FPS and three of the results were also up over 240 FPS. 1440p was similar with two results in the 60-119 FPS range and a majority were all up over 120 FPS. There were also two that were up over 240 FPS. Then at 4K, we do finally start to see the limitations of the RX 7900 GRE with one result just barely under 60 FPS. Even still a majority of the results were smooth and in the 60+ range. This tracks with what AMD has designed the 7900 GRE to be, it is designed to be higher end at 1440p but still capable at 4K if needed and it is doing just that.
Of course, I have all of the actual in game results as well for anyone who wants to sort through the wall of graphs below. But I have also pulled all of the results for the range of cards above and beyond the PURE RX 7900 GRE and averaged them for each resolution so we can get a good comparison from card to card. 1080p isn’t worth looking at given the CPU limitations in this range but at 1440p and 4k we get a better look at things. The PURE RX 7900 GRE is just under 2 FPS below the Hellhound at 1440p and 1 FPS at 4k. That difference in base and boost overclock is noticeable but not enough to make any huge difference when compared to the other cards. Both 7900 GRE are just behind the original RTX 4070 Ti and have a good margin up over the RTX 4070 SUPER that just came out.
|
|
1080p |
1440p |
4K |
|
Nvidia RTX 4070 FE |
190.62 |
147.64 |
83.48 |
|
AMD Radeon RX 7800 XT |
190.74 |
156.30 |
89.33 |
|
XFX MERC 319 RX 6800 XT |
197.08 |
162.45 |
92.37 |
|
Nvidia RTX 4070 SUPER FE |
202.65 |
163.65 |
96.05 |
|
Sapphire PURE RX 7900 GRE |
199.42 |
171.79 |
99.54 |
|
Hellhound RX 7900 GRE |
201.40 |
173.47 |
101.59 |
|
ASUS TUF Gaming RTX 4070 Ti |
210.69 |
174.07 |
103.61 |
|
ASRock OC Formula RX 6950 XT |
205.27 |
176.52 |
105.86 |
|
AMD Radeon RX 7900 XT |
211.14 |
186.56 |
114.81 |
|
ASUS TUF Gaming RTX 4070 Ti SUPER |
213.44 |
183.76 |
114.07 |