Yesterday the embargo lifted on the Nvidia RTX 4060 Ti and today it hits store shelves, but AMD is hoping that before you consider that you take a look at their new RX 7600. Today the 7600 embargo lifts and we can dive into what it is all about and check out its performance, then it hits store shelves tomorrow. The RX 7600 is targeting the mainstream segment as well which means it is designed for 1080p performance and is priced to match the RTX 4060 which Nvidia announced for a July launch. Mainstream users can finally get excited, the next generation of cards is finally here, and with 64.52% of Steam users on the latest survey still gaming at 1080p that is still by far the largest market. So I’m excited to see how the new RX 7600 performs!
Product Name: AMD Radeon RX 7600
Review Sample Provided by: AMD
Written by: Wes Compton
Amazon Affiliate Link: HERE
All about the RX 7600
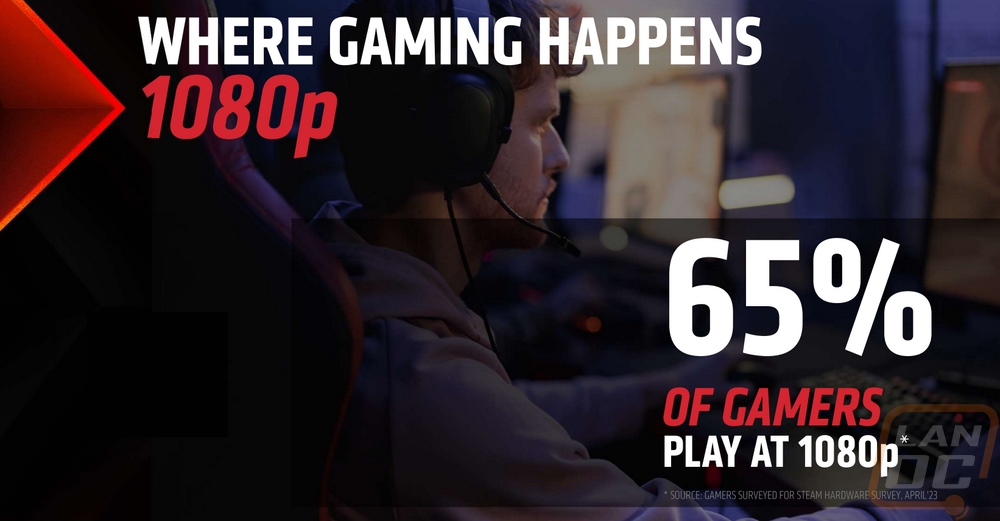
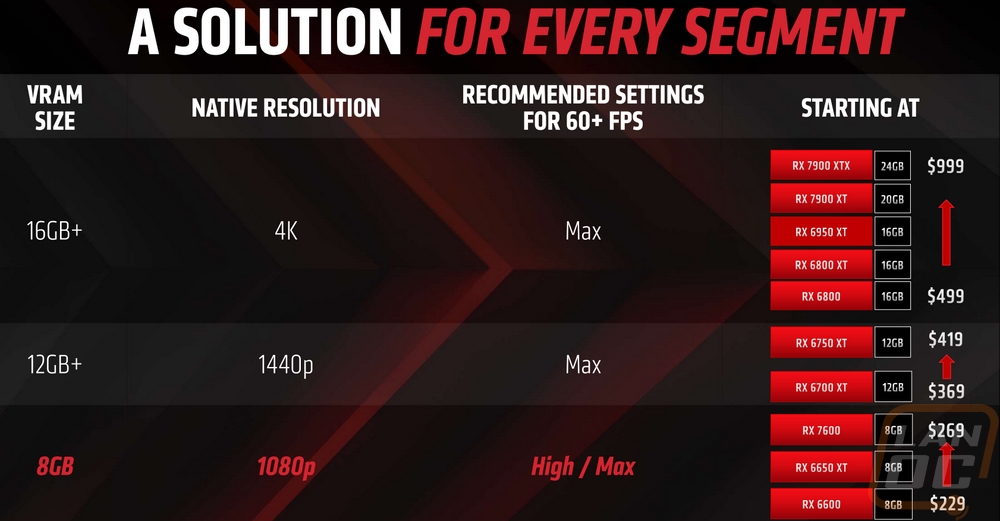
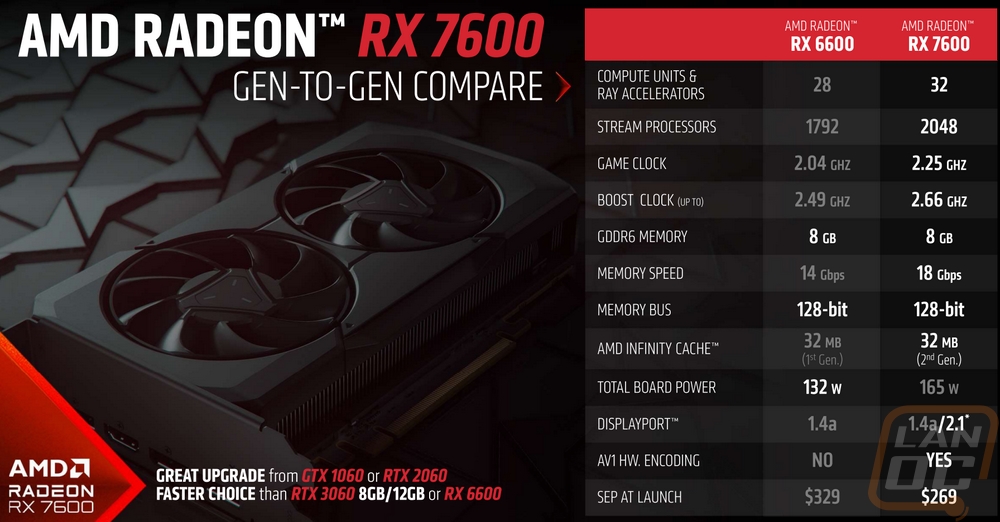
I spoke about it in yesterday's Nvidia RTX 4060 Ti review and I mentioned it in the opening here but it is easy to forget that a majority of gamers are playing at 1080p. With so many new cards coming out and being so capable at 1440p and 4k you would think that is what most people are using. So with the 65% of gamers who are playing at 1080p a lot of those higher-end cards might get them higher frame rates but in most cases, it would be overkill. Obviously, if you are planning a monitor upgrade soon it would still make sense to focus on a card capable of that. But if 1080p is still in your future, why not focus on cards designed specifically for that? The RX 7600 that we are looking at today falls into that category but if you were curious you can usually get a good idea of what a card's target is just by looking at the VRAM. AMD has their lineup broken up this way and Nvidia is similar as well. You can see AMDs current lineup in the picture below from AMDs presentation, interestingly we can see that right now they still have the RX 6650 XT and the RX 6600 as well in their 1080p focus, and because they skipped from their new RX 7900 XT, and RX 7900 XTX down to the RX 7600 everything in the lineup in between that is still from the 6000 Series.
When comparing the new RX 7600 to the previous generation card, the RX 6600 we can see that the transistor count has increased from 11.1 billion to 13.3 billion but with the smaller 6nm build process the die size has also gotten smaller going from 237 mm² to 204 mm². In that smaller space, AMD has increased the compute unit count from 28 up to 32 and the new architecture also adds in the new AI accelerators as well. The stream processor count has improved from 1792 up to 2048. The RX 7600 also has higher game and boost clock speeds with the new boost clock at up to 2655 MHz. All of this together has made huge improvements in the single precision performance which on the RX 6600 was up to 8.93 TFLOPS and the RX 7600 is now up to 21.75 TFLOPS. The 8GB GDDR6 hasn’t changed at all, this is still a 1080p focused card and the RX 7600 still has a 128-bit memory bus but AMD did increase the memory speed up to 18 Gbps. With the higher clock speeds, even the power efficiency that the smaller build process wasn’t enough, the RX 7600 has a higher total board power of 165 watts compared to the RX 6600’s 132 watts. The smaller die size did help with the pricing as well as not being in the middle of a crypto (and covid) fueled card shortage with the price dropping from $329 of the RX 6600’s launch price down to $269 for the RX 7600.
|
Specifications |
Radeon RX 7600 |
Radeon RX 6600 |
|
Architecture |
RDNA 3 |
RDNA 2 |
|
Manufacturing Process |
6nm |
7nm |
|
Transistor Count |
13.3 billion |
11.1 billion |
|
Die Size |
204 mm² |
237 mm² |
|
Compute Units |
32 |
28 |
|
Ray Accelerators |
32 |
28 |
|
AI Accelerators |
64 |
- |
|
Stream Processors |
2048 |
1792 |
|
Game GPU Clock |
2250 MHz |
2044 MHz |
|
Boost GPU Clock |
Up to 2655 MHz |
Up to 2491 MHz |
|
Peak Single Precision Perf. |
Up to 21.75 TFLOPS |
Up to 8.93 TFLOPS |
|
Peak Half Precision Perf. |
Up to 43.5 TFLOPS |
Up to 17.86 TFLOPS |
|
Peak Texture Fill-Rate |
Up to 339.8 GT/s |
Up to 279 GT/s |
|
ROPs |
64 |
64 |
|
Peak Pixel Fill-Rate |
Up to 169.9 GP/s |
Up to 159.4 GP/s |
|
AMD Infinity Cache |
32 MB (2nd Gen) |
32 MB (1st Gen) |
|
Memory |
8GB GDDR6 |
8GB GDDR6 |
|
Memory Speed |
18 Gbps |
14 Gbps |
|
Effective Memory Bandwidth w/AMD Infinity Cache |
Up to 476.9 GB/s |
Up to 412.9 GB/s |
|
Memory Bus Interface |
128-bit |
128-bit |
|
PCIe Interface |
PCIe 4.0 x8 |
PCIe 4.0 x8 |
|
Total Board Power |
165W |
132W |
|
Launch MSRP |
$269 |
$329 |
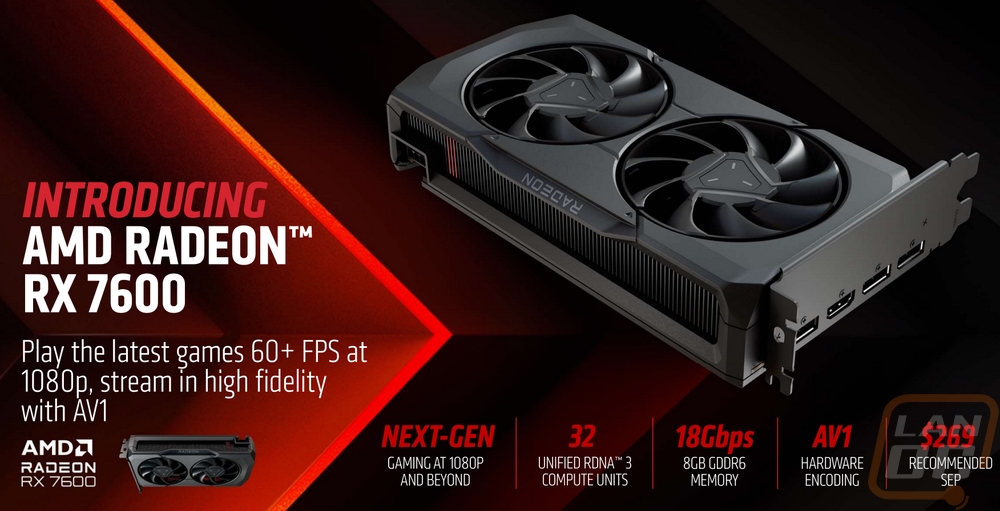
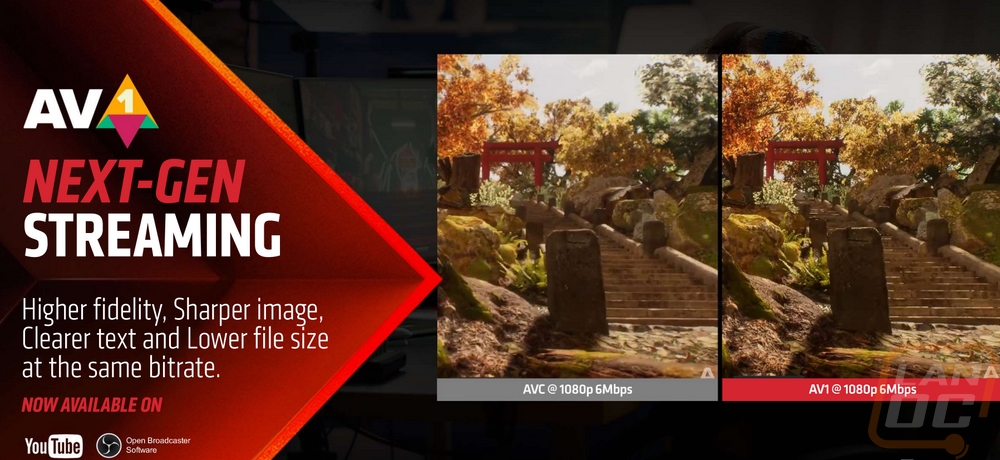
AMDs presentation did also highlight that they are supporting AV1 which is starting to pick up and will be very important. AV1 allows for better video quality at lower bitrates which has a few important uses. For streamers or if you are streaming your game on Discord to your friends this allows for better quality without clogging up your upload connection for those of us with cable internet. It’s not only streamers who will benefit though, AV1 support means less data transferred for companies like YouTube as well.
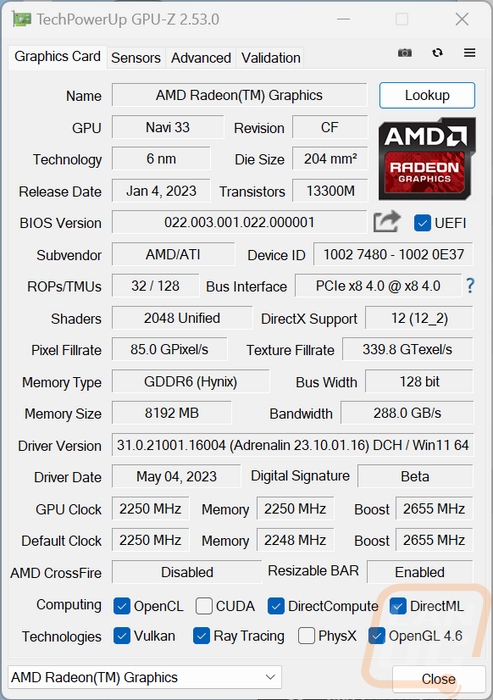
Before getting into testing I did also run GPUz to double-check that our clock speeds match up with the specifications. Our default clock speed lines up but the boost clock in GPUz is showing 2655 MHz which does line up with AMDs specification. GPUz also has our Bios revision in case that information is needed in the future and shows the driver I tested with which is the 23.140.01.16 Beta driver that AMD provided to the press ahead of the launch.
Packaging
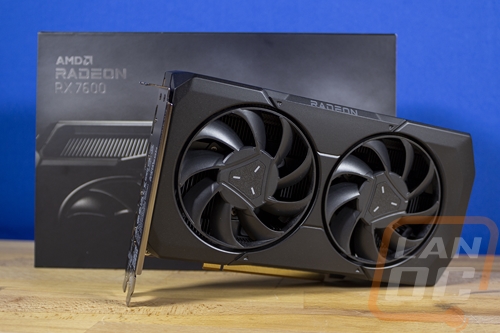
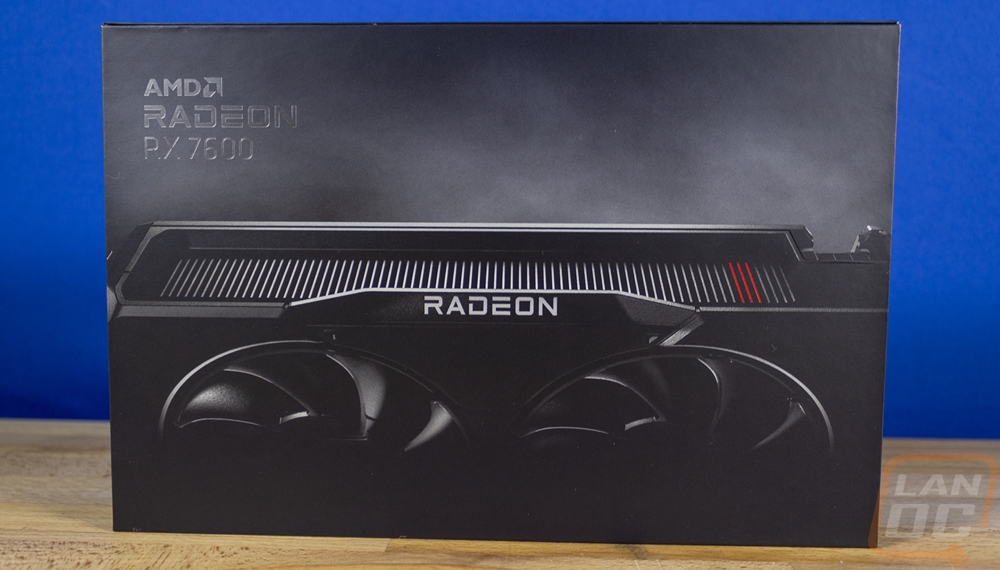
The box for AMDs reference RX 7600 is a lot smaller than the box I saw for either the RX 7900 XT or 7900 XTX but they have still stuck with the same styling. It has a black background with fog and the AMD Radeon RX 7600 model name up in the top left corner with a reflective metallic finish. Then the bottom half of the front of the box shows a dark partial image of the card. This highlights the red strip on the top edge and the Radeon branding on the card. You also can see that the card has two fans and up on the top corner you can see one 8-pin power connection as well. Then around on the back, the box has a picture of the Adrenalin Edition software. The back has all of the normal required certification logos and a large white spot where they would normally put the UPC but this is a press sample, not a retail box.
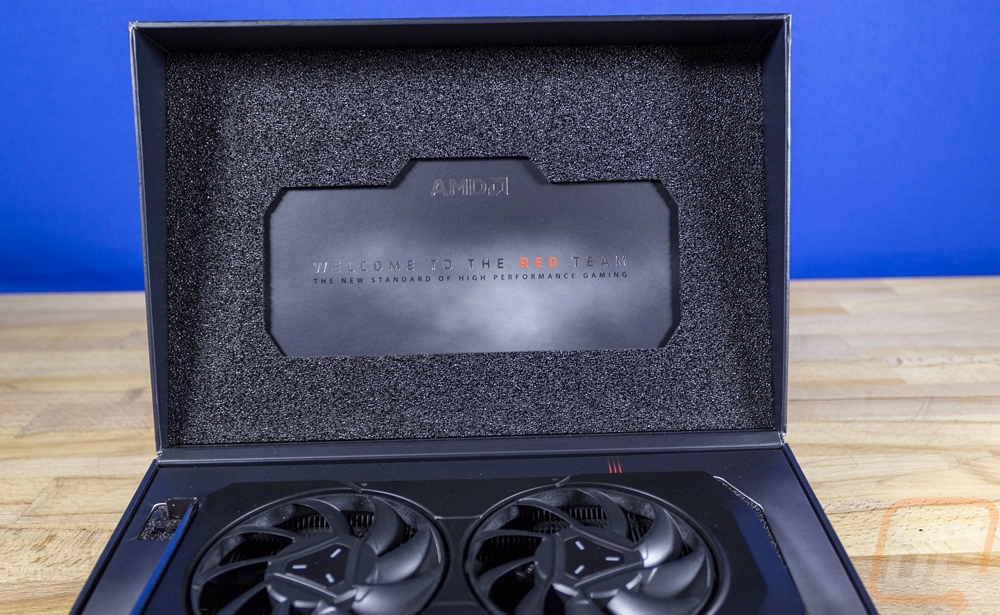
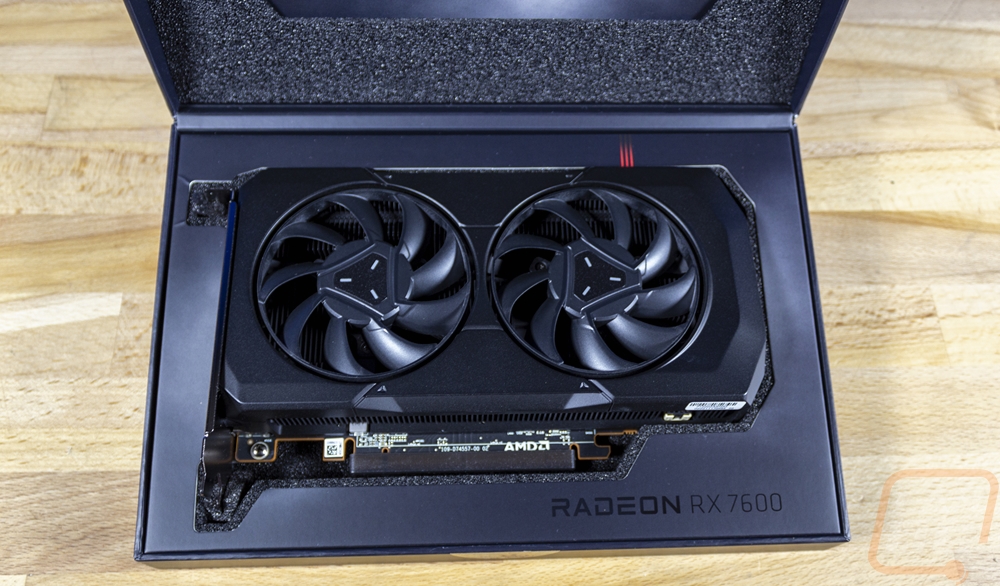
The bottom edge has one small sticker that seals the box closed, once you cut that you can open the box up. The box is also held closed the rest of the time with magnets as well. Like with Nvidia, AMD has the card right up on top featured with no static bags or anything blocking the view, so you get a nice unboxing experience. The underside of the door has a thin layer of foam and then in the center, the foam is cut around the AMD logo and the test “Welcome to the Red Team The New Standard of High Performance Gaming”. Then the bottom half has the card sitting in a foam tray cutout to fit the card. On top of the foam, they have a printed cardboard layer which has more of the black background with the fog. This also has the red stripe which carries down into the card where the stripe in the top heatsink is. It also has the Radeon RX 7600 branding in black.
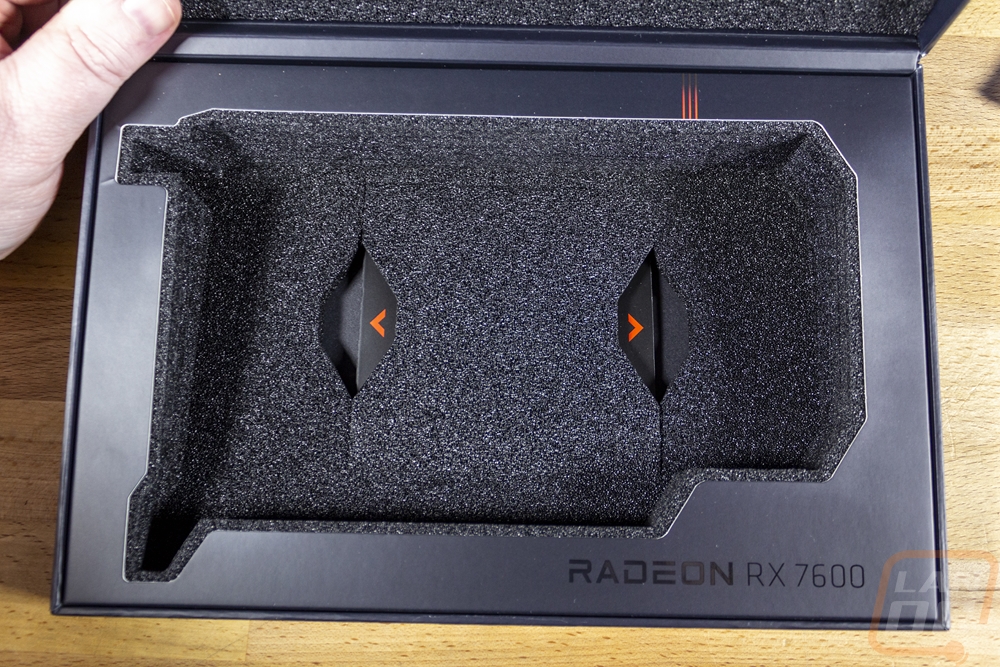
Up under the card is another thin layer of foam, this layer has a section in the middle you can pull out. That covers up the only documentation that comes with the card. There aren’t any accessories or power adapters needed or included. The documentation has a QR code that takes you to the full user manual to get you started.
Card Layout and Photos
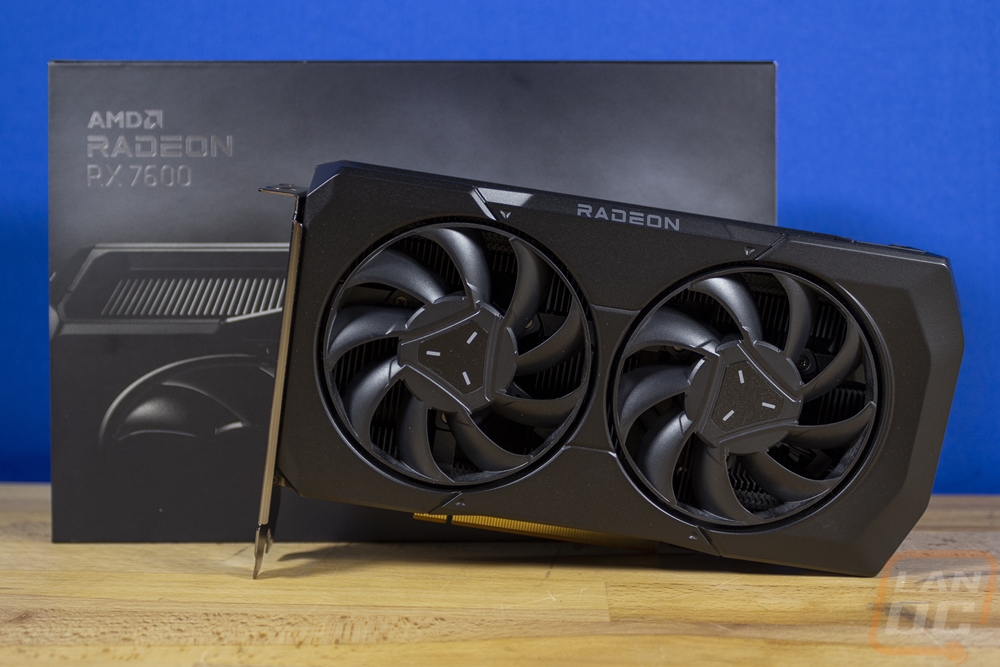
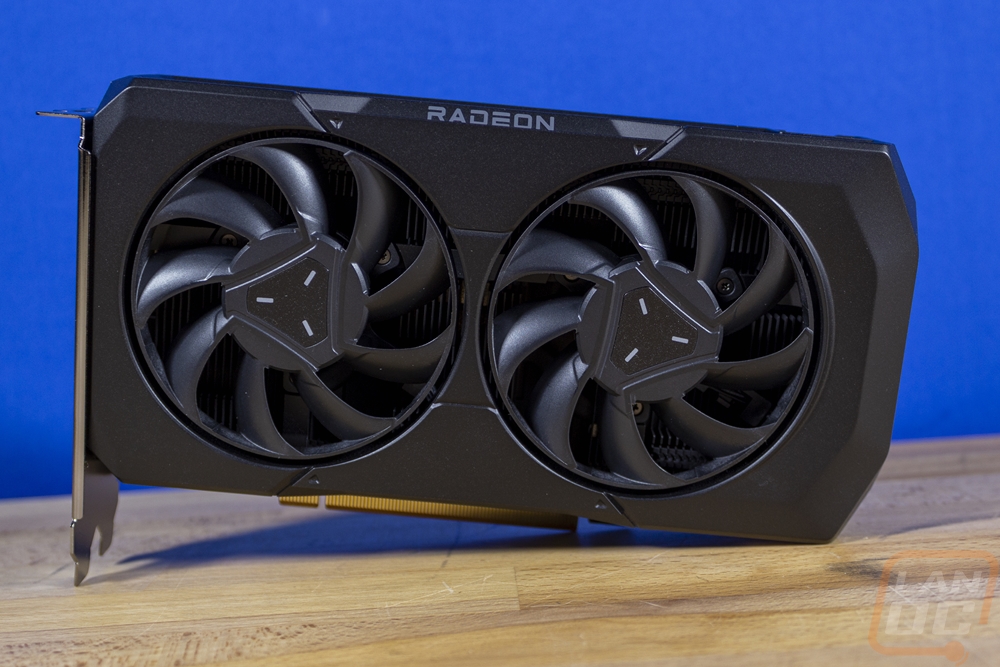
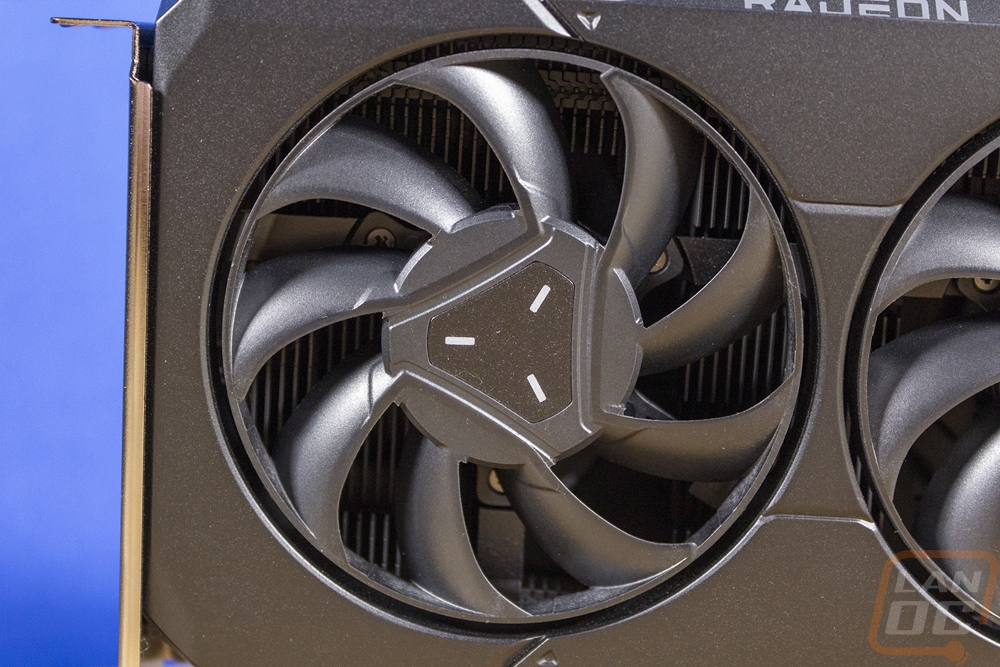
The reference Radeon RX 7600 design has an all-metal cooler shroud, just like the reference RX 7900 Series cards. The should design is cast which allows for more complex shapes and you can see that with the shroud angling at the ends and wrapping around at the top, bottom, and end of the card. It also has an X shape in the middle that includes angled sections at the top and bottom with the top having the Radeon branding printed on it. Everything including the dual fans is blacked out with the print being in a dark grey and no lighting.
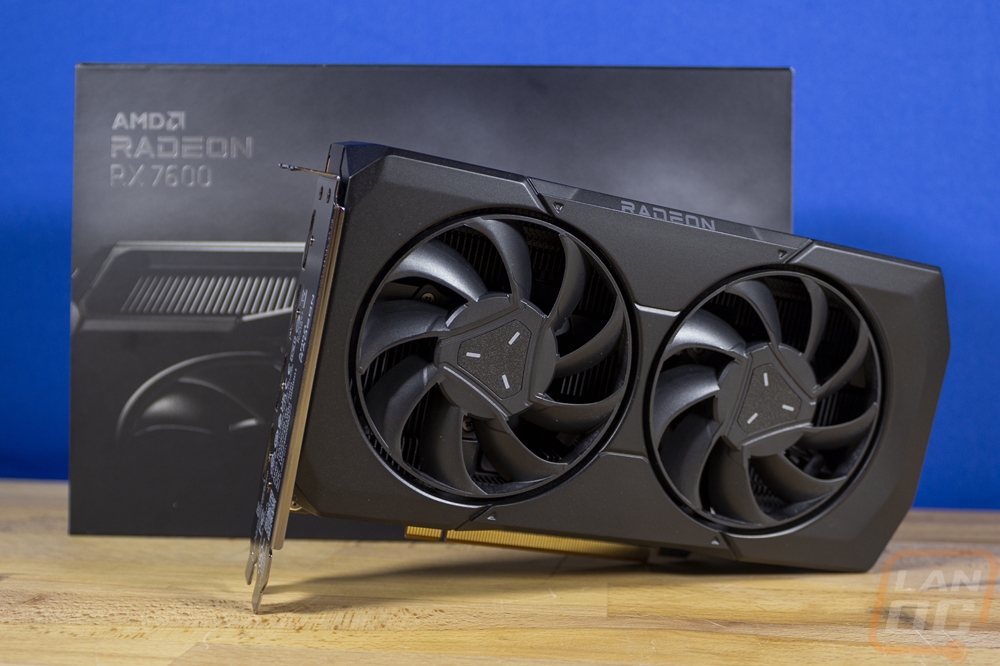
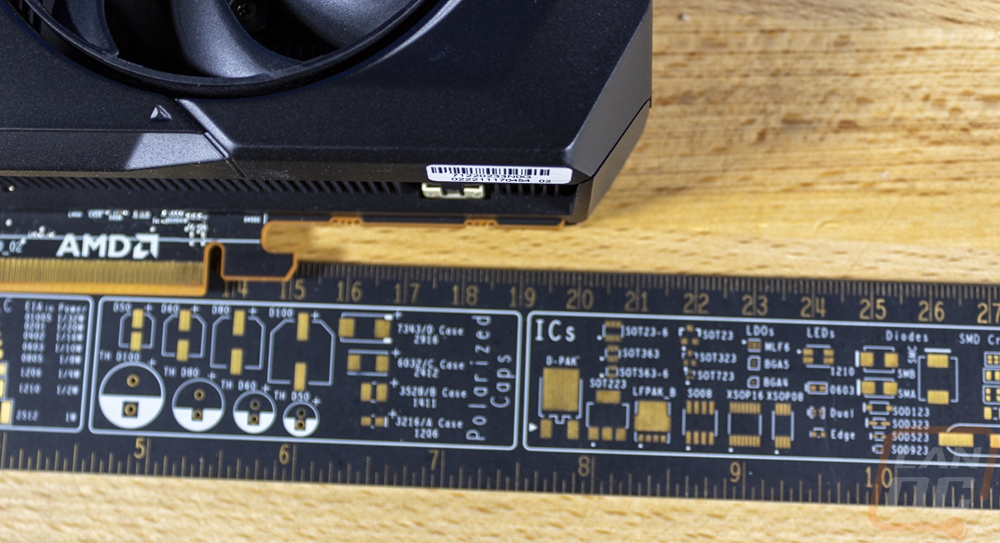
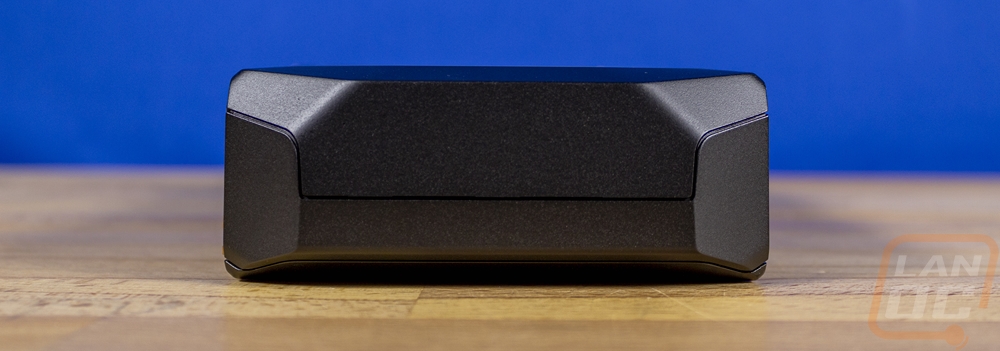
The reference Radeon RX 7600 that we have here today is a surprisingly compact design. Like the larger 7900 XT and 7900 XTX reference cards, AMD has kept this in a true dual-slot configuration which is great to see. But while it does have dual fans this is a much shorter card than the previous 7000 Series cards. The card is 210 mm in length, 40 mm thick (dual slot), and 110 mm tall. That puts the top of the cooler just 5 mm up over the top of the PCI bracket. This size card is going to fit in almost any configuration with the exception of cases that only support compact ITX length cards which are 175 mm in length.

The shorter card design has two axial fans whereas the 7900 XT and 7900 XTX both had three fans. The fans themselves have the same design with a triangle design in the middle and an outer ring to give the 9 blades more stability. These fans are smaller than those on the 7900 design, these are 78mm wide whereas the 7900 XTX had 85mm fans. These are the same or close to the same as the fans on the RX 7900 XT Reference design, however.
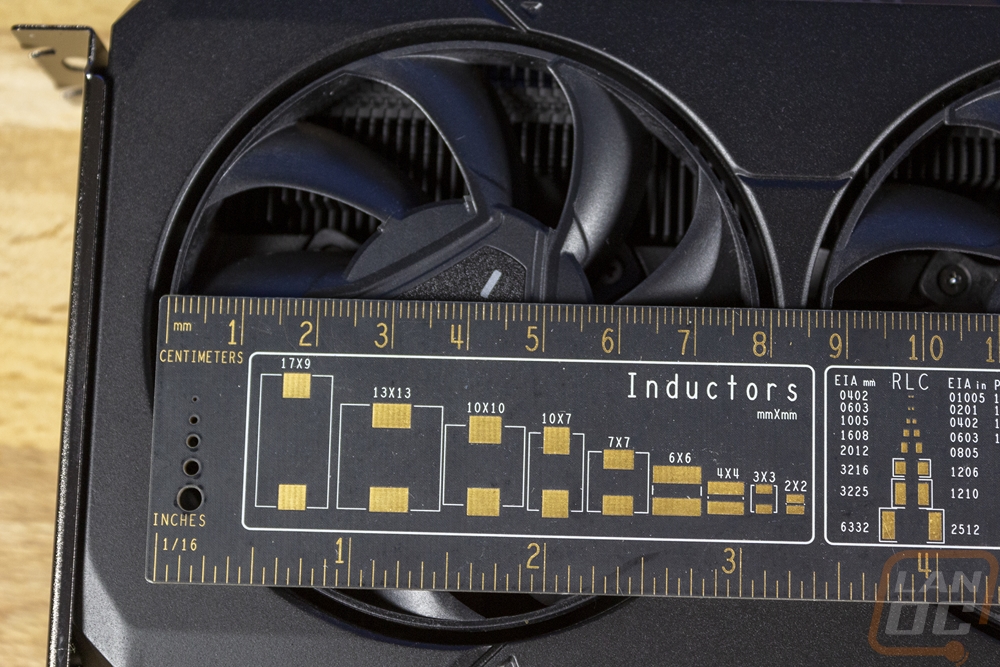
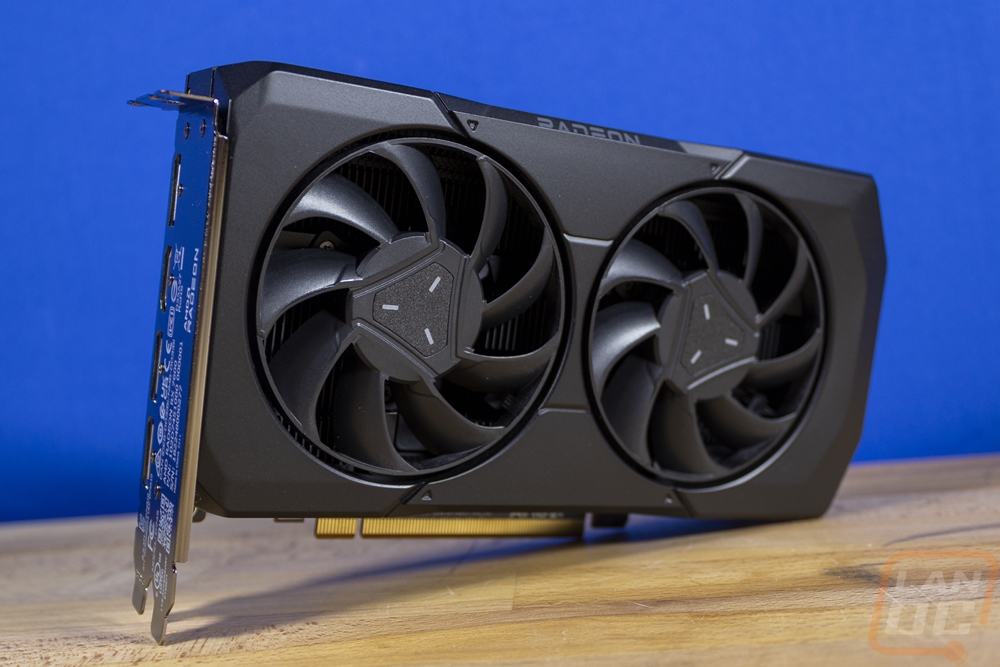
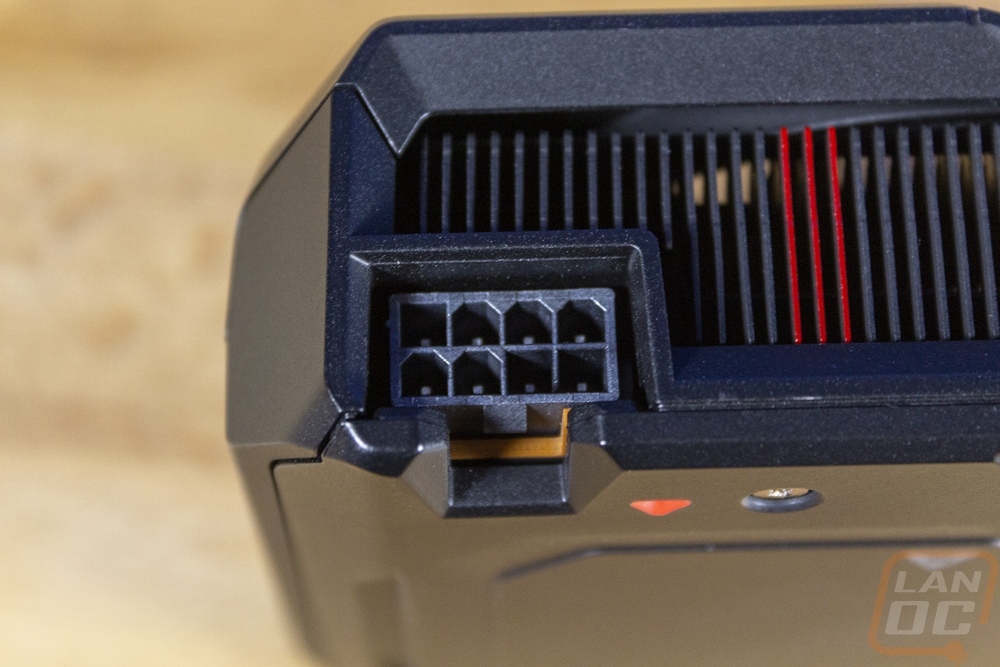
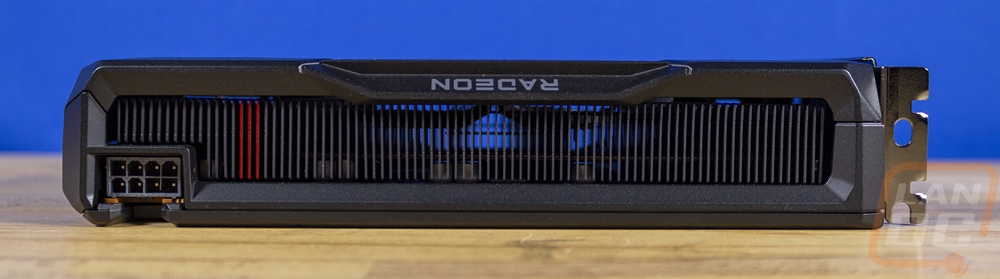
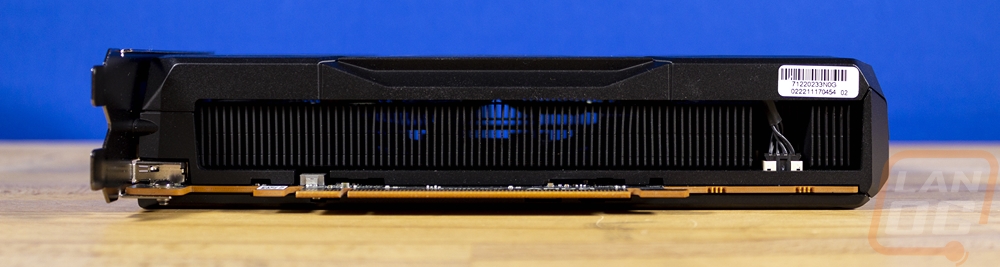
Checking out the top and bottom edges as well as the end of the Radeon RX 7600 we get an even better idea of how the heatsink is laid out. All of the aluminum fins are in a vertical orientation so with the axial fans on the front blowing down into the heatsink they push air up out the top and down out of the bottom. AMD has also blacked out all of the fins to match the rest of the card except for three fins which have a red finish. While the card is short, the PCB goes the full length of the card, and that is why we can have the power connection down at the end, I’ve gotten so used to the Nvidia cards having the shorter PCB and the power connection in the middle that I have almost forgotten how nice it can be to have that at the end for cleaner wiring. The Radeon RX 7600 has just one power connection an 8-pin PCIe power plug to power everything. The metal shroud wraps completely around the end of the card, which combined with the PCI bracket also being blocked off focuses all of the airflow to go up or down.
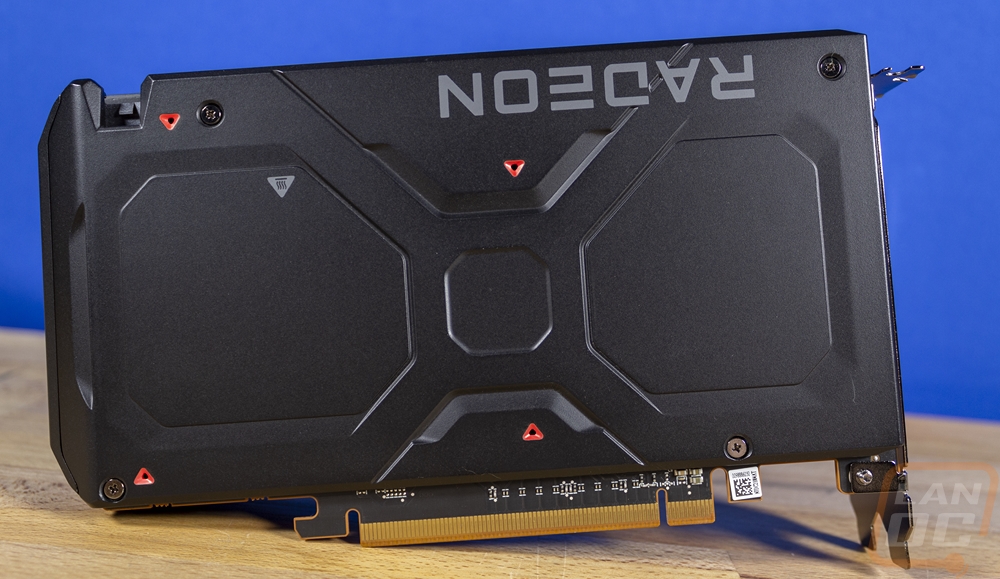
The back of the Radeon RX 7600 has the same design for its backplate as both 7900 series cards had only shorter to fit the shorter card length of the Radeon RX 7600. I’m surprised that the RX 7600 has a backplate at all, as we get down into this price range a lot of cards start to lose features like that. It is stamped steel and has an X shape in the middle as well as four small red arrows and the Radeon branding which is upside down to make it readable when installed in a case. I do wish however that like Nvidia on their Founders Edition cards that the model name itself was also visible. The backplate does have one cutout to help you access the power plug clip up in the top left corner.
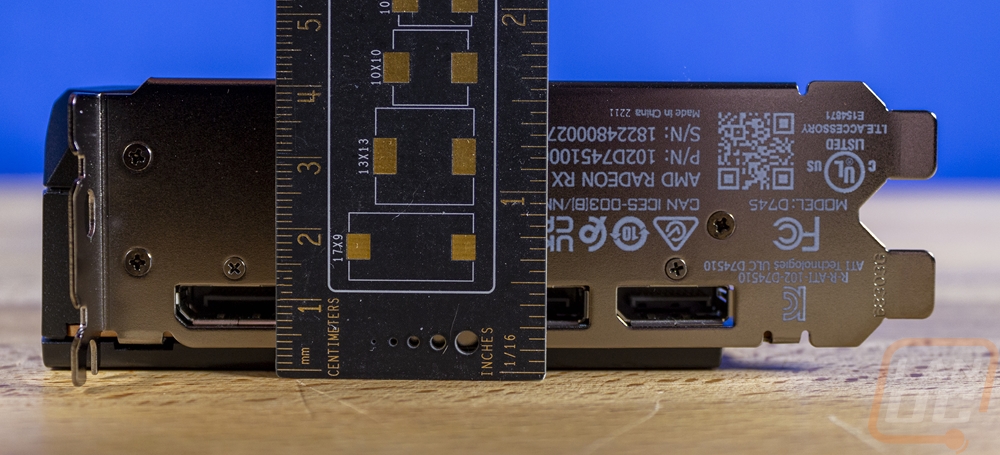
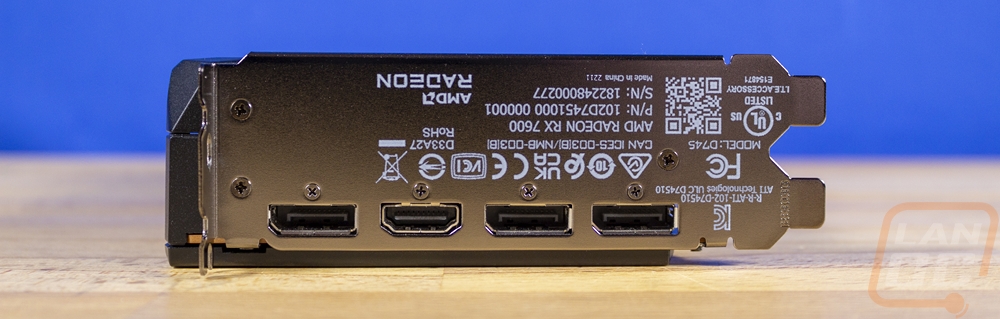
For display connections, the Radeon RX 7600 has three DisplayPort connections and one HDMI with the HDMI the second down, in the middle of the DisplayPorts. Like with the Radeon RX 7900 cards the full PCI bracket for the Radeon RX 7600 is solid. AMD has used this space to print all of the required certification logos and also the model and serial number information. Unlike Nvidia which has been doing the same thing, AMD has the serial number location where it should be readable from the back of your PC which if you have a problem means you don’t have to open your system up to start an RMA. The solid bracket also means that the cooler isn’t pushing any air out the back of your case, it all stays inside.
Test Rig and Procedures
CPU: Intel Core-i9 13900K – Live Pricing
PL1=PL2: 253, τ: 56 / 307A
Motherboard: Asus Z790 Extreme – Live Pricing
Cooling: Corsair H100i Elite LCD Display - Live Pricing
Noctua NT-H1 Thermal Paste - Live Pricing
Memory: Crucial 32GB Kit (2 x 16GB) DDR5-5600 UDIMM– Live Pricing
Storage: Sabrent Rocket Q4 2TB – Live Pricing
Power Supply: Thermaltake Toughpower GF3 1000W- Live Pricing
Case: Primochill Wetbench - Live Pricing
OS: Windows 11 Pro 64-bit - Live Pricing
|
Our Testing Procedures |
|
|
3DMark |
All 3DMark-based tests are done using the most recent version. We test using all three versions of Fire Strike, Both Time Spy and Time Spy Extreme, and Speed Way. Tests to look at ray tracing performance are done with Port Royal when supported and for Nvidia cards that support DLSS, the DLSS subtest is also done at 1440p with the performance setting and DLSS 2.0 as well as a look at DLSS 1, 2, and 3 at 4K. |
|
Unigine Superposition |
1080p Extreme and 4k Optimized benchmarks along with the VR Future test are done. The VR test is done at the Oculus resolution |
|
VRMark |
Only the Blue room test is run |
|
CS:GO |
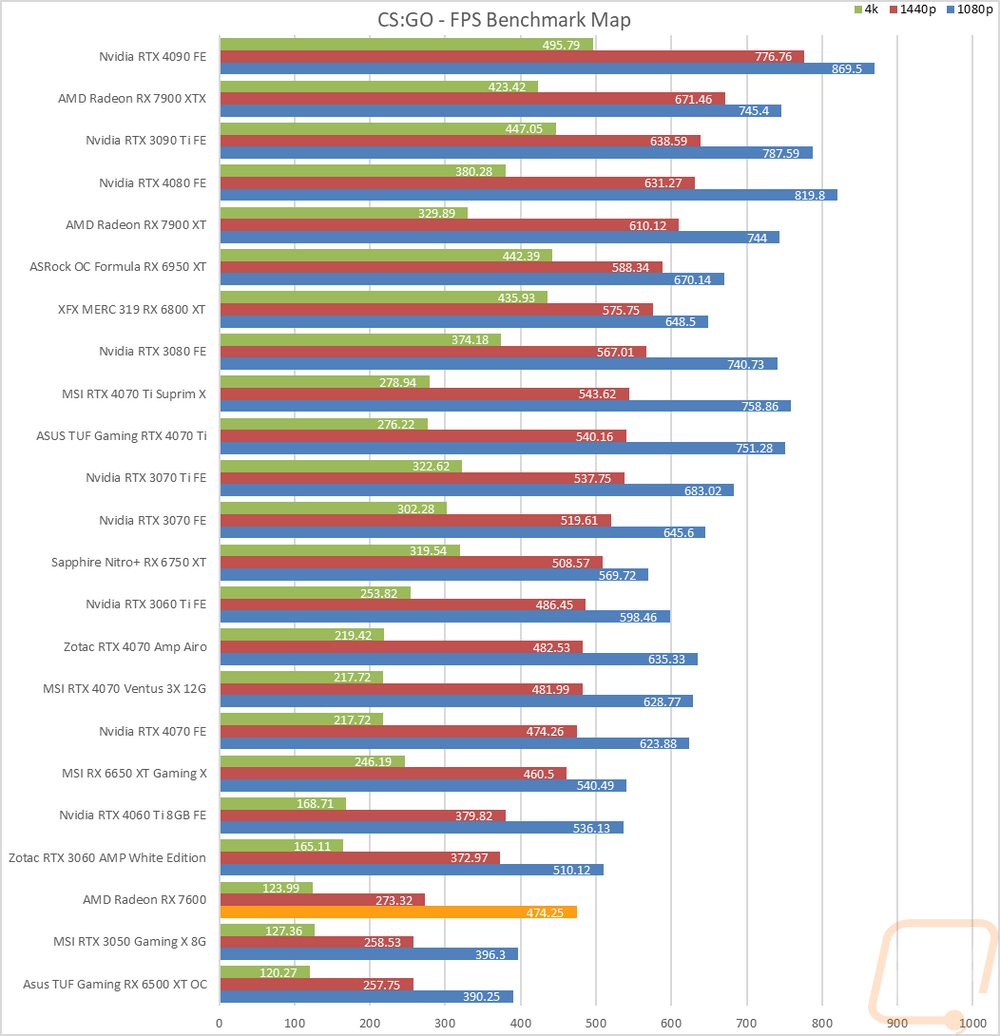
This test is done using the workshop map called CS:GO Benchmark. You can find more information at this link. https://www.gamingpcbuilder.com/how-to-install-csgo-fps-benchmark-map/ I test at 1080p, 1440p, and 4K resolutions. All auto settings are turned off and detail is set to their highest settings. shadow quality high, model texture detail high, shader detail very high, AA set to 16x, uber shaders enabled |
|
Ghost Recon Breakpoint |
Built-in benchmark tested at 1080p, 1440p, and 4k with the Ultra and Medium detail settings |
|
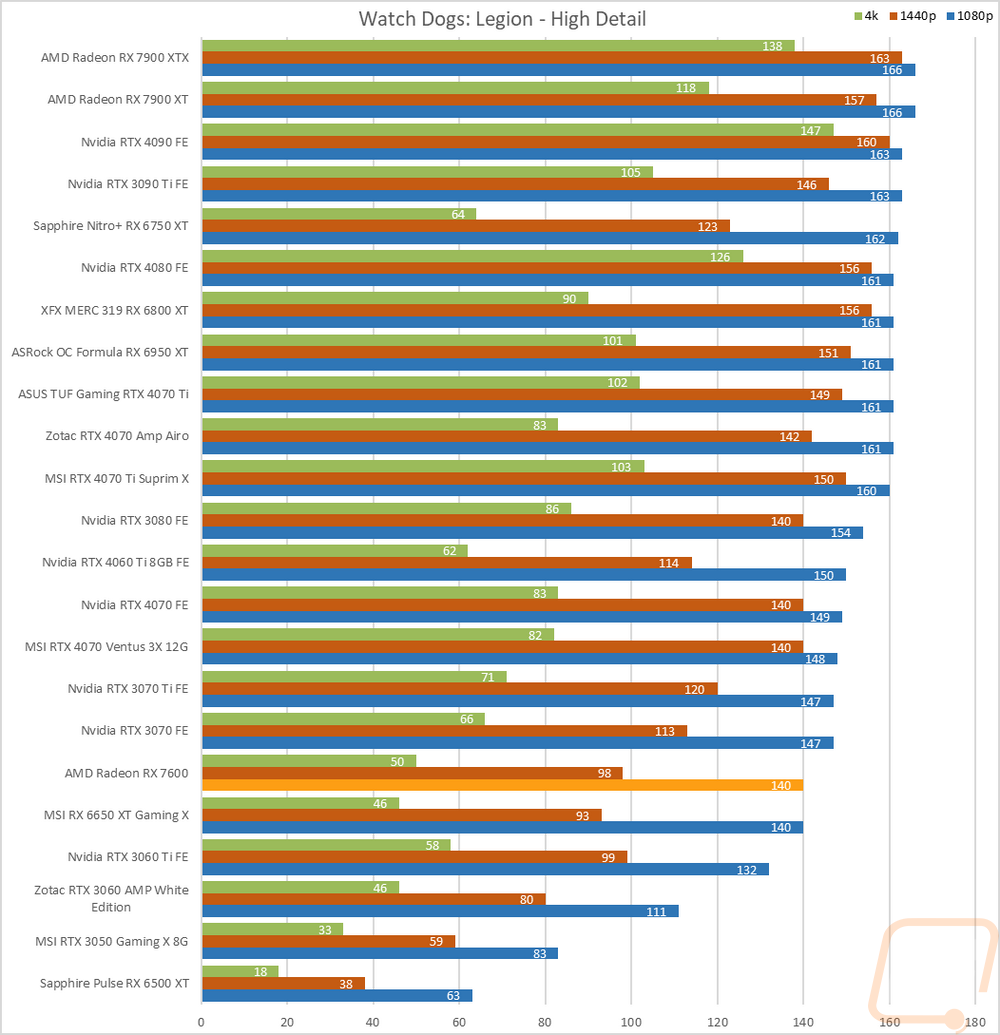
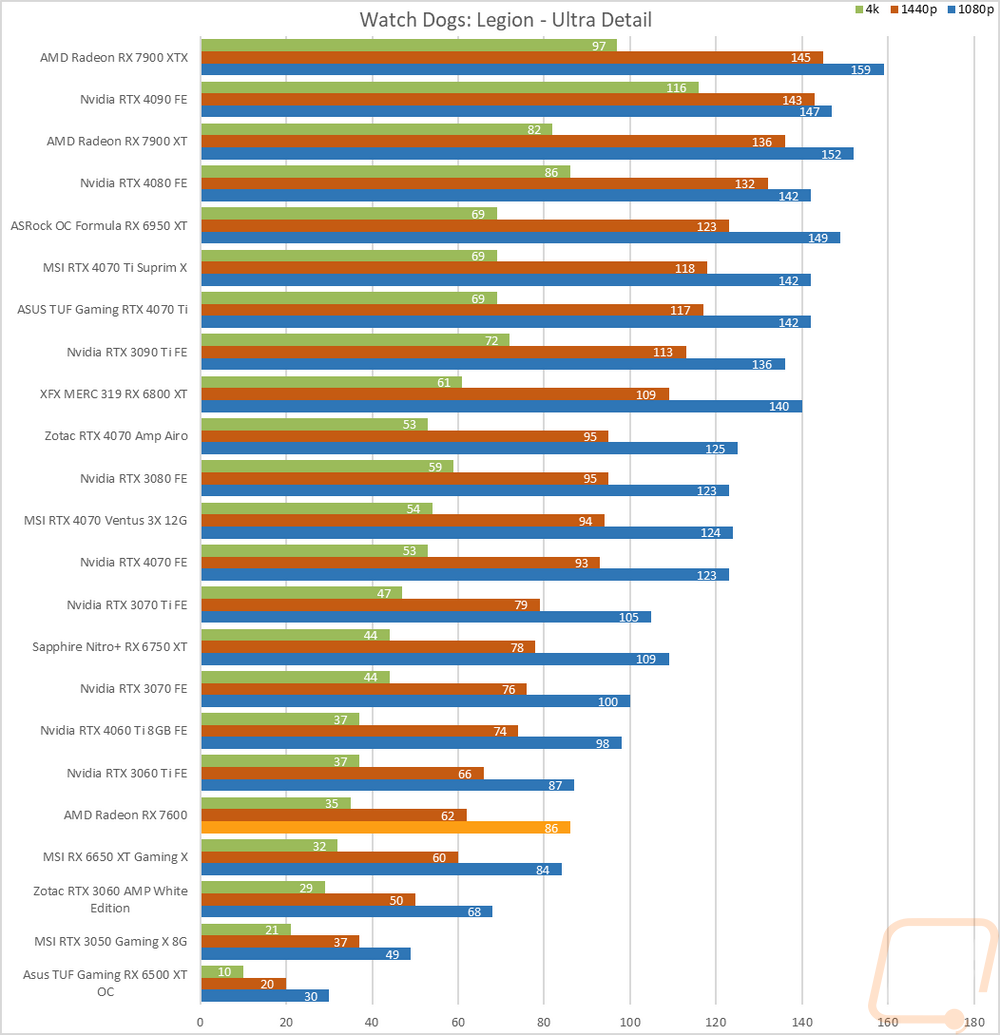
Watch Dogs: Legion |
Built-in benchmark testing at ultra and high details. Tested at 1080p, 1440p, and 4k. I also do RTX and DLSS testing on Nvidia cards at 4K using the Ultra detail settings as a base as well. |
|
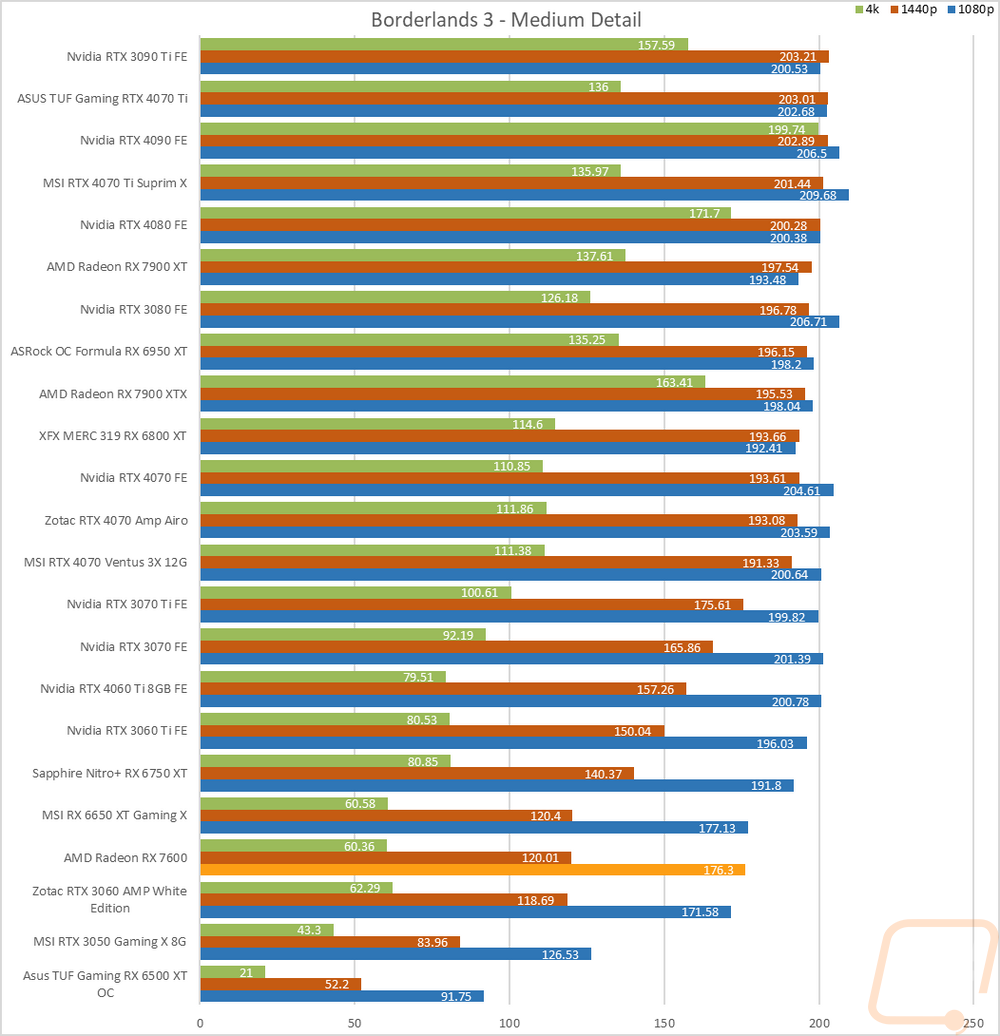
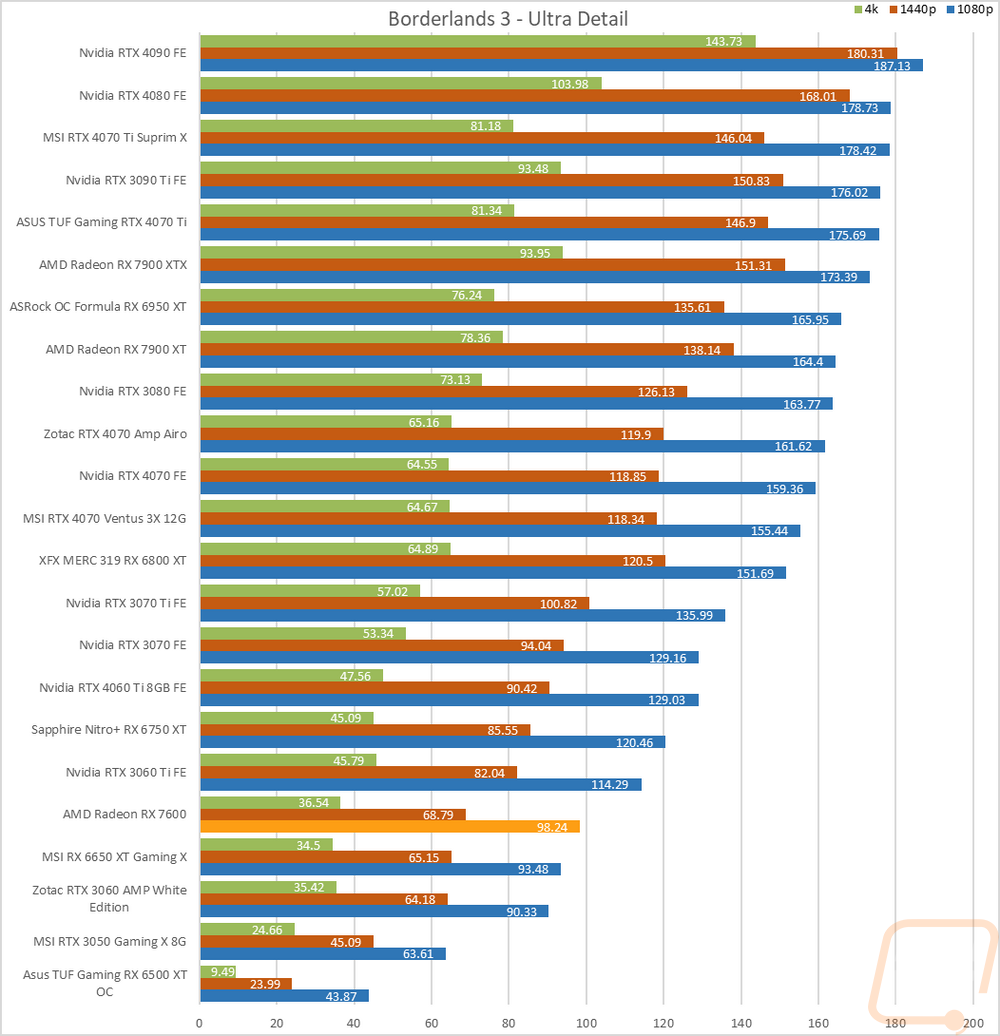
Borderlands 3 |
Built-in benchmark testing with the ultra detail setting and medium detail setting, done at full screen with default settings at 1080p, 1440p, and 4k on DX11 |
|
Metro Exodus |
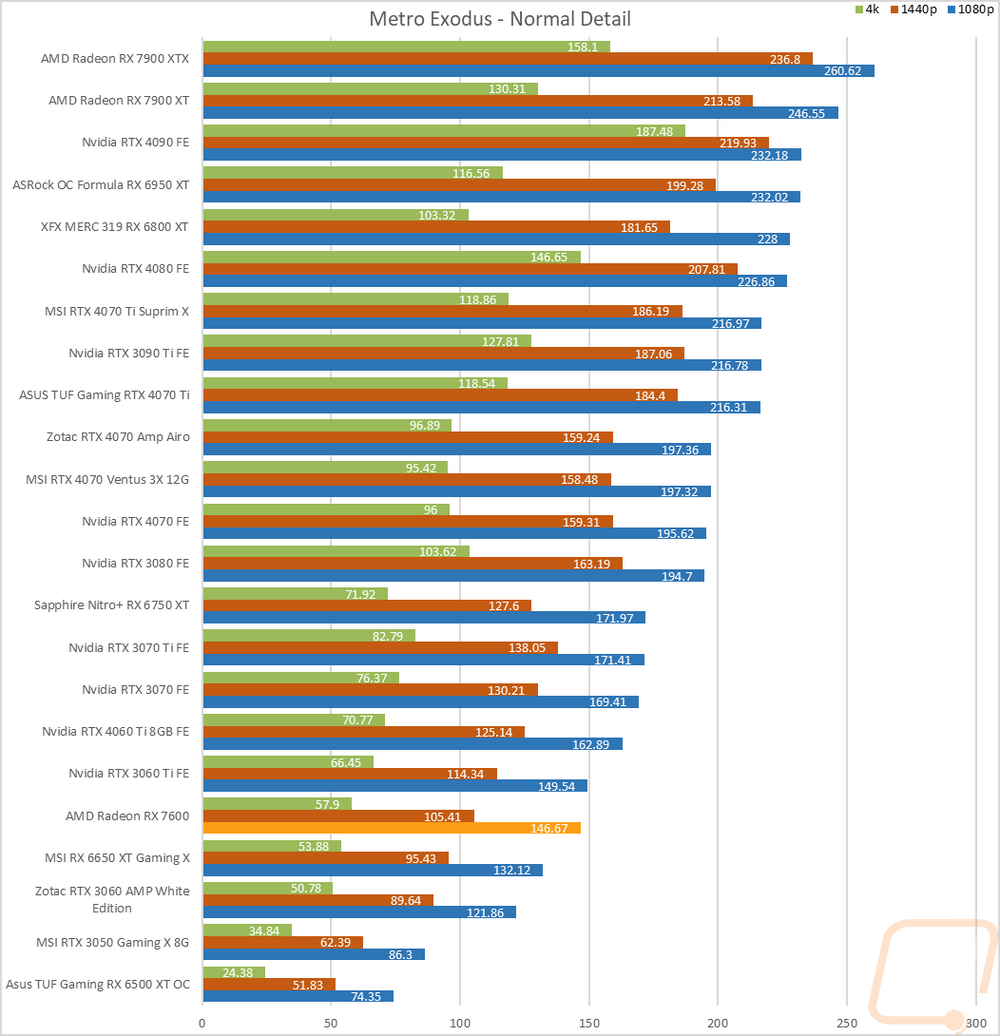
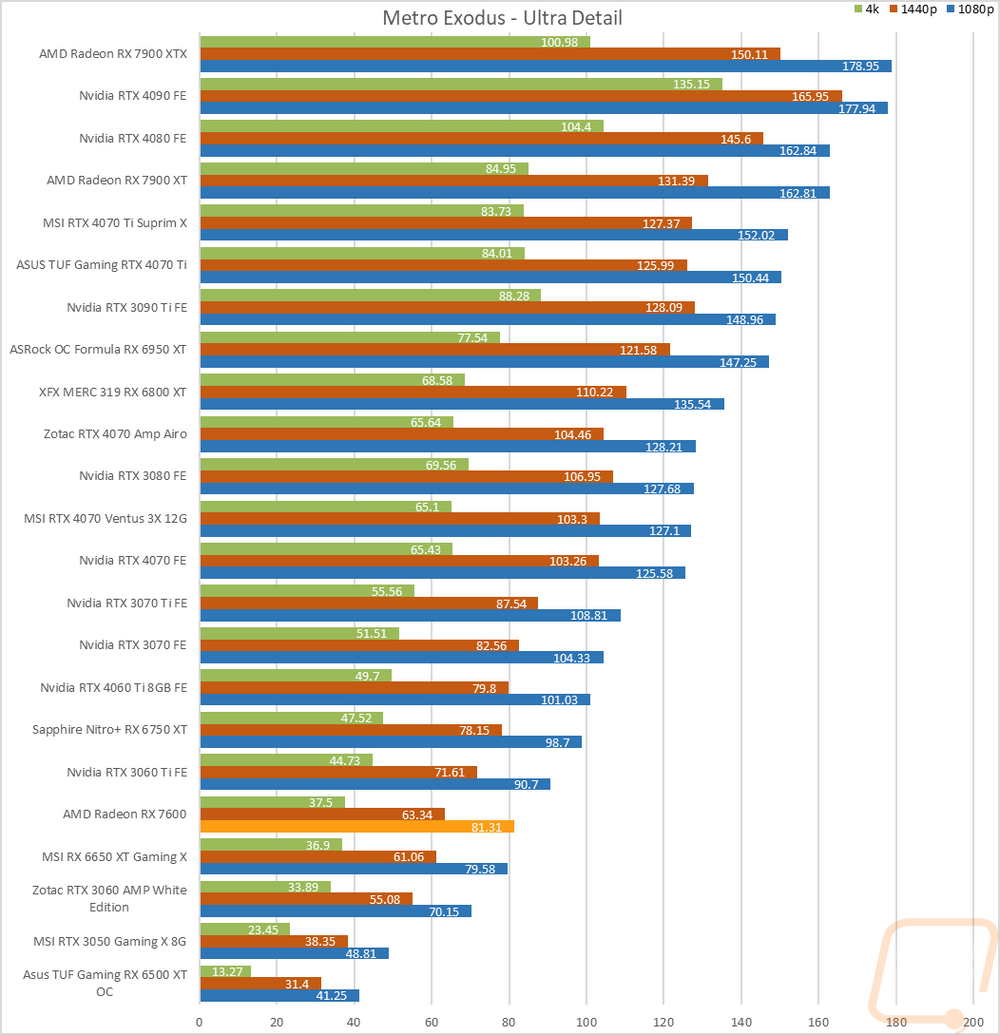
Using built-in benchmark, testing at ultra and normal details at 1080p, 1440p, and 4k. I also do RTX and DLSS testing at 4K with the ultra-detail base settings for Nvidia cards as well. |
|
World War Z Aftermath |
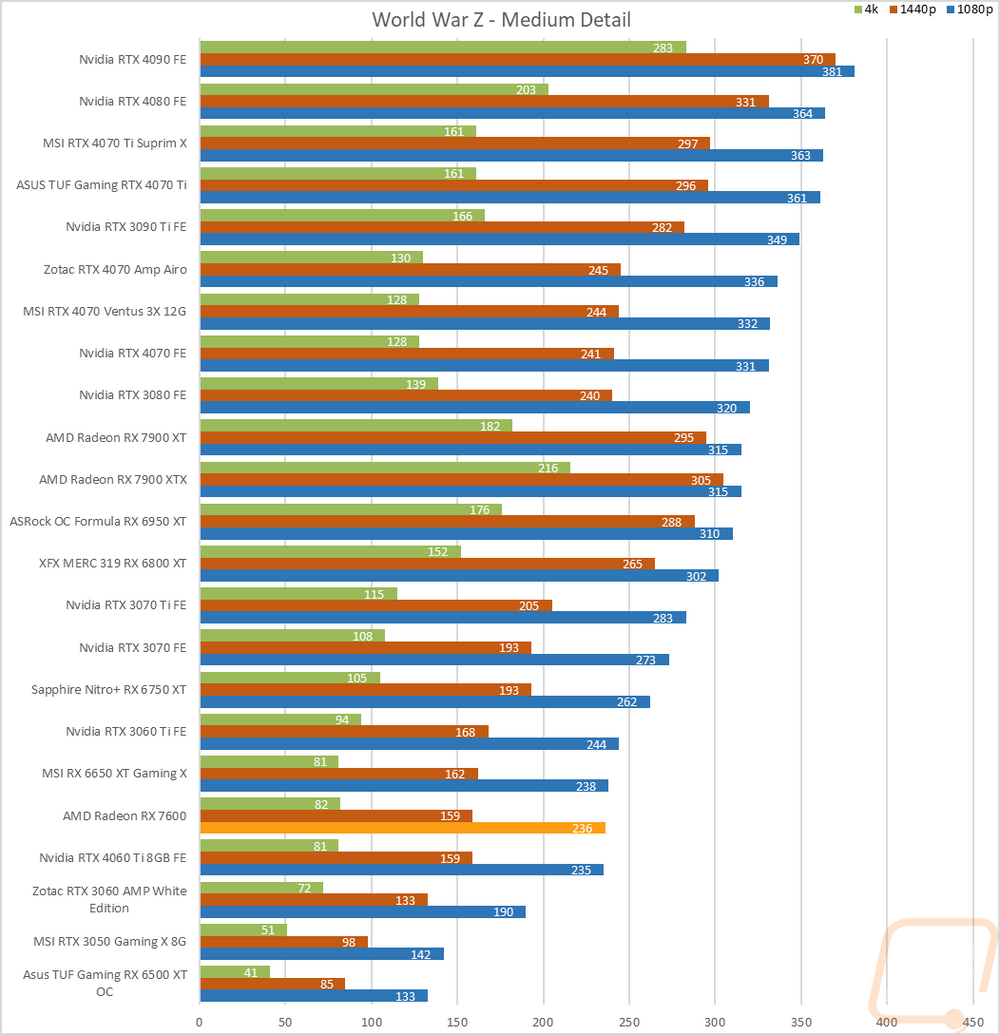
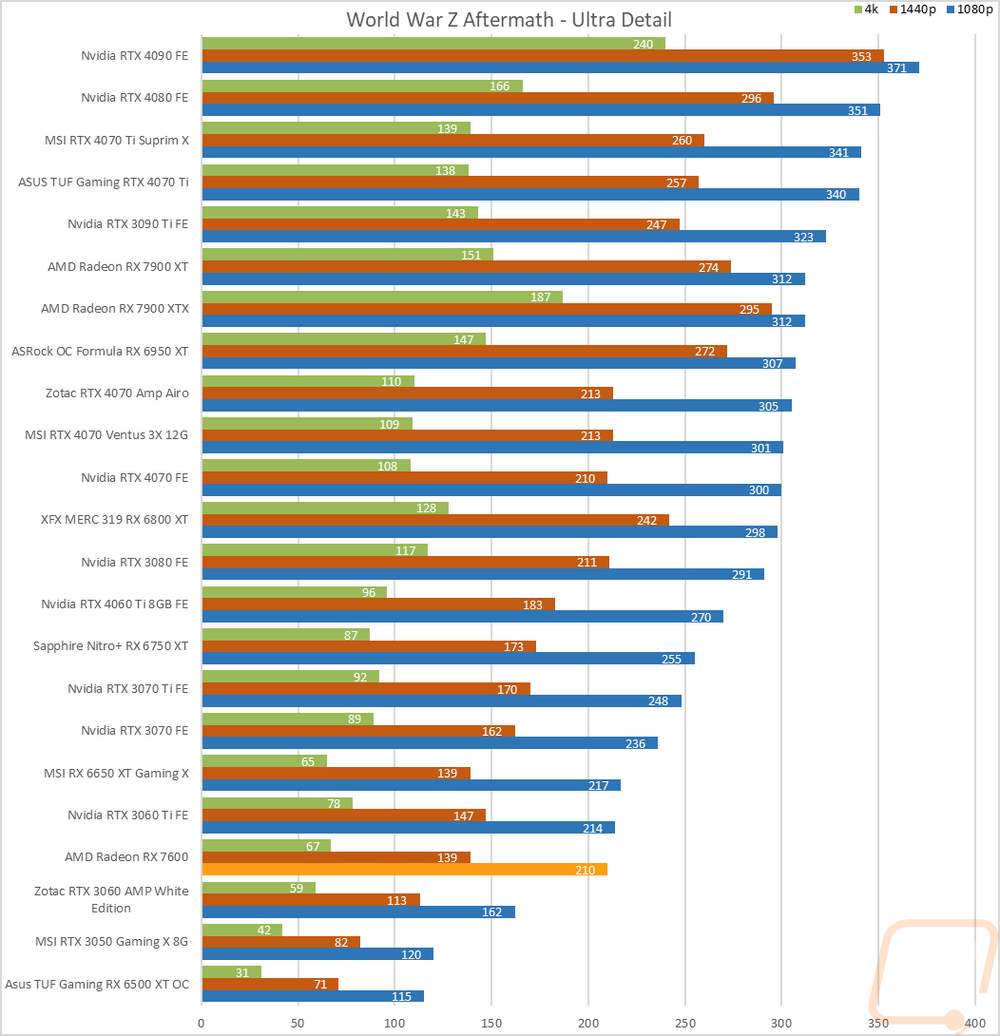
Built-in benchmark in DX11 testing both the Ultra detail and Medium detail levels at 1080p, 1440p, and 4K resolutions |
|
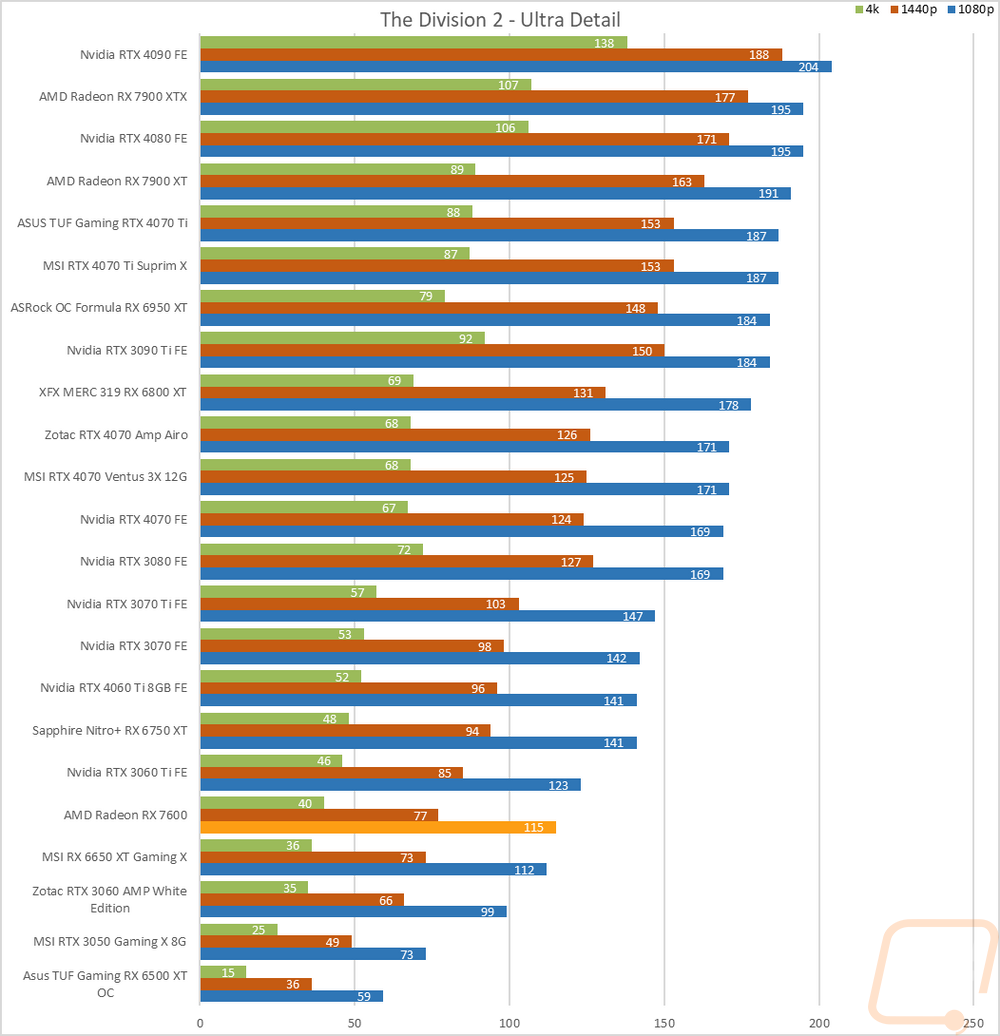
The Division 2 |
Built-in benchmark at Ultra detail with V-Sync turned off at 1080p, 1440p, and 4k resolutions. |
|
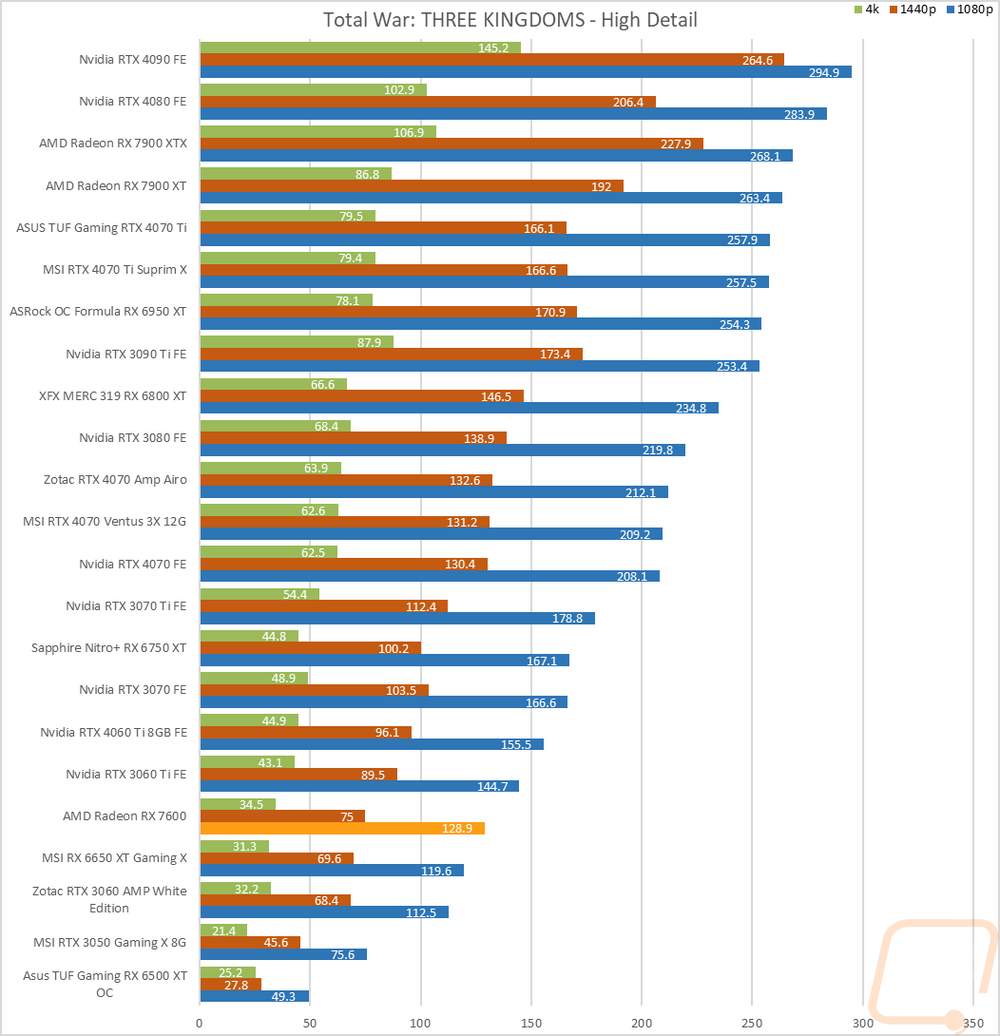
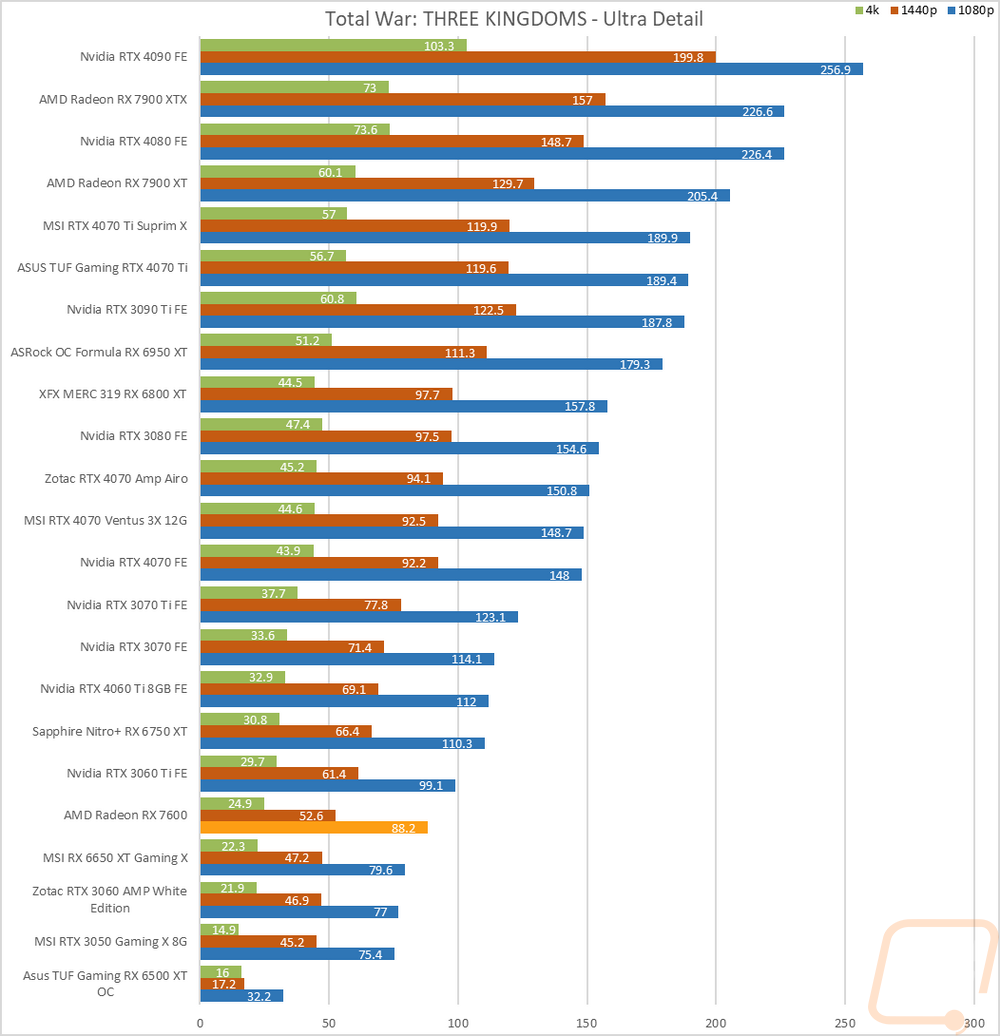
Total War: Three Kingdoms |
Built-in benchmark using the Battle Benchmark setting. Tested at 1080p, 1440p, and 4k at both high and ultra detail settings |
|
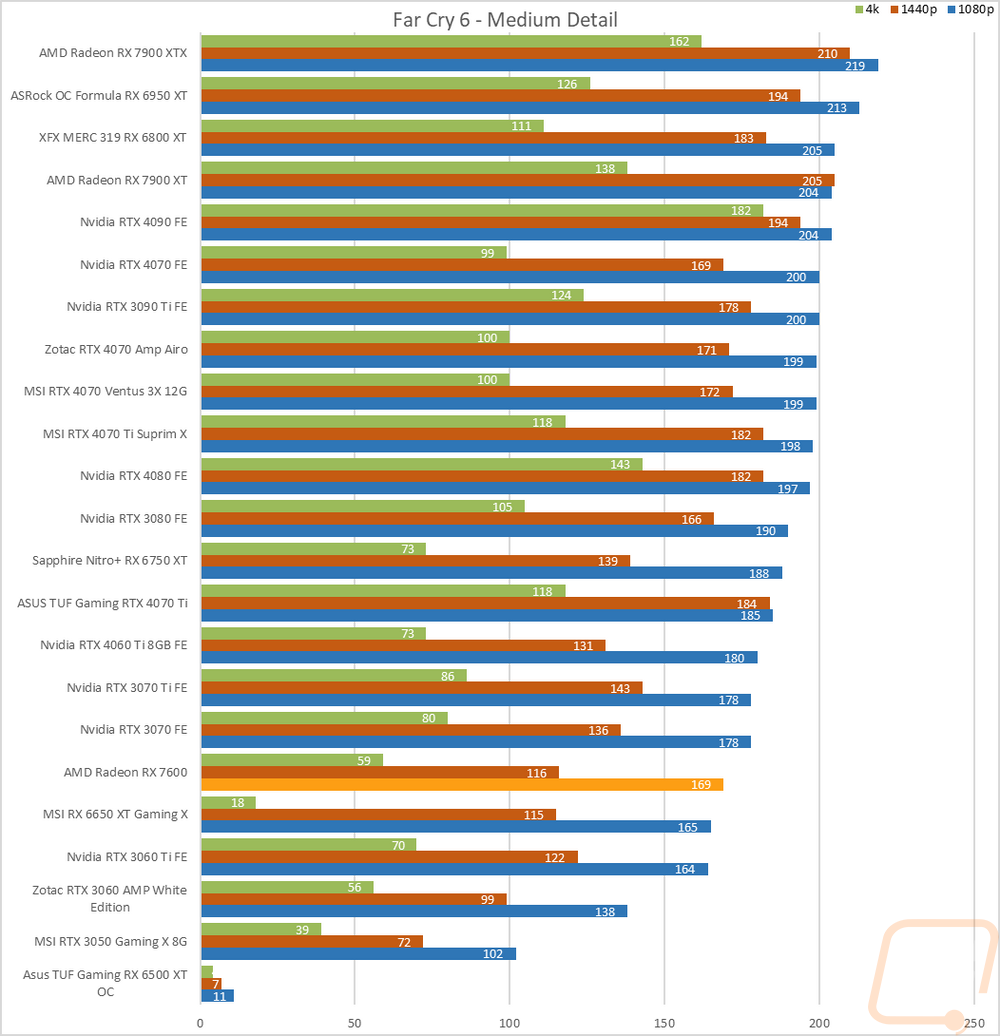
Far Cry 6 |
Built-in benchmark tested at 1080p, 1440p, and 4k with the Ultra and Medium detail settings |
|
V-Ray 5 |
V-Ray 5 benchmark us run with CUDA and RTX settings on cards that support it |
|
Boundary Benchmark |
Testing different DLSS detail levels on cards that support it. All testing is done at 4k with RTX on |
|
Bright Memory Infinite RTX Benchmark |
Benchmark all of the different RTX detail levels. Resolution at 4k and DLSS on balanced for each test |
|
Passmark Performance Test 10.2 |
Test using the GPU Compute Score inside of Passmark’s Performance Test 10.2 |
|
Blender |
Using the standard Blender Benchmark I run the test using the Blender 3.4 setting which tests using the Monster, Junkshop, and Classroom tests. |
|
OctaneBench 2020.1 |
OctaneBench is designed to test rendering in OctaneRender. RTX and non-RTX are both ran. This is a CUDA-only test so only Nvidia cards are tested |
|
Power Testing |
Using a PCat v2 to monitor power between the PCIe slot and the card as well as power through the power cables I test the peak power when running ADIA64, 3DMark Speed Way, 3DMark Time Spy Extreme, FarCry 6 at 4k and Ultra Detail, Watch Dogs Legion at 4K and Ultra detail, and Blender 3.4.0. The results are then averaged as well as the highest result. |
|
Noise Testing |
Our Noise testing is done using a decibel meter 18 inches away from the video card on the bottom/fan side of the card. We test at 50% and 100% fan speeds as well as a third test while under load using AIDA64's stress test. This is done using a Protmex PT02 Sound Meter that is rated IEC651 type 2 and ANSI S1.4 type 2. Tests are done set weighted to A and set to a slow response using the max function. The ambient noise level in the testing area is 33.3 decibels. |
|
Temperature Testing |
Using AIDA64, the GPU stress test is run for 30 minutes or until the result has leveled off. The test is run twice, once with the stock fan profile and a second time with 100% fan speed. During this, I also document the 100% fan speed RPM and document the delta between the fan profile and 100% fan speed as well as get thermal images. |
Synthetic Benchmarks
As always I like to start my testing with a few synthetic benchmarks. 3DMark especially is one of my favorites because it is very optimized in both Nvidia and AMD drivers. It's nice to not have to worry about it being favored too much either way and the repeatability of the results makes it a nice chance to compare from card to card, especially when comparing with the same GPU. The RX 7600 is targeted at the upcoming RTX 4060, but until July we won’t be able to compare them together. For now, I will be looking at how it compares with the RTX 3060 and the RX 6650 XT which are the cards selling in the same price range right now.
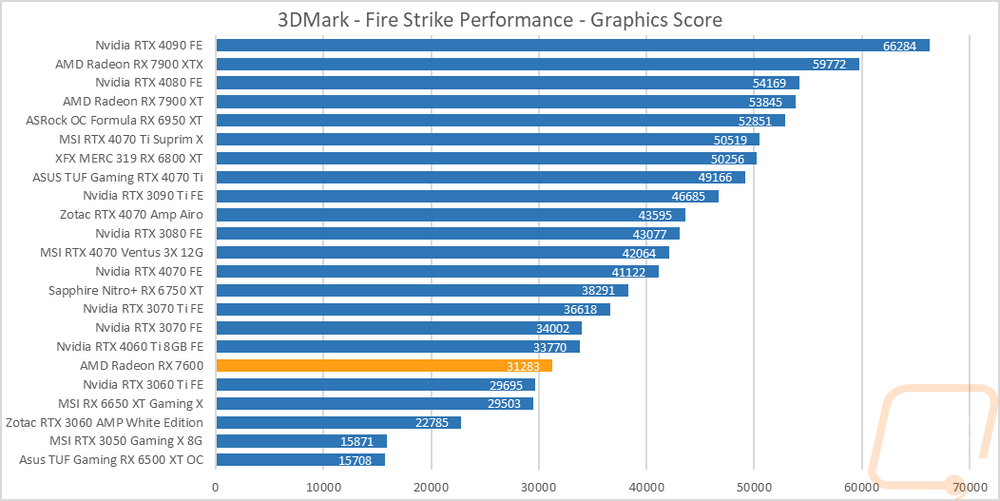
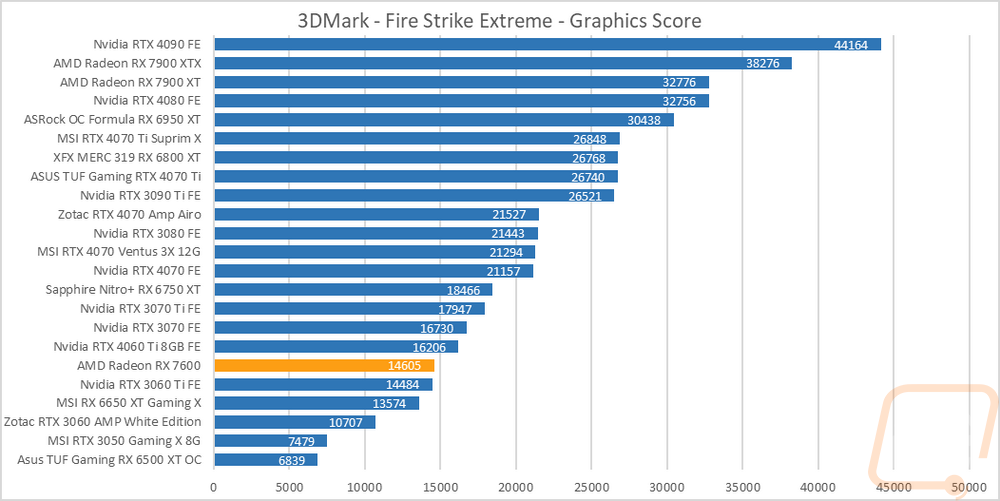
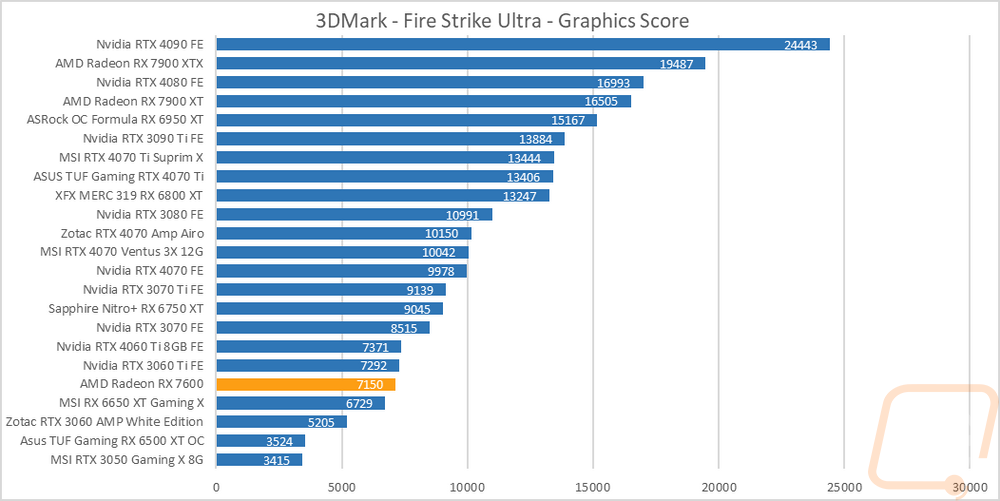
The first round of tests were done in the older Fire Strike benchmark which is a DX11 test. There are three detail levels, performance, extreme, and ultra. The Fire Strike tests are focused on older DX11 performance and the last few generations of Nvidia cards have performed lower here, with that in mind the Radeon RX 7600 did well outperforming the RTX 3060 Ti in two of the three tests also coming in with a 1780 point different between it and the overclocked RX 6650 XT.
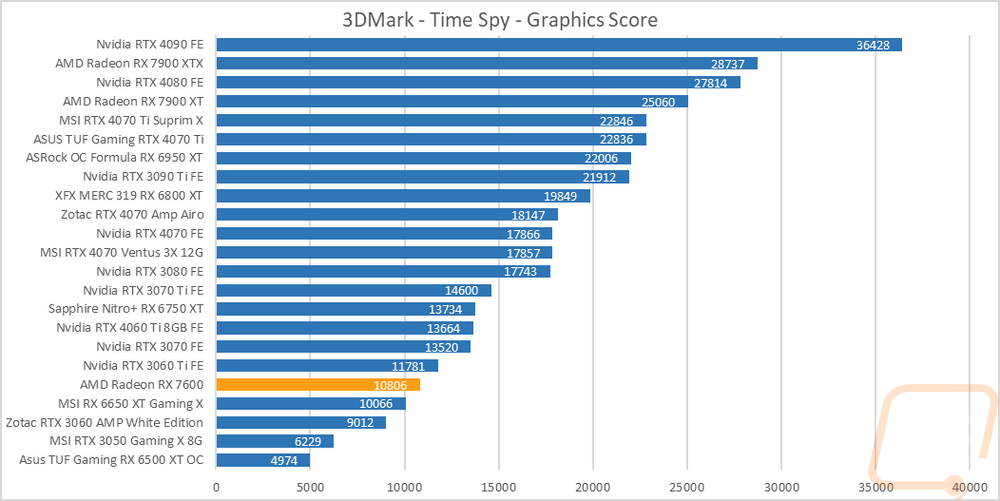
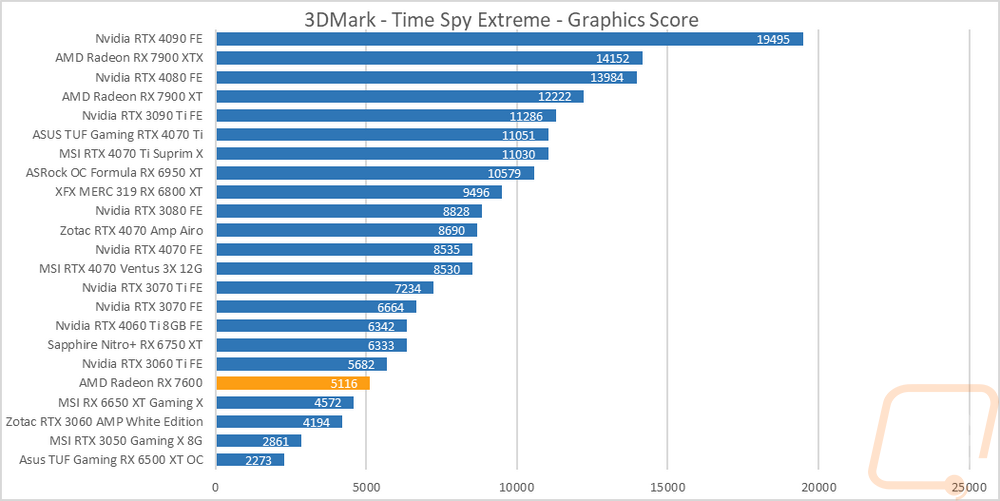
The next two were both based on the Time Spy benchmark, 3DMark’s DX12-focused benchmark. One is the standard test and then there is the extreme detail level. The Radeon RX 7600 is down below the RTX 3060 Ti here which isn’t a surprise at all. It is still out ahead of the RX 6650 Xt and the RTX 3060 which puts the Radeon RX 7600 as a 20% improvement over the 3060. That gap gets wider in the Time Spy Extreme test where the gap between the two is 21%.
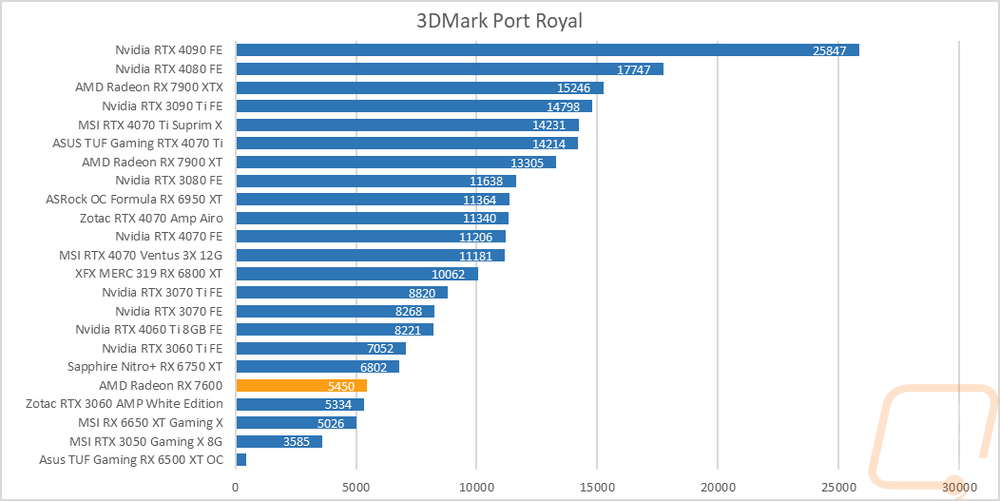
For ray tracing performance, I ran both the 3DMark Port Royal test which is ray tracing focused as well as the new 3DMark Speed Way test which tests all future-looking features including ray tracing. In Speed Way, the Radeon RX 7600 scored a 1958 in the Speed Way test which was out in front of the RX 6650 XT but still 249 points behind the RTX 3060. For Port Royal, the Radeon RX 7600 did a little better and is nearly tied in performance with the RTX 3060.

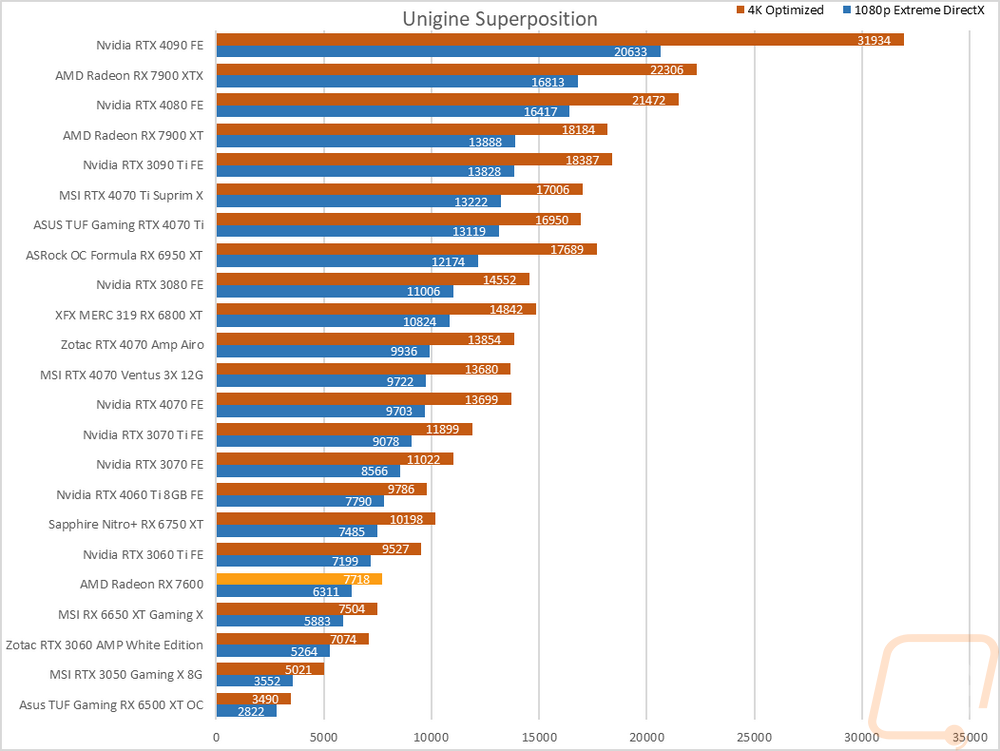
The last test was using the Unigine-based Superposition benchmark and I tested at 1080p with the extreme detail setting as well as the 4K optimized setting. In the extreme detail setting the Radeon RX 7600 is in front of the RX 6650 XT as well as the RTX 3060 in both tests. The gap between the cards is a lot smaller in the 4K optimized test but at 1080p even with the extreme detail, it is a 1047 point or 20% improvement from the RTX 3060 to the Radeon RX 7600.
VR Benchmarks
As for Virtual Reality, I love it but it is more demanding than traditional gaming. This is partially because of the resolutions needed to render for two eyes and because they render more than what is immediately visible. But also because of post effects to get the proper “fisheye” effect for it to look proper in your eyes with the HMD. You also have to have much higher expectations for frame rates in VR, skipping frames or lower FPS can cause motion sickness in VR. Because of that, I ran a few tests.
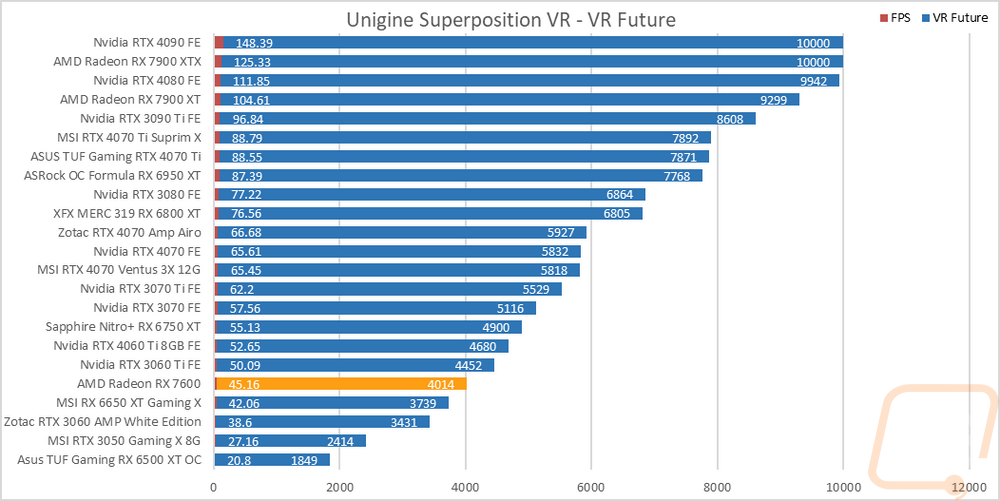
My first test was again in Superposition. This time I tested the VR Future test using the Oculus resolution. I have also included the average frame rate as well which is important for the cards at the top of the chart because for some reason Superposition is capped at 10,000 for its scores and that doesn’t show the performance gap in those cards at the top. The Radeon RX 7600 is sitting between the RX 6650 XT and the 3060 Ti. It is also a 17% improvement over the RTX 3060 which is below the 6650 XT.
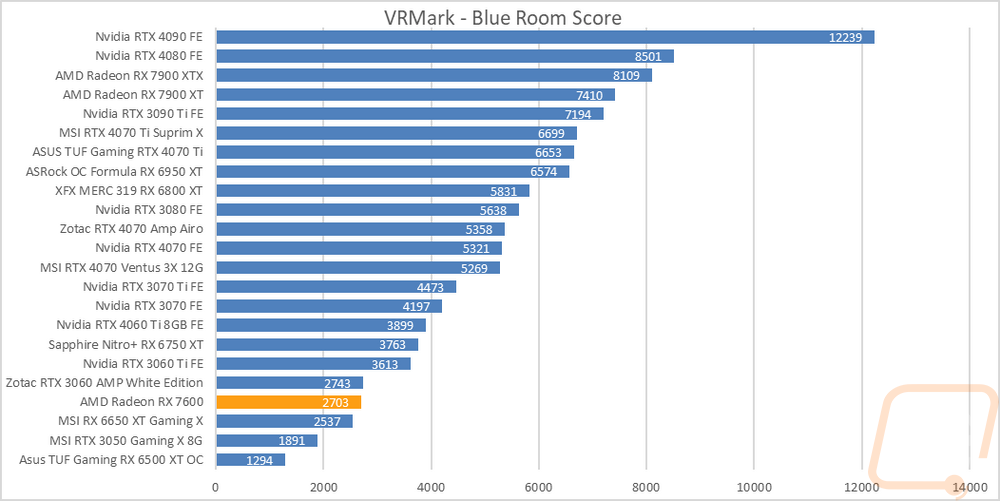
My second round of VR testing was in VRMark which has three tests that are similar to the VR tests in Superposition. I only focused on just the most demanding test called Blue Room which is looking more at future VR performance. Here the RTX 3060 did better and it and the Radeon RX 7600 are just 40 points off from each other.
In-Game Benchmarks
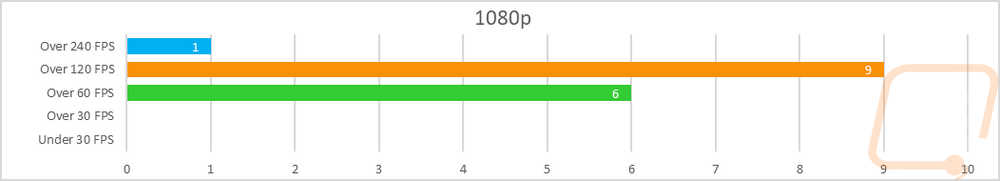
Now we finally get into the in game performance and that is the main reason people pick up a new video card. To test things out I ran through our new benchmark suite that tests 10 games at three different resolutions (1080p, 1440p, and 4k). Most of the games tested have been run at the highest detail setting and a mid-range detail setting to get a look at how turning things up hurts performance and to give an idea of if turning detail down from max will be beneficial for frame rates. In total, each video card is tested 54 times and that makes for a huge mess of results when you put them all together. To help with that I like to start with these overall playability graphs that take all of the results and give an easier-to-read result. I have one for each of the three resolutions and each is broken up into four FPS ranges. Under 30 FPS is considered unplayable, over 30 is playable but not ideal, over 60 is the sweet spot, and then over 120 FPS is for high refresh rate monitors.
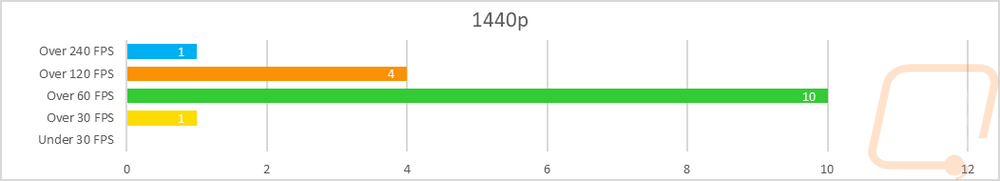
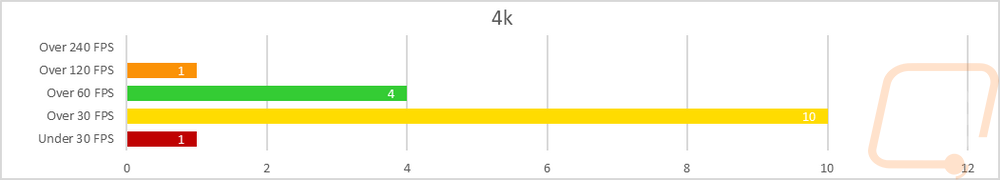
So how did the Radeon RX 7600 perform? Well, it is targeted at 1080p and at that resolution, it did really well. 6 of the results were over 60 FPS, 9 were in the 120-239 range, and then CS:GO as always was up over 240 FPS. Just for comparison, yesterday's 4060 Ti launch which isn’t really direct competition with the Radeon RX 7600 had 3 over 60, 11 over 120, and 2 over 240. Moving up to 1440p the 7600 was still able to hold its own, only one of the results were in the yellow barely playable range, 10 were over 60 FPS, 4 were over 120, and 1 was over 240. Then once you hit 4k the performance really tanks. One result was unplayable at under 30 FPS and 10 were in the playable but not smooth range with just 4 over 50 FPS and 1 over 120 FPS.
Another way I have compiled all of our game results is with the overall averages. I do always skip CS: GO, its frame rates are always really high and would skew the overall averages. But I have the Radeon RX 7600’s performance at 1080p, 1440p, and 4k along with comparisons against the RTX 3060, RX 6650 XT, and the RTX 3060 Ti as well to show the cards around the RX 7600 performance-wise. At 1080p which is where AMD is targeting this card, it is up near the RTX 3060 Ti which is surprising and the RTX 3060 is way behind. The average shows again that while not designed for it, 1440p is possible as well but 4k averaged down under 60 FPS.
|
Average FPS (w/o CS:GO) |
1080p |
1440p |
4K |
|
RTX 3060 Ti |
144.8 |
105.4 |
59.2 |
|
Radeon RX 7600 |
140.8 |
96.7 |
50.4 |
|
MSI RX 6650 XT Gaming X |
138 |
93.9 |
42.9 |
|
Zotac RTX 3060 AMP |
117.2 |
83.2 |
46.2 |
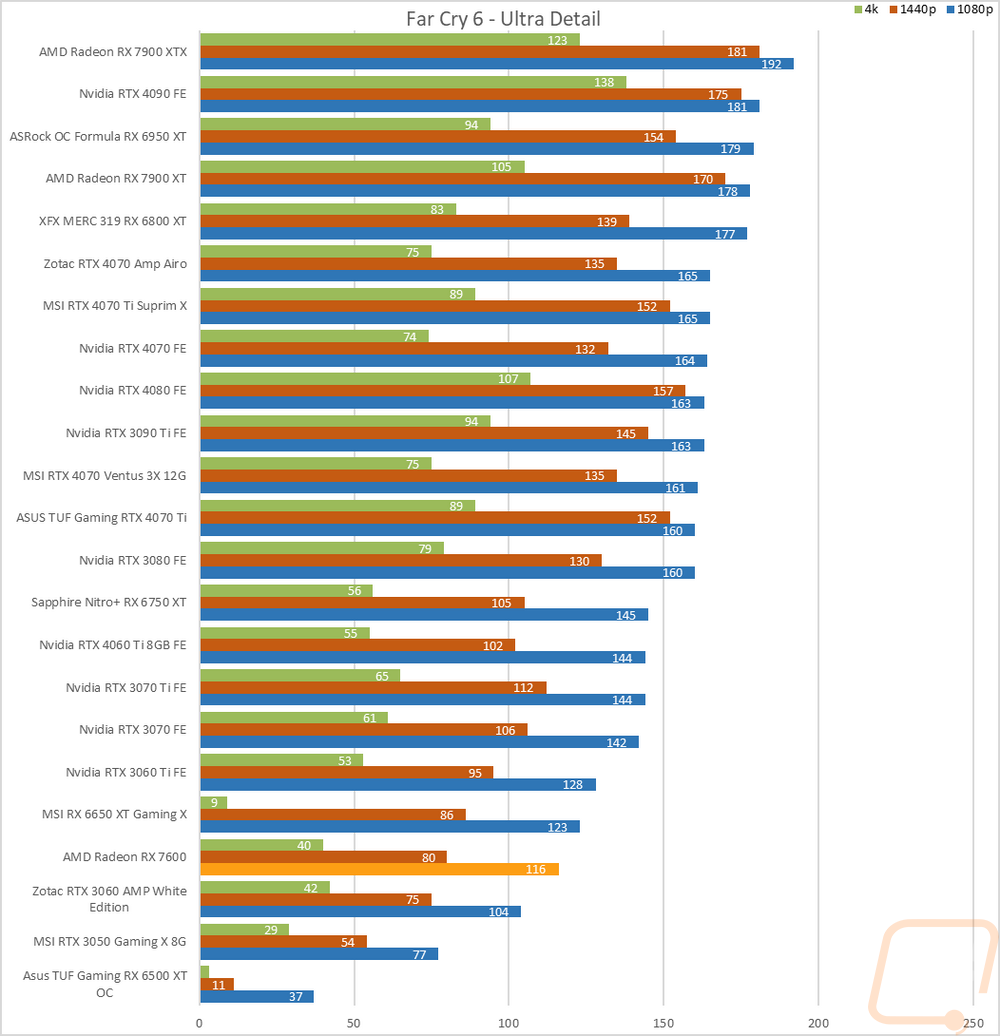
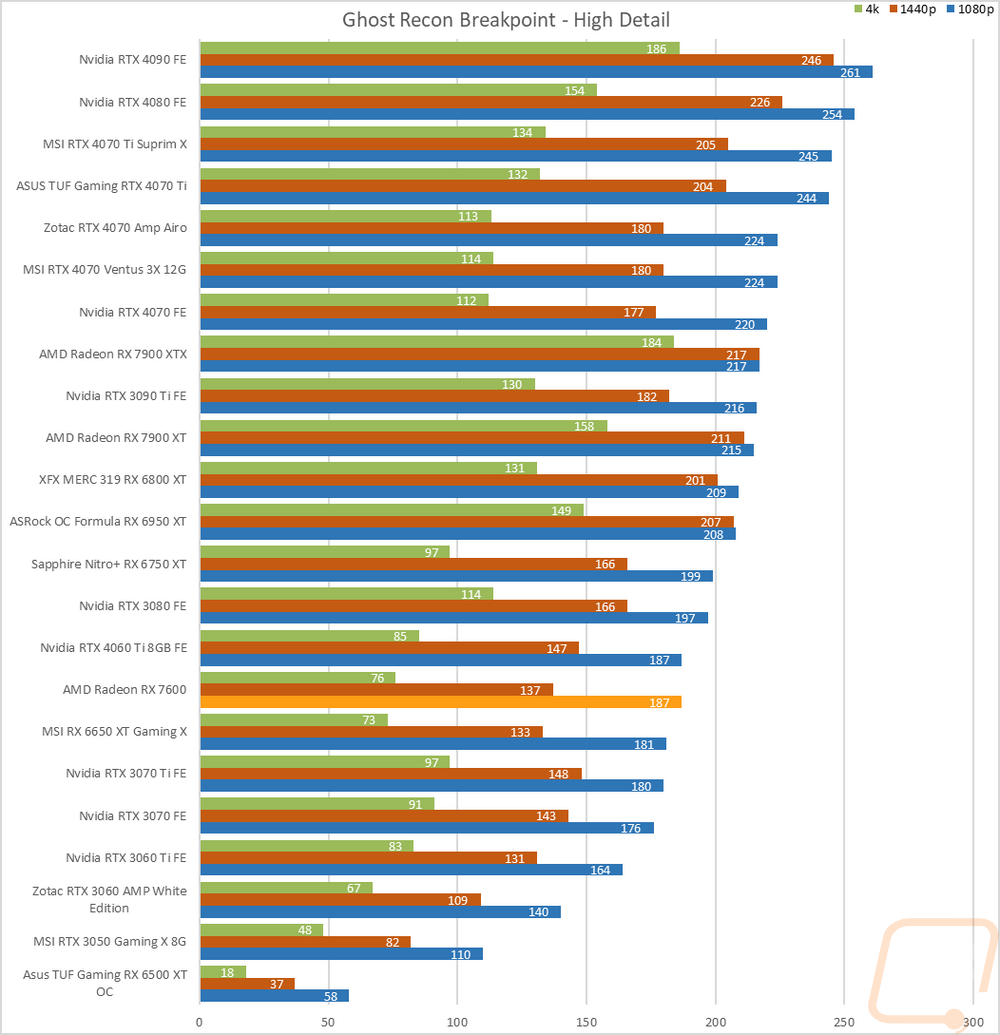
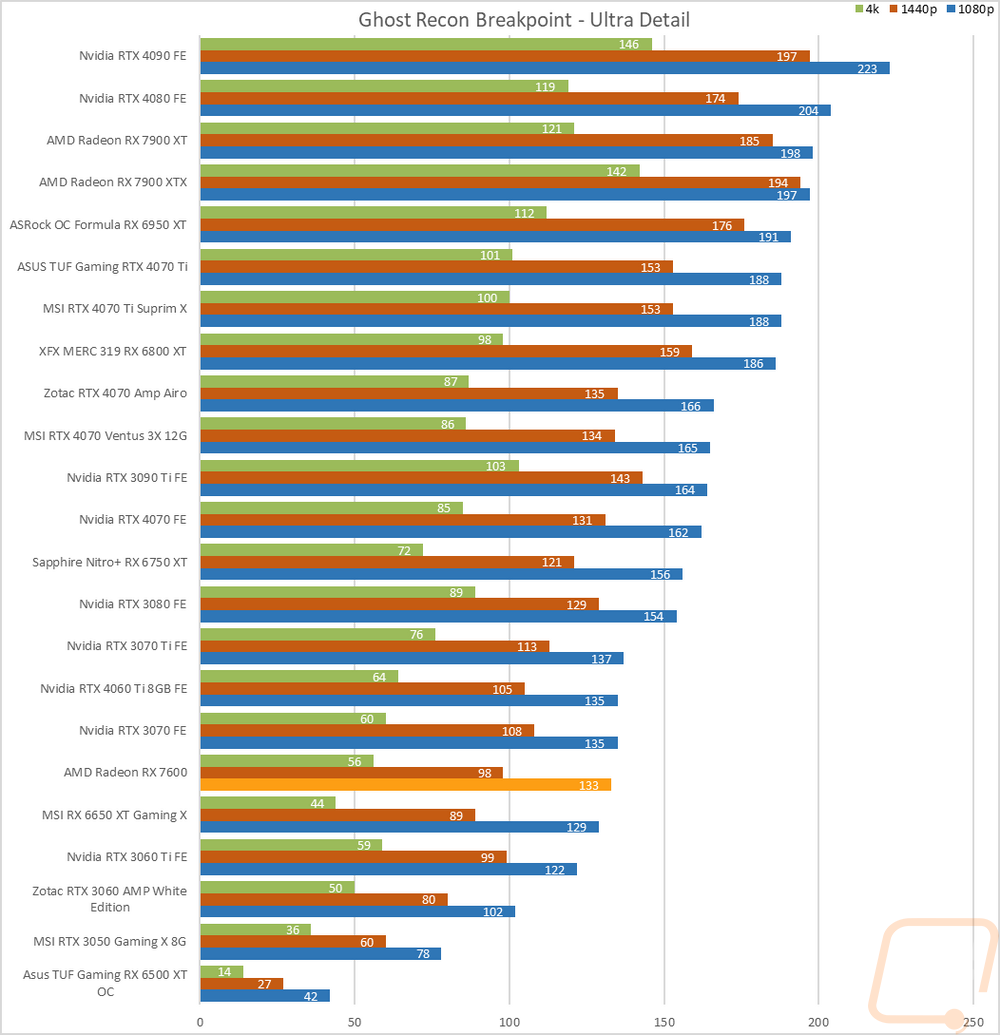
Of course, I have all of the actual in game results as well for anyone who wants to sort through the wall of graphs below. Most of the results just reinforce what we are seeing in the averages above, the Radeon RX 7600 is out in front of the RX 6650 XT but behind the RTX 3060 Ti in most of the results. In a few, you see it does even better like in Ghost Recon Breakpoint where it was up surprisingly close to the new RTX 4060 Ti. But there are also results like Far Cry 6 where the Radeon RX 7600 was behind the 6650 XT.
Compute Benchmarks
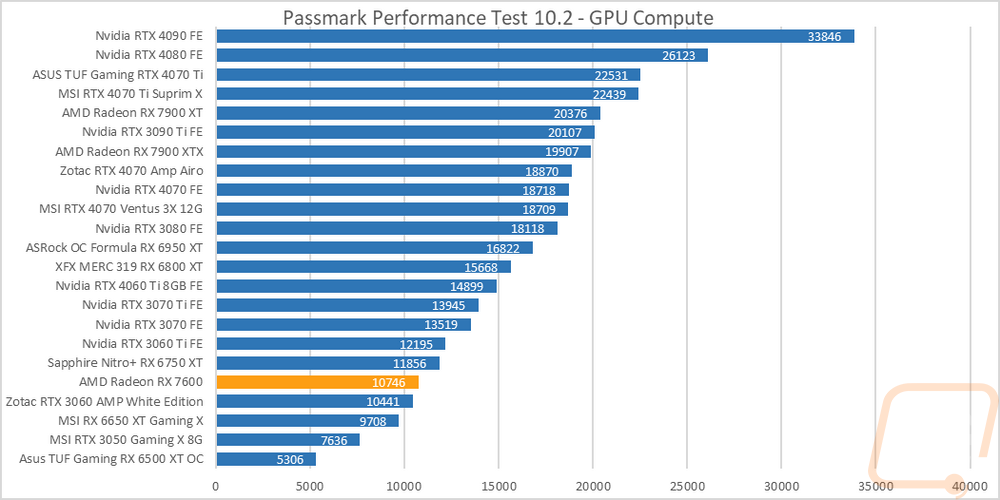
Now some people don’t need a video card for gaming, they need the processing power for rendering or 2D/3D production, or in some cases people who game also do work on the side. So it is also important to check out the compute performance on all of the video cards that come in. That includes doing a few different tests. My first test was a simple GPU Compute benchmark using Passmark’s Performance Test 10 and the Radeon RX 7600 scored 10746 in Passmark’s GPU Compute test. This put it above the RTX 3060 by 305 points, a 2.9% improvement.
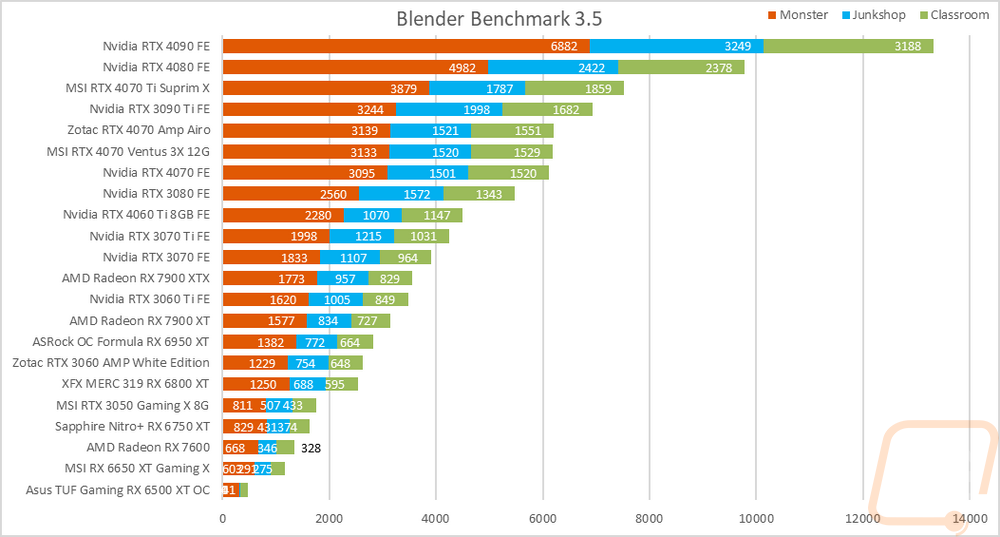
Blender is always my favorite compute benchmark because the open-source 3D rendering software is very popular and it isn’t a synthetic benchmark. With the latest version of Blender, they redid the benchmark so we now have a new test that runs three different renderings and gives each a score. I have all three stacked together so we can see the overall performance. The Radeon RX 7600 didn’t do as well here in comparison to the Nvidia cards with the RTX 3050 being faster even.
Cooling Noise and Power
For my last few tests, rather than focusing on in game performance, I like to check out other aspects of video card performance. These are also the most important ways to differentiate the performance between cards that have the same GPU. To start things off I took a look at power usage.
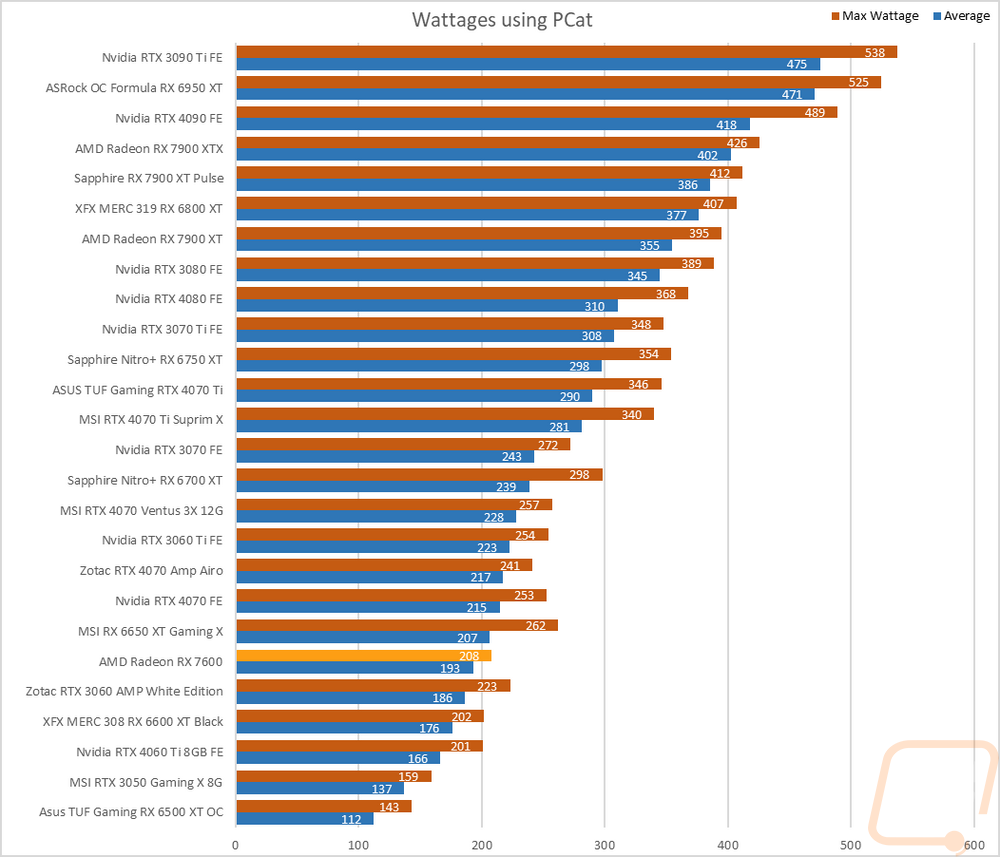
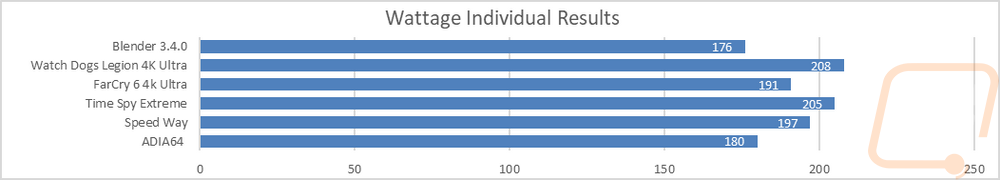
For this, our new test setup utilizes the Nvidia-designed PCat v2 along with cables to handle both traditional 6 or 8-pin connections as well as the new 12VHPWR. The PCat also utilizes a PCIe adapter to measure any power going to the card through the PCIe slot so we can measure the video card wattage exclusively, not the entire system as we have done in the past. I test with a mix of applications to get both in game, synthetic benchmarks, and other workloads like Blender and AIDA64. Then everything is averaged together for our result. I also have the individual results for this specific card and I document the peak wattage result as well which is almost always Time Spy Extreme but wasn’t this time, it was actually watch dogs which was 3 watts higher at 208 watts. Compared to the RTX 3060 that the RX 7600 beat on in the rest of the tests its peak wattage was lower than the 3060 but the average wattage was higher. But if we look newer and compare it with the newly announced RTX 4060 Ti the RX 7600’s wattage looks high, with the average across our tests 17 watts higher but the peak is better at 7 watts.
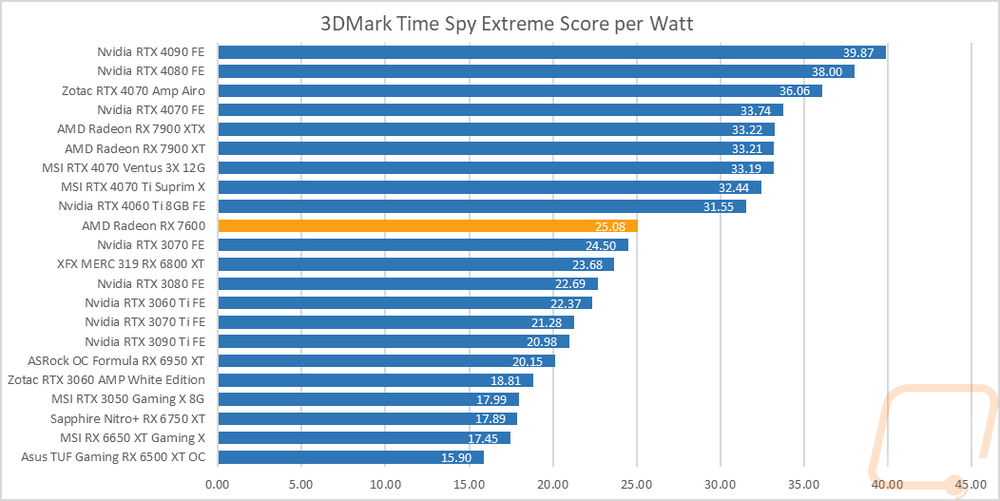
With having exact peak wattage numbers when running Time Spy Extreme I was also able to put together a graph showing the total score for each watt that a card draws which gives us an interesting look at overall power efficiency in the popular and demanding benchmark. The Radeon RX 7600 improves a lot compared to the RX 6650 XT and the rest of the last generation's cards but there is a big gap between it and any of the other current generation cards including the 7900 XT and 7900 XTX.
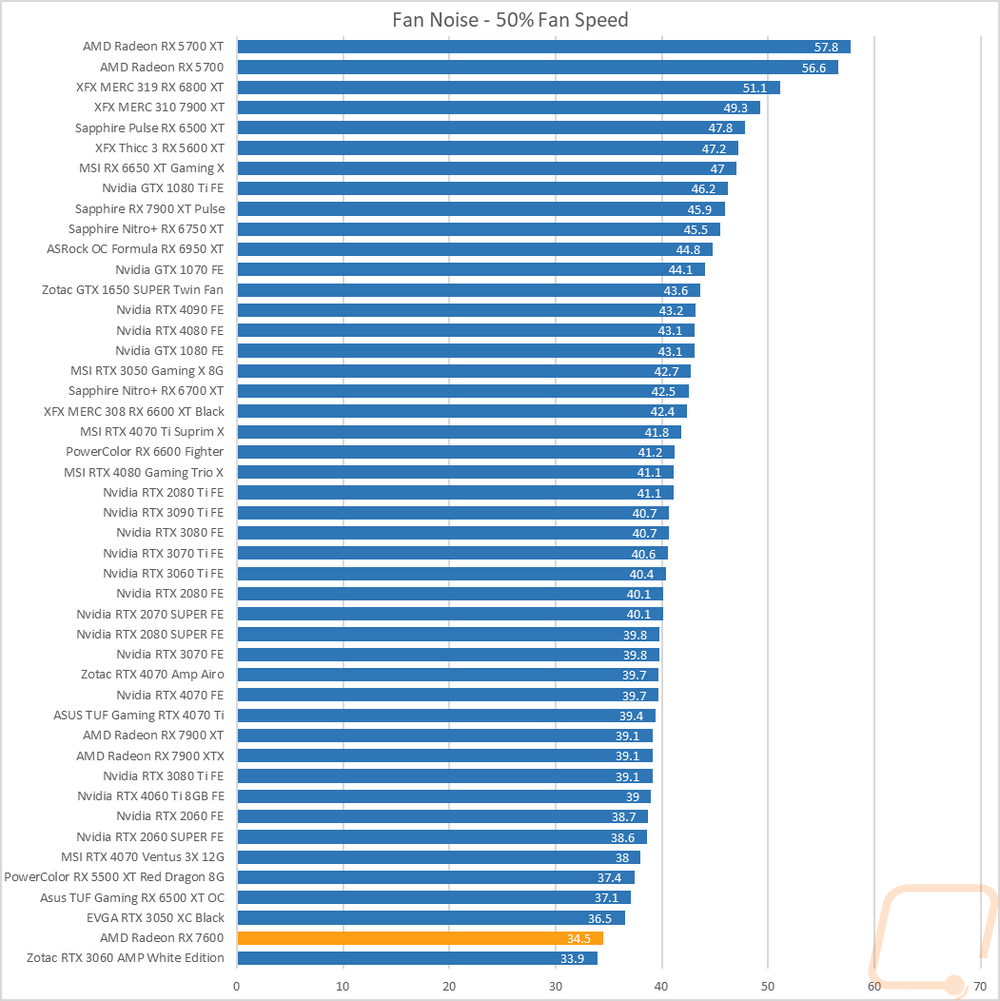
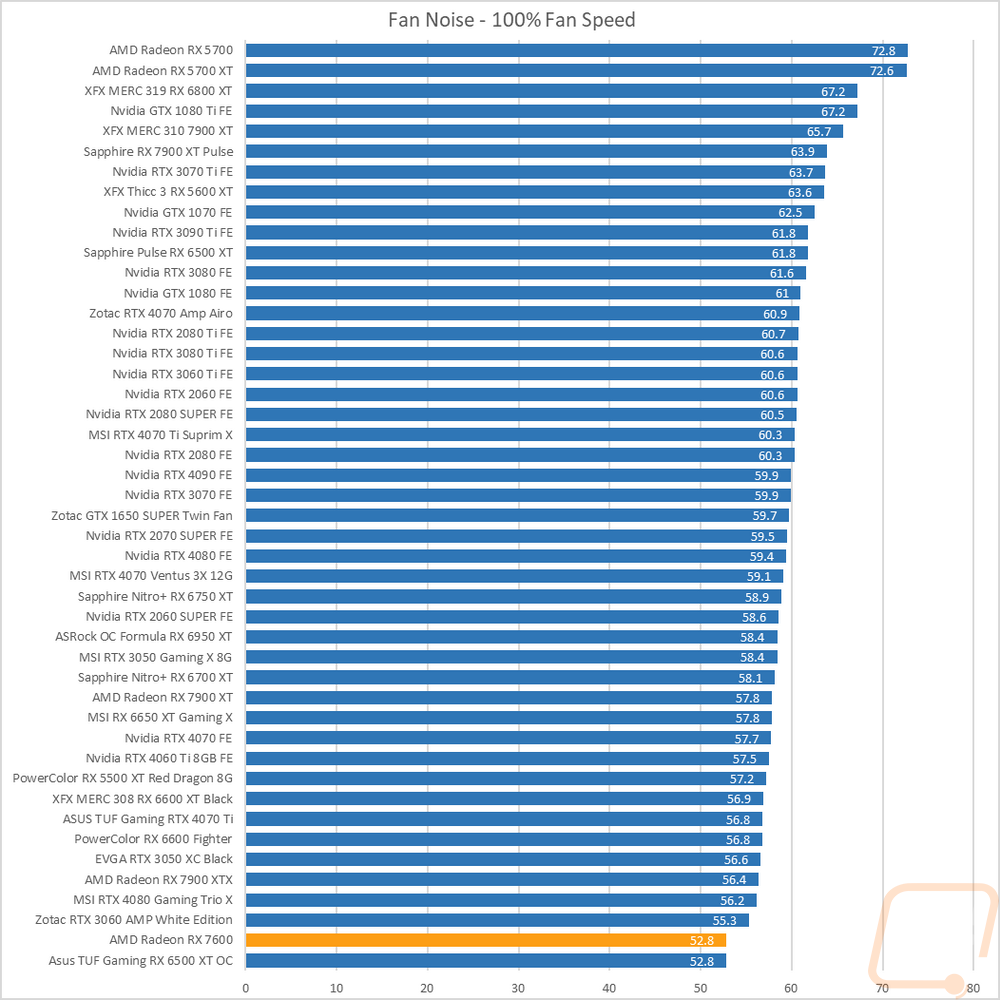
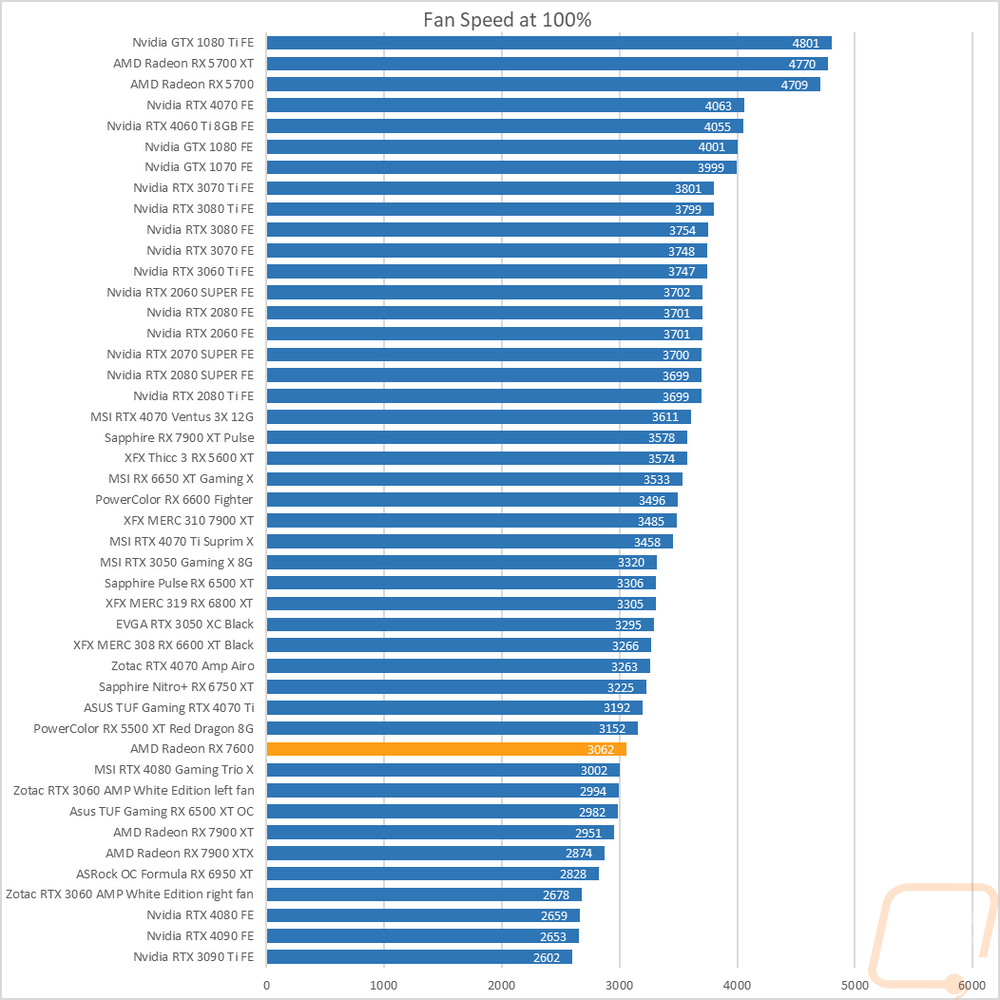
My next round of tests were looking at noise levels. These are especially important to me because I can’t stand to listen to my PC whirling. Especially when I’m not in game and other applications are using the GPU. For my testing, though I first tested with the fan cranked up to 100% to get an idea of how loud it can get, then again at 50% to get an idea of its range. The Radeon RX 7600 was right down at the bottom of the chart in both the 50% and 100% fan speed tests, the RPM chart gives a hint at what was going on with the dual fans running at 3062 RPM at 100% which is in the bottom 1/3 of the chart, but even so, AMD managed to have it running lower in the noise chart than in the RPM chart which is always impressive.
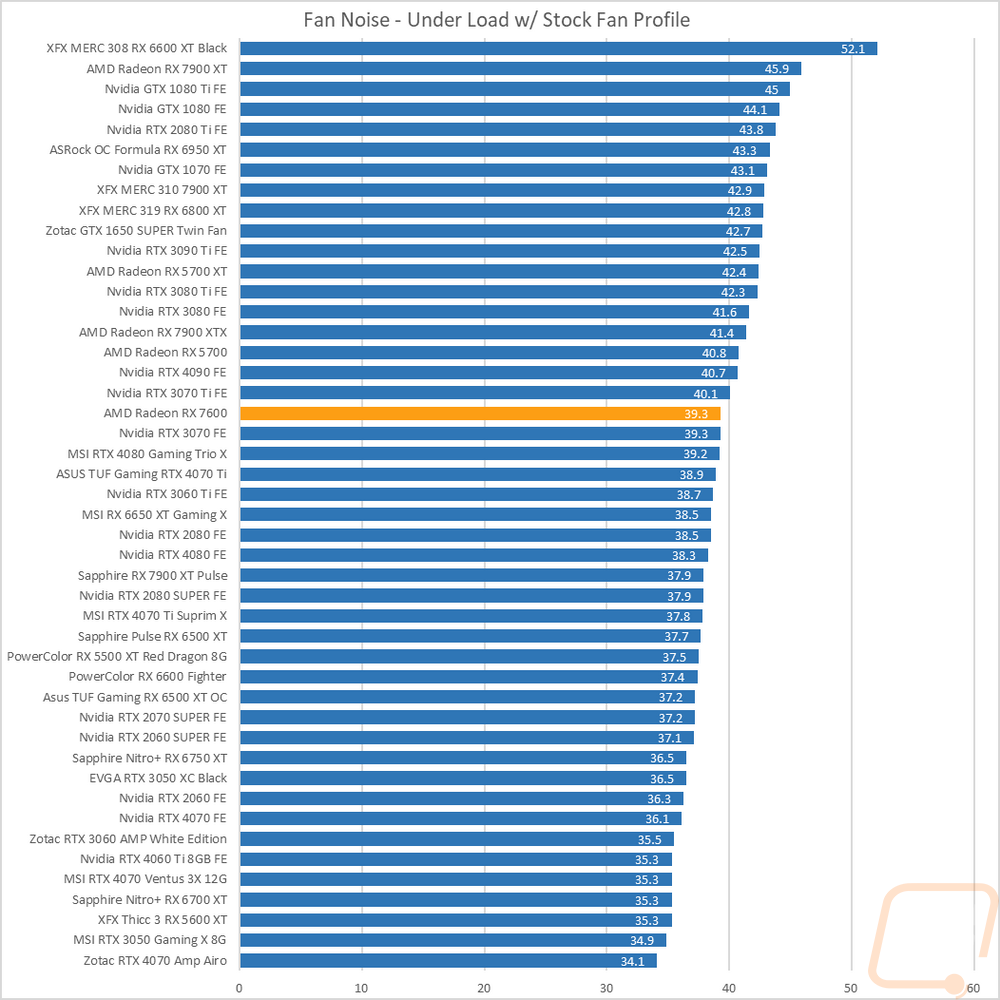
I also take a look at noise performance while under load. For that when running AIDA64’s stress test I wait until the temperature of the card has leveled off and then measure how loud things are when the card is at its worst-case scenario with the stock fan profile. Here the Radeon RX 7600 is right in the middle of the chart, a lot higher than it was on the 50% and 100% noise charts so this was a surprise. The chart showing just how high the stock fan profile was running helps explain the extra noise though, when under load the fans had to run at 64% of the max speed to keep things under control.
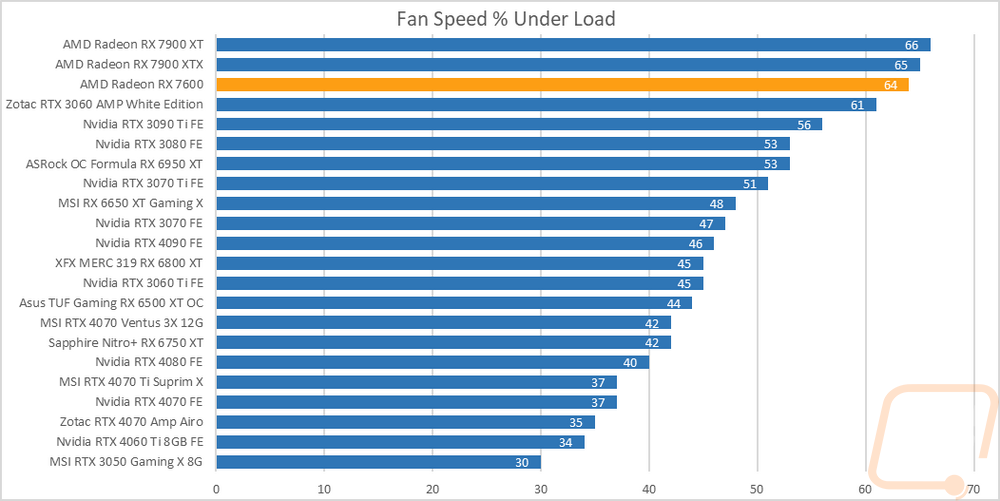
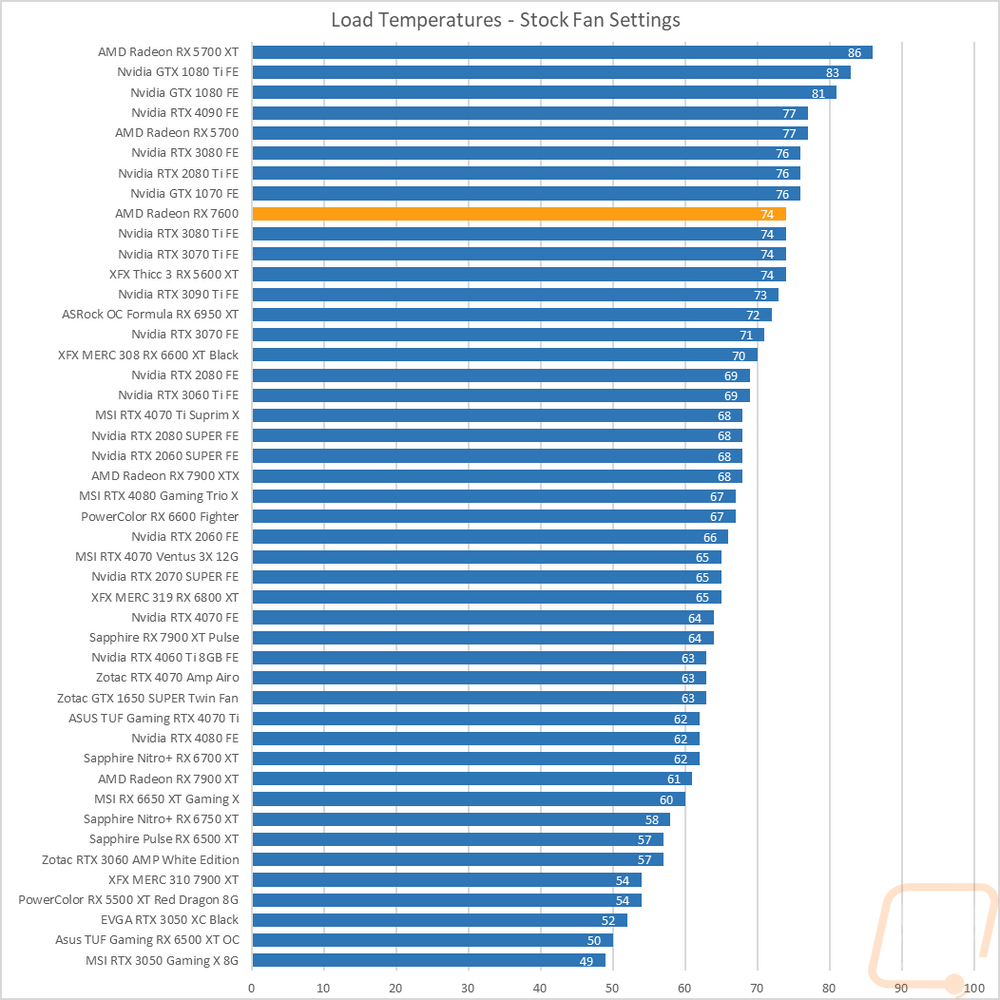
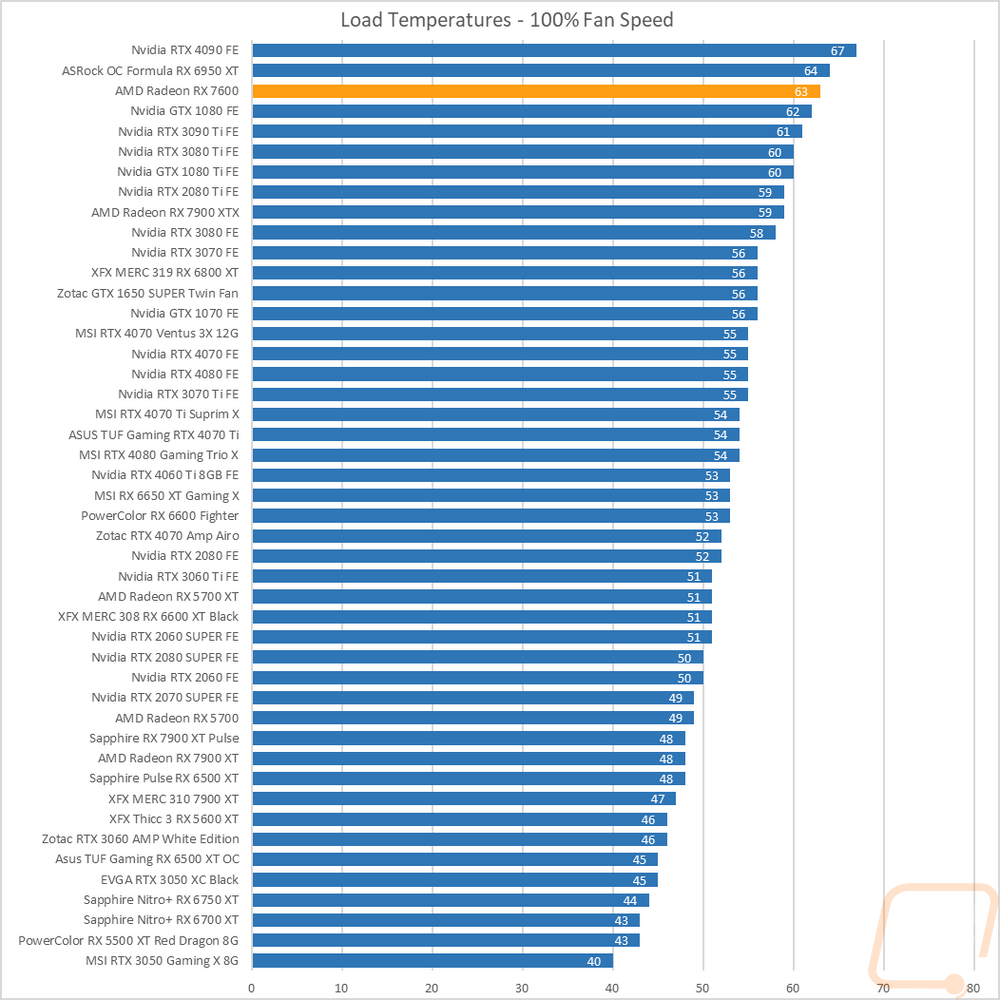
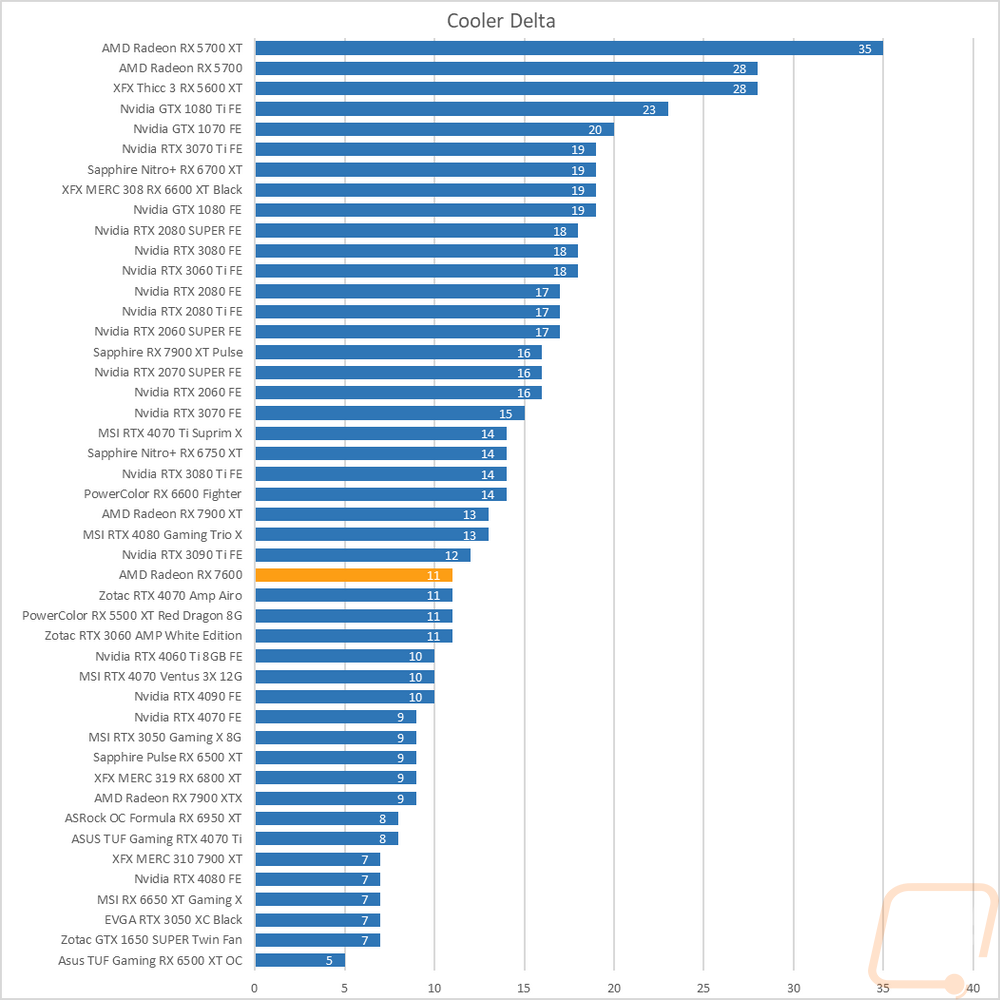
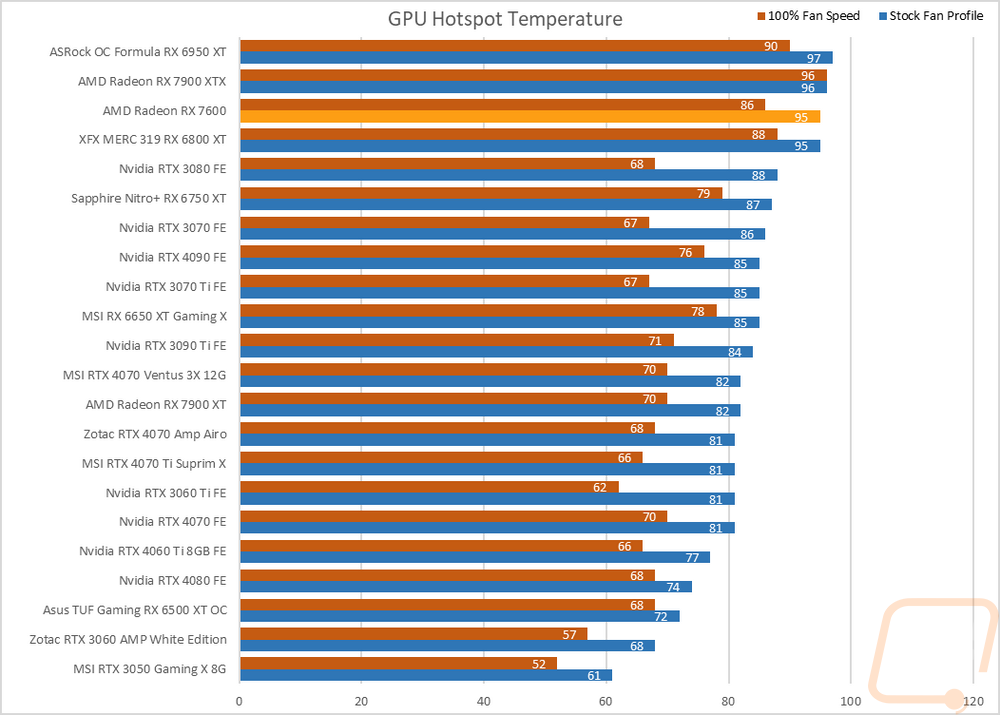
To finish up my testing I of course had to check out the cooling performance. To do this I ran two different tests. I used AIDA64’s Stress Test run for a half-hour each to warm things up. Then I documented what temperature the GPU leveled out at with the stock fan profile and then again with the fans cranked up to 100%. With the stock profile, the Radeon RX 7600 leveled off at 74c which is a lot hotter than I expected a relatively low-power card to be running. But the fans running at 64% with the stock fan profile did clue us in that it would be warm, this is up closer to what the blower cards have run in the past. Then with the fans cranked up, the temperatures dropped down to 63c but with the stock fan profile already using a majority of the fan speed the Radeon RX 7600 moved up in the chart here. The delta between the two was 11c which isn’t too bad. As for GPU hotspot temps with the stock fan profile, the GPU hotspot was, well hot at 95c, nearly as hot as our always hot 7900 XTX reference card. Cranking the fan speed up helped a lot, dropping it down to 86c. From the looks of it the fans could use a little extra max RPM and a slightly more aggressive fan profile combined could help and given the noise performance there is a little room there trade a little more noise for lower temperatures.
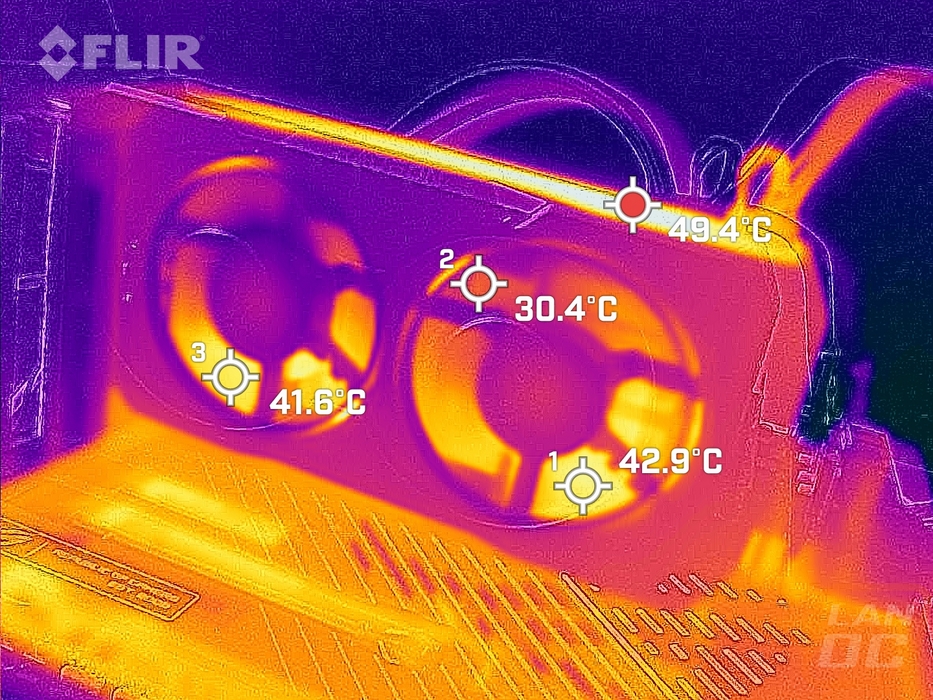
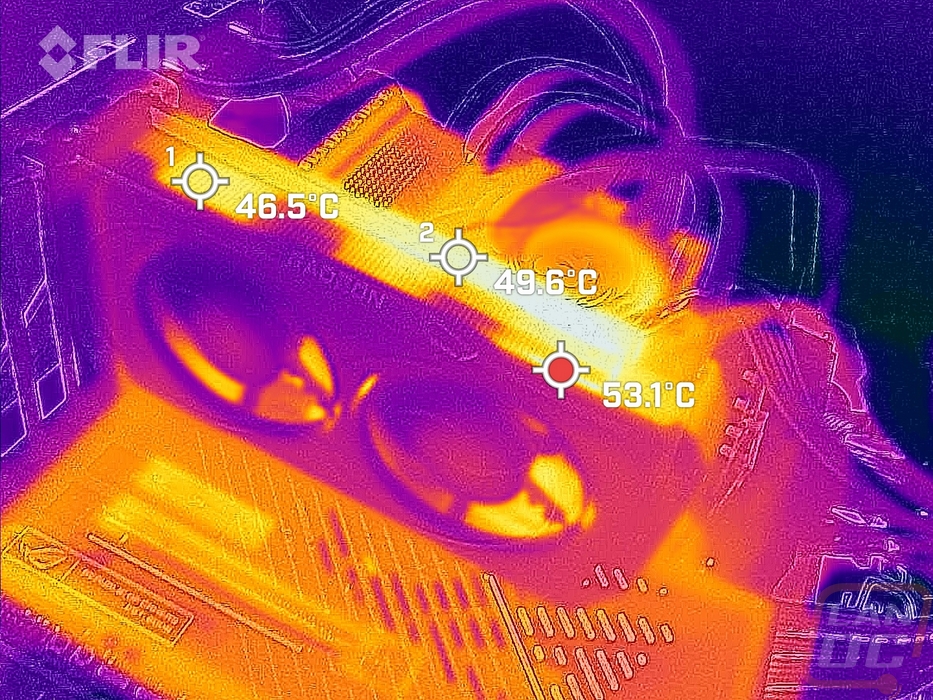
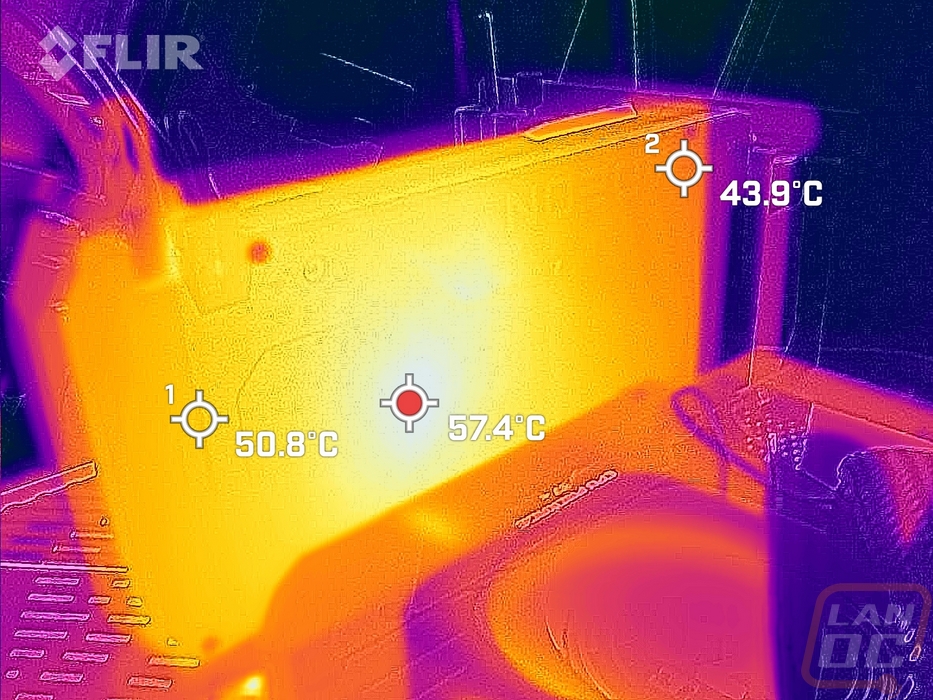
While running the stock fan profile testing I also took the time to get a few thermal images so we could see what is going on. The thermal images show that the card is running warmer than the last few cards I have had on the bench, but we saw that in the temperature numbers as well. The fan side of the card shows that the heatsink is getting the heat pulled out across the entire card which is good, the thick metal shroud isn’t absorbing too much heat on this side as well. Up on the top where a majority of the heated air is being pushed up and where we have exposed heatsink fins this is noticeably warmer, there is more heat on the right half of the card, especially at the PCB. Then on the backplate, the metal backplate is getting some good thermal transfer to help pull the heat away. The hottest area is just to the left of the center but even towards the end of the card is it up to 50c as well and almost 44c down at the PCI bracket end.
Overall and Final Verdict
When I took a look at the Radeon RX 7900 XT and 7900 XTX reference cards I was a big fan of the design that AMD put together and I like that the Radeon RX 7600 has continued with that same styling. The all-metal shroud gives it the quality construction feeling that Nvidia has also hit with their Founders Editions. AMD hasn’t gone completely off the trail with the design like Nvidia has, the Radeon RX 7600 has a relatively standard cooler design with both fans on one side and the card doesn’t extend past the end of the PCB at all to get the blow-thought design. The blacked-out look should look great in any build as well. I also like that the card has stayed with a compact design including the dual-slot thickness, not sticking up past the top of the PCI bracket, and not being too long. This is the size card that helps make extremely small SFF systems possible. It also has a standard 8-pin power connection which means you don’t need to worry about the upgrade to ATX 3.0 just yet.
The RX 7600 did well in our testing, especially at 1080p where it is designed to be used, and in the games it was surprisingly close in performance to the RTX 3060 Ti. We have to wait a while longer to find out where the RTX 4060 which will be the direct competition from Nvidia for this GPU, but so far it is looking good. It did fall behind in our compute tests, this isn’t an ideal card if you are hoping to use it for blender as well as gaming. It also falls a little behind when it comes to ray tracing, but AMD has made some good improvements in that area this generation.
The big downside for this specific card though is its overall cooling performance. With the stock fan profile, it struggled and ran at a surprisingly high RPM. This isn’t helped by the overall wattage that it pulls when we compare it to a card like the RTX 4060 Ti. The Radeon RX 7600 was up at the top of the efficiency chart compared to all of the last generation of cards but way behind compared to any of the current generation of cards including both of the RX 7900. It’s a shame too because in the base fan tests the Radeon RX 7600 was shockingly quiet, but it lost that advantage when it had to run at ¾ fan speed under load.
AMD has the MSRP of the Radeon RX 7600 set at $269 which is exciting. Both Nvidia and AMD cards from this generation have been expensive and Nvidia missed the mark with their RTX 4060 Ti so AMD has a big opportunity by pricing the Radeon RX 7600 at $269 to gain market share with a card designed for 64% of users setups at a price point that doesn’t make my wallet run away immediately in fear. The Radeon RX 7600 reference card may not be the best solution if heat is a concern, but the RX 7600 GPU as a whole is looking promising.

Live Pricing: HERE


