Performance
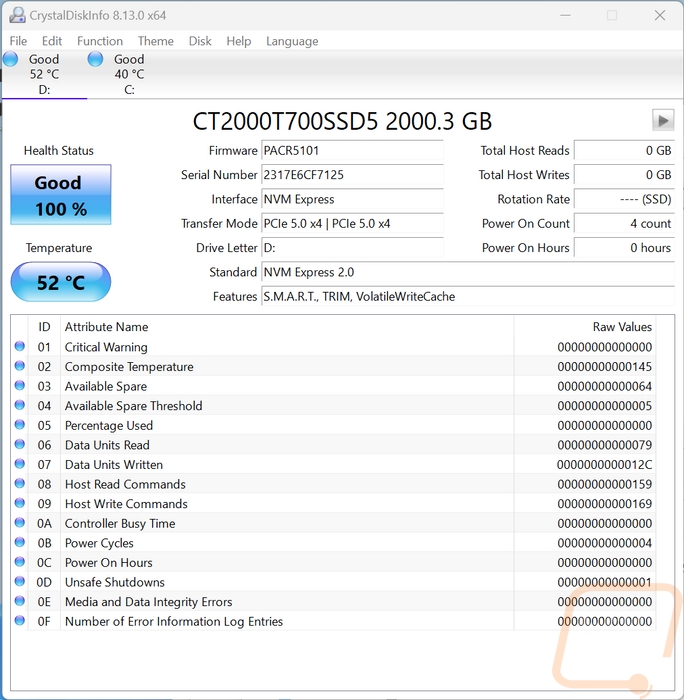
Before getting into testing the Crucial T700 PCIe Gen5 NVMe M.2 SSD 2TB I did check the drive out using CrystalDiskInfo just to confirm that it was connected using the correct interface. It was connected at PCIe 5.0 x4 so we are good there. I also like to do this to document the firmware revision we are running on for testing because those do change from time to time as well.
My first round of testing was to run the Crucial T700 through Crystal Disk Mark 8. Sequential testing is usually a best-case scenario and is what companies use for their specifications and on the front of the box to advertise drive speeds which in the case of the T700 the box and the specifications both touch up speeds of up to 12400 MB/s which is insane compared to any of the PCIe 4.0 drives that I have tested in the past. For the sequential tests, the T700 lived up to that mark almost perfectly with the read speed coming in at 12399.57, less than half of a MB/s less than listed. For the write speed, the specifications list it at up to 11800 MB/s and the T700 came in at 11692.96, a little lower but still not too far off. More importantly, both are almost double what any other drive has performed. Looking at some of the other results, however, the random 4K results aren’t any faster than PCIe 4.0 and even 3.0 drives have done. We have seen the same thing with the 4.0 drives as well which when it comes to raw bandwidth the faster interface helps but it isn’t the limitation in some other tests.
|
PCIe 3.0 |
PCIe 4.0 |
PCIe 5.0 |
||
|
Crystal Disk Mark 8 - Read |
SEQ1M Q8T1 |
SEQ128K Q32T1 |
RND4K Q32T16 |
RND4K Q1T1 |
|
WD Blue SN550 1TB |
2444.53 |
2077.36 |
1075.88 |
57.88 |
|
Sabrent Rocket Q4 2TB |
4939.59 |
2871.47 |
1034.52 |
74.53 |
|
Corsair MP400 1TB |
3432.77 |
1889.56 |
713.28 |
61.42 |
|
Corsair Force MP600 2TB |
4828 |
1543.31 |
901.83 |
41.49 |
|
Sabrent Rocket 4.0 Plus 1TB |
6468.33 |
2712.53 |
455.24 |
54.68 |
|
Crucial P5 Plus 1TB |
6697.19 |
4358.63 |
1113.7 |
69.76 |
|
Kingston FURY Renegade 2TB |
6592.75 |
3093.11 |
1085.23 |
55.14 |
|
Patriot P400 1TB |
5036.9 |
3518.47 |
1059.71 |
88.06 |
|
WD Blue SN570 1TB |
3569.34 |
2681.32 |
1046.46 |
65.75 |
|
WD Black SN770 1TB |
5223.32 |
4958.17 |
1034.35 |
82.24 |
|
MSI Spatium M480 Play 2TB |
6979.03 |
4267.59 |
1315.25 |
81.22 |
|
Viper Gaming VPR400 |
5163.46 |
3880.75 |
1030.81 |
85.35 |
|
Crucial P3 Plus 2TB |
5041.44 |
2799.96 |
1107.97 |
56.56 |
|
Crucial P3 2TB |
3511.18 |
2379.76 |
957.63 |
45.42 |
|
Fantom Drives Venom8 2TB |
6989.96 |
4216.08 |
1086.16 |
79.59 |
|
Lexar Professional NM800 Pro 2TB |
7155.05 |
3479.95 |
781.64 |
84.56 |
|
Crucial T700 2TB |
12399.57 |
9265.64 |
826.54 |
98.49 |
|
PCIe 3.0 |
PCIe 4.0 |
PCIe 5.0 |
||
|
Crystal Disk Mark 8 - Write |
SEQ1M Q8T1 |
SEQ128K Q32T1 |
RND4K Q32T16 |
RND4K Q1T1 |
|
WD Blue SN550 1TB |
2007.63 |
2006.4 |
776.4 |
290.25 |
|
Sabrent Rocket Q4 2TB |
3633.71 |
2568.7 |
920.84 |
385.73 |
|
Corsair MP400 1TB |
2021.09 |
2017.63 |
1196.42 |
262.36 |
|
Corsair Force MP600 2TB |
992.38 |
982.78 |
996.22 |
276.26 |
|
Sabrent Rocket 4.0 Plus 1TB |
5241.89 |
5225.25 |
921.51 |
402.26 |
|
Crucial P5 Plus 1TB |
5025.83 |
4880.38 |
884.12 |
240.78 |
|
Kingston FURY Renegade 2TB |
6899.76 |
5831.06 |
1083.12 |
367.6 |
|
Patriot P400 1TB |
4830.94 |
4813.27 |
846.34 |
307.12 |
|
WD Blue SN570 1TB |
3147.13 |
2893.72 |
909.47 |
234.17 |
|
WD Black SN770 1TB |
4983.07 |
4980.59 |
1149.36 |
295.13 |
|
MSI Spatium M480 Play 2TB |
6870.73 |
5863.14 |
1062.32 |
357.02 |
|
Viper Gaming VPR400 |
4780.82 |
4775.74 |
838 |
285.02 |
|
Crucial P3 Plus 2TB |
4388.26 |
4387.54 |
989.42 |
2967.35 |
|
Crucial P3 2TB |
3244.52 |
2712.72 |
630.77 |
261.09 |
|
Fantom Drives Venom8 2TB |
4132.6 |
5850.19 |
844.52 |
315.7 |
|
Lexar Professional NM800 Pro 2TB |
6629.2 |
5645.52 |
589.6 |
274.14 |
|
Crucial T700 2TB |
11692.96 |
9500.07 |
710.93 |
363.19 |
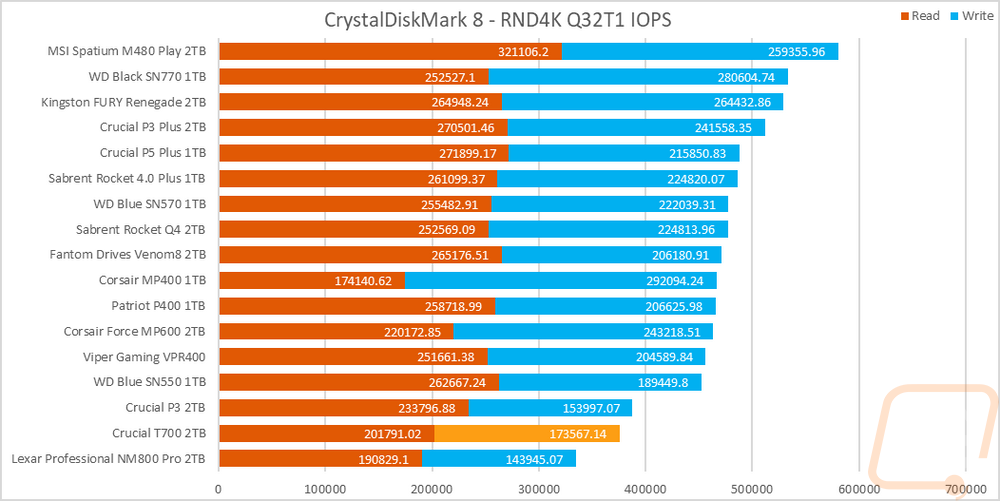
While testing in CrystalDiskMark 8 I did also check out the drive’s IOPS performance with the random 4k queue depth of 32 and 1 thread results. I stacked the read and write performance together here because I do believe that the overall drive performance is important, not just one result or the other. The Crucial T700 doesn’t look as hot with these IOPS scores which when put together have it down second from the bottom.
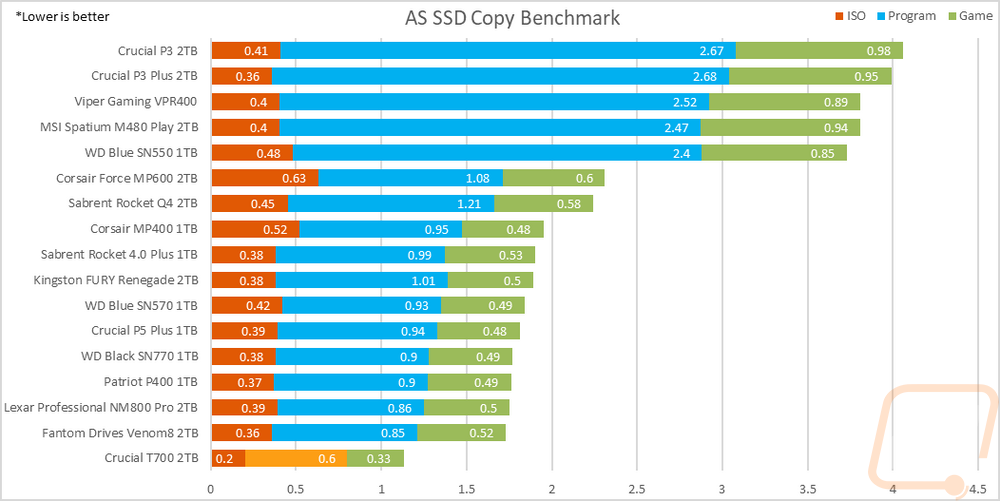
In AS SSD, I skipped over the standard test because it is very similar to the CrystalDiskMark tests I prefer to check out one of its sub-tests, the copy benchmark. This moves three files, one that is an ISO, one that is a program, and then a game, and times how long each takes. With these being timed, lower is better here. I have all three results stacked to see which drives are best overall. The Crucial T700 dominated in all three of the copy benchmarks with the lowest time on each of them by a big margin, nearly half the time for the ISO test for example. This put it in a class of its own.
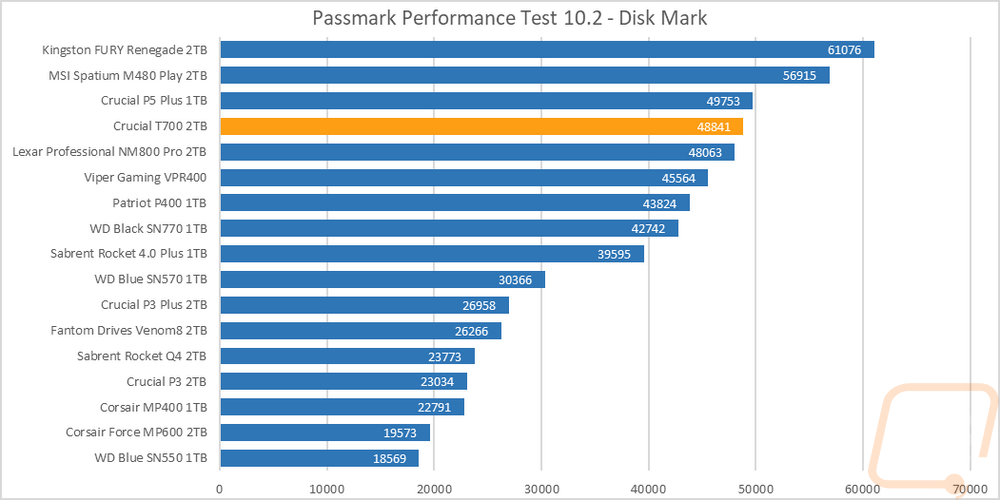
Next up with PassMark Performance Test 10, I ran their combined synthetic benchmark to get a look at their DiskMark rating. The Crucial T700 didn’t top the chart here but is still up in the top few with it sitting behind the older Crucial P5 Plus. The read and write sequential tests that Passmark uses helped the T700 but the IOPS tests counteracted that keeping the T700 from being at the top.
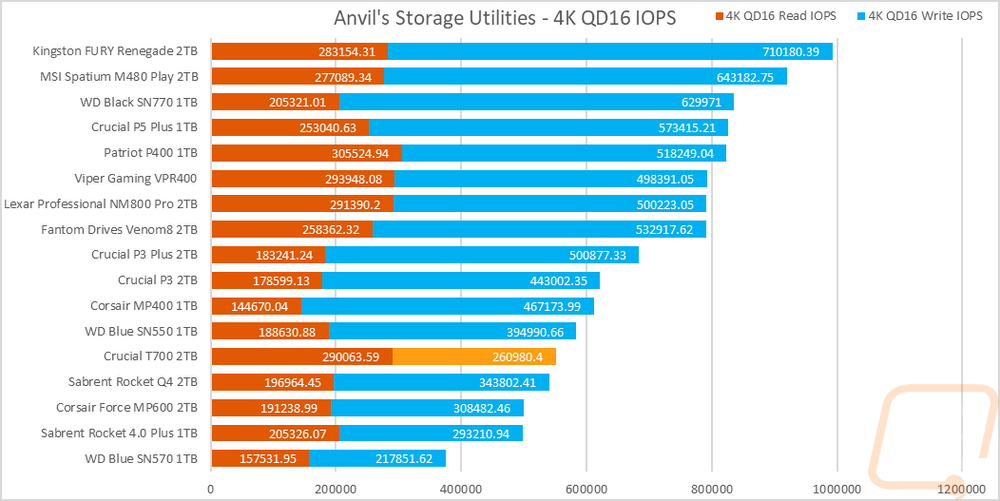
I then changed my focus back over to IOPS performance and ran the T700 in Anvil’s Storage Benchmark focusing on the 4k queue depth of 16 results from the main test. The read IOPS for the Crucial T700 were great with them sitting right in the middle with a few other fast rear IOPS results. But the write IOPS were the second lowest of all of the drives tested. When combined it put the T700 down in the bottom 1/3 of the chart and in with a few of the PCIe 3.0 drives.
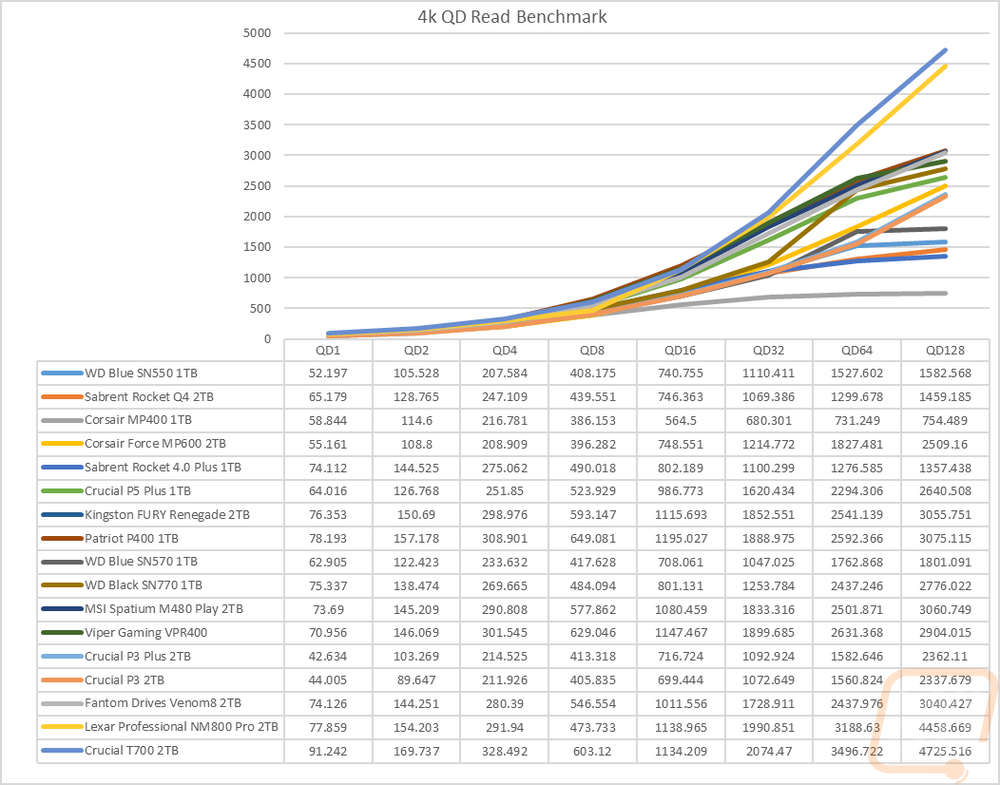
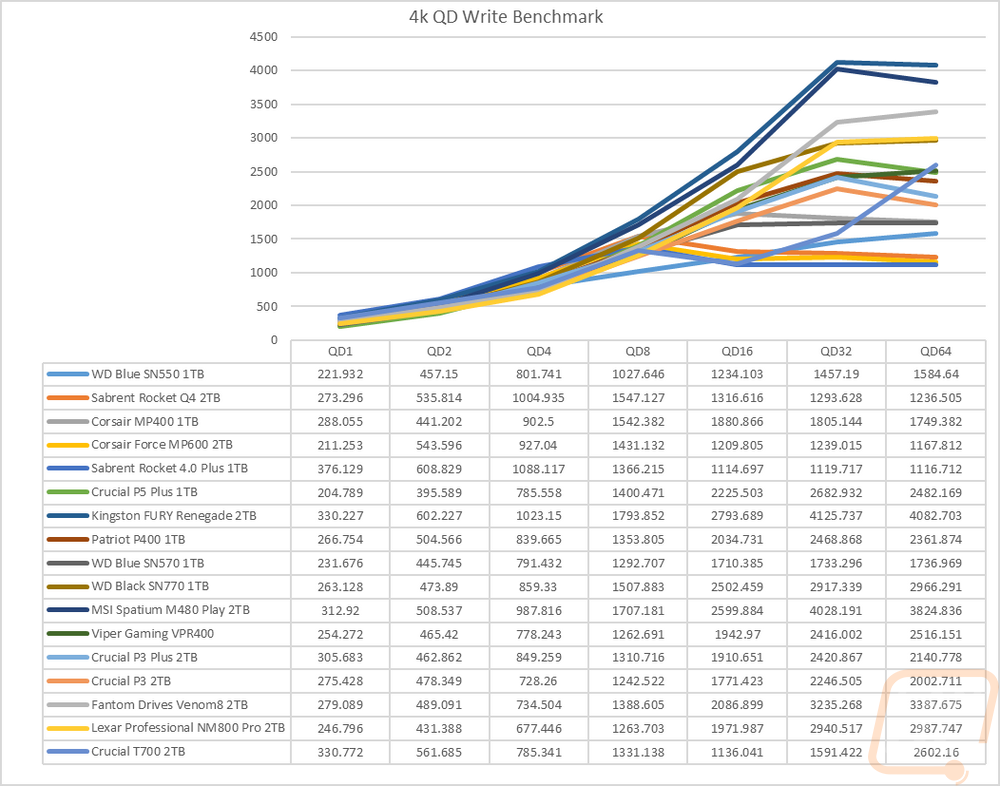
Sticking with Anvil’s Storage Utilities I did a few more tests. Here I wanted to check out how the drive would react to different queue depths so with the file size set to 4K I ran tests ramping up double each time starting at 1 and up to 128 for reads and 64 for writes. This lets us see if the controller gets overloaded. For the read queue depth tests the T700 starts off ahead of everything else tested with its 91 MB/s result in the single queue depth test. It stays ahead initially but by a queue depth of 8 a few drives pass it. It takes the lead again at a queue depth of 32 and along with the NM800, it stays at the top and way out ahead of the other drives in the high queue depth tests. For the write test, the T700 isn’t the fastest drive at a queue depth of 1 but it isn’t far behind first with just two drives being faster. The T700 drops into the middle of the pack as the queue depth goes up and at the 16 queue depth test, its performance drops even farther down. It does start to rise back up from there but only ends up in the middle of the pack in the end. In short, the read queue depth testing went well, not so much for the write queue depth results, however.
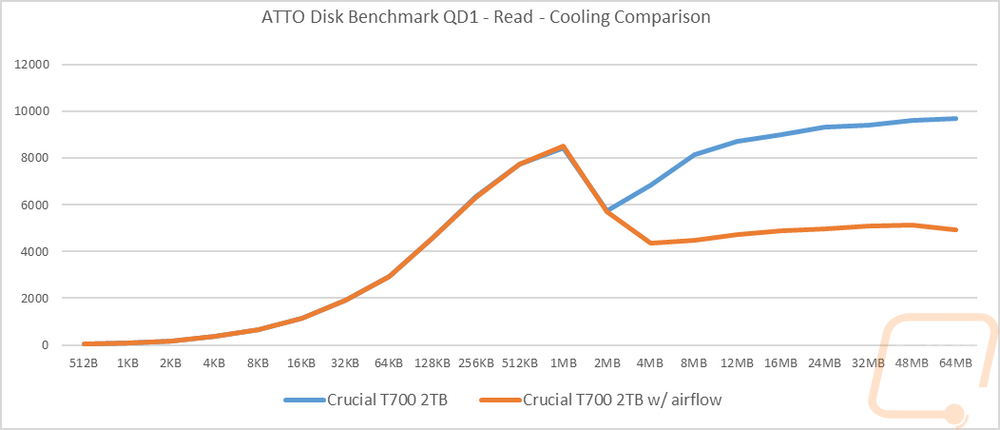
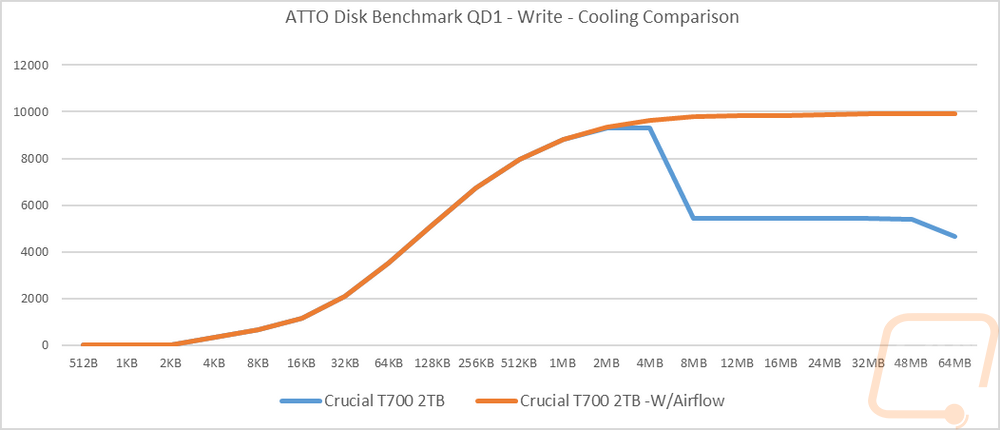
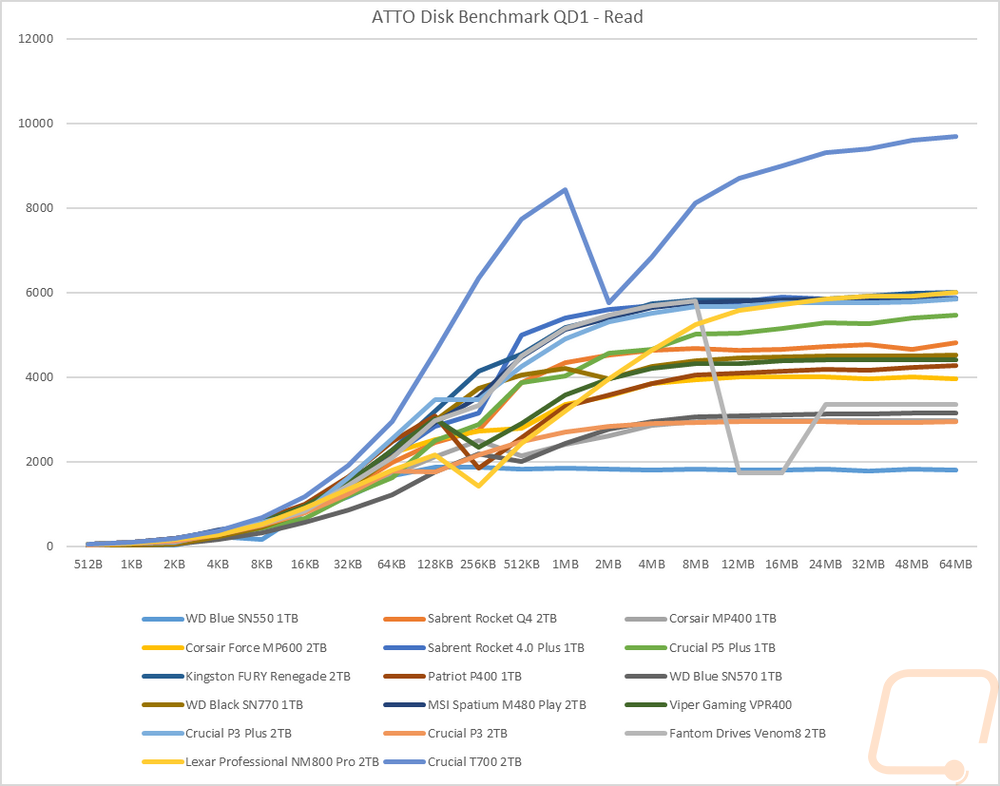
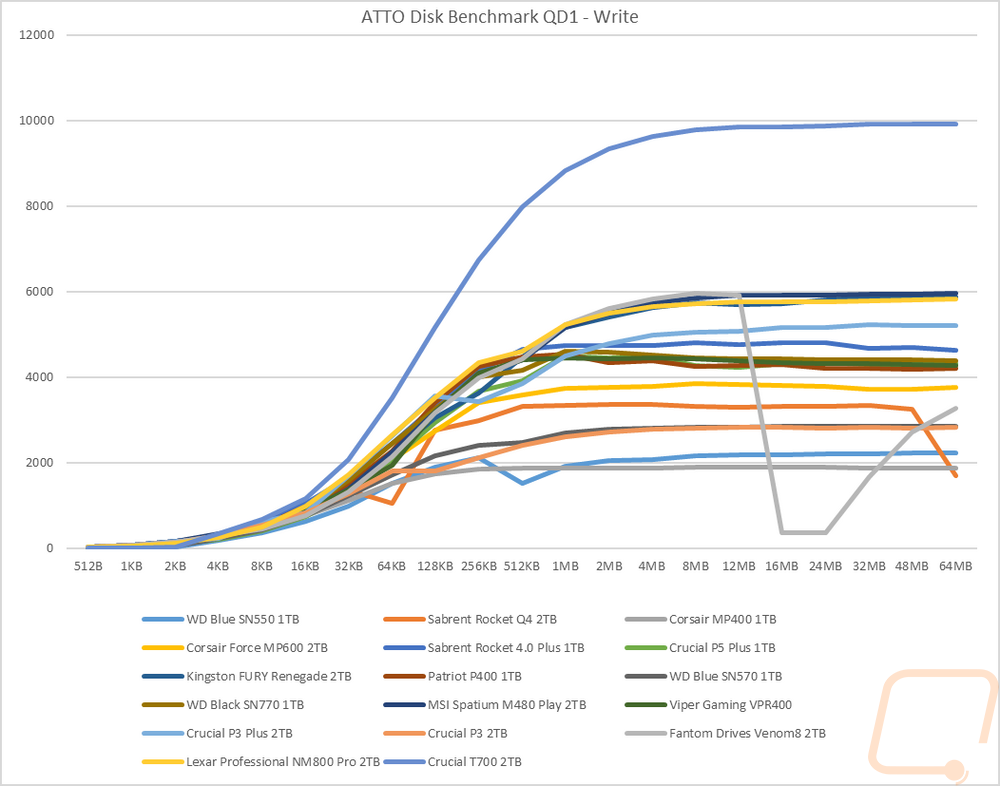
For ATTO Benchmark I set it to a queue depth of just 1 but ramped up the file size slowly to see how it would affect performance. For the read test in ATTO, the Crucial T700 jumps out ahead of the other drives and the gap widens up until the drive hiccups at the 1MB test, but it recovers and even at that hiccup it still stays out in front of the competition, but more impressive is the gap between it and the other drives with it reaching nearly 10000 MB/s at its peak. The write test on the other hand doesn’t have the hiccup and performs even better getting right below 10000 MB/s and staying there the whole time.
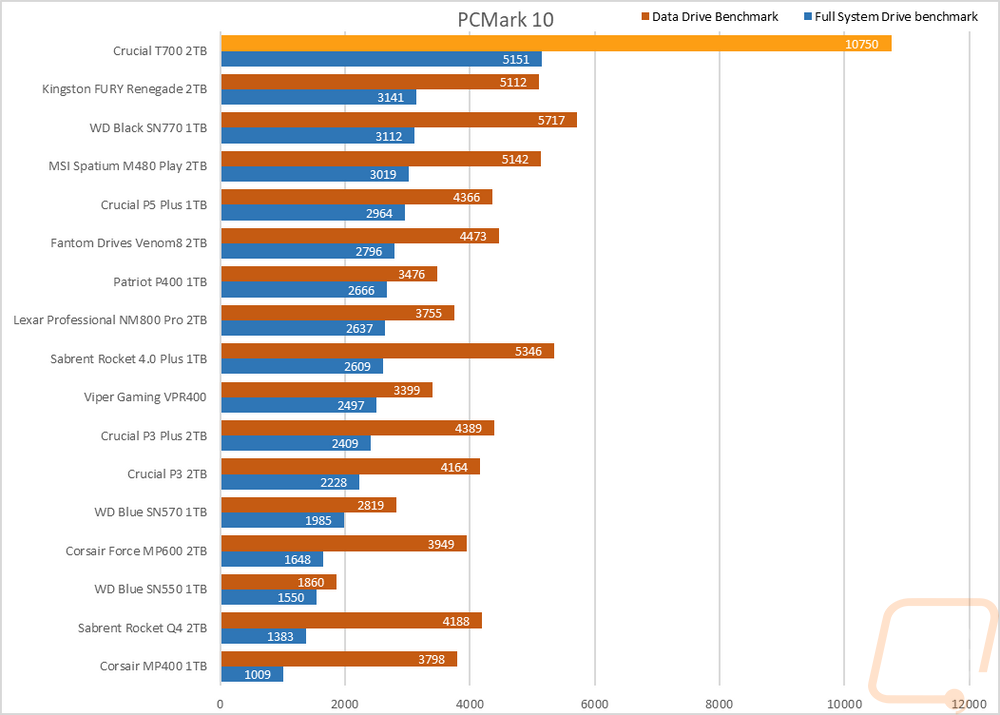
Next up I wanted to look at more real-world performance and for this, I started with PCMark 10 which has an overall full system benchmark for storage, and then one focused on data storage drives. In the full system drive benchmark, the Crucial T700 is way out in front of the other drives tested with its score of 5151 with the next closest drive, the Fury Renegade 2010 points behind at 3141. The data drive benchmark on the other hand has the T700 so far out in front of the rest of the drives that it messes up the scale of the graph being almost twice as high of a score as the other drives.
Next, up for more real-world resting, I did our file transfer tests. You don’t get any more real-world than this. For each drive, I copied the folder filled with files to the drive tested documenting what its transfer rate is near the end of the transfer. I used three file types, movies which are large single files, a folder filled with RAW and JPG photos, and then a folder filled with Word documents. Starting with the movie files the T700 was the second fastest drive tested, given the crazy bandwidth we saw in the sequential Crystaldiskmark benchmark I was expecting it to be faster here, it may be limited by the overall test setup in that specific case. With the photo file transfer coming in well ahead of the rest of the other drives, I’m inclined to think that the movie test was limited by outside factors. The last test using Word documents on the other hand, because of their small size, isn’t sequential and does expose the T700’s lower IOPS performance. At 4.57 MB/s this was still better than some of the drives tested, but the T700 wasn’t the fastest option for that file type. Overall for mid to larger files, the real-world file transfer speeds are going to be great but just know that if you are mostly going to be moving smaller files it might not be the best drive for you. Even from Crucial the Crucial P3 and P3 Plus were both faster in that situation.
|
Windows 11 File Transfers |
Movies |
Pictures |
Documents |
|
WD Blue SN550 1TB |
852 |
937 |
2.42 |
|
Sabrent Rocket Q4 2TB |
2720 |
1140 |
5.75 |
|
Corsair MP400 1TB |
2140 |
996 |
2.57 |
|
Corsair Force MP600 2TB |
1250 |
816 |
2.83 |
|
Sabrent Rocket 4.0 Plus 1TB |
2120 |
254 |
1.63 |
|
Crucial P5 Plus 1TB |
2060 |
1030 |
5.2 |
|
Kingston FURY Renegade 2TB |
2330 |
857 |
2.58 |
|
Patriot P400 1TB |
2070 |
981 |
2.86 |
|
WD Blue SN570 1TB |
602 |
992 |
5.14 |
|
WD Black SN770 1TB |
2260 |
605 |
2.52 |
|
MSI Spatium M480 Play 2TB |
1930 |
905 |
5.62 |
|
Viper Gaming VPR400 |
2360 |
1300 |
2.61 |
|
Crucial P3 Plus 2TB |
2240 |
1080 |
6.92 |
|
Crucial P3 2TB |
1990 |
1100 |
6.46 |
|
Fantom Drives Venom8 2TB |
1750 |
1190 |
4.45 |
|
Lexar Professional NM800 Pro 2TB |
2230 |
879 |
4.39 |
|
Crucial T700 2TB |
2540 |
1520 |
4.57 |
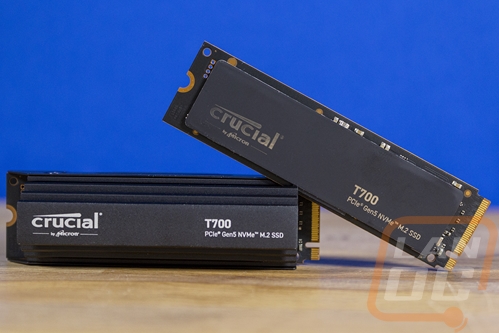
Normally with our thermal testing, I check out the temperatures when under load and have thermal images to see where the hotspots are. PCIe 4.0 drives have sometimes struggled without cooling which is why you see some with their own heatsinks. I wanted to see how the T700 with its new 5.0 interface would handle things so I went a little beyond the thermal images this time around. This was helped a lot by Crucial sending both their heatsink model and the base SSD as well. I put together a few different temperatures using both SSDs and when putting them under load I used AIDA64’s disk benchmark’s linear read test to heat things up. Our test bench typically uses airflow from the GPU and the AIO on the back but doesn’t have a fan blowing directly into the top M.2 area which is really tight once you have a video card installed. So some of our testing played around with having a fan or not having a fan. What I found was that at idle the heatsink model with zero airflow ran cool, but once under load a little airflow is still needed. But without the heatsink at all it was hot right from the start and ran even hotter without airflow. Getting a fan on the bare drive helped it run cooler, but using the motherboard's heatsink or the stock T700 heatsink was better. In short, though you are going to want to make sure you have a little airflow on ANY of these options.
|
|
Temperature |
|
T700 w/Heatsink, no fan, at idle |
36c |
|
T700 w/Heatsink, with fan, at idle |
34c |
|
T700 w/Heatsink, no fan, under load |
62c |
|
T700 w/Heatsink, with fan, under load |
35c |
|
T700 with motherboard heatsink and fan at idle |
35c |
|
T700 with motherboard heatsink and fan Under Load |
38c |
|
T700 with no heatsink but with fan at idle |
40c |
|
T700 with no heatsink but with fan under load |
43c |
|
T700 with no fan, no heatsink at Idle |
66c |
|
T700 with no fan, no heatsink under load |
70c |
The thermal images show the same thing, both the stock heatsink and the heatsink from our motherboard keep things cool with a little airflow their way. But you can see the heat down at the PCB. Most motherboards pack their PCIe 5.0 slot right up near the CPU to keep that distance short, but the downside is that it also means your GPU which creates a lot of heat is going to be right up against things and the GPU itself can blow airflow.
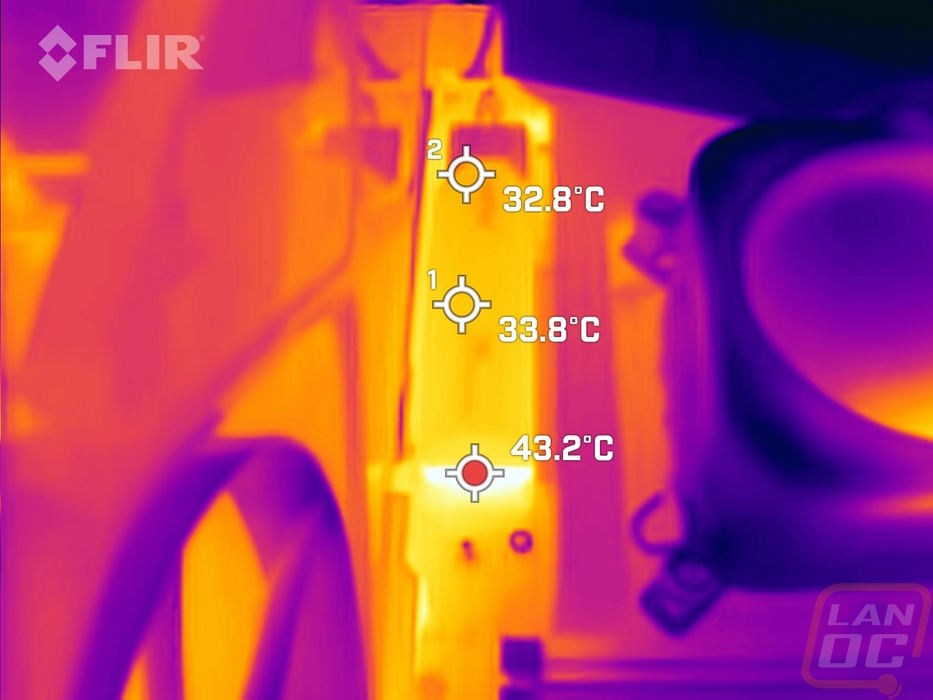
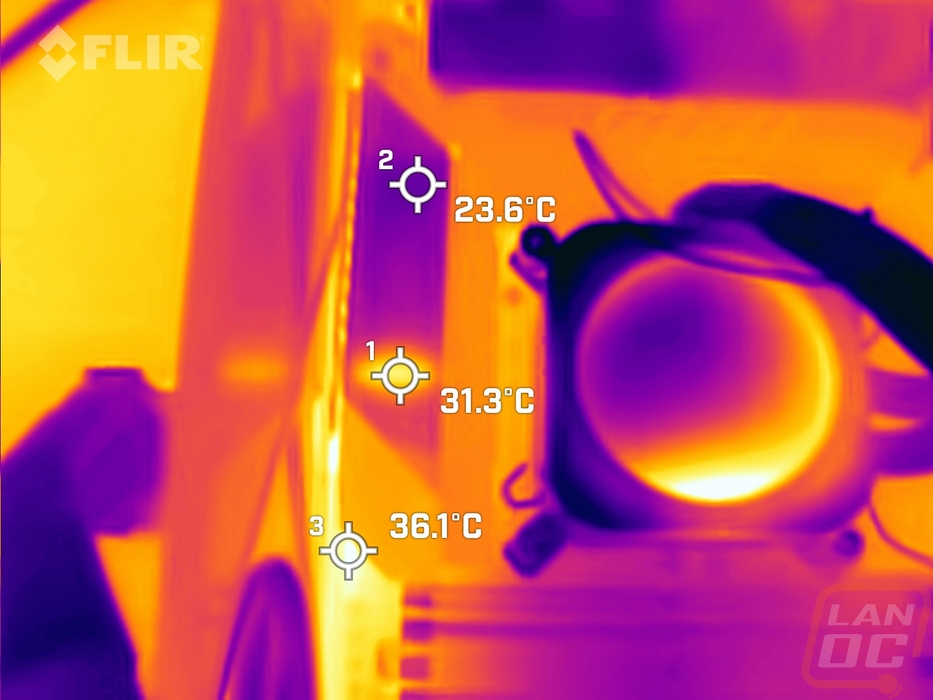
To see what kind of difference cooling can make on the T700 I did see some throttling in my testing with the ATTO benchmark. You can see the performance dropoff in both the ATTO read and write tests even with the heatsink when I didn’t have airflow around the SSD. Doing the same test with airflow the write test has no dropoff and the read does but it bounces right back.