Performance
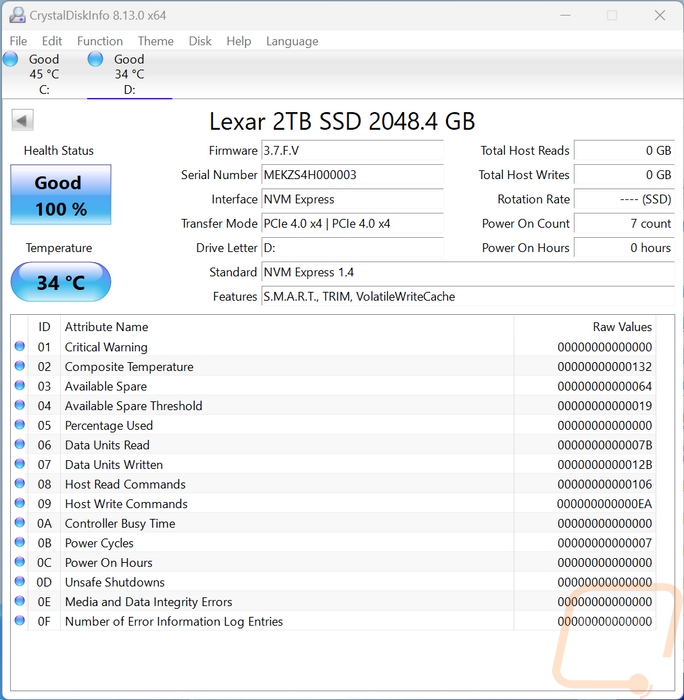
Before getting into testing the Lexar Professional NM800 Pro 2TB I did check the drive out using CrystalDiskInfo just to confirm that it was connected using the correct interface. It was connected at PCIe 4.0 x4 so we are good there. I also like to do this to document the firmware revision we are running on for testing because those do change from time to time as well.
My first round of testing was to run the Lexar Professional NM800 Pro 2TB through Crystal Disk Mark 8. Sequential testing is usually a best-case scenario and is what companies use for their specifications and on the front of the box to advertise drive speeds which in the case of the NM800 Pro the box doesn’t mention the write speed but does list up to 7500 MB/s for read speeds. The specifications for the NM800 Pro do have the write speeds which are listed as up to 6400 MB/s. Below I have the drives labeled in orange if they are PCIe 4.0 and blue for older 3.0 drives for reference. For the read speeds the NM800 Pro was the fastest of the drives tested at 7155 MB/s which is a little lower than the peak listed on the box. Then for the write speed, it outperformed the specifications at 6629 MB/s which was the third fastest of the drives tested.
|
PCIe 3.0 |
PCIe 4.0 |
|||
|
Crystal Disk Mark 8 - Read |
SEQ1M Q8T1 |
SEQ128K Q32T1 |
RND4K Q32T16 |
RND4K Q1T1 |
|
WD Blue SN550 1TB |
2444.53 |
2077.36 |
1075.88 |
57.88 |
|
Sabrent Rocket Q4 2TB |
4939.59 |
2871.47 |
1034.52 |
74.53 |
|
Corsair MP400 1TB |
3432.77 |
1889.56 |
713.28 |
61.42 |
|
Corsair Force MP600 2TB |
4828 |
1543.31 |
901.83 |
41.49 |
|
Sabrent Rocket 4.0 Plus 1TB |
6468.33 |
2712.53 |
455.24 |
54.68 |
|
Crucial P5 Plus 1TB |
6697.19 |
4358.63 |
1113.7 |
69.76 |
|
Kingston FURY Renegade 2TB |
6592.75 |
3093.11 |
1085.23 |
55.14 |
|
Patriot P400 1TB |
5036.9 |
3518.47 |
1059.71 |
88.06 |
|
WD Blue SN570 1TB |
3569.34 |
2681.32 |
1046.46 |
65.75 |
|
WD Black SN770 1TB |
5223.32 |
4958.17 |
1034.35 |
82.24 |
|
MSI Spatium M480 Play 2TB |
6979.03 |
4267.59 |
1315.25 |
81.22 |
|
Viper Gaming VPR400 |
5163.46 |
3880.75 |
1030.81 |
85.35 |
|
Crucial P3 Plus 2TB |
5041.44 |
2799.96 |
1107.97 |
56.56 |
|
Crucial P3 2TB |
3511.18 |
2379.76 |
957.63 |
45.42 |
|
Fantom Drives Venom8 2TB |
6989.96 |
4216.08 |
1086.16 |
79.59 |
|
Lexar Professional NM800 Pro 2TB |
7155.05 |
3479.95 |
781.64 |
84.56 |
|
PCIe 3.0 |
PCIe 4.0 |
|||
|
Crystal Disk Mark 8 - Write |
SEQ1M Q8T1 |
SEQ128K Q32T1 |
RND4K Q32T16 |
RND4K Q1T1 |
|
WD Blue SN550 1TB |
2007.63 |
2006.4 |
776.4 |
290.25 |
|
Sabrent Rocket Q4 2TB |
3633.71 |
2568.7 |
920.84 |
385.73 |
|
Corsair MP400 1TB |
2021.09 |
2017.63 |
1196.42 |
262.36 |
|
Corsair Force MP600 2TB |
992.38 |
982.78 |
996.22 |
276.26 |
|
Sabrent Rocket 4.0 Plus 1TB |
5241.89 |
5225.25 |
921.51 |
402.26 |
|
Crucial P5 Plus 1TB |
5025.83 |
4880.38 |
884.12 |
240.78 |
|
Kingston FURY Renegade 2TB |
6899.76 |
5831.06 |
1083.12 |
367.6 |
|
Patriot P400 1TB |
4830.94 |
4813.27 |
846.34 |
307.12 |
|
WD Blue SN570 1TB |
3147.13 |
2893.72 |
909.47 |
234.17 |
|
WD Black SN770 1TB |
4983.07 |
4980.59 |
1149.36 |
295.13 |
|
MSI Spatium M480 Play 2TB |
6870.73 |
5863.14 |
1062.32 |
357.02 |
|
Viper Gaming VPR400 |
4780.82 |
4775.74 |
838 |
285.02 |
|
Crucial P3 Plus 2TB |
4388.26 |
4387.54 |
989.42 |
2967.35 |
|
Crucial P3 2TB |
3244.52 |
2712.72 |
630.77 |
261.09 |
|
Fantom Drives Venom8 2TB |
4132.6 |
5850.19 |
844.52 |
315.7 |
|
Lexar Professional NM800 Pro 2TB |
6629.2 |
5645.52 |
589.6 |
274.14 |
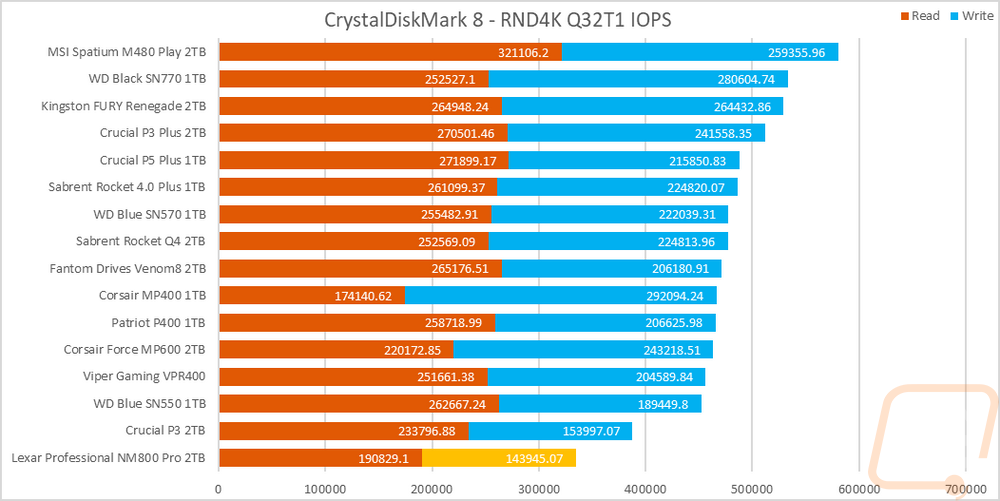
While testing in CrystalDiskMark 8 I did also check out the drive’s IOPS performance with the random 4k queue depth of 32 and 1 thread results. I stacked the read and write performance together here because I do believe that the overall drive performance is important, not just one result or the other. The NM800 Pro didn’t do so hot with both read and write speeds in the IOPS being low and putting it at the bottom of the chart.
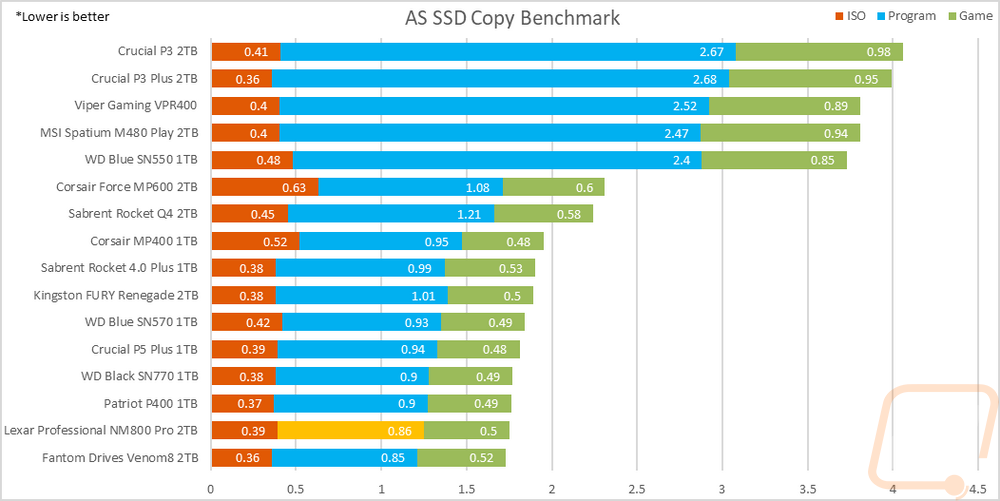
In AS SSD, I skipped over the standard test because it is very similar to the CrystalDiskMark tests I prefer to check out one of its sub-tests, the copy benchmark. This moves three files, one that is an ISO, one that is a program, and then a game, and times how long each takes. With these being timed, lower is better here. I have all three results stacked to see which drives are best overall. The NM800 Pro didn’t outperform the Venom8 but was right behind it in second place here and was faster with the game files.
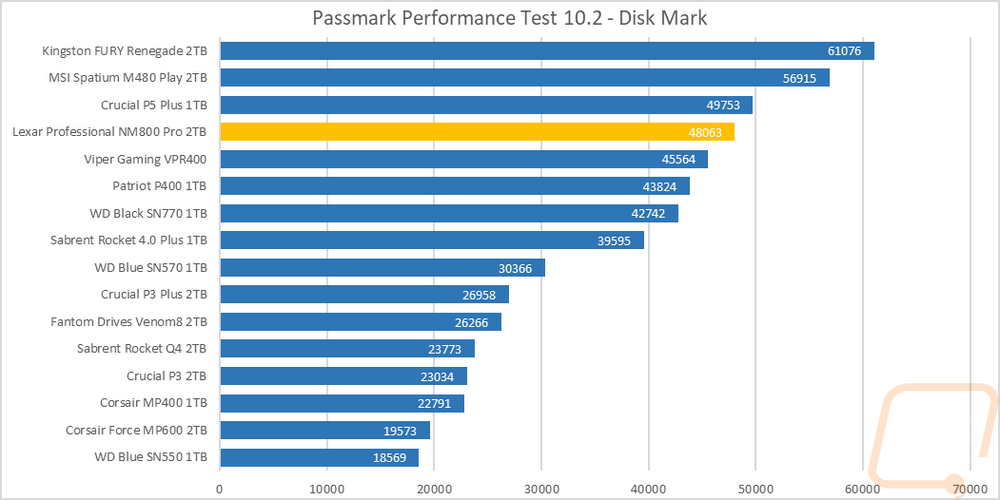
Next up with PassMark Performance Test 10, I ran their combined synthetic benchmark to get a look at their DiskMark rating. The NM800 Pro scored a 48063 which wasn’t enough to top the chart but put it right up near the top with a few of the other top-performing Gen 4 x4 drives like the Fury Renegade.
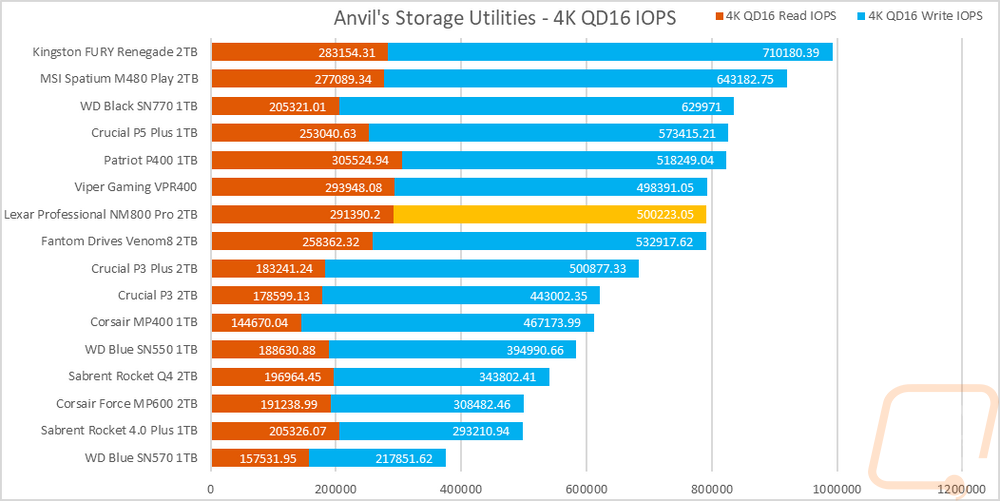
I then changed my focus back over to IOPS performance and ran the NM800 in Anvil’s Storage Benchmark focusing on the 4k queue depth of 16 results from the main test. The read IOPS for the NM800 Pro wasn’t bad at 291390 which was the third-fastest result. Then for the write IOPS, it scored 500,223 which is middle of the pack but still significantly better than some of the drives. When combined the NM800 Pro ended up right in the middle of the pack and running right with the Venom8.
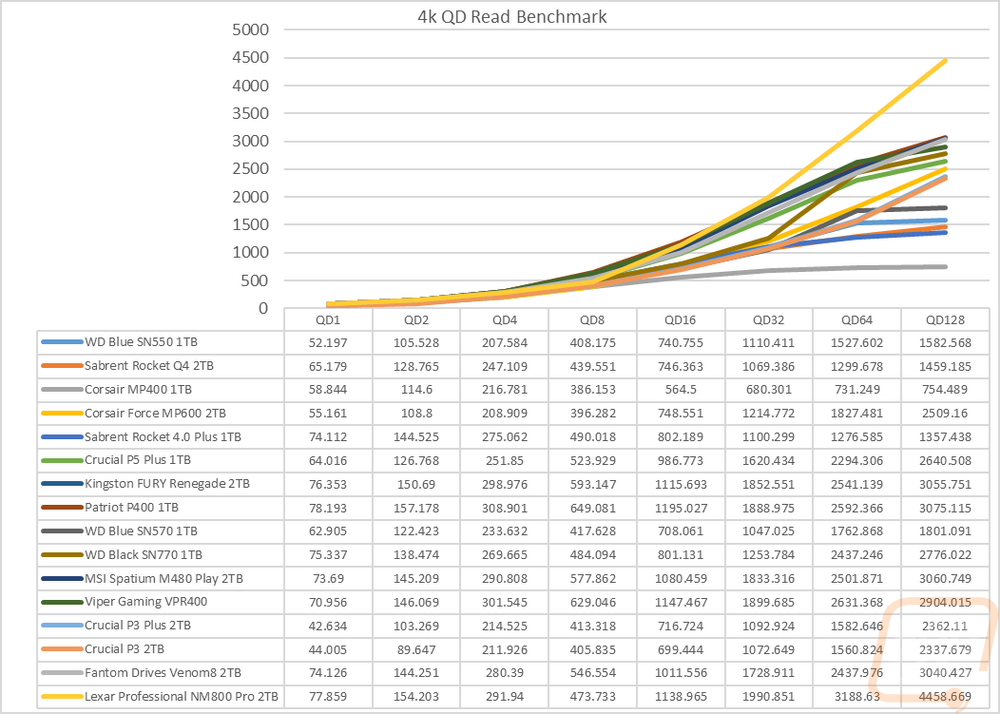
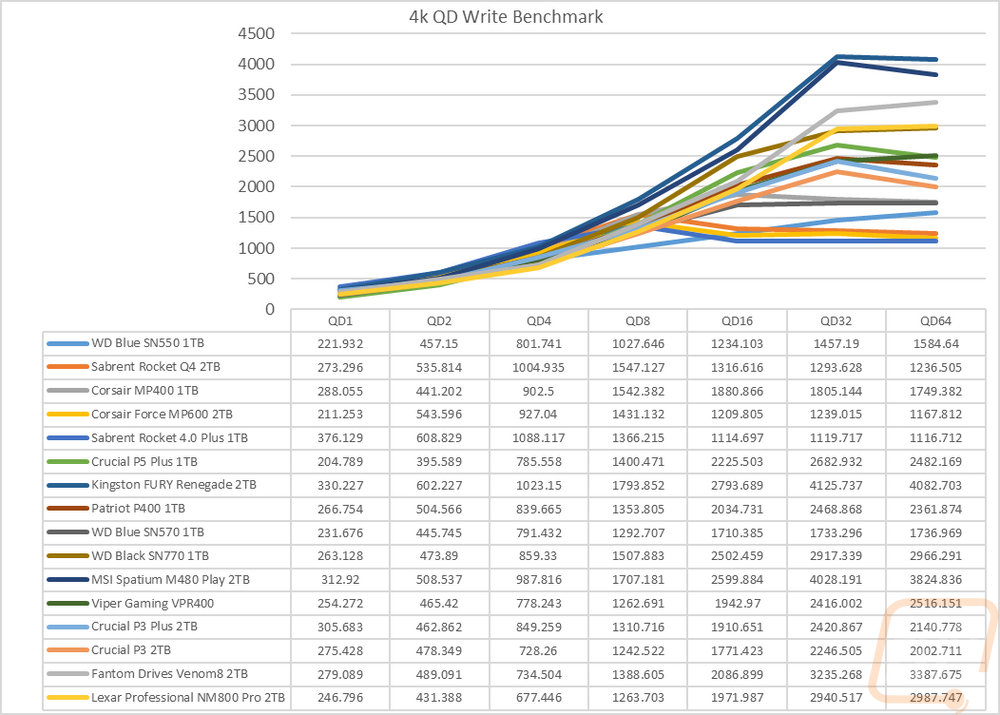
Sticking with Anvil’s Storage Utilities I did a few more tests. Here I wanted to check out how the drive would react to different queue depths so with the file size set to 4K I ran tests ramping up double each time starting at 1 and up to 128 for reads and 64 for writes. This lets us see if the controller gets overloaded. For the read queue depth tests the NM800 Pro started second fastest and did well but ended up in the middle of the pact by a queue depth of 8. After that, however, it took off and was up on its own for the last three tests with none of the other drives even close. For the write queue depth test the NM800 Pro started closer to the bottom of the pack and stayed there until a queue depth of 16 where it accelerated up at the top of the middle of the pack. Three other drives were faster for the last two tests and the Renegade and the M480 Play were over 1000 MB/s faster.
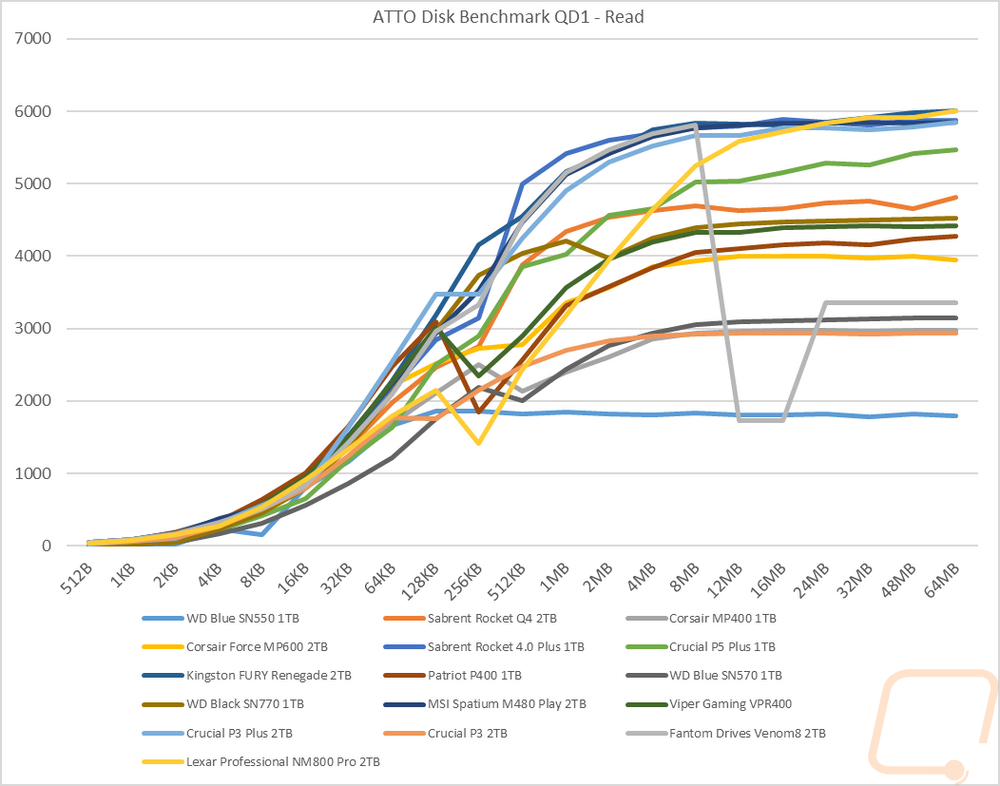
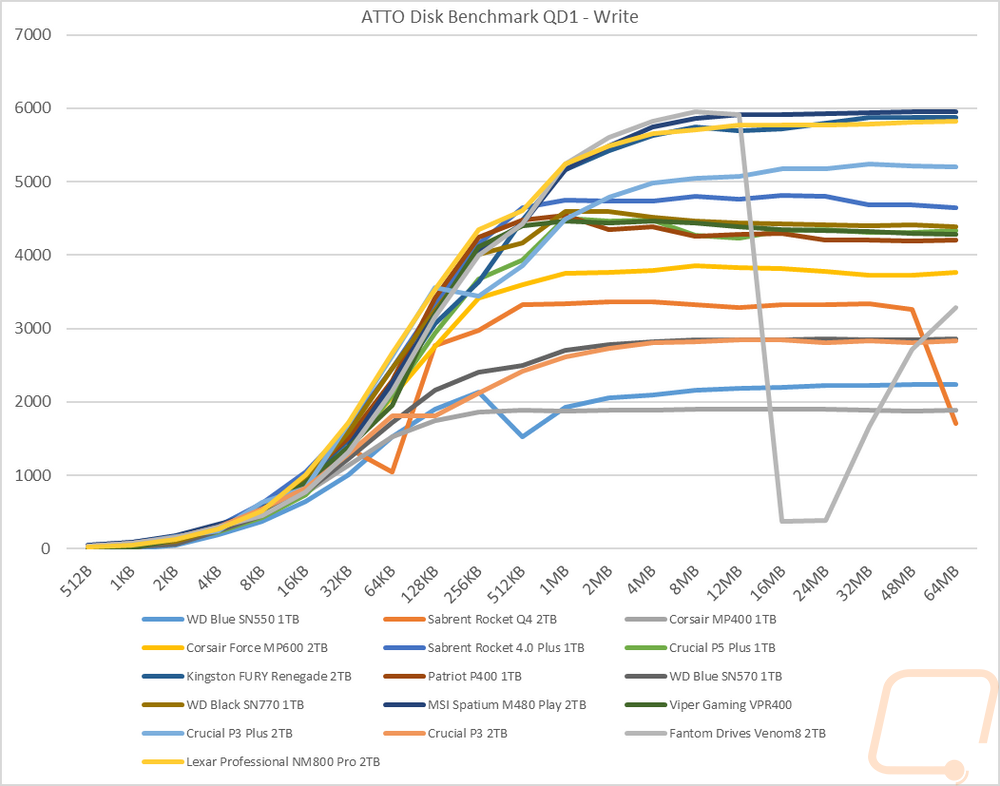
For ATTO Benchmark I set it to a queue depth of just 1 but ramped up the file size slowly to see how it would affect performance. For the read test in ATTO, the NM800 Pro had a trajectory to be in the middle of the pack up until the 256 KB test where its performance dropped around 500 MB/s then it recovered and continued on its way. From 2 MB and on though the NM800 Pro did better than the start of the test indicated and even was the fastest drive in the 24MB range and ties with the Renegade at 6000 MB/s even at the top of the chart. The write speed ATTO test didn’t have the hiccup it had with the read test but did accelerate slower at the 256 KB test. From there it ran with the top few drives but was slightly slower putting it in third for the last 6 results.
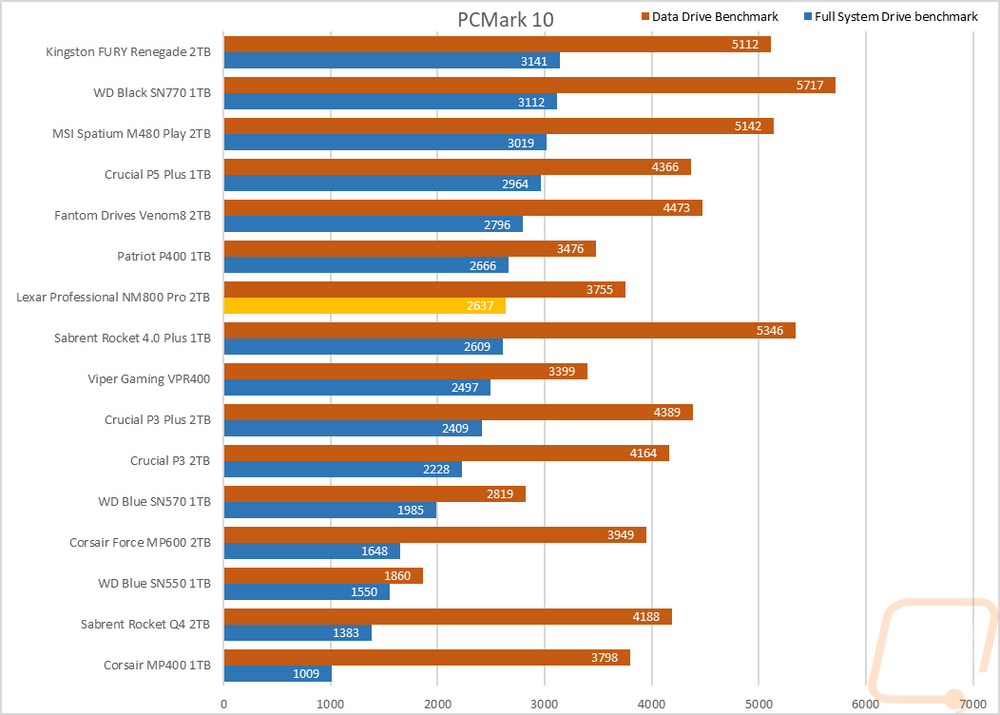
Next up I wanted to look at more real-world performance and for this, I started with PCMark 10 which has an overall full system benchmark for storage and then one focused on data storage drives. In the full system drive benchmark, the NM800 Pro scored 2637 which put it in the middle of the pack and behind most of the other Gen 4 drives. Its score in the data drive benchmark was 3755 and that would put it in the bottom half as well.
Next, up for more real-world resting, I did our file transfer tests. You don’t get any more real-world than this. For each drive, I copied the folder filled with files to the drive tested documenting what its transfer rate is near the end of the transfer. I used three file types, movies which are large single files, a folder filled with RAW and JPG photos, and then a folder filled with word documents. Starting with the movie files the NM800 Pro was up in the top of the chart at 2230 MB/s. The Photo transfer test wasn’t as good, with the cache it was quick as first but slowed down later in the test for the 879 MB/s result. Then for the last test, the document test is always extremely demanding with the small file sizes and the NM800 Pro didn’t top the chart here but performed well with its 4.39 MB/s putting it in the middle of the pack.
|
Windows 11 File Transfers |
Movies |
Pictures |
Documents |
|
WD Blue SN550 1TB |
852 |
937 |
2.42 |
|
Sabrent Rocket Q4 2TB |
2720 |
1140 |
5.75 |
|
Corsair MP400 1TB |
2140 |
996 |
2.57 |
|
Corsair Force MP600 2TB |
1250 |
816 |
2.83 |
|
Sabrent Rocket 4.0 Plus 1TB |
2120 |
254 |
1.63 |
|
Crucial P5 Plus 1TB |
2060 |
1030 |
5.2 |
|
Kingston FURY Renegade 2TB |
2330 |
857 |
2.58 |
|
Patriot P400 1TB |
2070 |
981 |
2.86 |
|
WD Blue SN570 1TB |
602 |
992 |
5.14 |
|
WD Black SN770 1TB |
2260 |
605 |
2.52 |
|
MSI Spatium M480 Play 2TB |
1930 |
905 |
5.62 |
|
Viper Gaming VPR400 |
2360 |
1300 |
2.61 |
|
Crucial P3 Plus 2TB |
2240 |
1080 |
6.92 |
|
Crucial P3 2TB |
1990 |
1100 |
6.46 |
|
Fantom Drives Venom8 2TB |
1750 |
1190 |
4.45 |
|
Lexar Professional NM800 Pro 2TB |
2230 |
879 |
4.39 |
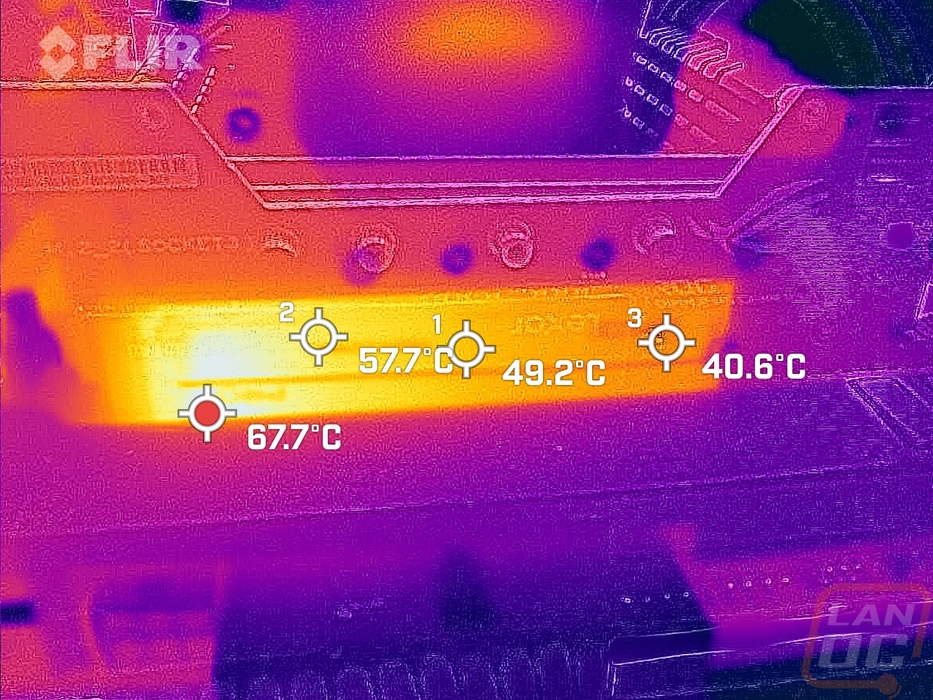
After running the Lexar Professional NM800 Pro 2TB with a linear read workload for almost a half hour I put it in front of our thermal camera to see how the temperatures were looking. You can see that the controller is the source of most of the heat and that is down on the end near the M.2 drive. This also means the heat is far away from the NAND on the other end as well. The thermal transfer tape was working well on the sticker though and the controller was toasty at 67.7c but as you get farther away it drops almost 10c on each reading.