Performance
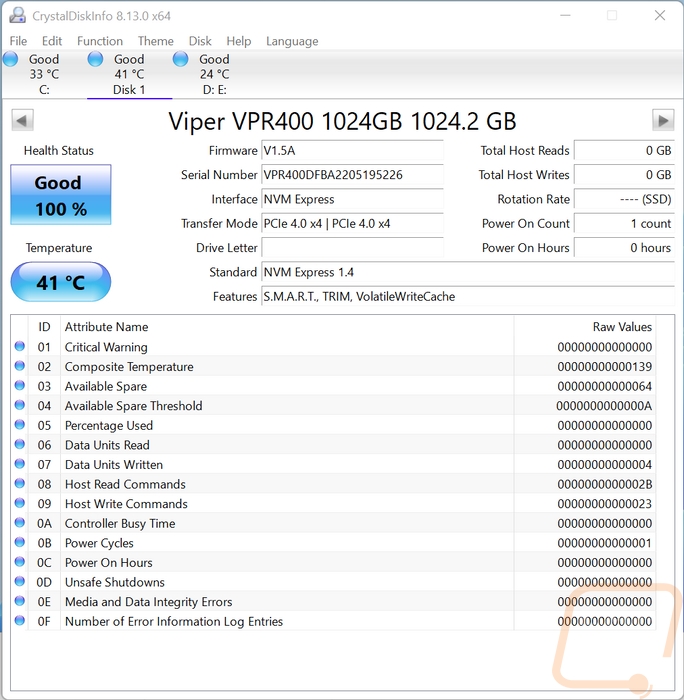
Before getting into testing the Viper Gaming VPR400 I did check the drive out using CrystalDiskInfo just to confirm that it was connected using the correct interface. The drive runs on PCIe 4.0 and needs 4 lanes to get the best possible performance and we were connected and running at that. I also like to do this to document the firmware revision we are running on for testing because those do change from time to time which we are on V1.5A.
My first round of testing was to run the Viper Gaming VPR400 through Crystal Disk Mark 8. Sequential testing is usually a best-case scenario and is what companies use for their specifications and on the front of the box to advertise drive speeds which in the case of the Viper Gaming VPR400 the box and the specifications say the VPR400 should see up to 4600 MB/s for its reads and 4400 MB/s for its writes. Below I have the drives labeled in orange if they are PCIe 4.0 and blue for older 3.0 drives for reference. The Viper Gaming VPR400 did a lot better than the packaging suggested with its read performance reaching 5163 MB/s. Even on the write performance, it did better as well at 4780 MB/s which is nice to see. This is still lower than most of the PCIe 4.0 drives tested, however, so it's great it outperformed what Viper said it would but there is still room for improvement.
|
PCIe 3.0 |
PCIe 4.0 |
|||
|
Crystal Disk Mark 8 - Read |
SEQ1M Q8T1 |
SEQ128K Q32T1 |
RND4K Q32T16 |
RND4K Q1T1 |
|
WD Blue SN550 1TB |
2444.53 |
2077.36 |
1075.88 |
57.88 |
|
Sabrent Rocket Q4 2TB |
4939.59 |
2871.47 |
1034.52 |
74.53 |
|
Corsair MP400 1TB |
3432.77 |
1889.56 |
713.28 |
61.42 |
|
Corsair Force MP600 2TB |
4828 |
1543.31 |
901.83 |
41.49 |
|
Sabrent Rocket 4.0 Plus 1TB |
6468.33 |
2712.53 |
455.24 |
54.68 |
|
Crucial P5 Plus 1TB |
6697.19 |
4358.63 |
1113.7 |
69.76 |
|
Kingston FURY Renegade 2TB |
6592.75 |
3093.11 |
1085.23 |
55.14 |
|
Patriot P400 1TB |
5036.9 |
3518.47 |
1059.71 |
88.06 |
|
WD Blue SN570 1TB |
3569.34 |
2681.32 |
1046.46 |
65.75 |
|
WD Black SN770 1TB |
5223.32 |
4958.17 |
1034.35 |
82.24 |
|
MSI Spatium M480 Play 2TB |
6979.03 |
4267.59 |
1315.25 |
81.22 |
|
Viper Gaming VPR400 |
5163.46 |
3880.75 |
1030.81 |
85.35 |
|
PCIe 3.0 |
PCIe 4.0 |
|||
|
Crystal Disk Mark 8 - Write |
SEQ1M Q8T1 |
SEQ128K Q32T1 |
RND4K Q32T16 |
RND4K Q1T1 |
|
WD Blue SN550 1TB |
2007.63 |
2006.4 |
776.4 |
290.25 |
|
Sabrent Rocket Q4 2TB |
3633.71 |
2568.7 |
920.84 |
385.73 |
|
Corsair MP400 1TB |
2021.09 |
2017.63 |
1196.42 |
262.36 |
|
Corsair Force MP600 2TB |
992.38 |
982.78 |
996.22 |
276.26 |
|
Sabrent Rocket 4.0 Plus 1TB |
5241.89 |
5225.25 |
921.51 |
402.26 |
|
Crucial P5 Plus 1TB |
5025.83 |
4880.38 |
884.12 |
240.78 |
|
Kingston FURY Renegade 2TB |
6899.76 |
5831.06 |
1083.12 |
367.6 |
|
Patriot P400 1TB |
4830.94 |
4813.27 |
846.34 |
307.12 |
|
WD Blue SN570 1TB |
3147.13 |
2893.72 |
909.47 |
234.17 |
|
WD Black SN770 1TB |
4983.07 |
4980.59 |
1149.36 |
295.13 |
|
MSI Spatium M480 Play 2TB |
6870.73 |
5863.14 |
1062.32 |
357.02 |
|
Viper Gaming VPR400 |
4780.82 |
4775.74 |
838 |
285.02 |
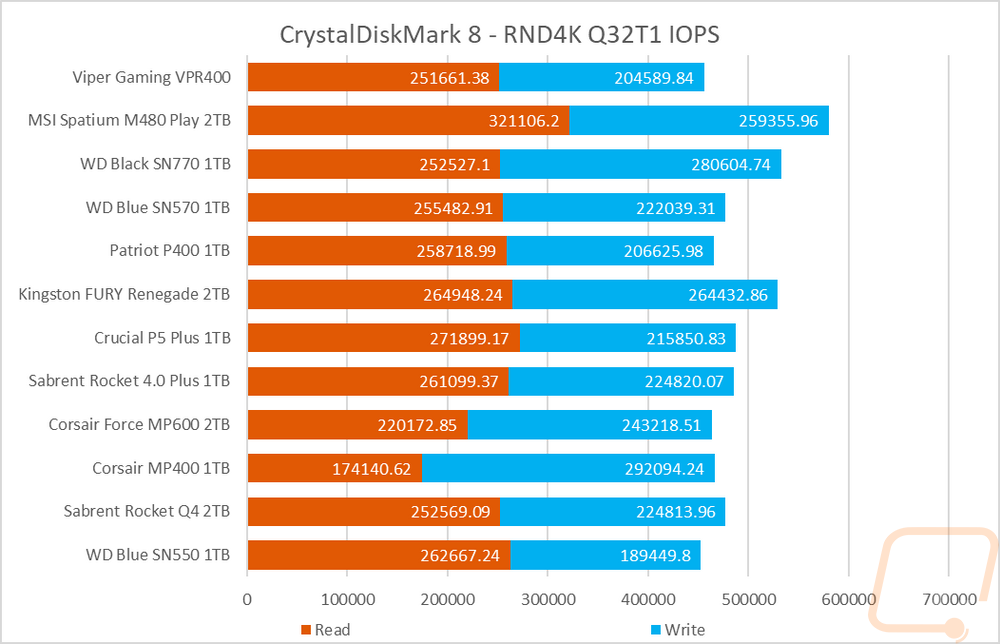
While testing in CrystalDiskMark 8 I did also check out the drive’s IOPS performance with the random 4k queue depth of 32 and 1 thread results. I stacked the read and write performance together here because I do believe that the overall drive performance is important, not just one result or the other. The Viper Gaming VPR400 struggled here being the lowest of all of the drives tested when the results were combined. Its rear IOPS were in the middle of the pack and in line with drives like the SN770 but with the write IOPS being the second lowest it handicapped the overall result.
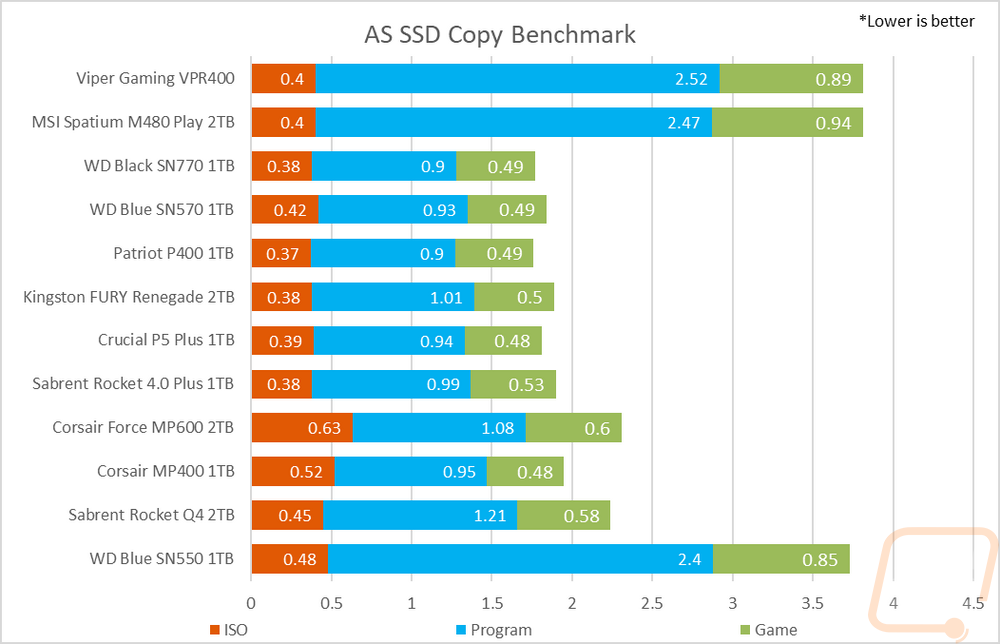
In AS SSD I skipped over the standard test because it is very similar to the CrystalDiskMark tests I prefer to check out one of its sub-tests, the copy benchmark. This moves three files, one that is an ISO, one that is a program, and then a game and times how long each takes. With these being timed, lower is better here. I have all three results stacked to see which drives are best overall. The Viper Gaming VPR400 came in tied with the MSI Spatium M480 Play that I recently tested and was right in line with the WD Blue SN550 as well which were both WAY behind the rest of the drives in this test. It didn’t do too bad with the ISO portion but really struggled with the program files and wasn’t great on the game files as well.
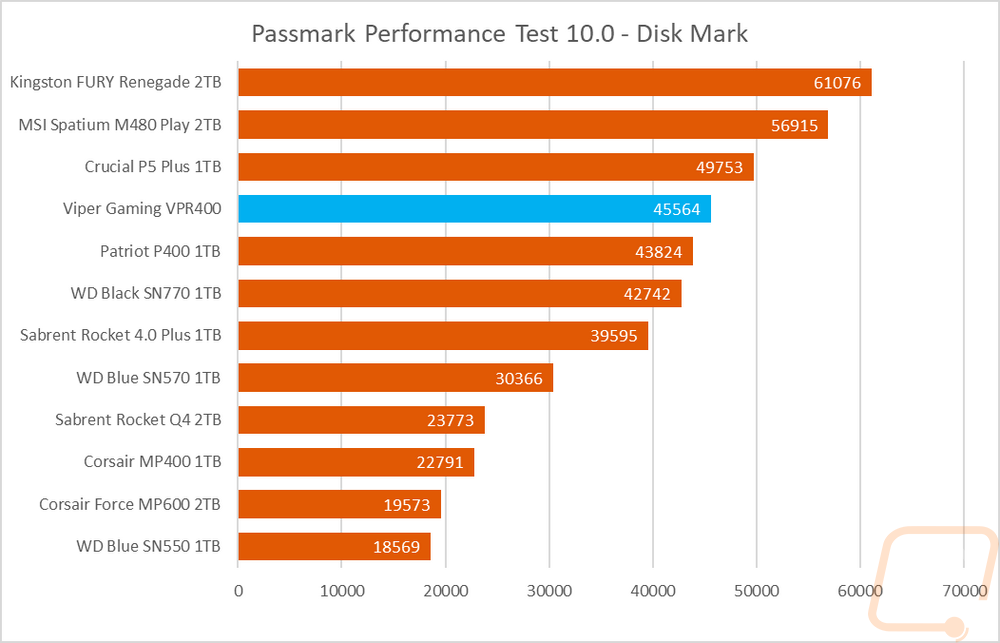
Next up with PassMark Performance Test 10 I ran their combined synthetic benchmark to get a look at their DiskMark rating. The Viper Gaming VPR400 did well, coming in ahead of 2/3 of the drives tested with just the Renegade, the M480 Play, and the P5 Plus out in front.
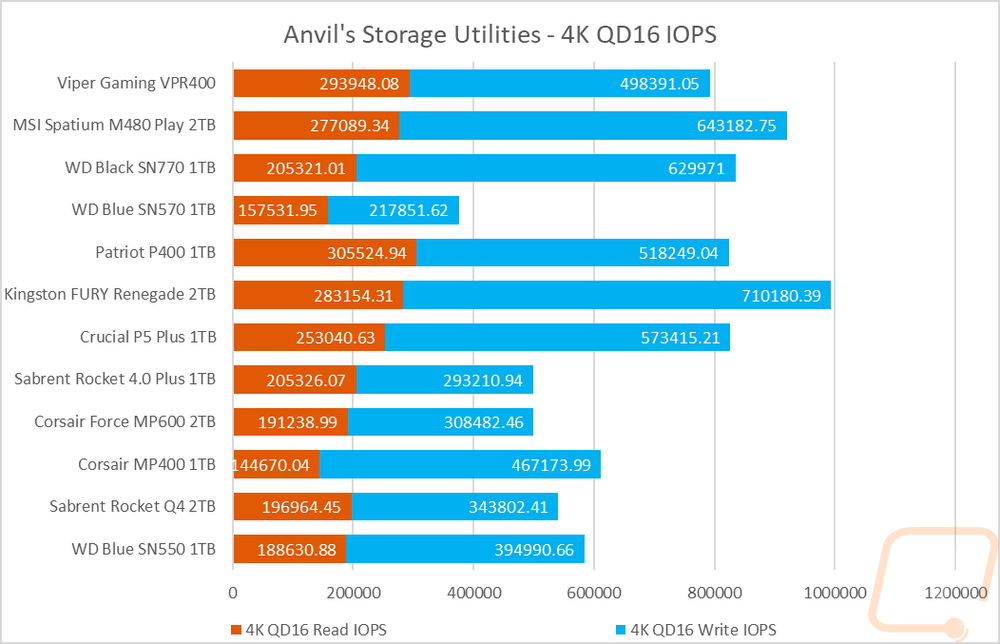
I then changed my focus back over to IOPS performance and ran the Viper Gaming VPR400 in Anvil’s Storage Benchmark focusing on the 4k queue depth of 16 results from the main test. The read IOPS here were higher than everything but the M480, P400, and the Renegade. The write IOPS were better here as well which combined put the Viper Gaming VPR400 in the middle of the pack.
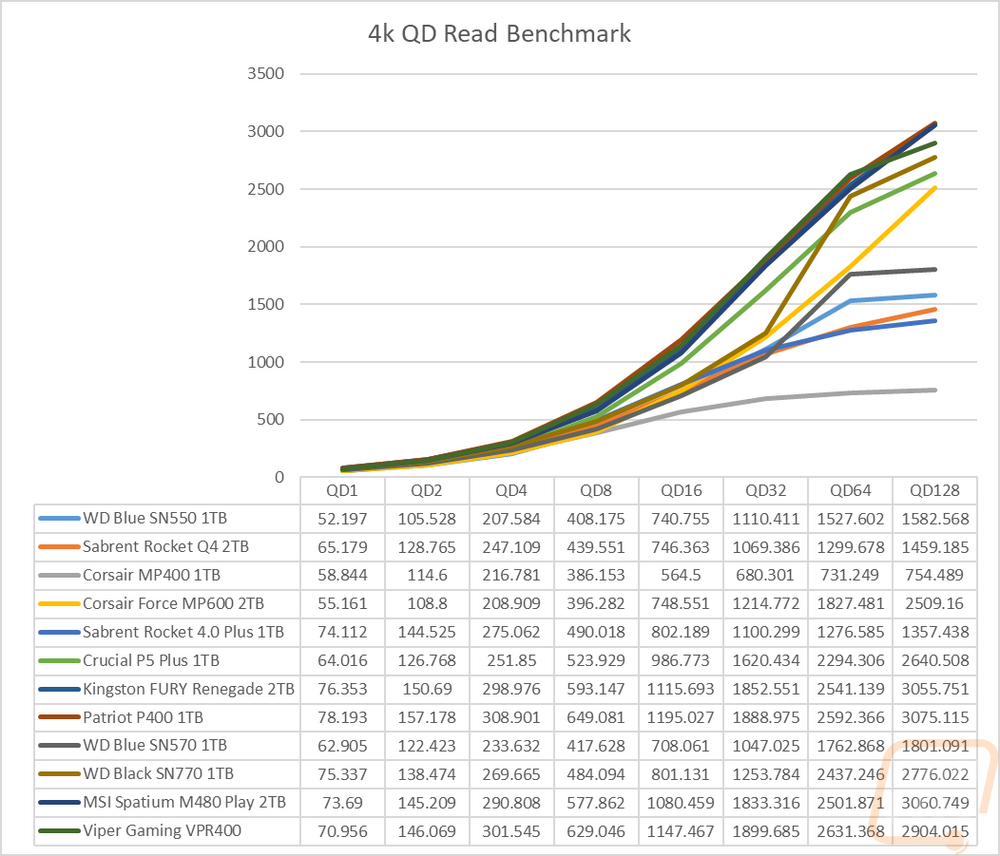
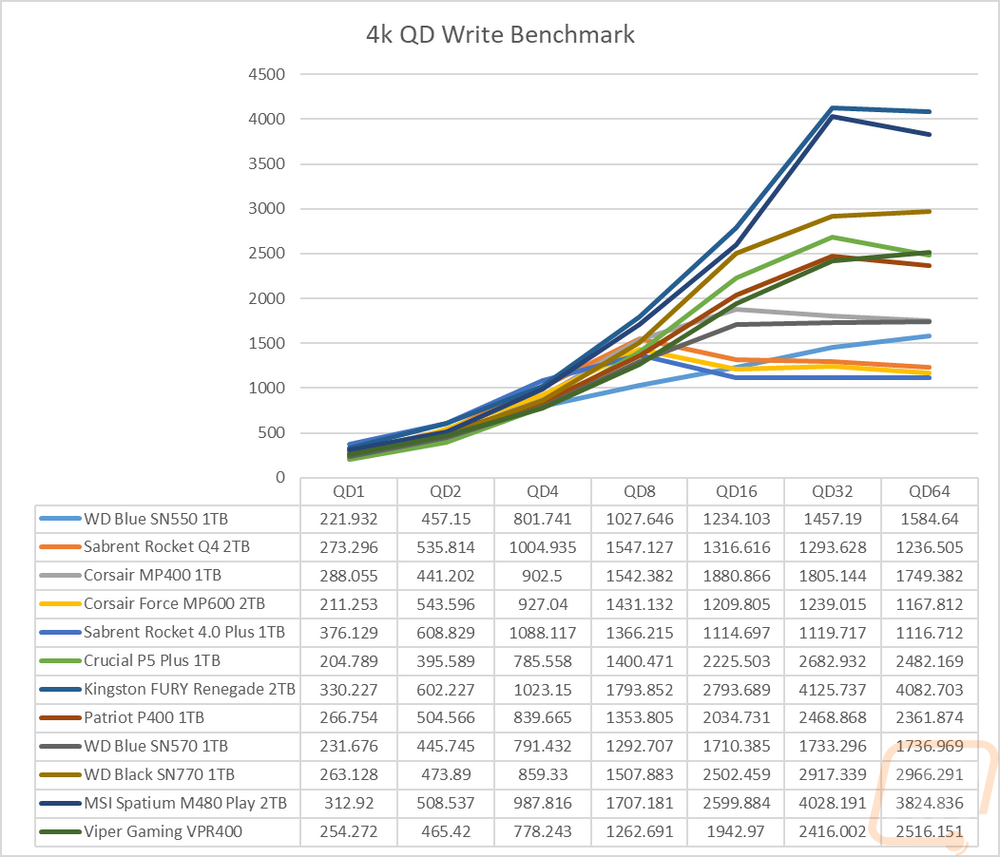
Sticking with Anvil’s Storage Utilities I did a few more tests. Here I wanted to check out how the drive would react to different queue depths so with the file size set to 4K I ran tests ramping up double each time starting at 1 and up to 128 for reads and 64 for writes. This lets us see if the controller gets overloaded. For the read, queue depth tests the Viper Gaming VPR400 started off on its read queue depth test in the middle but did jump up in performance at a queue depth of 4 and ran with the top drives (and even was the fastest at 64QD) until the last test at 128 queue depth where it dropped down slightly. For the write queue depth test it started in the middle of the pack for the first test and stayed there the rest of the way up.
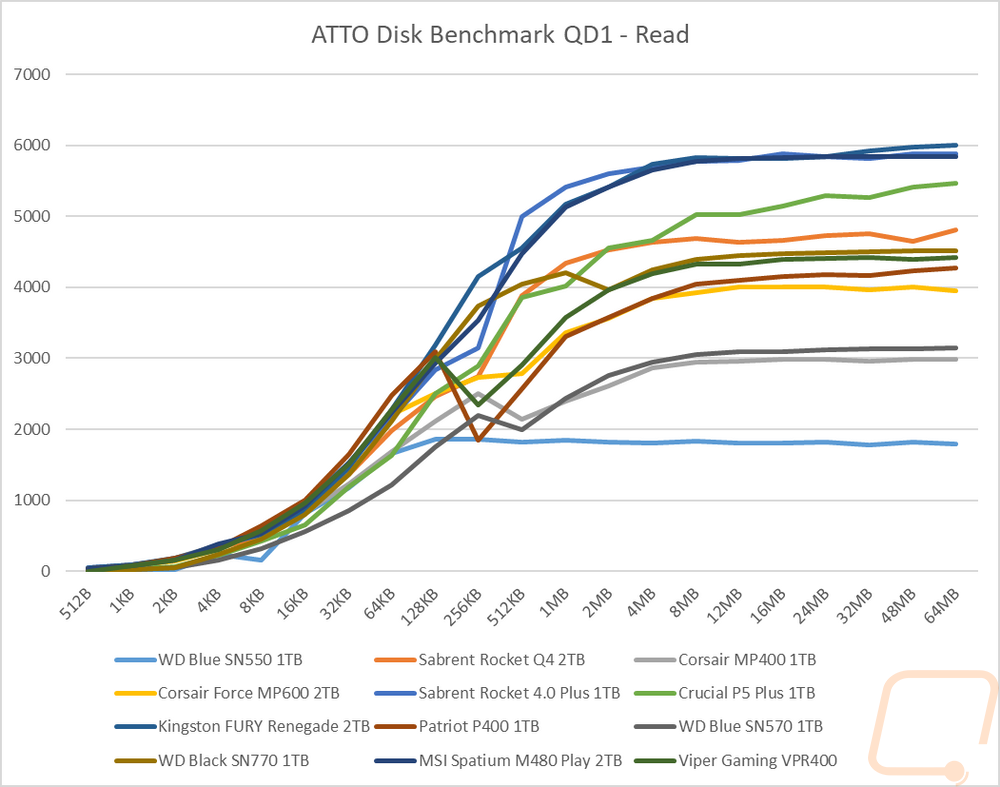
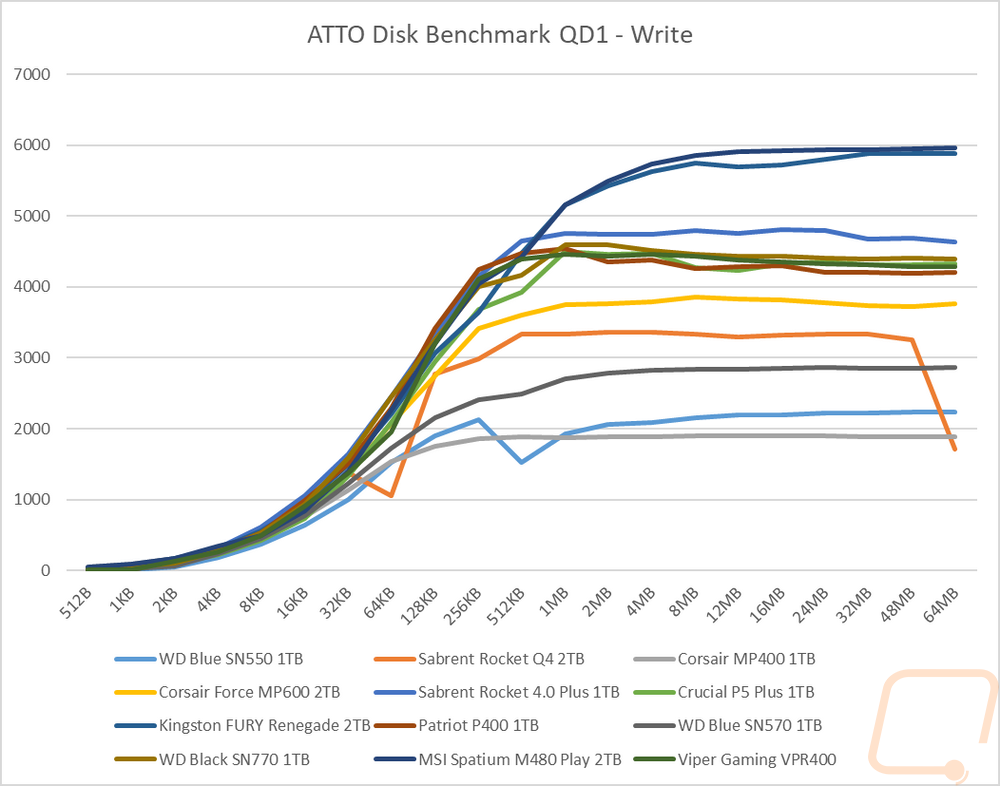
For ATTO Benchmark I set it to a queue depth of just 1 but ramped up the file size slowly to see how it would affect performance. For the read test in ATTO, the Viper Gaming VPR400 hung with the top drives up until 128KB and then drops down and recovers but ends up closer to the middle of the pack leveling off around 4400 MB/s for the last 8 tests. For the write test, Viper Gaming VPR400 again ran right in the top pack up until 512KB where it leveled off and dropped slightly in performance coming in with 5 drives ahead of it.
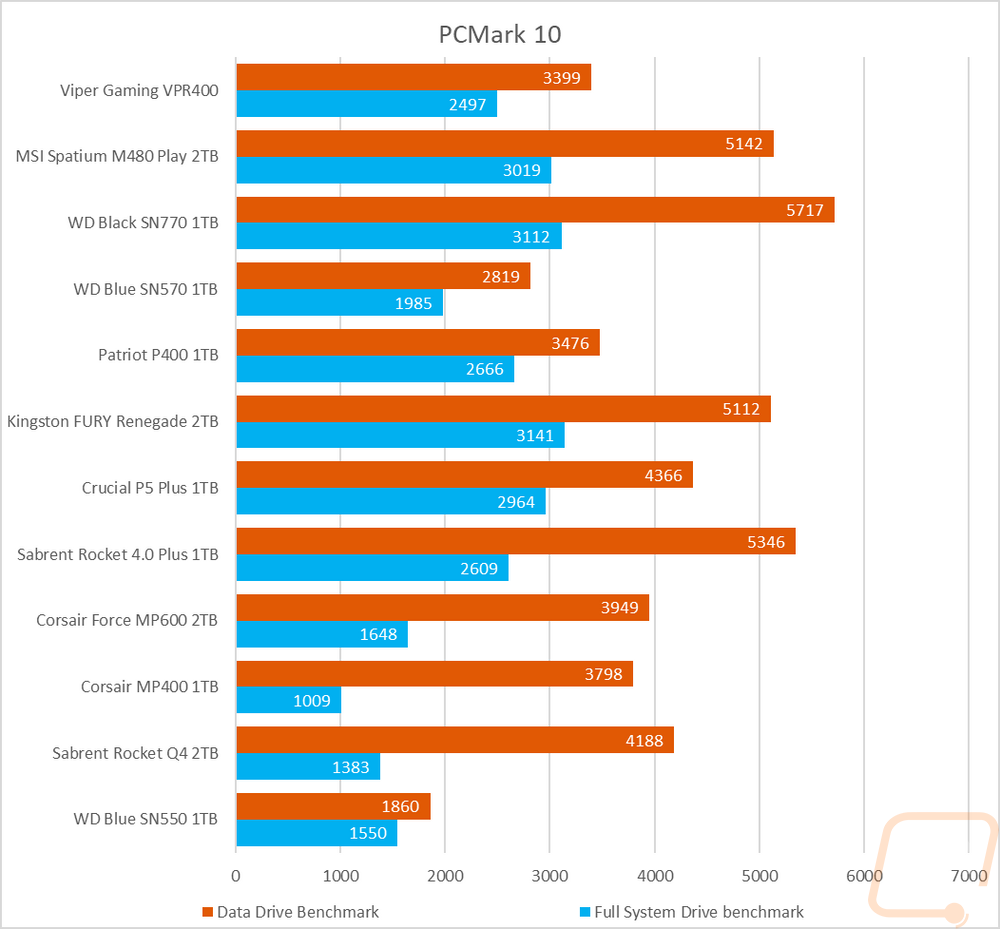
Next up I wanted to look at more real-world performance and for this, I started with PCMark 10 which has an overall full system benchmark for storage and then one focused on data storage drives. In the full system drive benchmark, the Viper Gaming VPR400 would be right in the middle of the pack for its full system drive benchmark results but the data drive tests didn’t do as well with just two drives that performed lower.
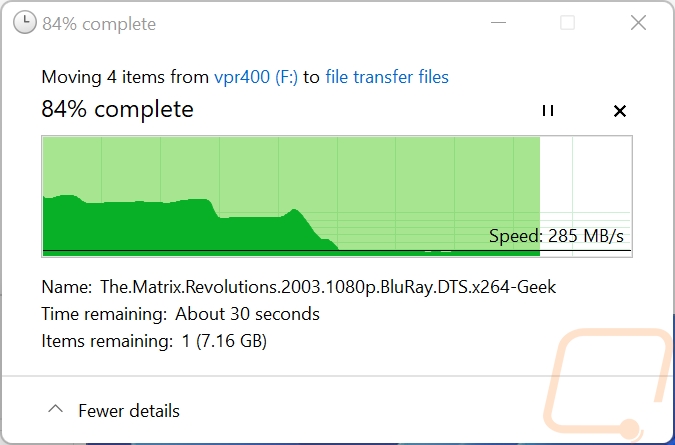
Next, up for more real-world resting, I did our file transfer tests. You don’t get any more real-world than this. For each drive, I copied the folder filled with files to the drive tested and then back to the Rocket Q4 in our test bench. I used three file types, movies which are large single files, a folder filled with RAW and JPG photos, and then a folder filled with word documents. Starting with the movie files the Viper Gaming VPR400 did 2360 MB/s when moving the files to the SSD but was a little slower when reading and moving those back to the PC. I will say ran this test multiple times and there were a few times where the drive seemed to overheat and struggle and drop to a very low number like in the picture below the table. For the photos, the VPR400 did great, outperforming all of the other drives tested when copying the files to the SSD, and didn’t do too bad going back to the PC as well. Then last up the word documents were slow moving to the Viper VPR400 but were the fastest out of all of the drives tested going back to the PC.
|
Windows 11 File Transfers |
Movies to Drive |
Movies to PC |
Pictures to Drive |
Pictures to PC |
Docs to Drive |
Docs to PC |
|
WD Blue SN550 1TB |
852 |
1360 |
937 |
1001 |
2.42 |
5.32 |
|
Sabrent Rocket Q4 2TB |
2720 |
2060 |
1140 |
1030 |
5.75 |
5.2 |
|
Corsair MP400 1TB |
2140 |
875 |
996 |
1410 |
2.57 |
5.98 |
|
Corsair Force MP600 2TB |
1250 |
1330 |
816 |
1320 |
2.83 |
5.48 |
|
Sabrent Rocket 4.0 Plus 1TB |
2120 |
2960 |
254 |
842 |
1.63 |
5.16 |
|
Crucial P5 Plus 1TB |
2060 |
2720 |
1030 |
1140 |
5.2 |
5.75 |
|
Kingston FURY Renegade 2TB |
2330 |
3220 |
857 |
1270 |
2.58 |
5.88 |
|
Patriot P400 1TB |
2070 |
2870 |
981 |
944 |
2.86 |
4.62 |
|
WD Blue SN570 1TB |
602 |
325 |
992 |
1310 |
5.14 |
6.05 |
|
WD Black SN770 1TB |
2260 |
2170 |
605 |
1210 |
2.52 |
6.11 |
|
MSI Spatium M480 Play 2TB |
1930 |
494 |
905 |
706 |
5.62 |
3.87 |
|
Viper Gaming VPR400 |
2360 |
1980 |
1300 |
1310 |
2.61 |
7.12 |