Cooling Noise and Power
For my last few tests, rather than focusing on in game performance, I like to check out other aspects of video card performance. These are also the most important ways to differentiate the performance between cards that have the same GPU. To start things off I took a look at power usage.
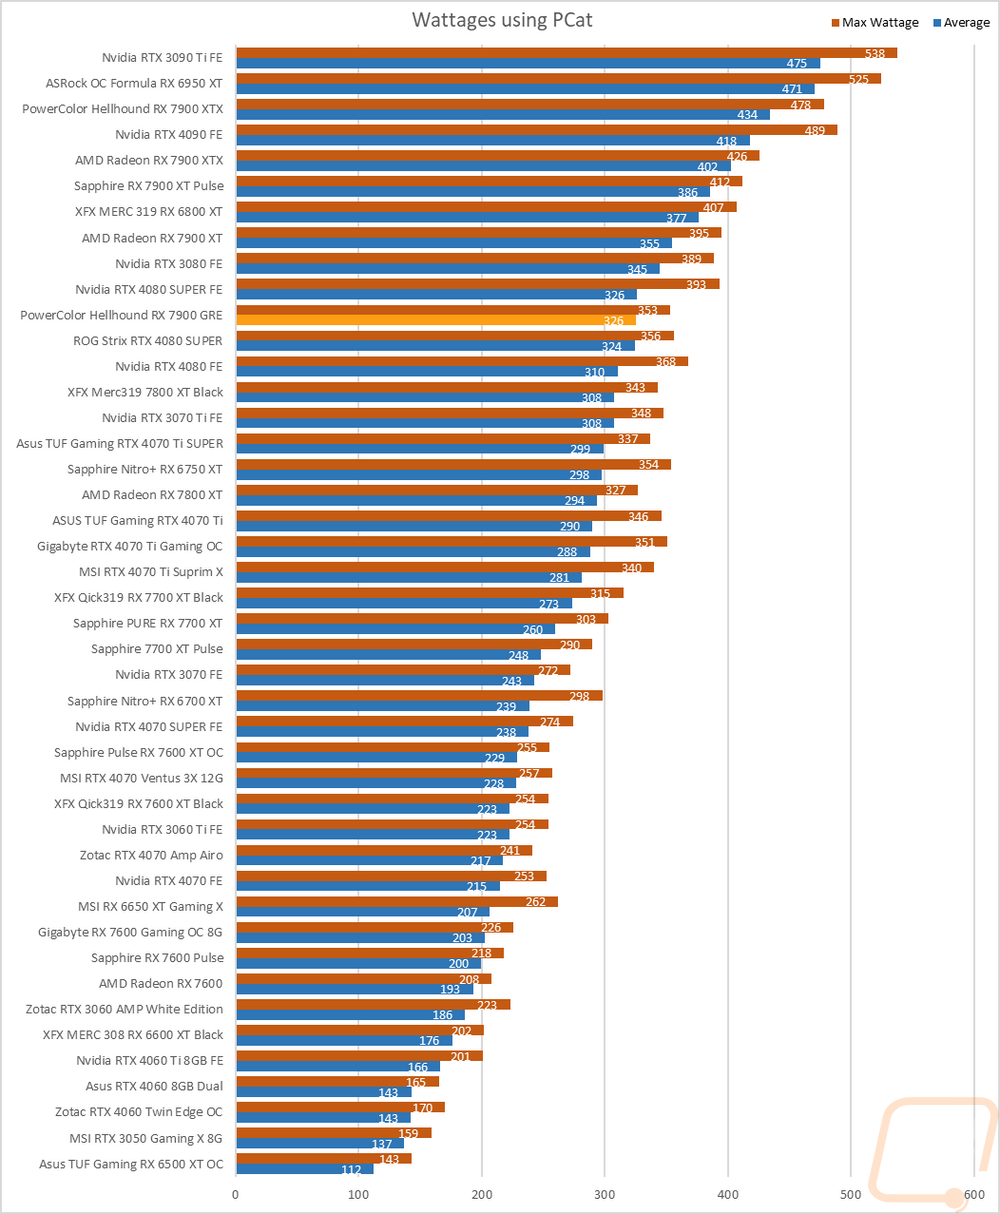
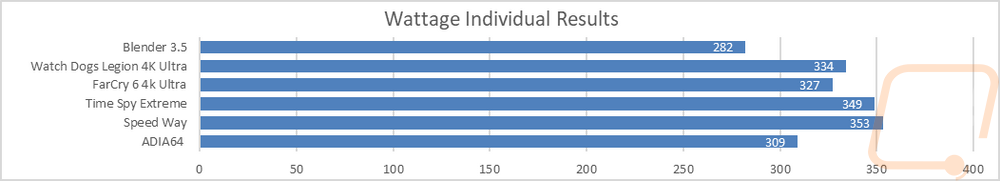
For this, our new test setup utilizes the Nvidia-designed PCat v2 along with cables to handle both traditional 6 or 8-pin connections as well as the new 12VHPWR. The PCat also utilizes a PCIe adapter to measure any power going to the card through the PCIe slot so we can measure the video card wattage exclusively, not the entire system as we have done in the past. I test with a mix of applications to get both in game, synthetic benchmarks, and other workloads like Blender and AIDA64. Then everything is averaged together for our result. I also have the individual results for this specific card and I document the peak wattage result as well which is almost always Time Spy Extreme but was Speed Way this time around. The Hellhound RX 7900 GRE pulled 353 watts at peak and averaged 326 across all of our power tests. That average is just 2 watts higher than the RTX 4080 SUPER to put things into perspective. It was 18 watts higher than the overclocked RX 7800 XT and 29 watts lower than the stock-clocked 7900 XT. Compared to Nvidia’s 4000 Series cards AMD is still pulling more wattage and the overclock on the Hellhound RX 7900 GRE seems to have lost any power savings that the 7900 GRE had when compared to the 7800 XT.
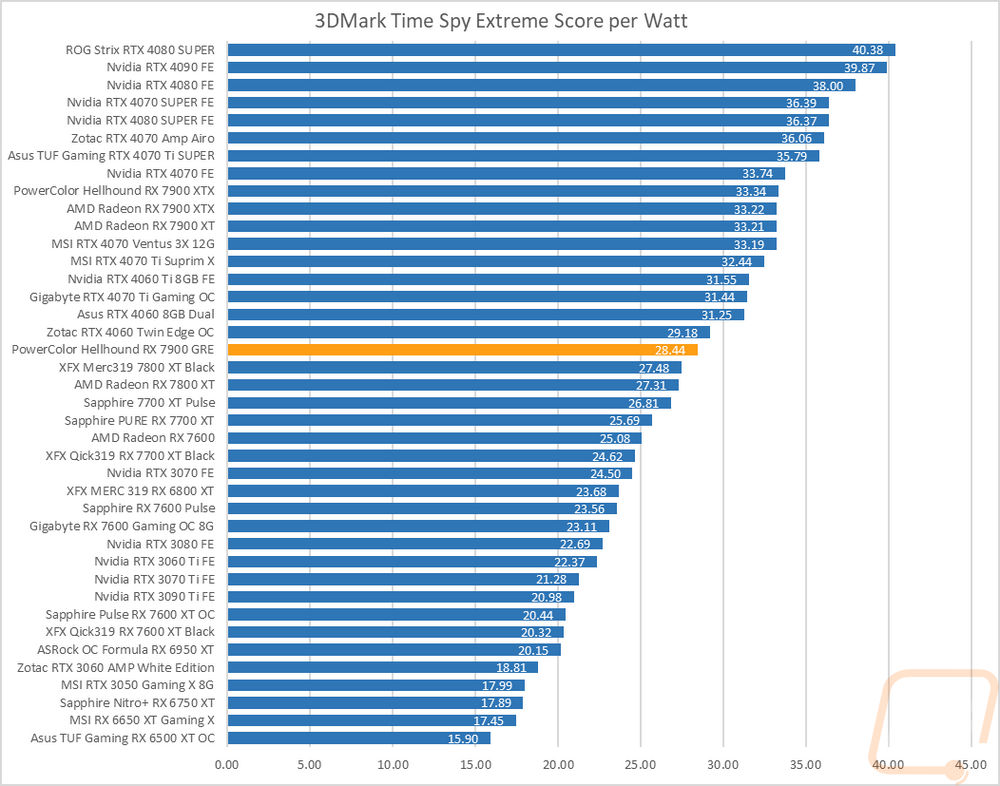
With having exact peak wattage numbers when running Time Spy Extreme I was also able to put together a graph showing the total score for each watt that a card draws which gives us an interesting look at overall power efficiency in the popular and demanding benchmark. The AMD cards have been a step behind Nvidia’s current generation in this test but that is even more noticeable here with the Hellhound RX 7900 GRE having a significant overclock. It scored a 28.44 and is sitting just ahead of the overclocked 7800 XT and behind the overclocked RTX 4060.
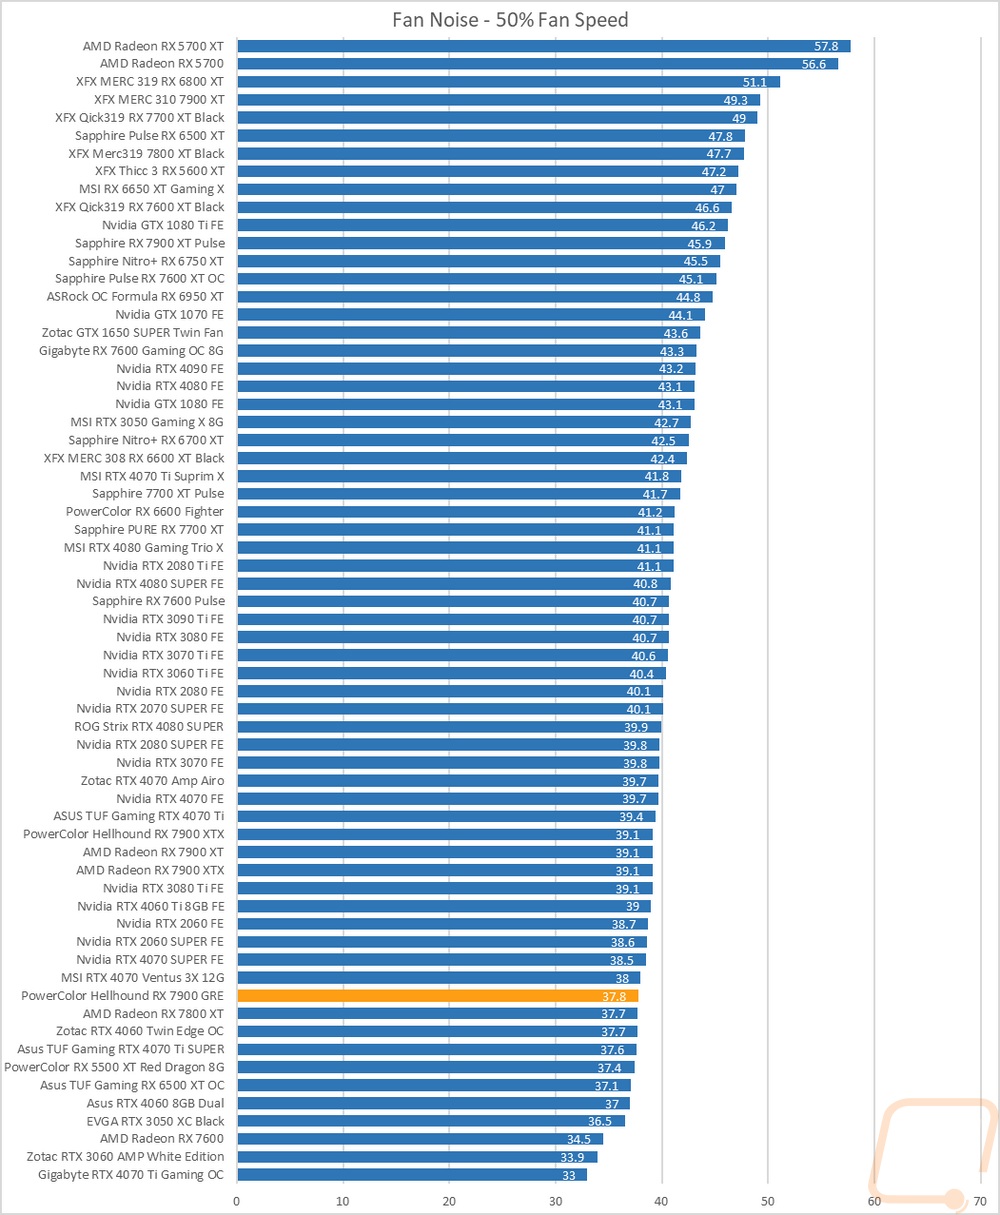
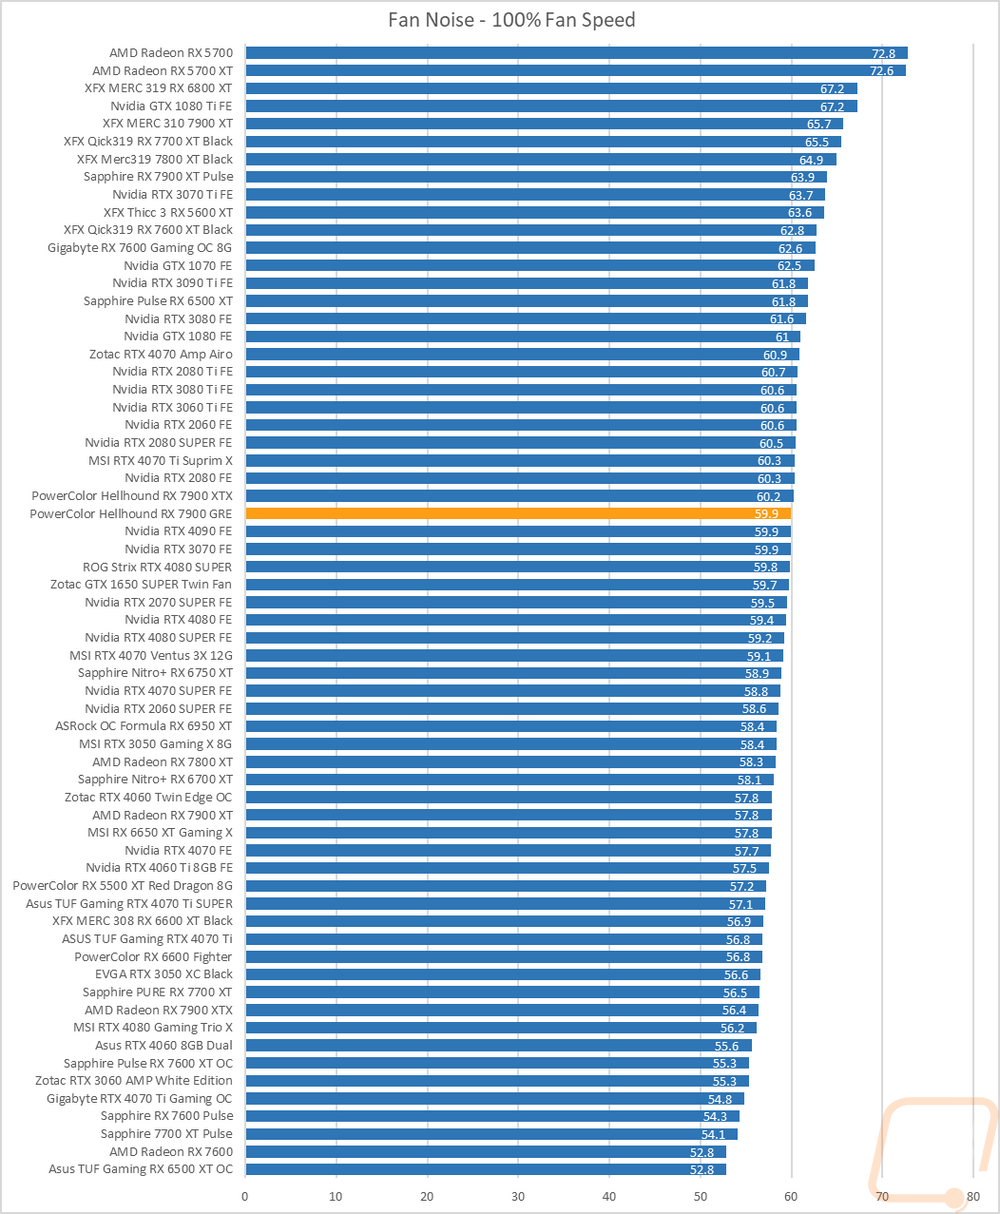
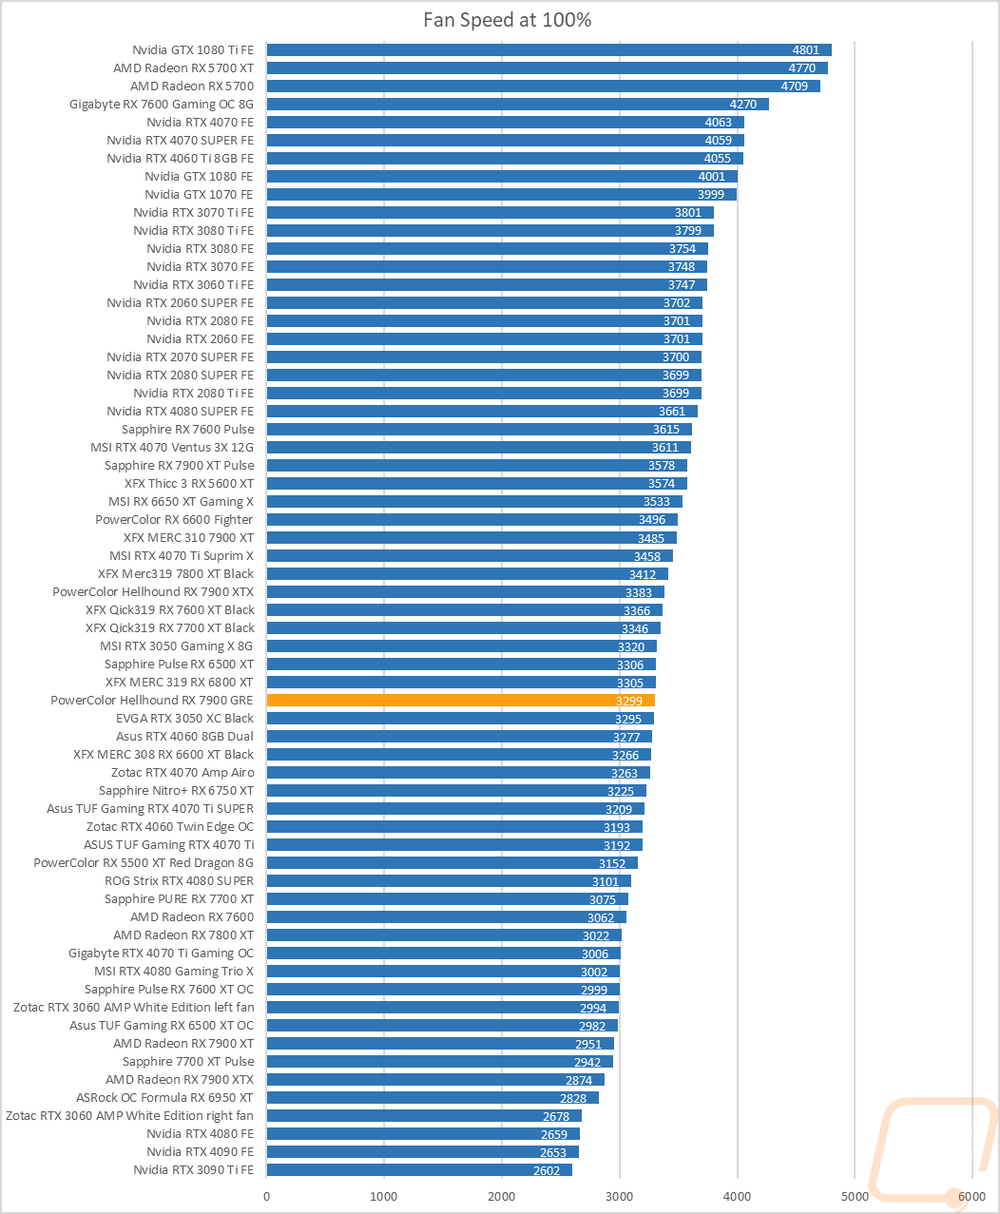
My next round of tests were looking at noise levels. These are especially important to me because I can’t stand to listen to my PC whirling. Especially when I’m not in game and other applications are using the GPU. For my testing, though I first tested with the fan cranked up to 100% to get an idea of how loud it can get, then again at 50% to get an idea of its range. The Hellhound RX 7900 GRE came in at 37.8 decibels at 50% fan speed which put it in the bottom section of our charts. It was higher up in the middle of the pack at 100% fan speed with its 59.9 dB result but that is in line with where the Hellhound RX 7900 GRE sits in the fan RPM chart.
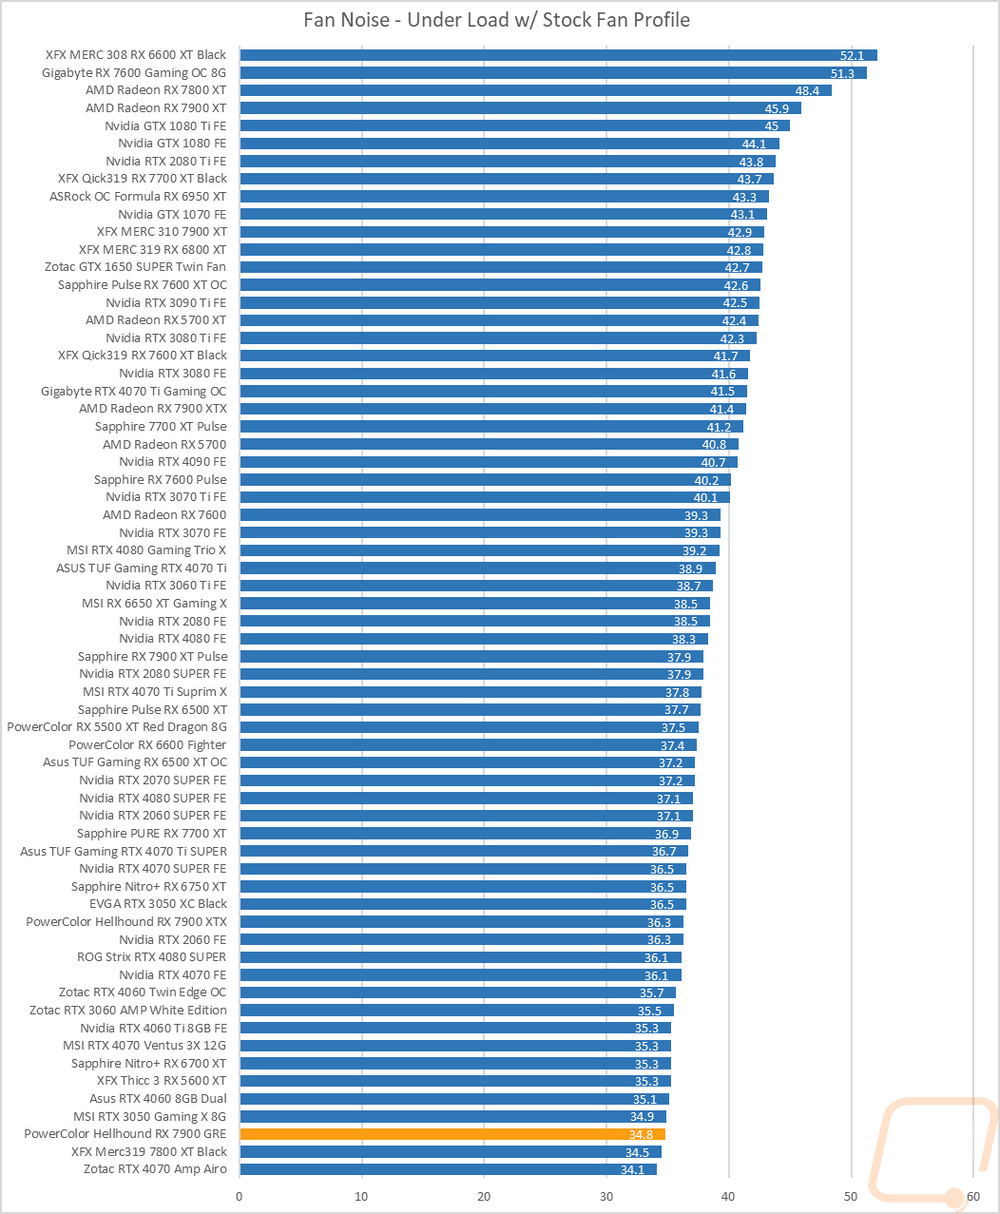
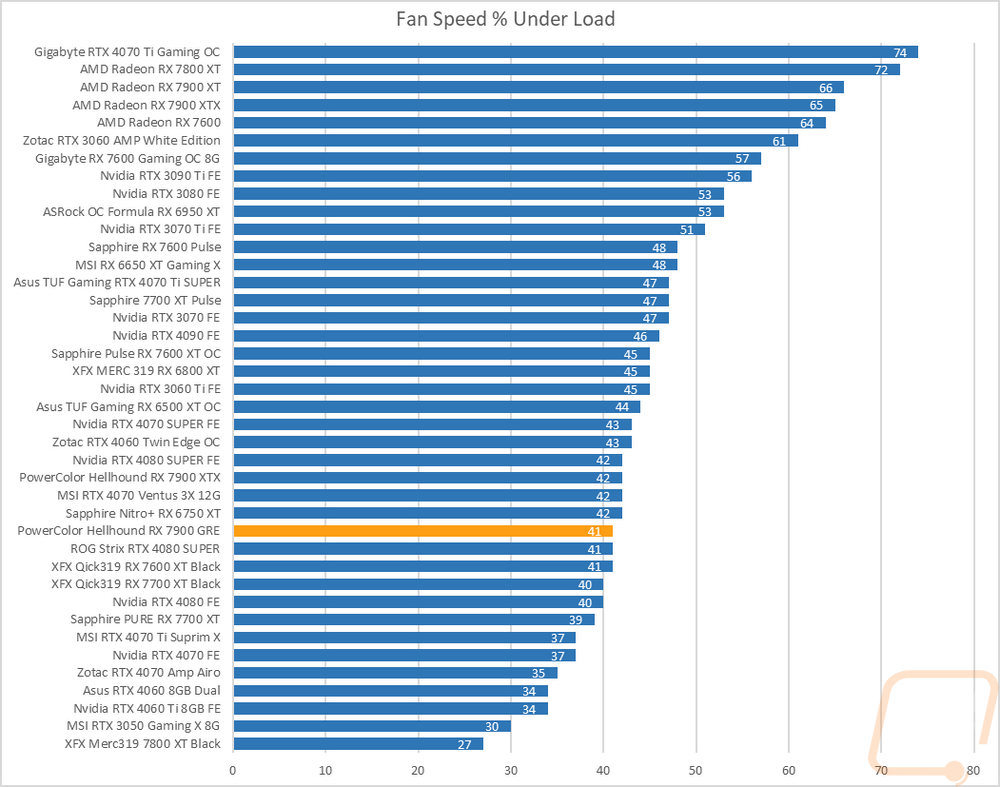
I also take a look at noise performance while under load. For that when running AIDA64’s stress test I wait until the temperature of the card has leveled off and then measure how loud things are when the card is at its worst-case scenario with the stock fan profile. Here the Hellhound RX 7900 GRE did extremely well at just 34.8 dB and down at the bottom of our chart. When under load it was running at 41% fan speed which helped things but the Hellhound RX 7900 GRE did really well noise wise when running at 50% and lower fan speeds.
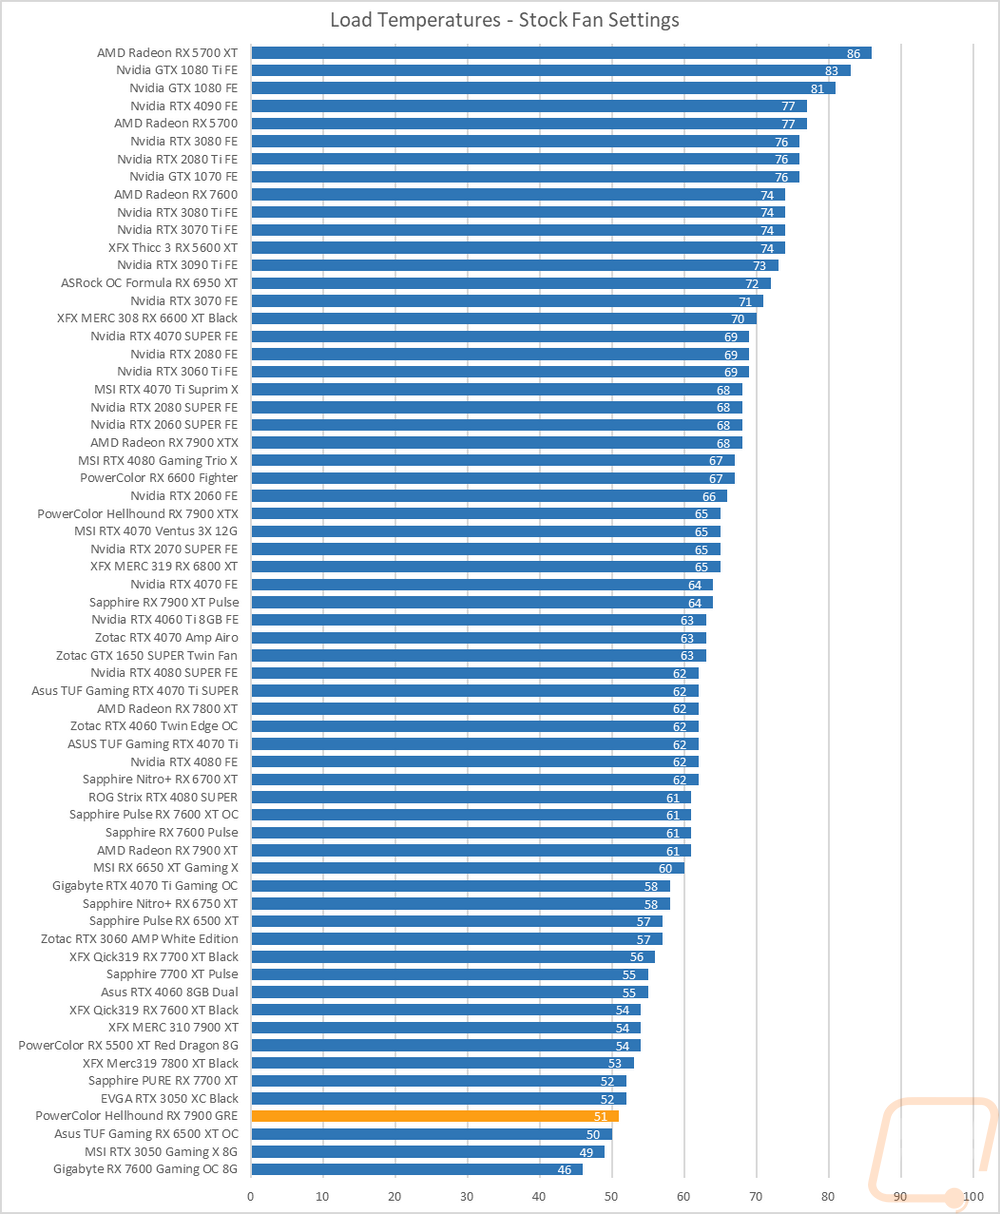
To finish up my testing I of course had to check out the cooling performance. To do this I ran two different tests. I used AIDA64’s Stress Test run for a half-hour each to warm things up. Then I documented what temperature the GPU leveled out at with the stock fan profile and then again with the fans cranked up to 100%. With the stock profile, the Hellhound RX 7900 GRE ran surprisingly cool, especially considering that it has a big overclock. It leveled off at just 51c which put it down in the bottom few cards on our chart. Its GPU Hotspot temps were a little high at 84c however.
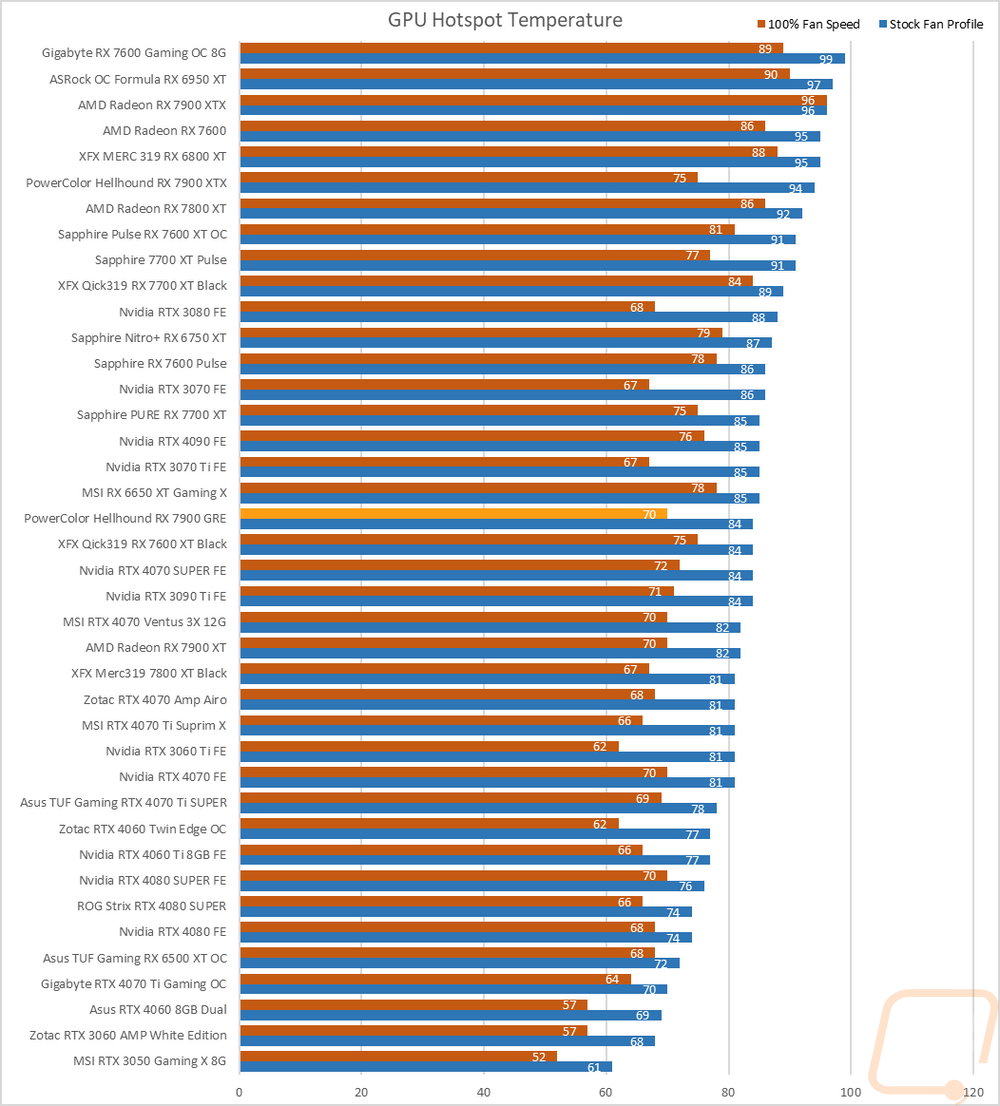
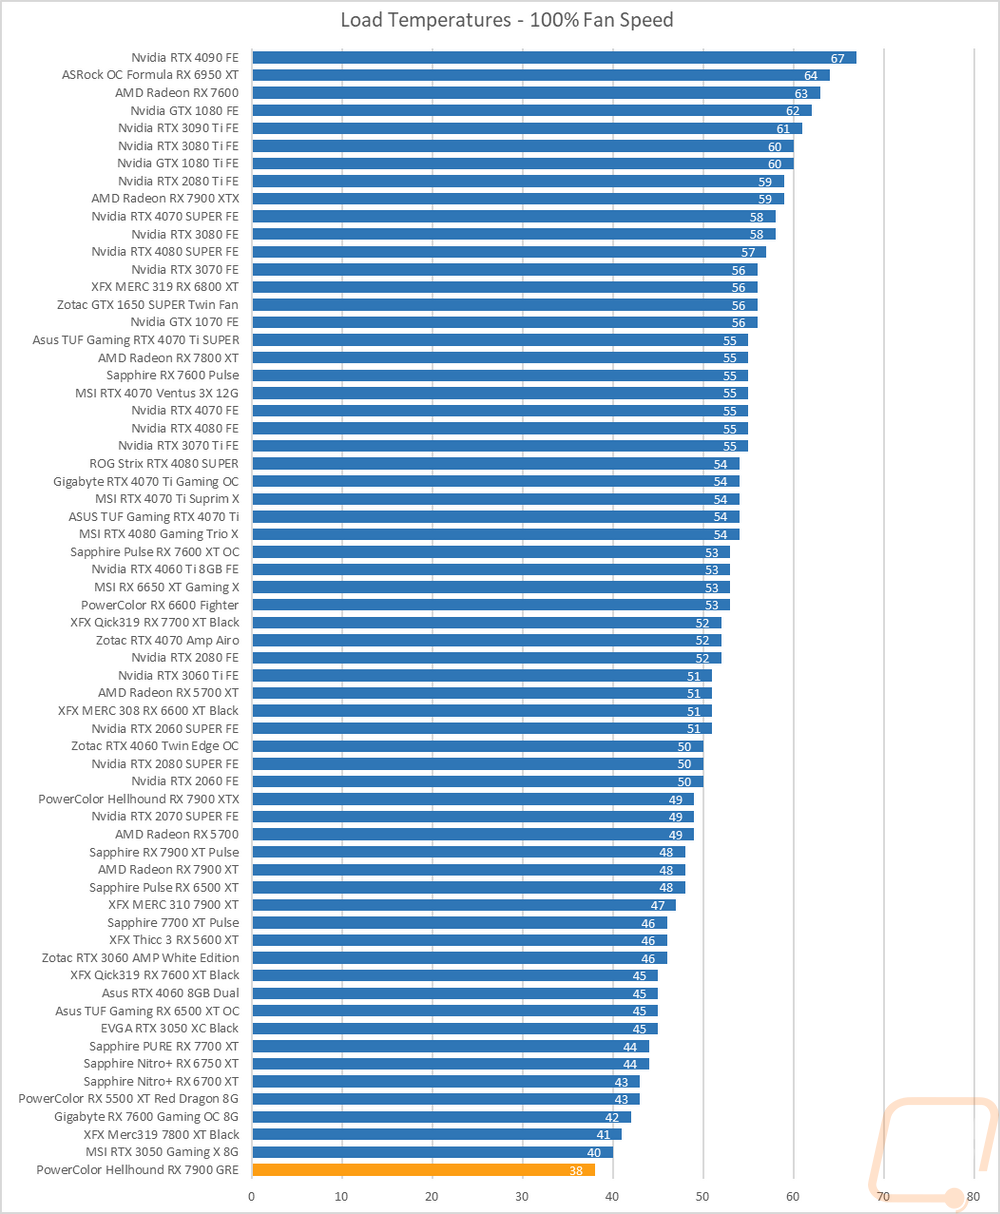
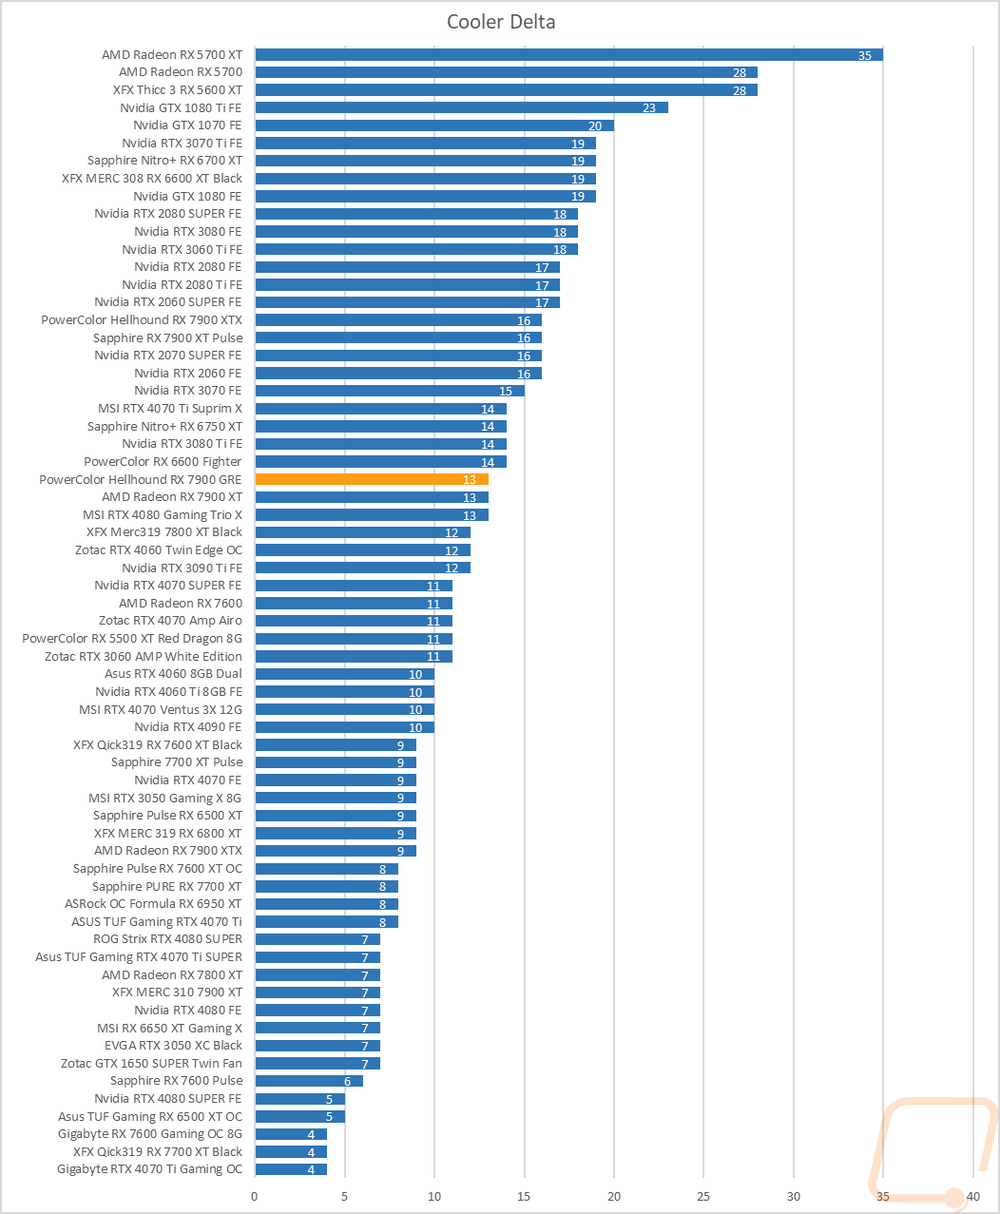
Then with the fans cranked up, the GPU Hotspot temperatures dropped down to 70c. As for the overall temperatures, where could the Hellhound RX 7900 GRE go from being one of the coolest running cards on our chart? Well down to the coolest running card of course. I would have guessed that there wouldn’t be too much headroom left, especially with the Hellhound RX 7900 GRE being similar but thinner than the Hellhound RX 7900 XTX design but it did have a 13 degree delta between the stock fan and 100% fan speed results.
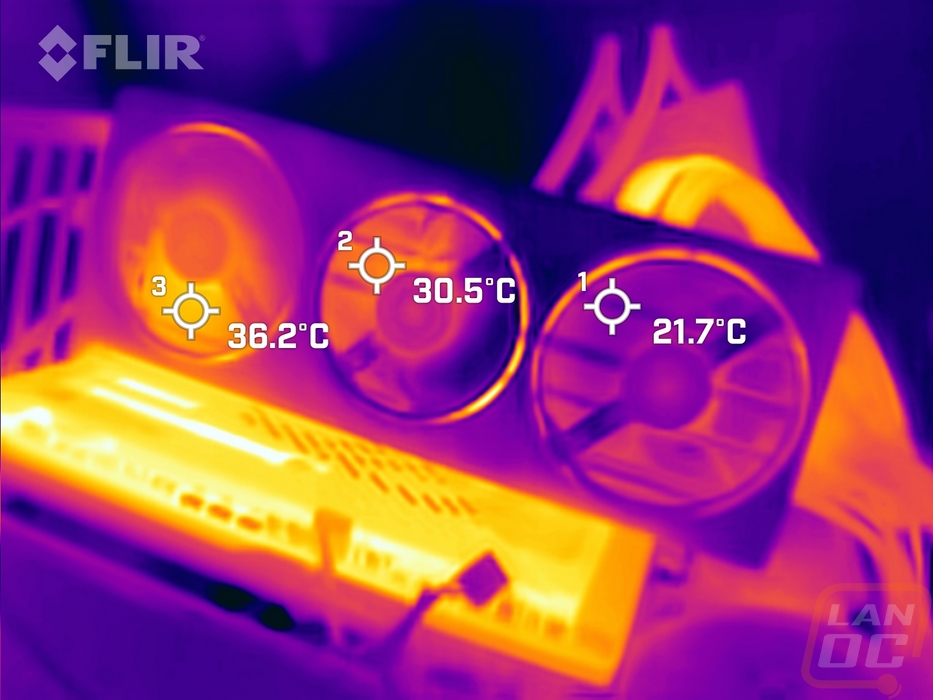
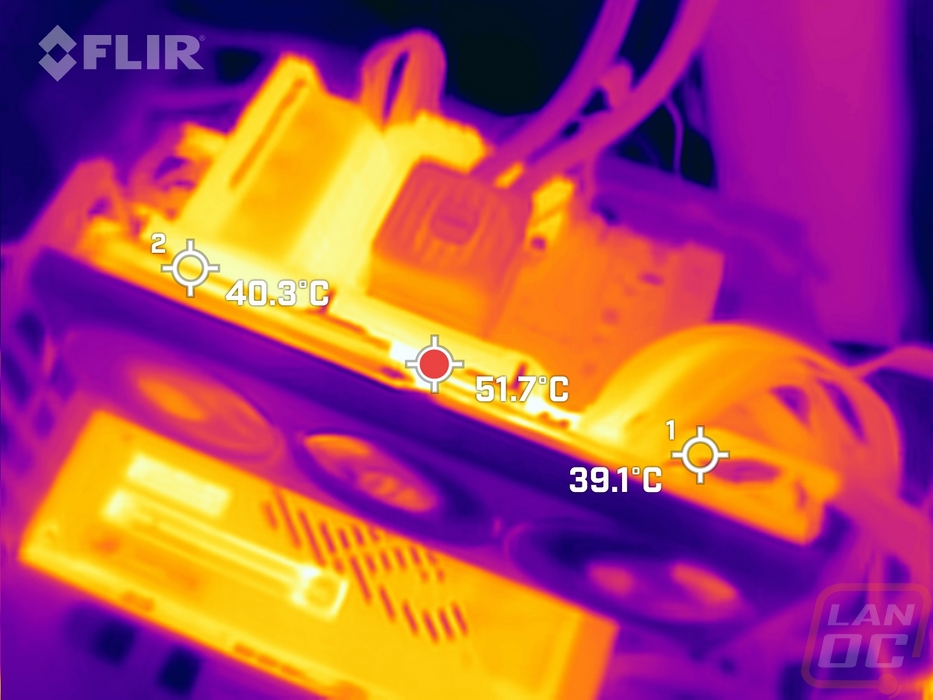
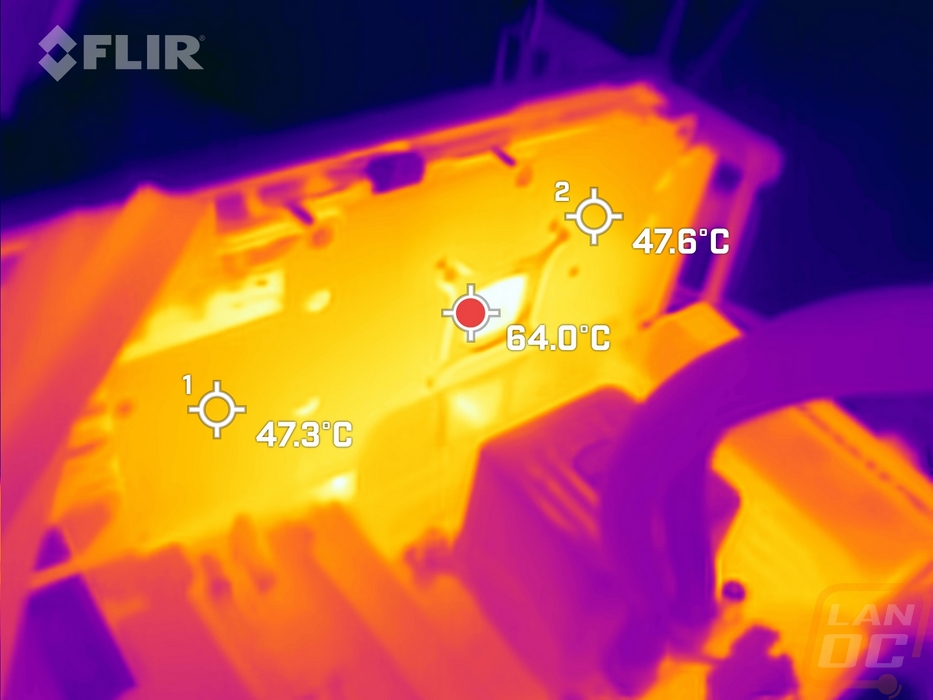
While running the stock fan profile testing I also took the time to get a few thermal images so we could see what is going on. On the fan side the Hellhound RX 7900 GRE is running nice and cool with the first fan having some heat behind it but even then sitting at just 36.2c, all the way on the far end though with the blow-through section it is running down at room temperature. The top edge which is where the Hellhound RX 7900 GRE is pushing air up and out is a lot hotter than what we saw on the fan side. The exposed PCB visible from the top is running up at 51.7c but the rest of the top is running cooler at 40.3c and on the far end cooler at 39.1c. On the back, much like the top, the exposed PCB just behind the GPU is of course the hottest at 64c. The rest of the metal backplate is radiating out some heat with it being mostly consistent in temperature across the entire back with the rest at 47.3c and 47.6c.