Cooling Noise and Power
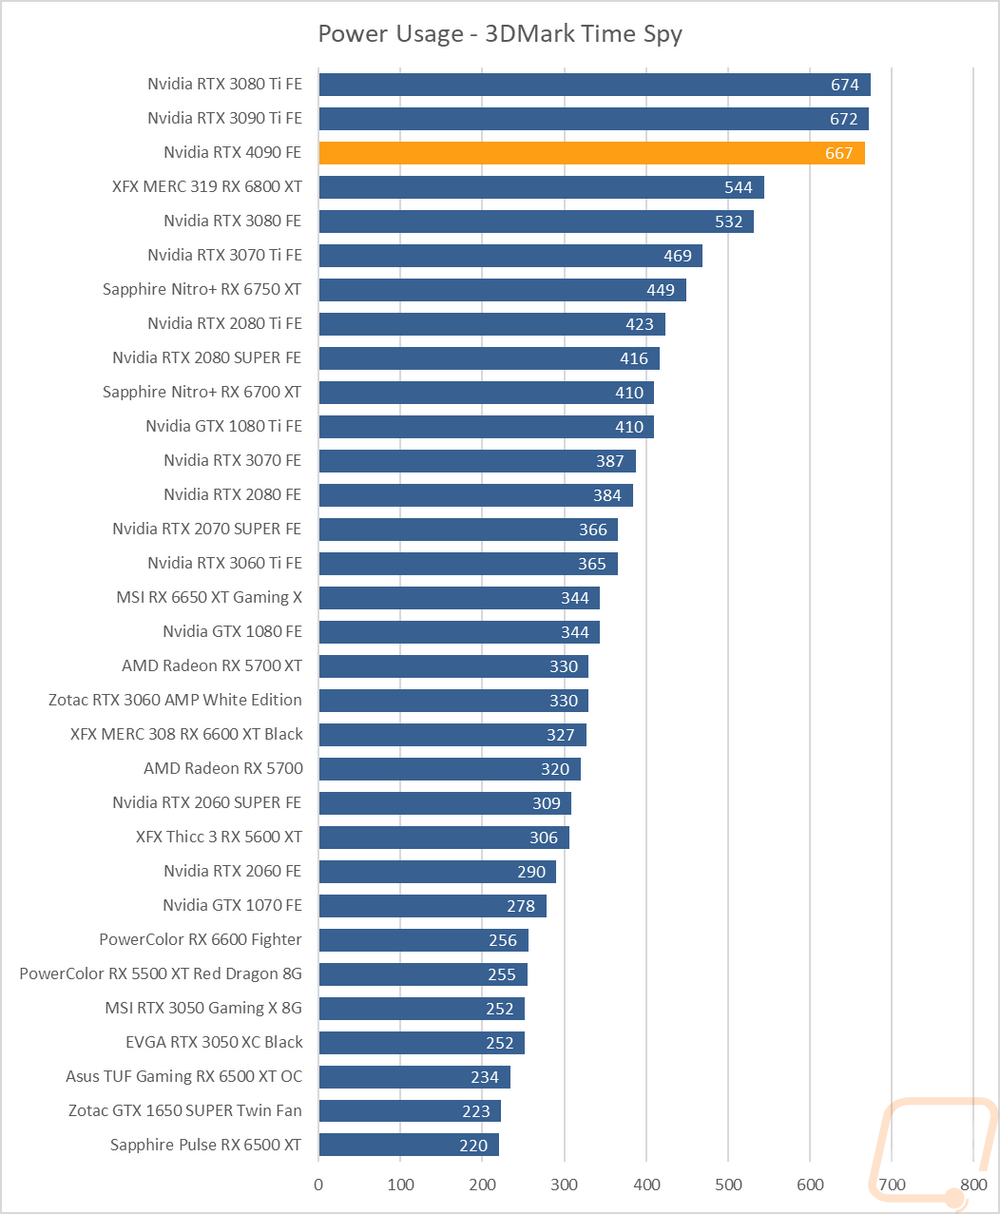
For my last few tests, rather than focusing on in game performance, I like to check out other aspects of video card performance. These are also the most important ways to differentiate the performance between cards that have the same GPU. To start things off I took a look at power usage. For this, I use our Kill-A-Watt hooked up to the test bench to record the total wattage of the system. I ran two tests with the first using 3DMark Time Spy to put the system under a load similar to normal in game performance. Here our test system with the RTX 4090 Founders Edition pulled a total of 667 watts which surprisingly didn’t put it at the top of the chart where the 3080 Ti FE and RTX 3090 Ti were both ahead of it by a few watts.
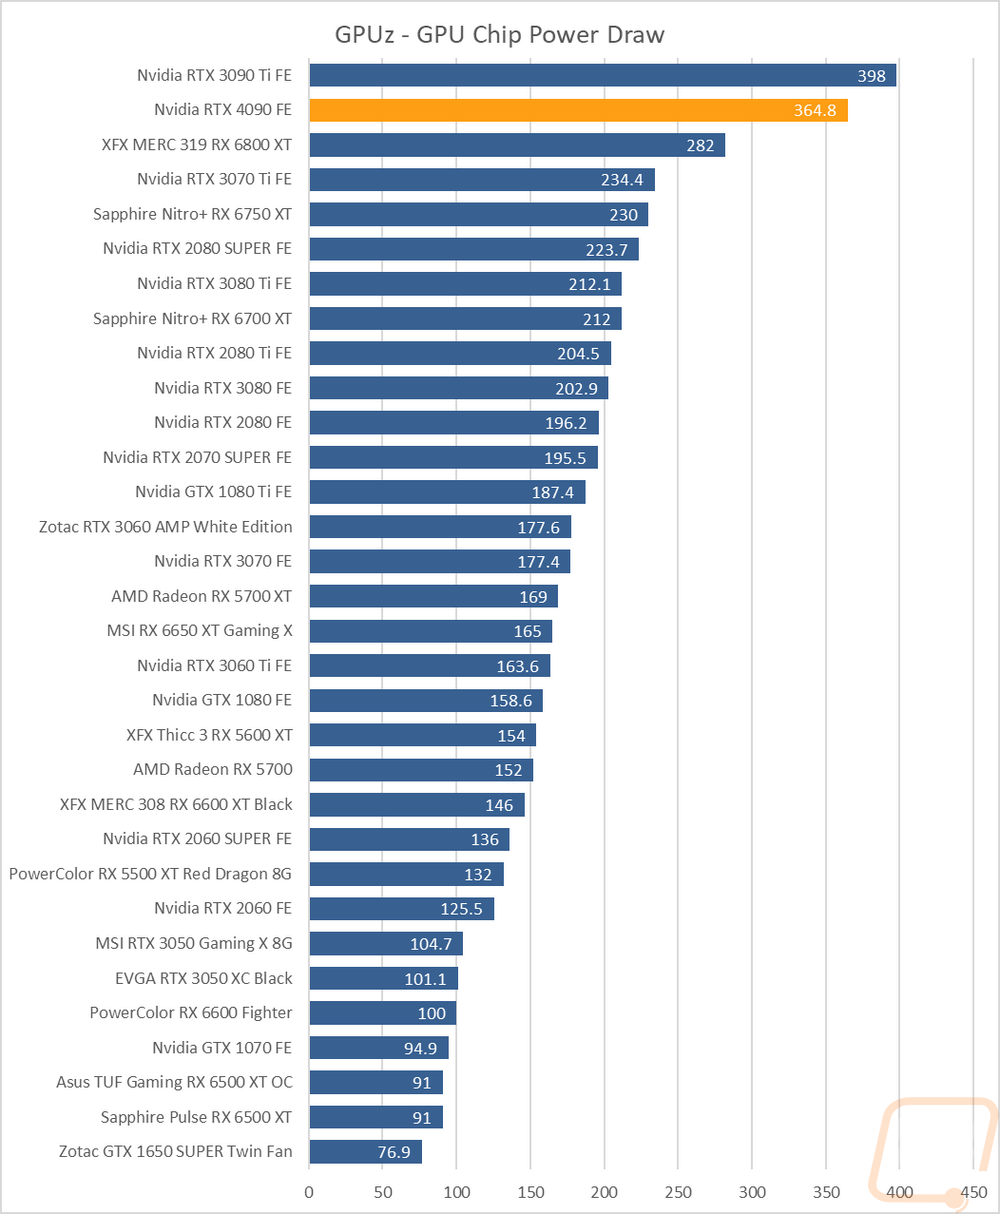
At the same time with Time Spy I also use GPUz to check out the onboard reading for GPU power draw at the chip and in that test, the RTX 4090 was out ahead of most of the other cards by a big margin, the exception to that was the RTX 3090 Ti which pulled 33 more watts at peak than the 4090. While not in the graph the RTX 4090 FE pulled 421.2 for total board power and the RTX 3080 Ti FE was once again out ahead of that by 30 watts at 451.8 watts.
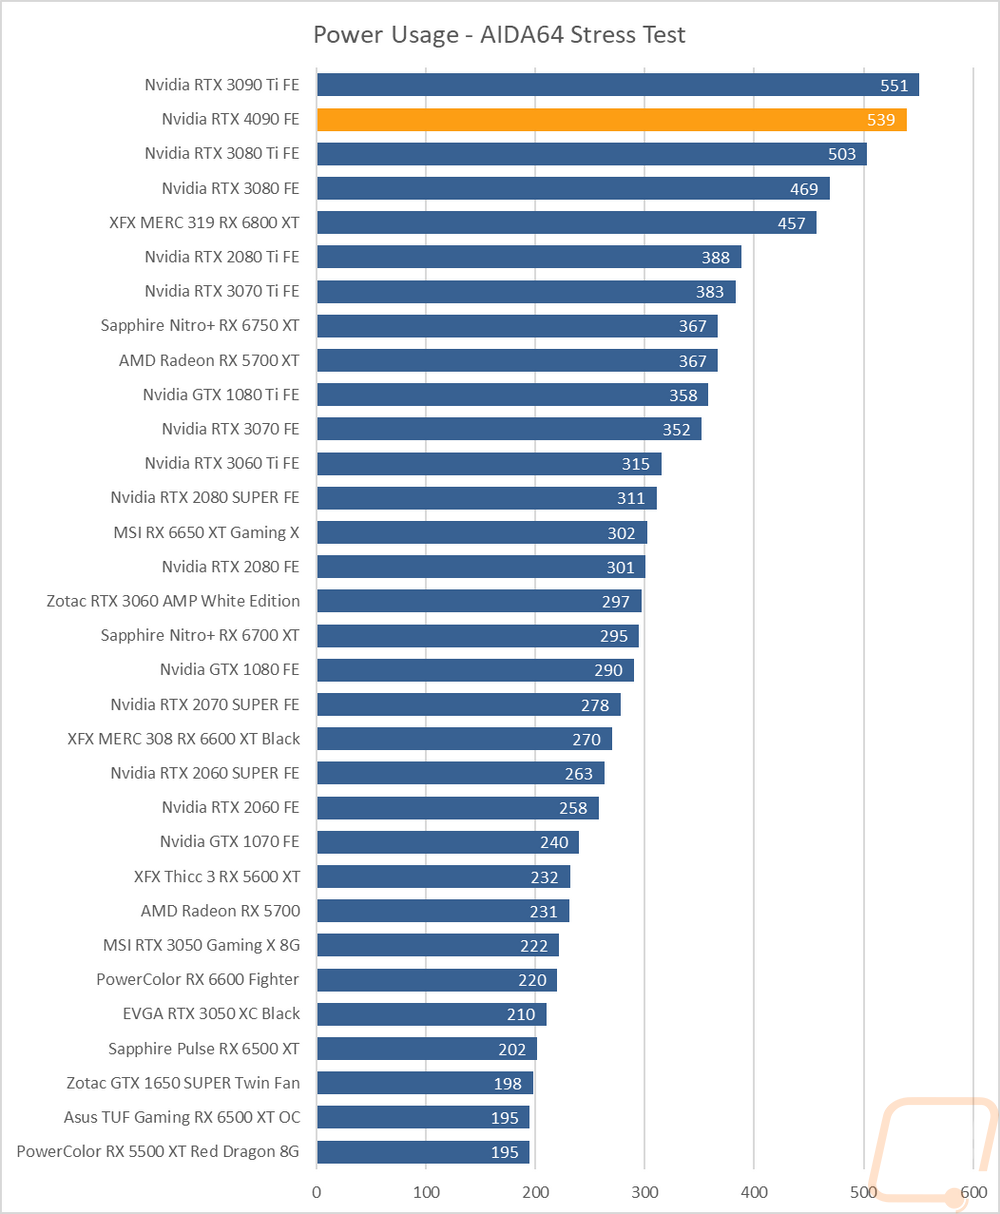
For the last power test, I ran AIDA64’s stress test on the video card to load up only the GPU and using the Kill-A-Watt on the test bench, this time the RTX 4090 Founders Edition and test bench pulled 539 watts at peak. This was higher than the RTX 3080 Ti which was 503 watts but the last generation RTX 3090 Ti FE was once again ahead of the RTX 4090 with it pulling 551 watts at peak.
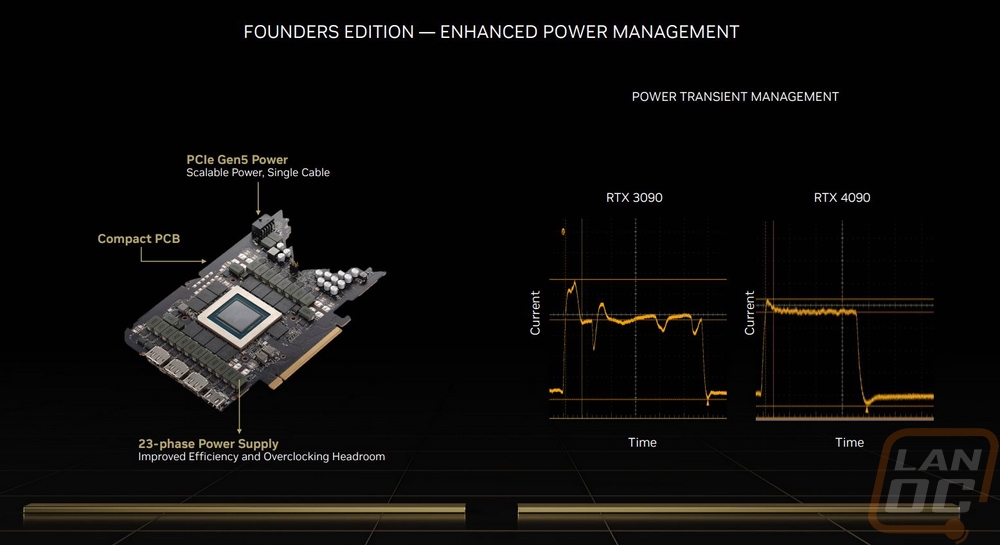
The talk about power usage leading up to this launch has become a bit of a meme, especially with the power usage of some of the aftermarket cards leaking which we don’t have here at all for testing. But I did want to talk a little more about my experience with the power usage of the RTX 4090 FE specifically because I ended up in my testing in a situation that made things painfully obvious which cards were pulling more or less power. For my testing, I have my test bench and my main computer both hooked up to the same 1500VA/1000 Watt Sinewave UPS. That 1000-watt limitation hasn’t been an issue until the RTX 3080 Ti came out where I found out that with four monitors in total and both systems hooked up I could push past that wattage when benchmarking if my PC had anything that used its GPU open like twitch or Youtube. When testing and retesting the RTX 4090, RTX 3090 Ti, and RTX 3080 Ti these are the three cards that I managed to overload the UPS. Interestingly enough though with the RTX 4090, I only managed to do this when testing World War Z Aftermath whereas with the RTX 3080 Ti and especially the RTX 3090 Ti almost all of the tests would do it if I wasn’t careful. Turning off extra monitors took care of the issue, but it was interesting to me that those same cards were only a few watts apart in our 3DMark load test and the 3080 Ti was lower than the RTX 4090 even in the AIDA64 test. But Nvidia’s Ada Lovelace presentations did mention power management on the RTX 4090 Founders Edition card and I think this explains the issue. With the FE card, they have worked on power management and while the RTX 4090 pulls a lot of current they have leveled out a lot of the peak current draw as shown in the graphs below. I now have an Nvidia PCAT for power testing and I ran out of time to be able to dive into testing with that, but what I think we are seeing is the peak power pushing the 3080 Ti and 3090 Ti to pull more but I would bet that the RTX 4090 would average a little higher over an extended period of time. All of that said, considering how impressive the overall performance of the RTX 4090 has been, I think it is crazy that it is even close to the RTX 3090 Ti in power draw.
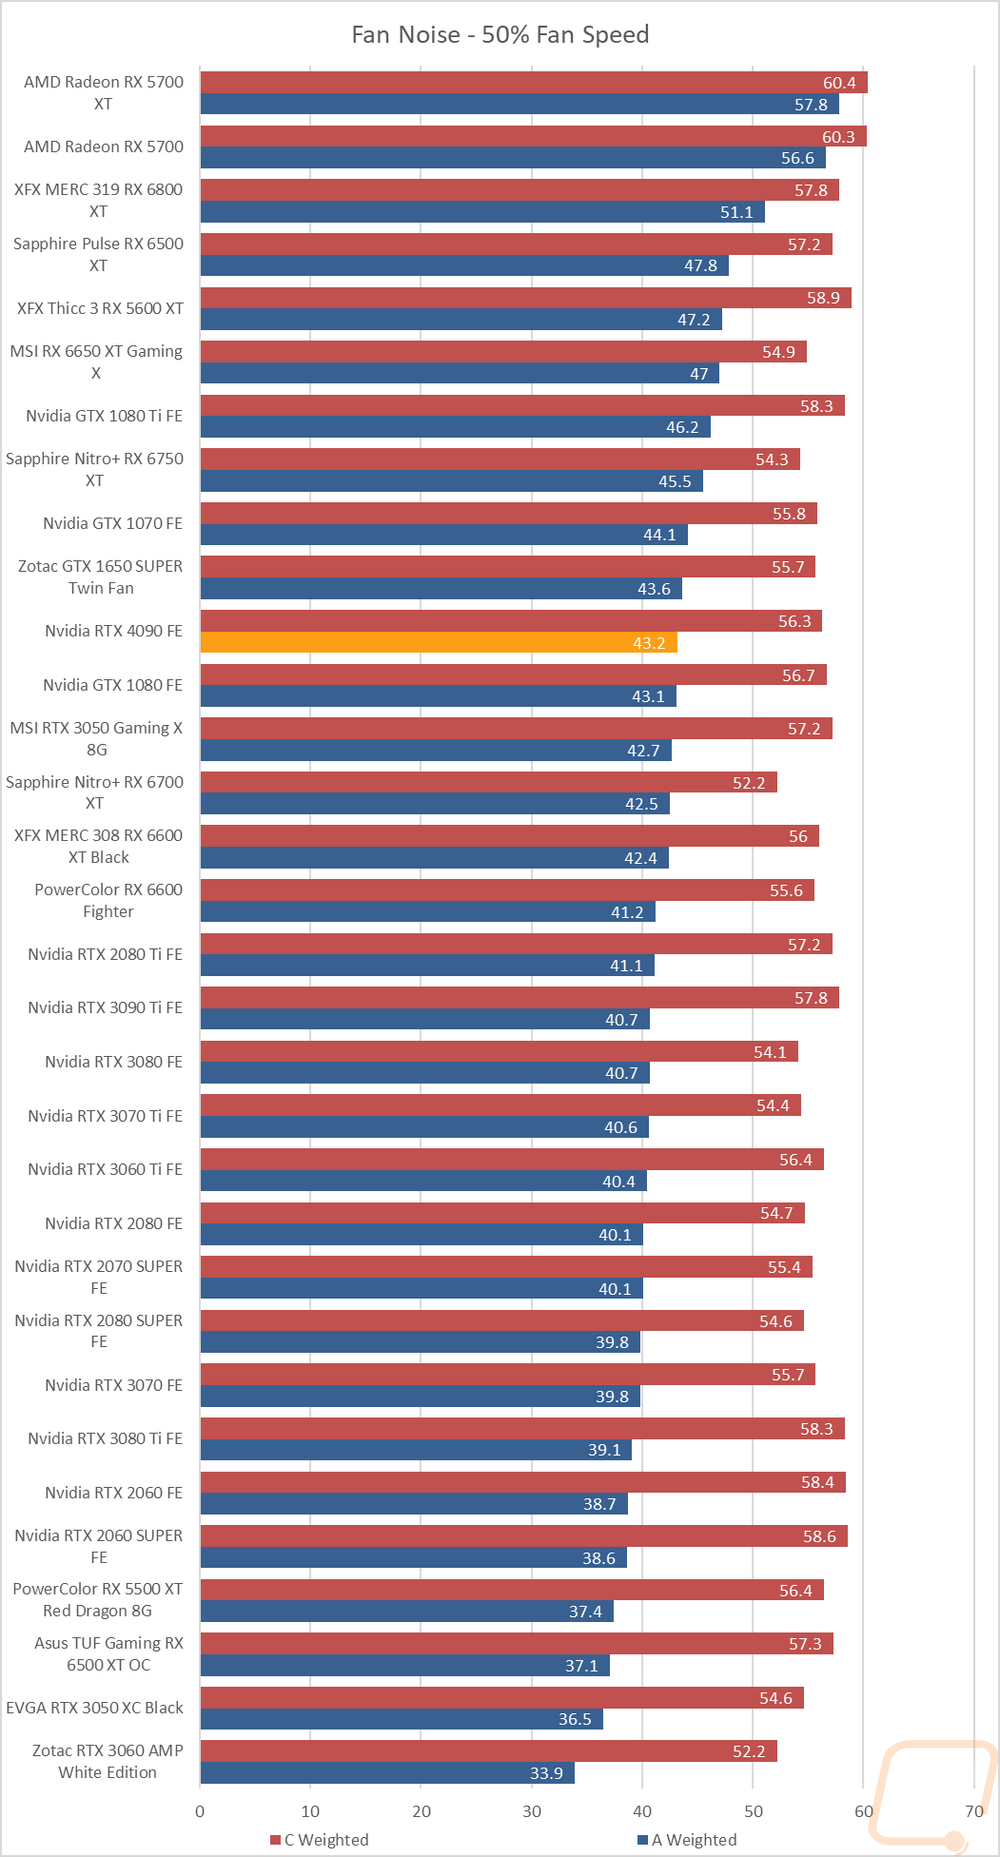
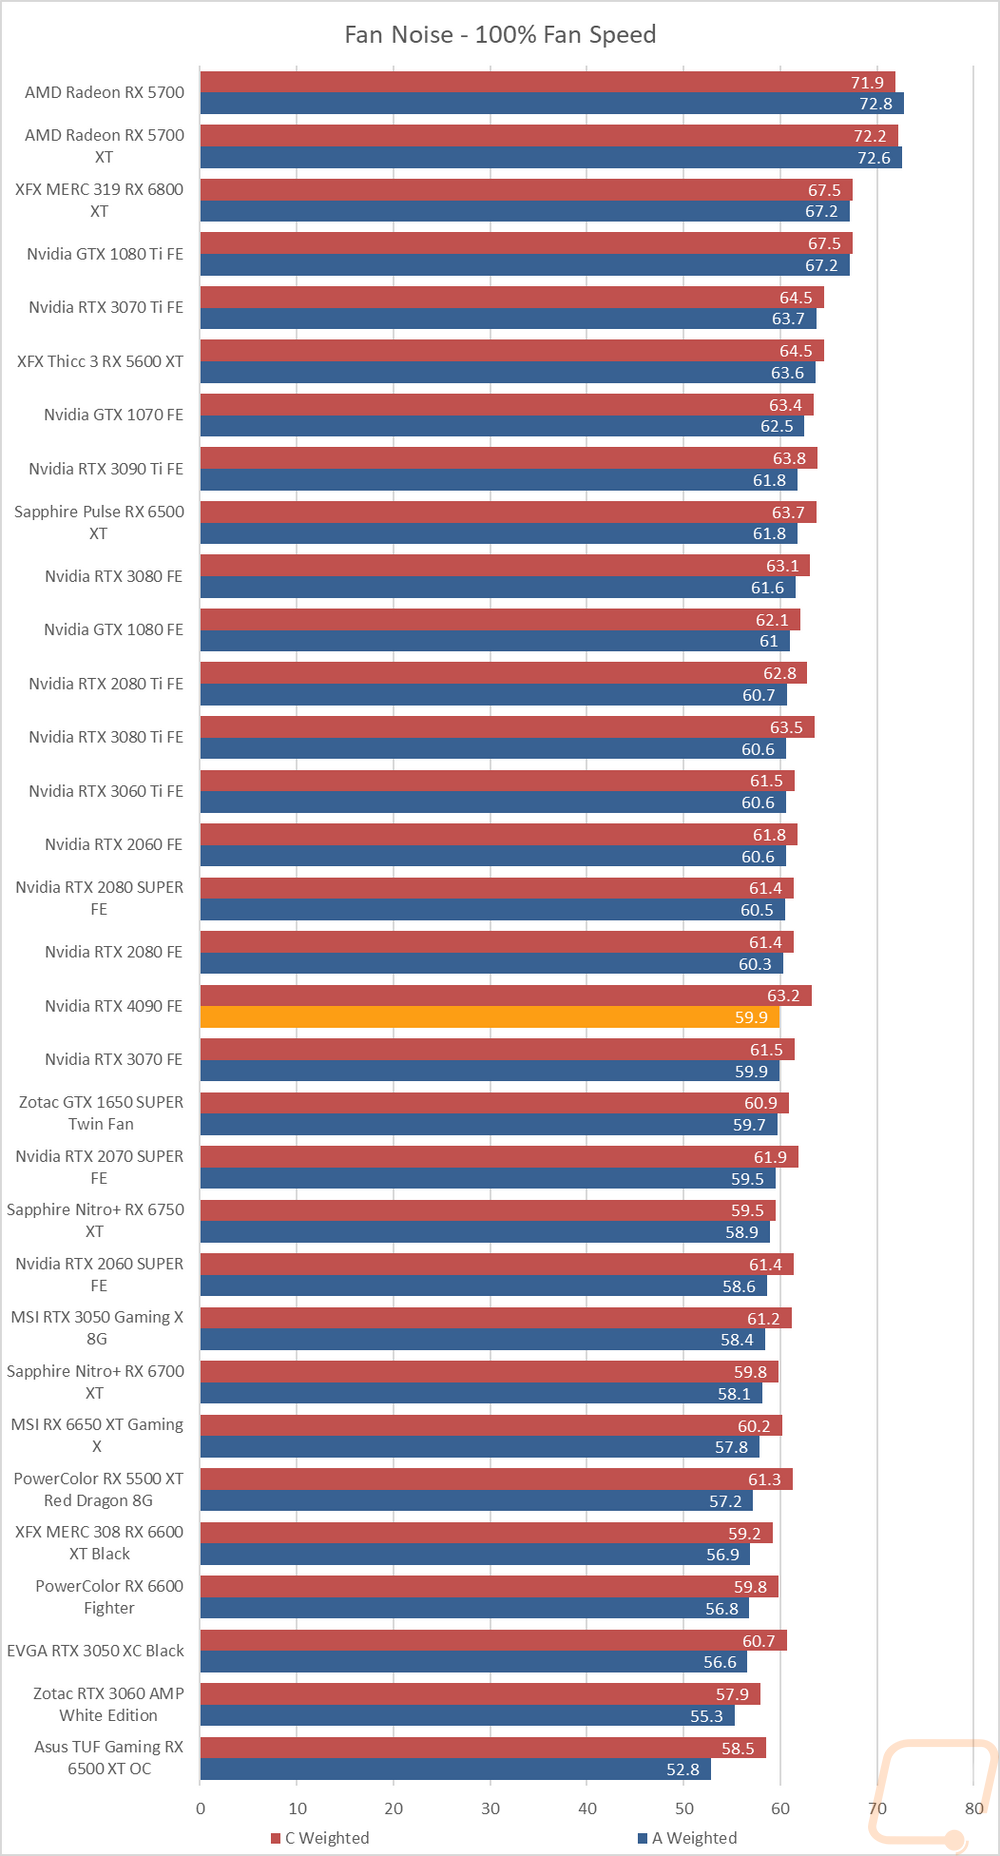
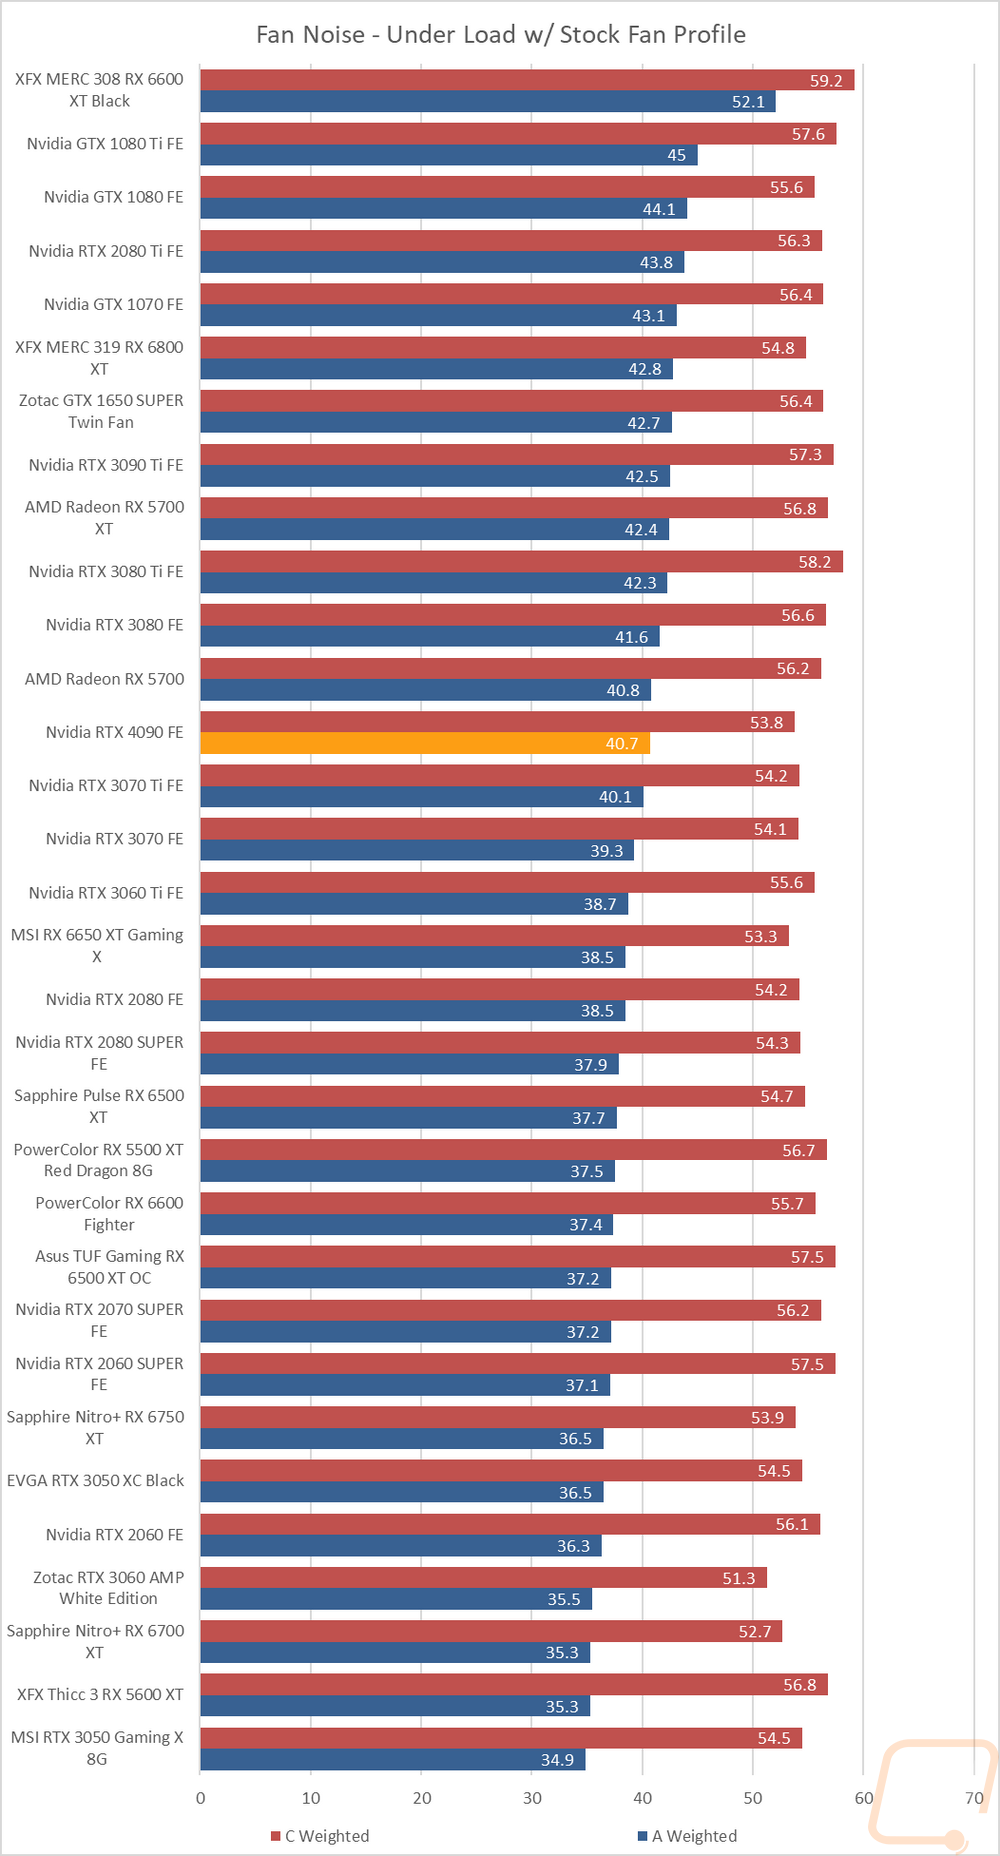
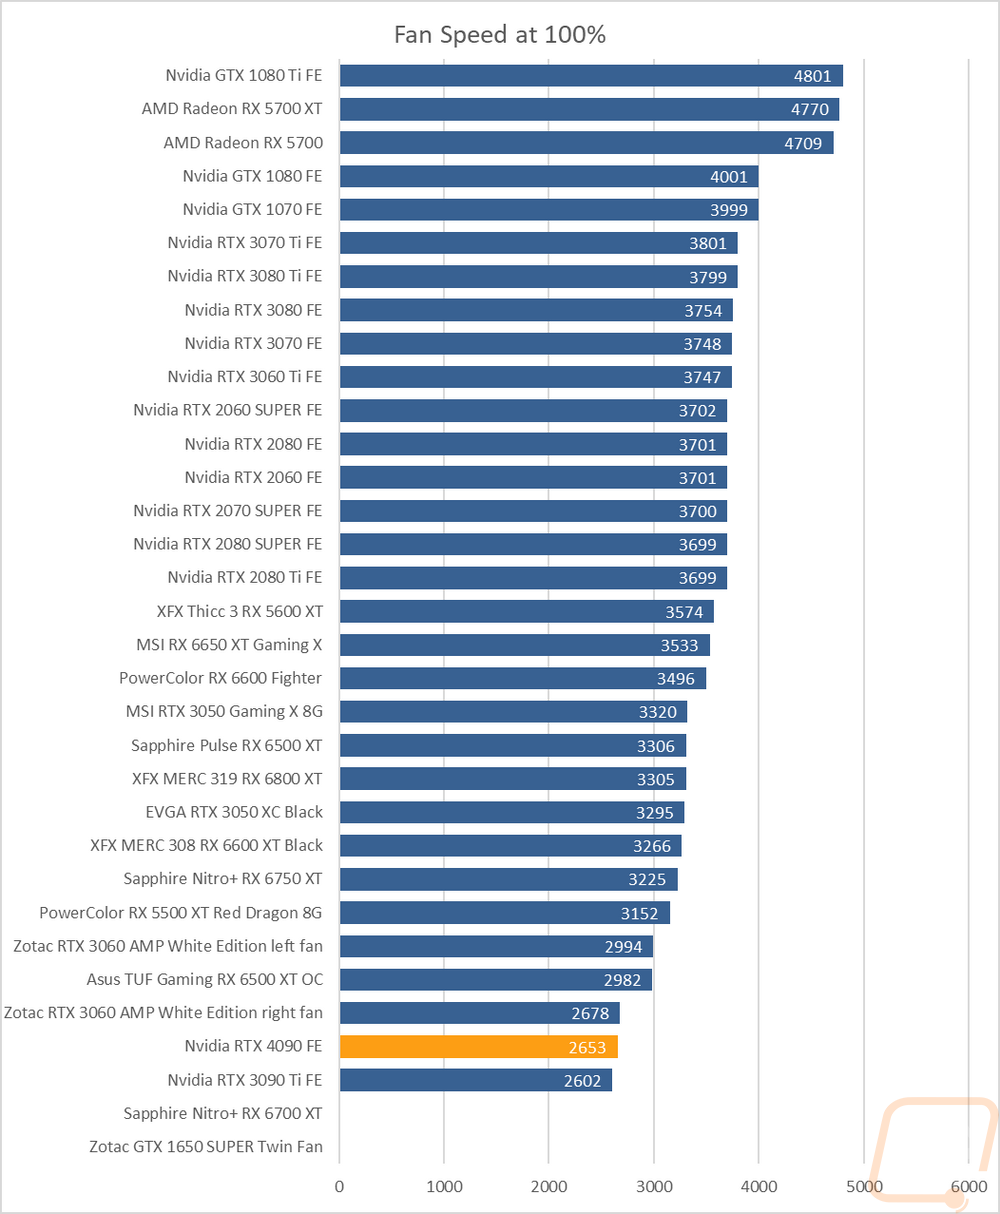
My next round of tests were looking at noise levels. These are especially important to me because I can’t stand to listen to my PC whirling. Especially when I’m not in game and other applications are using the GPU. For my testing, though I first tested with the fan cranked up to 100% to get an idea of how loud it can get, then again at 50% to get an idea of its range. I test using both A and C weighting, A is the standard way and C has a little more of the low end to check for low-level hums. The RTX 4090 Founders Edition fell in the middle of the pack in both the 50% and 100% fan speed tests with it being higher up in the 50% and lower middle in the 100%. The fan RPM graph at the end shows a little why that is the case as the 4090 FE has its two large fans spinning the slowest of any of the cards tested. That said given the total RPM it was noisier than it should have been. I also take a look at noise performance while under load. For that when running AIDA64’s stress test I wait until the temperature of the card has leveled off and then measure how loud things are when the card is at its worst-case scenario with the stock fan profile. Here the RTX 4090 Founders Edition did well for a high-end founders edition card with cards like the 3080 FE and 3080 Ti FE being 1-2 dB louder in the same situation.
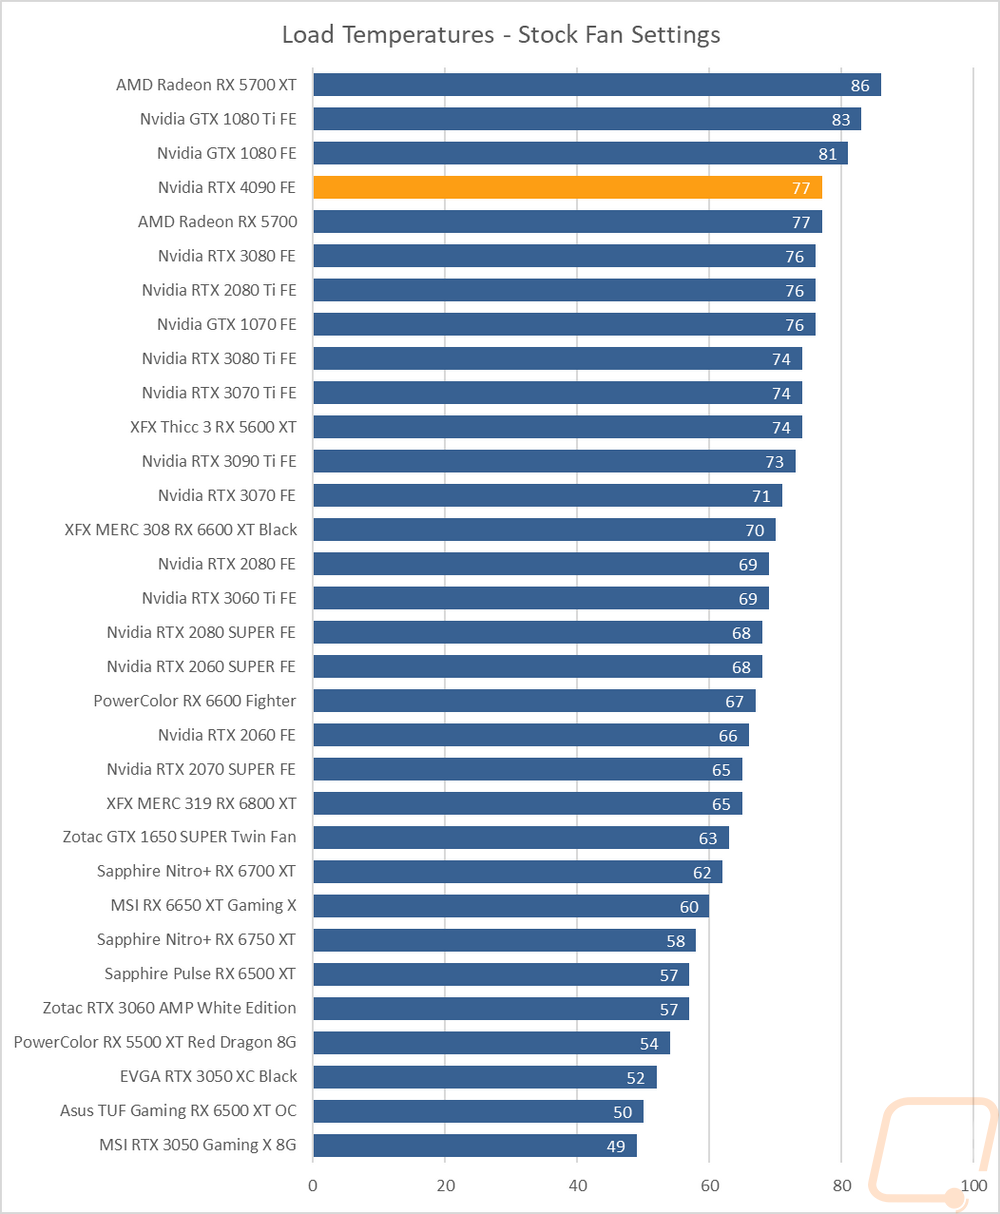
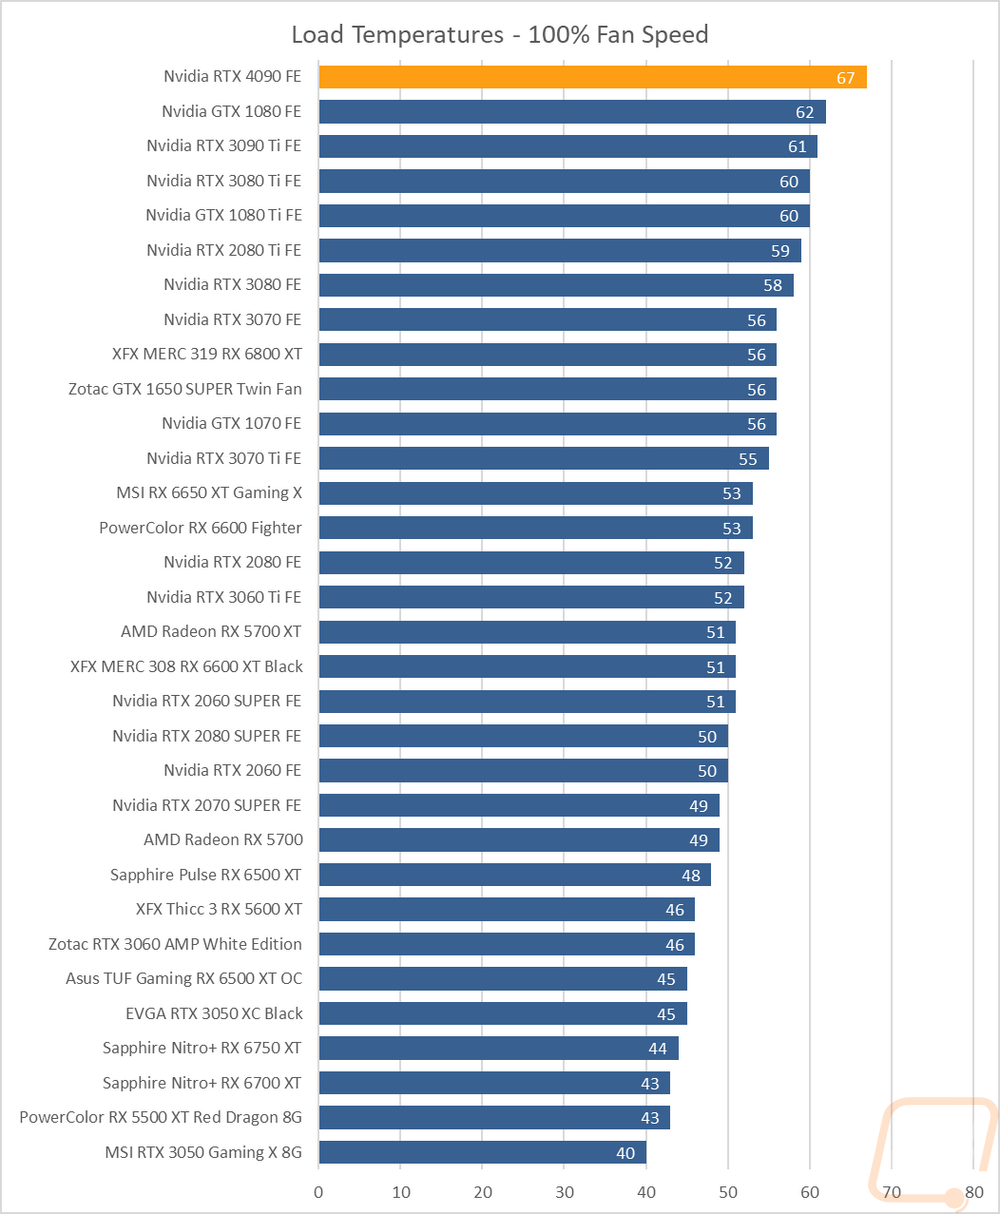
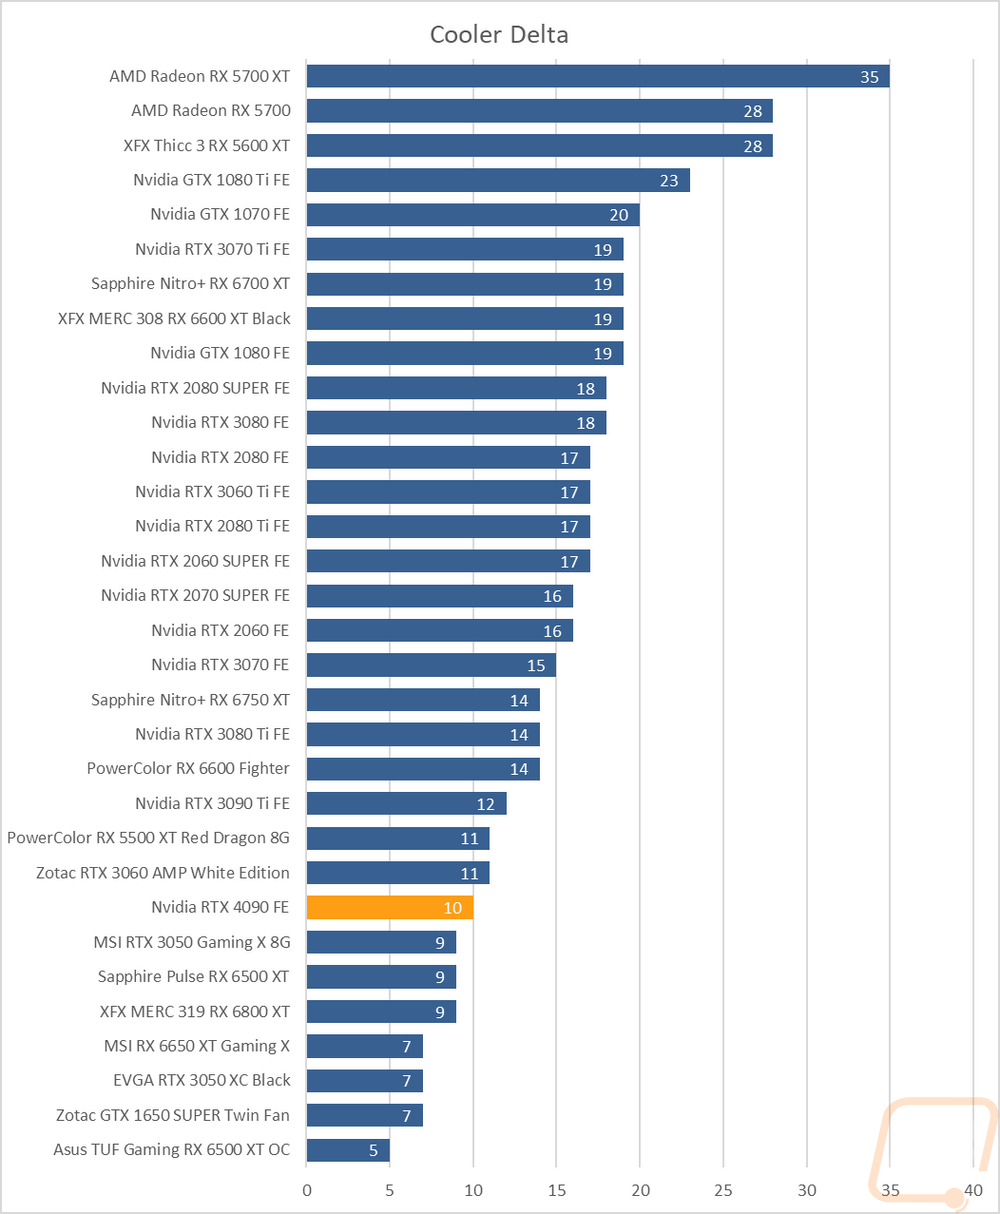
To finish up my testing I of course had to check out the cooling performance. To do this I ran two different tests. I used AIDA64’s Stress Test run for a half-hour each to warm things up. Then I documented what temperature the GPU leveled out at with the stock fan profile and then again with the fans cranked up to 100%. With the stock profile, the Nvidia RTX 4090 Founders Edition did better than I expected it to do given its power levels. I leveled off at 77c which is up in the top ¼ of our charts but is lower than cards like the GTX 1080 and 1080Ti did and just one degree above the RTX 3080. Then with the fans cranked up, the RTX 4090 Founders Edition cooled down but not nearly as much as any of the other cards I’ve tested in the past with it running 67c at full fan speed on both fans. This shows that while the cooler did great with the stock profile, there isn’t too much headroom left in it. I would say that Nvidia’s fan profile is spot on to offer good cooling while keeping the noise down relatively. Of course, if they ran the fans at similar speeds to past Founders Edition cards there would be more headroom left. The RTX 3090 Ti which is a similarly sized card was running cooler at 73c under load and 61c at 100% fan speed which means it had a little more headroom at 12c. While not on our charts I did also note the other temperatures as well with the GPU hotspot at 85c with the stock fan profile and 75c at 100% fan speed and the GPU memory at 66c with the stock fan profile and 54c with the fans cranked up.
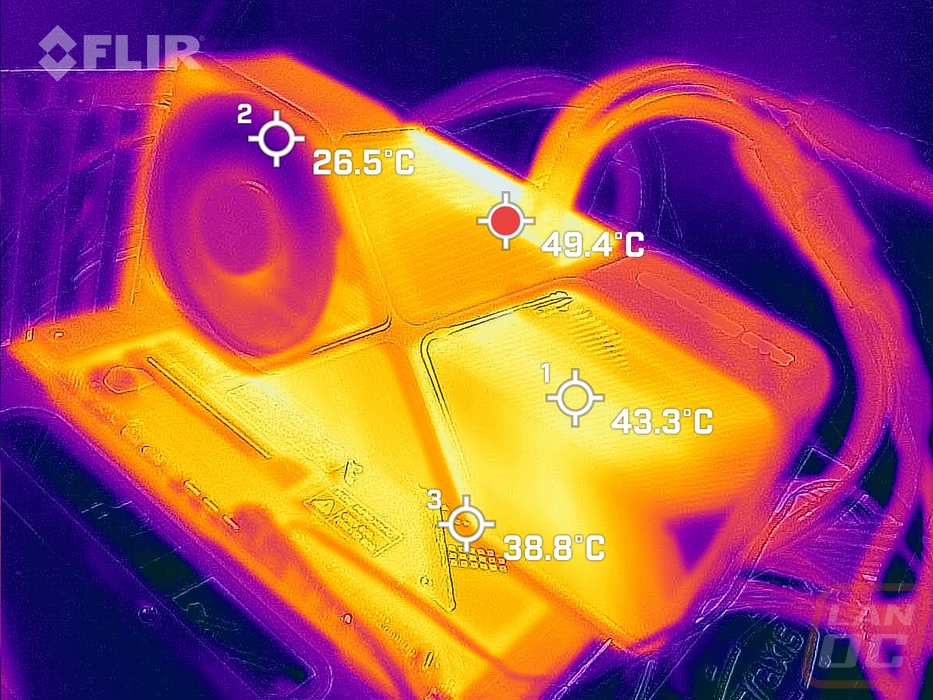
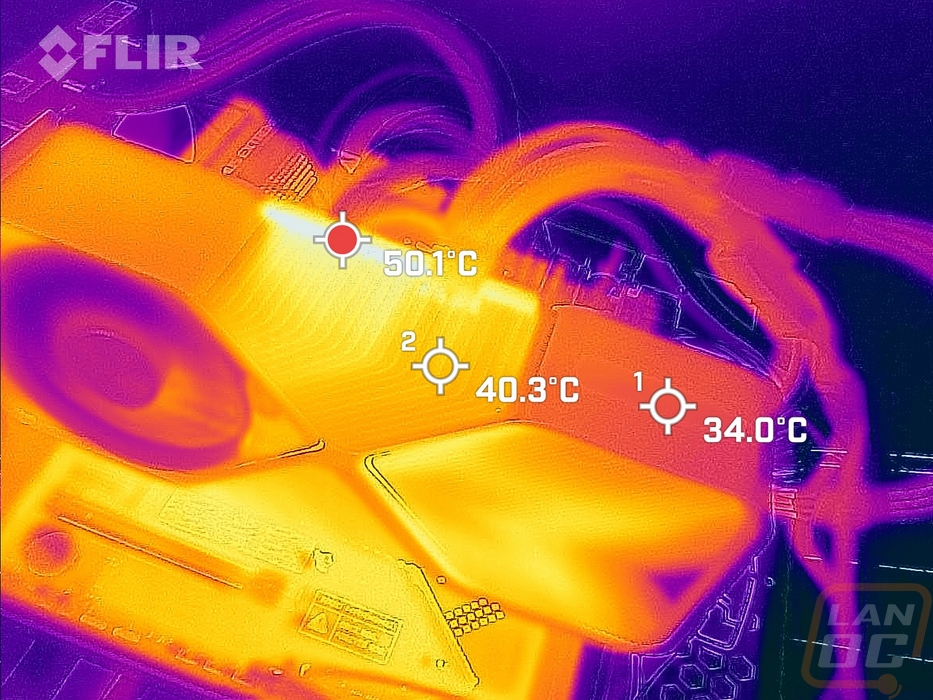
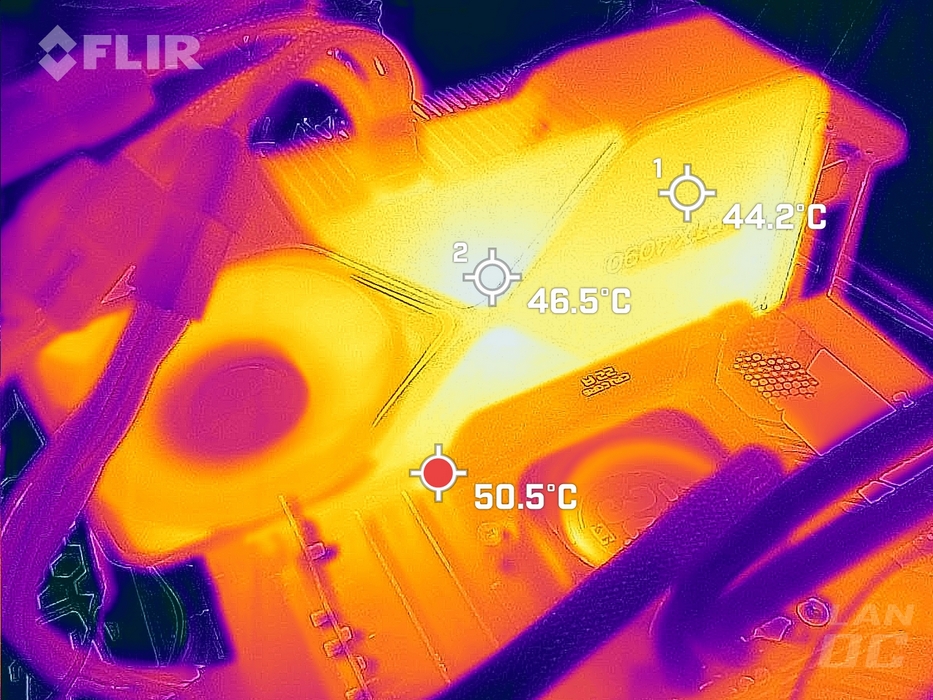
While running the stock fan profile testing I also took the time to get a few thermal images so we could see what is going on. The front side of the RTX 4090 Founders Edition has its hottest point at the top middle but the blow-through area is also warm which means that the heatpipes are doing a good job of pulling the heat out that direction. There is a small glimpse of some extra heat under the card and given its 3-slot design that wouldn’t be a big surprise but the design isn’t blowing too much down that direction to add to it so having your M.2 under the 4090 should be okay if your motherboard has a heatsink for it. The top view is the one area where we can get close to the PCB and that is the hottest area on the card. The center heatsink is getting more heat than the infinity loops on each side. Then at the back, the hottest area is off of the card on the motherboard just under the card but the center section and near the bottom of the front are the two hottest spots on the backplate.