Performance
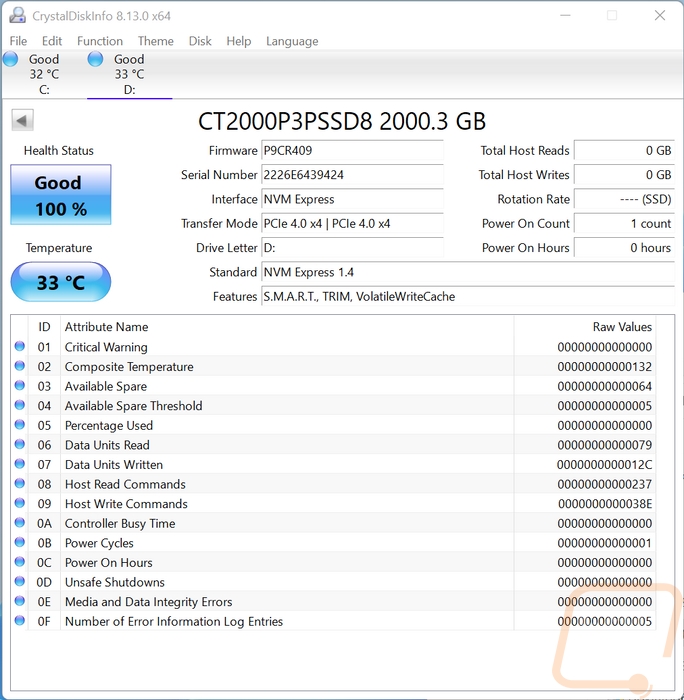
Before getting into testing the Crucial P3 Plus I did check the drive out using CrystalDiskInfo just to confirm that it was connected using the correct interface. The drive runs on PCIe 4.0 and needs 4 lanes to get the best possible performance and we were connected and running at that. I also like to do this to document the firmware revision we are running on for testing because those do change from time to time which we are on P9CR409.
My first round of testing was to run the Crucial P3 Plus through Crystal Disk Mark 8. Sequential testing is usually a best-case scenario and is what companies use for their specifications and on the front of the box to advertise drive speeds which in the case of the Crucial P3 Plus the box didn’t have the drive speed listed but the specifications do and those say the P3 Plus should see up to 5000 MB/s for its reads and 4200 MB/s for its writes. Below I have the drives labeled in orange if they are PCIe 4.0 and blue for older 3.0 drives for reference. The P3 Plus beat its listed read speed at 5041 MB/s which is good and puts this drive as a mid-range 4.0 drive as expected. For the write speeds, it did 4388 MB/s which was way ahead of the listed 4200 MB/s.
|
PCIe 3.0 |
PCIe 4.0 |
|||
|
Crystal Disk Mark 8 - Read |
SEQ1M Q8T1 |
SEQ128K Q32T1 |
RND4K Q32T16 |
RND4K Q1T1 |
|
WD Blue SN550 1TB |
2444.53 |
2077.36 |
1075.88 |
57.88 |
|
Sabrent Rocket Q4 2TB |
4939.59 |
2871.47 |
1034.52 |
74.53 |
|
Corsair MP400 1TB |
3432.77 |
1889.56 |
713.28 |
61.42 |
|
Corsair Force MP600 2TB |
4828 |
1543.31 |
901.83 |
41.49 |
|
Sabrent Rocket 4.0 Plus 1TB |
6468.33 |
2712.53 |
455.24 |
54.68 |
|
Crucial P5 Plus 1TB |
6697.19 |
4358.63 |
1113.7 |
69.76 |
|
Kingston FURY Renegade 2TB |
6592.75 |
3093.11 |
1085.23 |
55.14 |
|
Patriot P400 1TB |
5036.9 |
3518.47 |
1059.71 |
88.06 |
|
WD Blue SN570 1TB |
3569.34 |
2681.32 |
1046.46 |
65.75 |
|
WD Black SN770 1TB |
5223.32 |
4958.17 |
1034.35 |
82.24 |
|
MSI Spatium M480 Play 2TB |
6979.03 |
4267.59 |
1315.25 |
81.22 |
|
Viper Gaming VPR400 |
5163.46 |
3880.75 |
1030.81 |
85.35 |
|
Crucial P3 Plus 2TB |
5041.44 |
2799.96 |
1107.97 |
56.56 |
|
PCIe 3.0 |
PCIe 4.0 |
|||
|
Crystal Disk Mark 8 - Write |
SEQ1M Q8T1 |
SEQ128K Q32T1 |
RND4K Q32T16 |
RND4K Q1T1 |
|
WD Blue SN550 1TB |
2007.63 |
2006.4 |
776.4 |
290.25 |
|
Sabrent Rocket Q4 2TB |
3633.71 |
2568.7 |
920.84 |
385.73 |
|
Corsair MP400 1TB |
2021.09 |
2017.63 |
1196.42 |
262.36 |
|
Corsair Force MP600 2TB |
992.38 |
982.78 |
996.22 |
276.26 |
|
Sabrent Rocket 4.0 Plus 1TB |
5241.89 |
5225.25 |
921.51 |
402.26 |
|
Crucial P5 Plus 1TB |
5025.83 |
4880.38 |
884.12 |
240.78 |
|
Kingston FURY Renegade 2TB |
6899.76 |
5831.06 |
1083.12 |
367.6 |
|
Patriot P400 1TB |
4830.94 |
4813.27 |
846.34 |
307.12 |
|
WD Blue SN570 1TB |
3147.13 |
2893.72 |
909.47 |
234.17 |
|
WD Black SN770 1TB |
4983.07 |
4980.59 |
1149.36 |
295.13 |
|
MSI Spatium M480 Play 2TB |
6870.73 |
5863.14 |
1062.32 |
357.02 |
|
Viper Gaming VPR400 |
4780.82 |
4775.74 |
838 |
285.02 |
|
Crucial P3 Plus 2TB |
4388.26 |
4387.54 |
989.42 |
2967.35 |
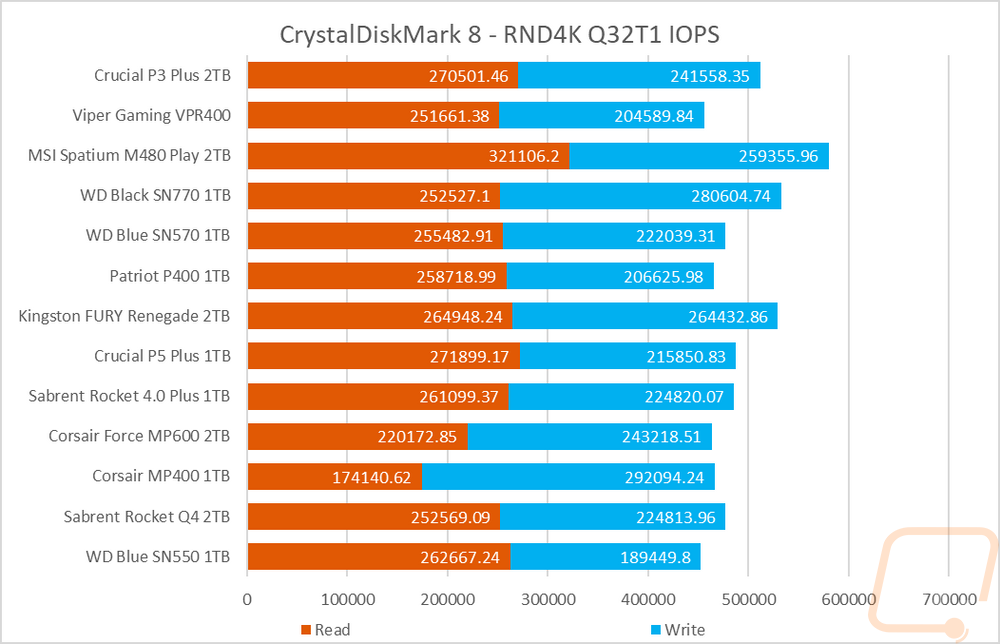
While testing in CrystalDiskMark 8 I did also check out the drive’s IOPS performance with the random 4k queue depth of 32 and 1 thread results. I stacked the read and write performance together here because I do believe that the overall drive performance is important, not just one result or the other. The P3 Plus did surprisingly well here with its read IOPS right with the P5 Plus and only behind the M480 Play and its write IOPS were even better way out ahead of the P5 Plus with just four drives total faster. When combined there were just three drives faster, the M480 Play, the SN770, and the FURY Renegade.
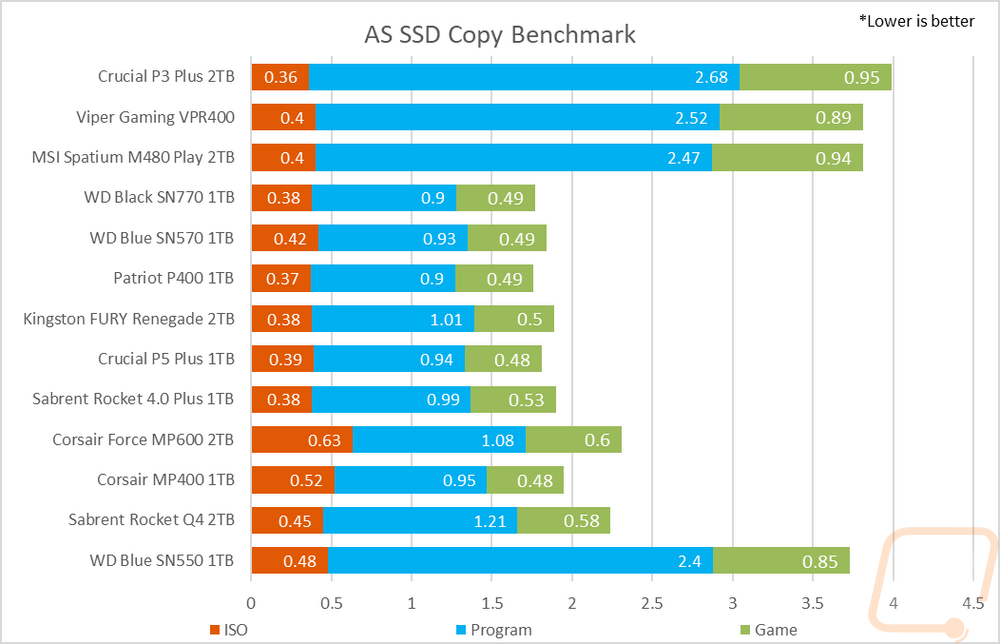
In AS SSD I skipped over the standard test because it is very similar to the CrystalDiskMark tests I prefer to check out one of its sub-tests, the copy benchmark. This moves three files, one that is an ISO, one that is a program, and then a game and times how long each takes. With these being timed, lower is better here. I have all three results stacked to see which drives are best overall. The P3 Plus struggled on these tests well the Program and Game files at least which all combined put the P3 Plus at the back of the chart.
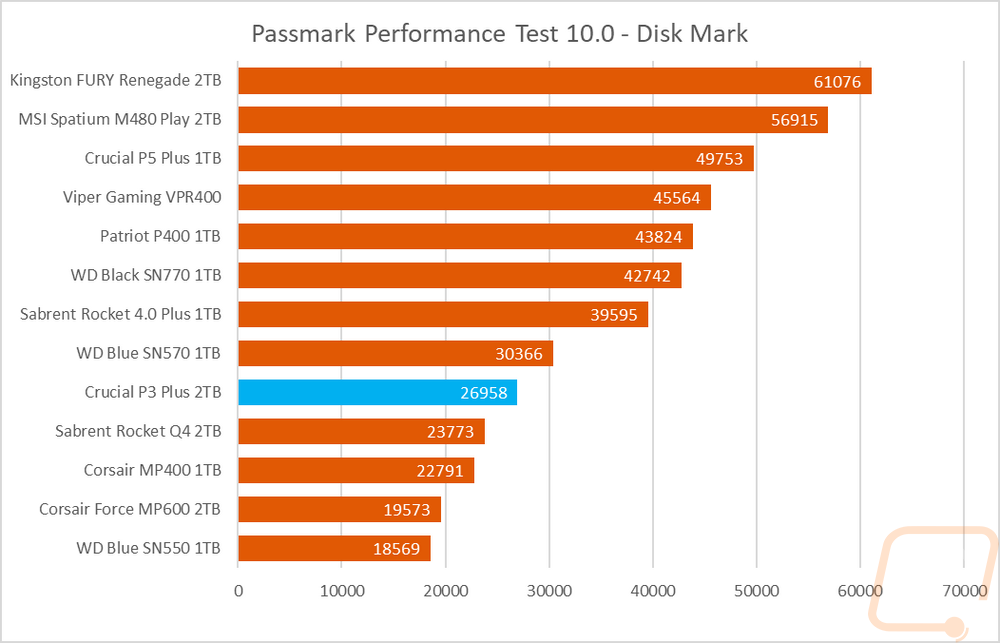
Next up with PassMark Performance Test 10 I ran their combined synthetic benchmark to get a look at their DiskMark rating. The P3 Plus didn’t do so well with it sitting down in the middle of some of the PCIe 3.0 drives here.
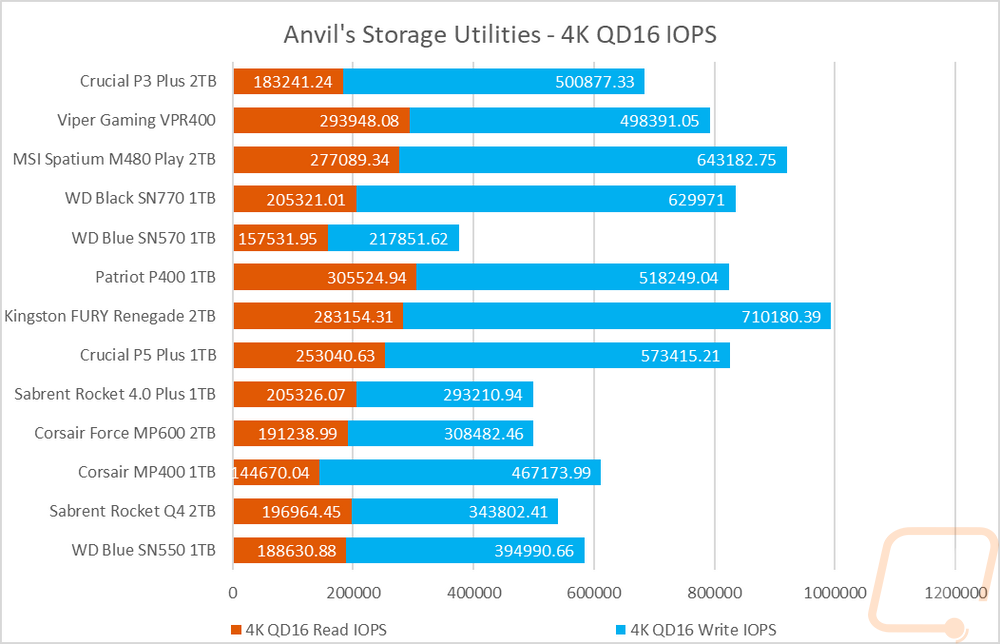
I then changed my focus back over to IOPS performance and ran the Viper Gaming VPR400 in Anvil’s Storage Benchmark focusing on the 4k queue depth of 16 results from the main test. The read IOPS here were middle of the pack but the P3 plus did well with its write IOPS. Overall this put it in the middle of the pack behind all of the flagship drives.
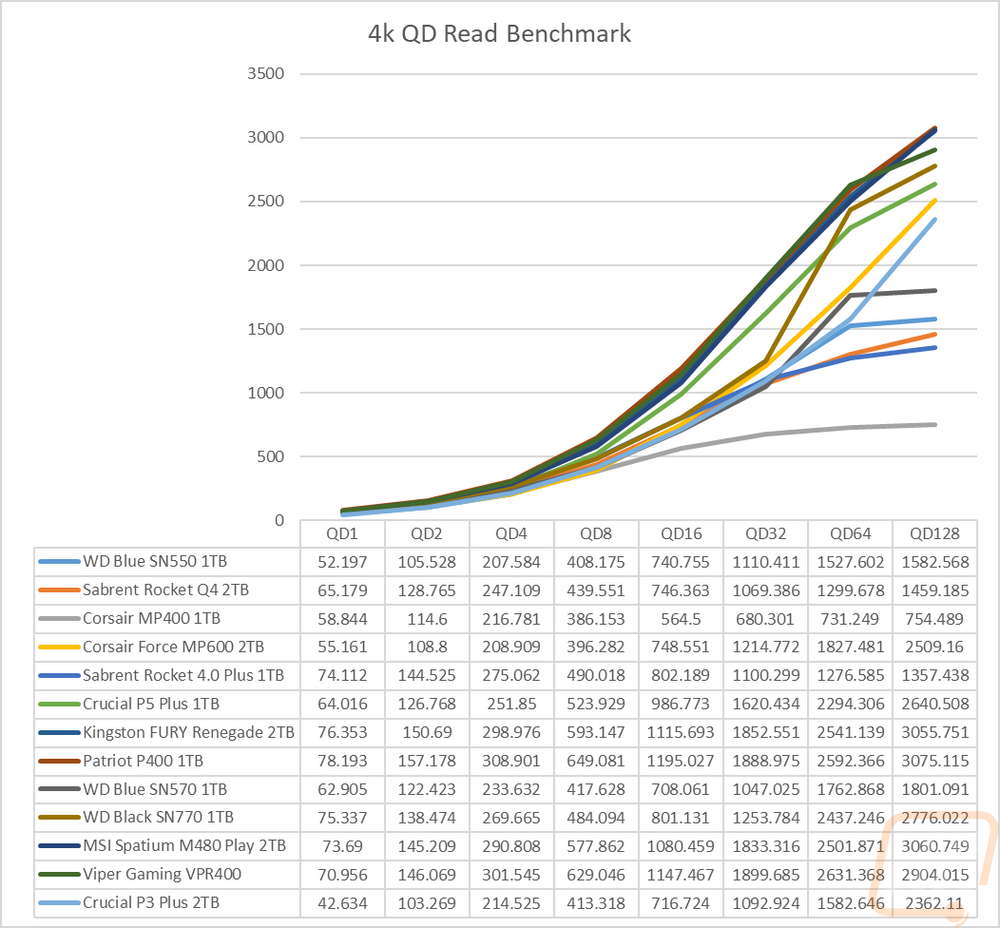
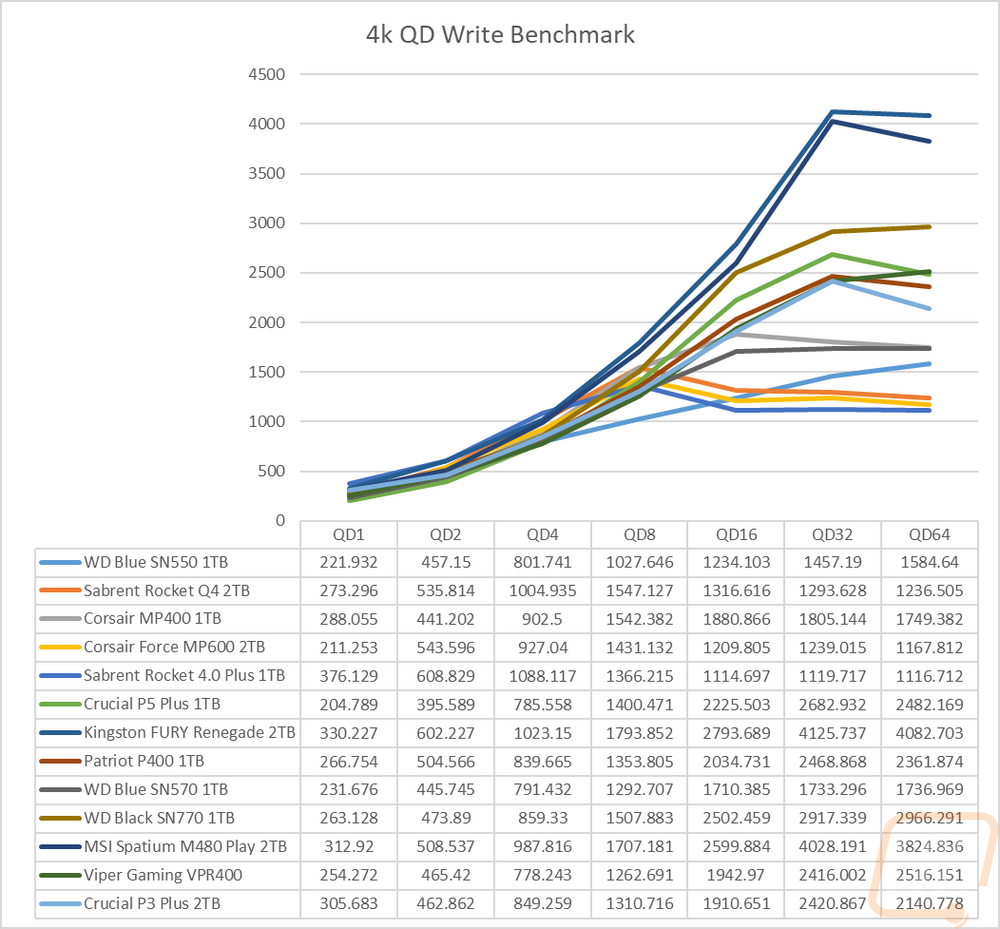
Sticking with Anvil’s Storage Utilities I did a few more tests. Here I wanted to check out how the drive would react to different queue depths so with the file size set to 4K I ran tests ramping up double each time starting at 1 and up to 128 for reads and 64 for writes. This lets us see if the controller gets overloaded. For the read, queue depth tests the P3 Plus was the slowest drive tested with a queue depth of 1 and stayed near the bottom of the drives until it got up to a queue depth of 32 where it started to catch up, and on the last 128 QD test, it jumped way up sitting behind all of the flagship drives but still doing well. For the write tests, it did better earlier on sitting in the middle of the pack and staying there through all of the tests. It continued to climb up until the queue depth of 64 test where it dropped in performance by 300 MB/s compared to the 32 QD test.
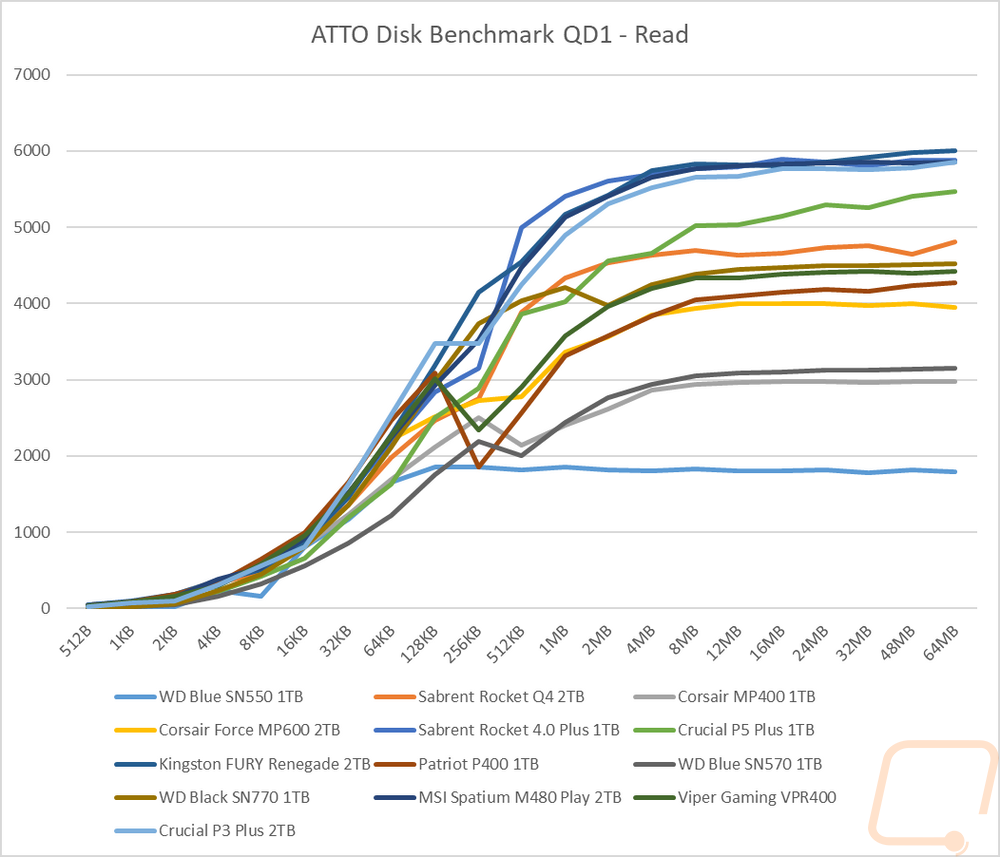
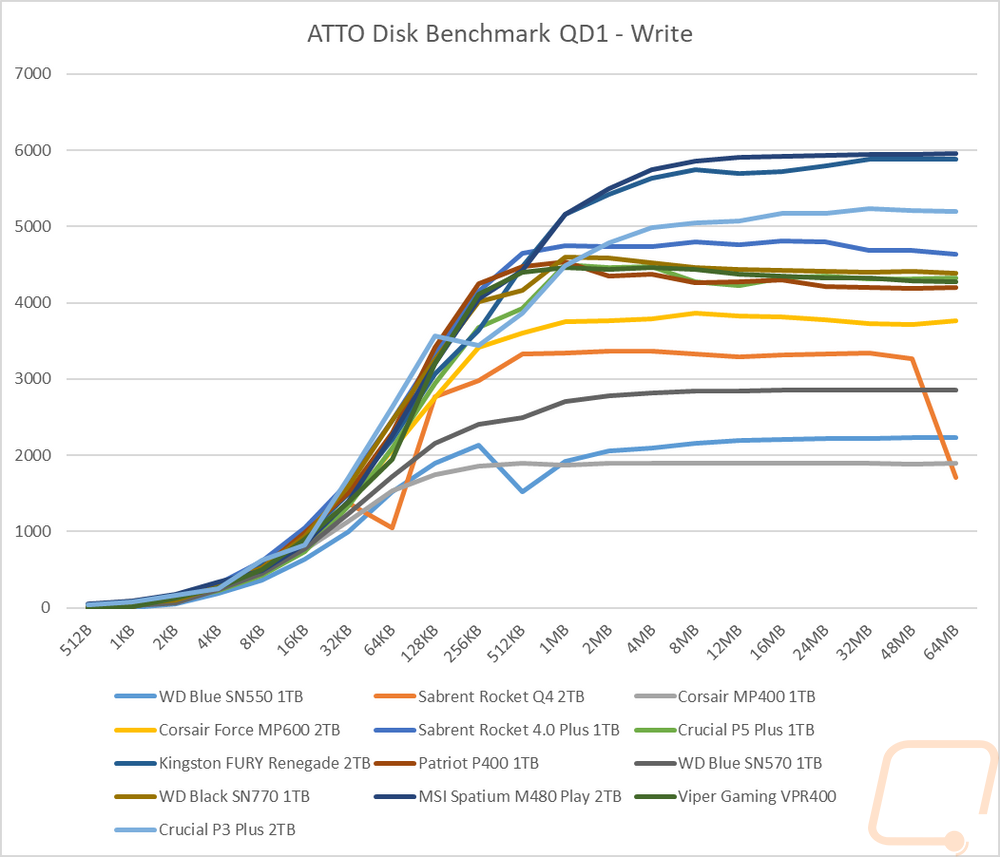
For ATTO Benchmark I set it to a queue depth of just 1 but ramped up the file size slowly to see how it would affect performance. For the read test in ATTO, the P3 Plus stayed right in the middle up until 16KB file sizes where it jumped up in performance and was even the fastest drive tested for a little while before stalling at 128KB. It continued to ramp up after that but was behind the top three drives from there on out. Interestingly enough it was faster than the P5 Plus in this test.
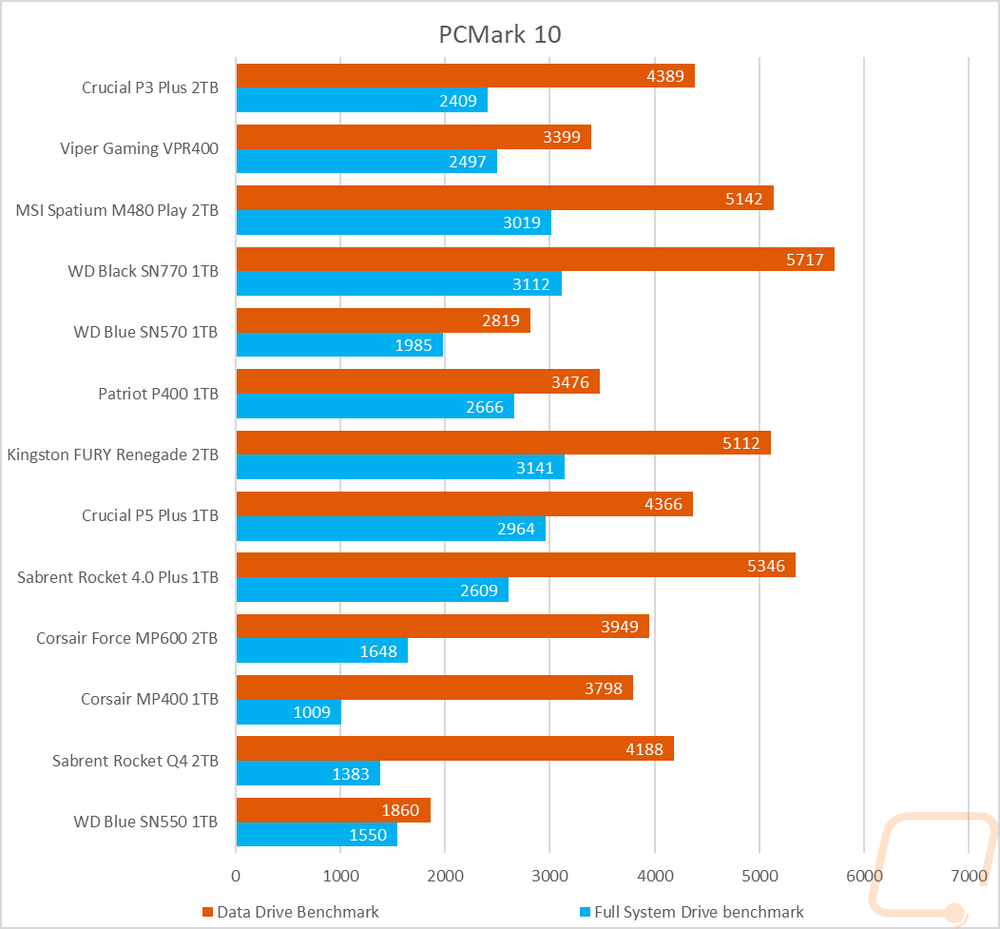
Next up I wanted to look at more real-world performance and for this, I started with PCMark 10 which has an overall full system benchmark for storage and then one focused on data storage drives. In the full system drive benchmark, the Crucial P3 Plus matched the P5 Plus on the data drive benchmark which put it up behind a few of the flagship drives. But for the full system drive benchmark, it was in the middle of the pack.
Next, up for more real-world resting, I did our file transfer tests. You don’t get any more real-world than this. For each drive, I copied the folder filled with files to the drive tested and then back to the Rocket Q4 in our test bench. I used three file types, movies which are large single files, a folder filled with RAW and JPG photos, and then a folder filled with word documents. Starting with the movie files the Crucial P3 Plus did well with just four drives being faster and it did even better when sending the files back to the PC but was far from the performance of some of the top drives there including the P5 Plus. The photo files are more likely to be what you see day to day in file size and the P3 Plus wrote the files to itself at 1080 MB/s and sent them back faster at 1430 MB/s. The write speed was in the top four but impressively the read here was the fastest tested. Then last up I tested using word documents which are always a struggle due to their small file sizes. The P3 Plus wrote these at 6.92 MB/s and read them at 7.37 MB/s, both of these were impressively fast.
|
Windows 11 File Transfers |
Movies to Drive |
Movies to PC |
Pictures to Drive |
Pictures to PC |
Docs to Drive |
Docs to PC |
|
WD Blue SN550 1TB |
852 |
1360 |
937 |
1001 |
2.42 |
5.32 |
|
Sabrent Rocket Q4 2TB |
2720 |
2060 |
1140 |
1030 |
5.75 |
5.2 |
|
Corsair MP400 1TB |
2140 |
875 |
996 |
1410 |
2.57 |
5.98 |
|
Corsair Force MP600 2TB |
1250 |
1330 |
816 |
1320 |
2.83 |
5.48 |
|
Sabrent Rocket 4.0 Plus 1TB |
2120 |
2960 |
254 |
842 |
1.63 |
5.16 |
|
Crucial P5 Plus 1TB |
2060 |
2720 |
1030 |
1140 |
5.2 |
5.75 |
|
Kingston FURY Renegade 2TB |
2330 |
3220 |
857 |
1270 |
2.58 |
5.88 |
|
Patriot P400 1TB |
2070 |
2870 |
981 |
944 |
2.86 |
4.62 |
|
WD Blue SN570 1TB |
602 |
325 |
992 |
1310 |
5.14 |
6.05 |
|
WD Black SN770 1TB |
2260 |
2170 |
605 |
1210 |
2.52 |
6.11 |
|
MSI Spatium M480 Play 2TB |
1930 |
494 |
905 |
706 |
5.62 |
3.87 |
|
Viper Gaming VPR400 |
2360 |
1980 |
1300 |
1310 |
2.61 |
7.12 |
|
Crucial P3 Plus 2TB |
2240 |
2430 |
1080 |
1430 |
6.92 |
7.37 |
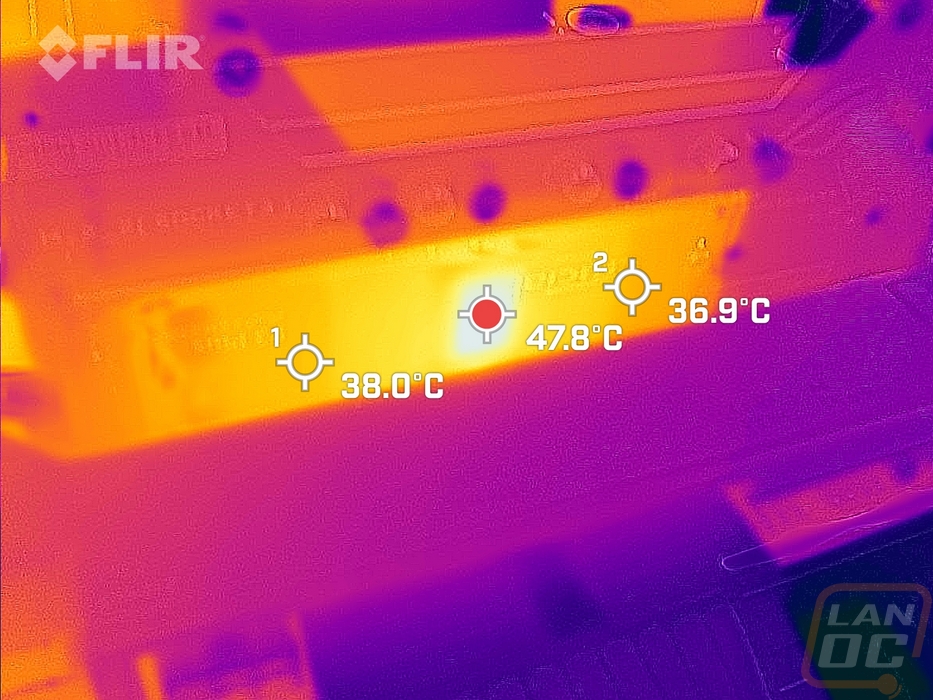
I also ran the P3 Plus using AIDA64’s linear read disk benchmark for 30 minutes to heat things up to see what the thermals for the drive would look like. Not surprisingly the controller was where all of the heat was coming and with it being center mounted it does heat up the NAND on each side of it. But overall the temps weren’t out of line from what you would expect and long file transfers like that are relatively rare.