Performance
I put all three phones through our benchmark suite which has been updated with a few new tests and a few of our older tests as well. You can spot the older tests because on those I have left past results in as well for even more comparison points. Just getting to compare the OnePlus 6T against the Note 9 and S9+ is interesting enough, but slipping a few older phones in the mix might be exactly what you need to see how your previous phone would compare. All of our tests are also available and simple to reproduce as well on your own device for comparison. So for hardware, the OnePlus 6T has 8 gigs of ram and is running on the Qualcomm Snapdragon 845 which is a 10nm octa-core and runs at “up to” 2.8 GHz. Four cores run at that 2.9 GHz and 4 efficiency cores run at 1.9 GHz. For the GPU it has an Adreno 630. The Note 9 and S9+ both have the same CPU and GPU configuration as well which should keep them close in performance but software and thermal can also affect that.
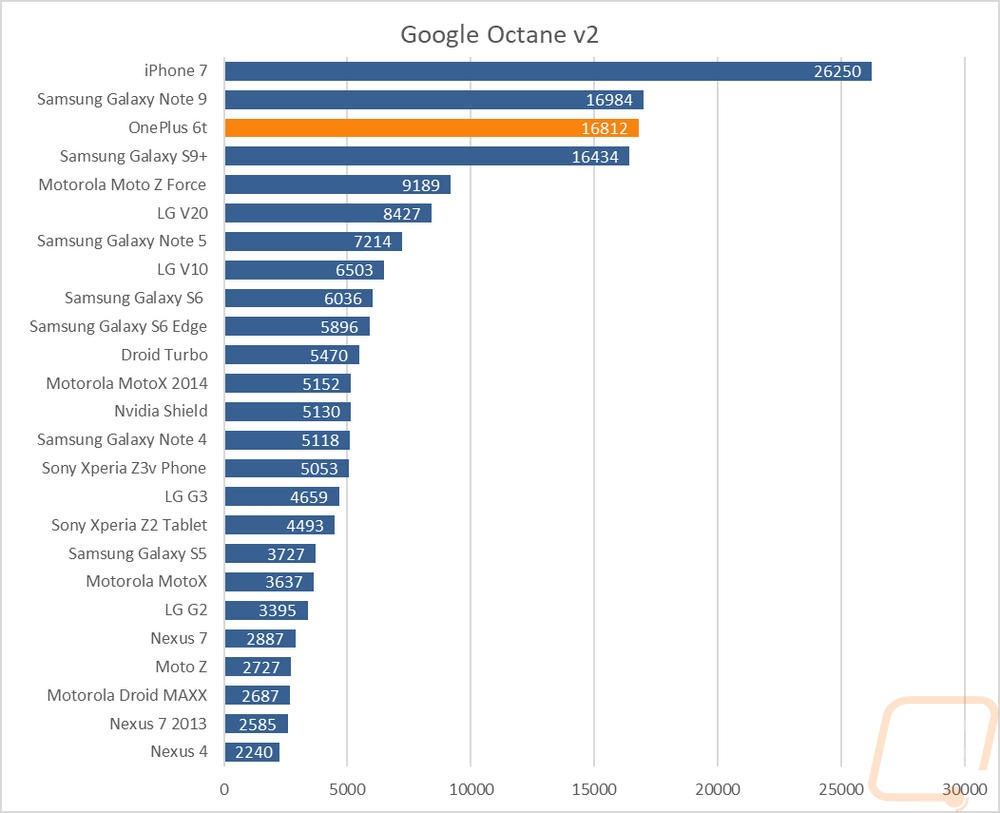
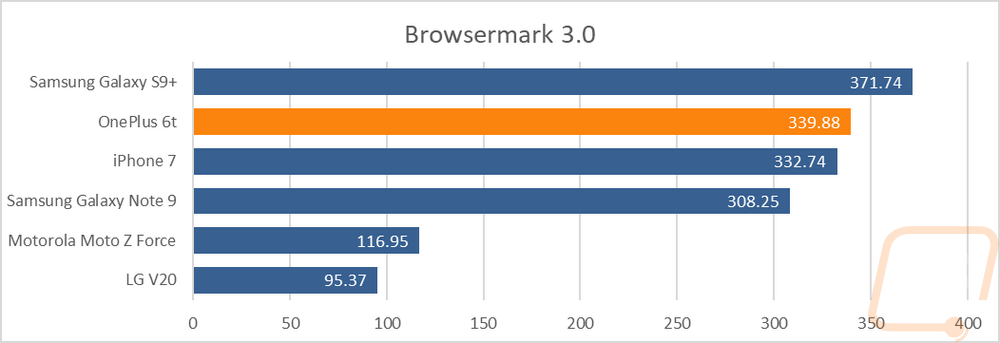
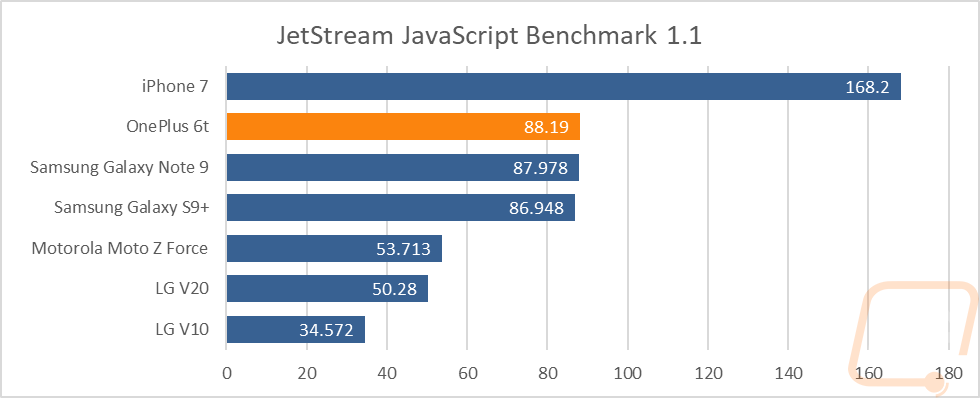
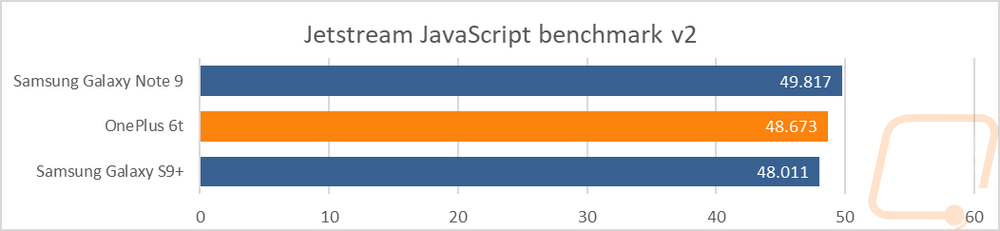
So my first round of tests are all browser based tests that check HTML5 and JAVA performance. For a lot of people, this is what they use their phone for the most. Across all four tests, you can see that the three Snapdragon 845 devices run together. All three phones came out ahead in at least one test showing that they all performed about the same even with there being gaps between them in individual tests but even the old iPhone 7 still came out again here in most of the tests.
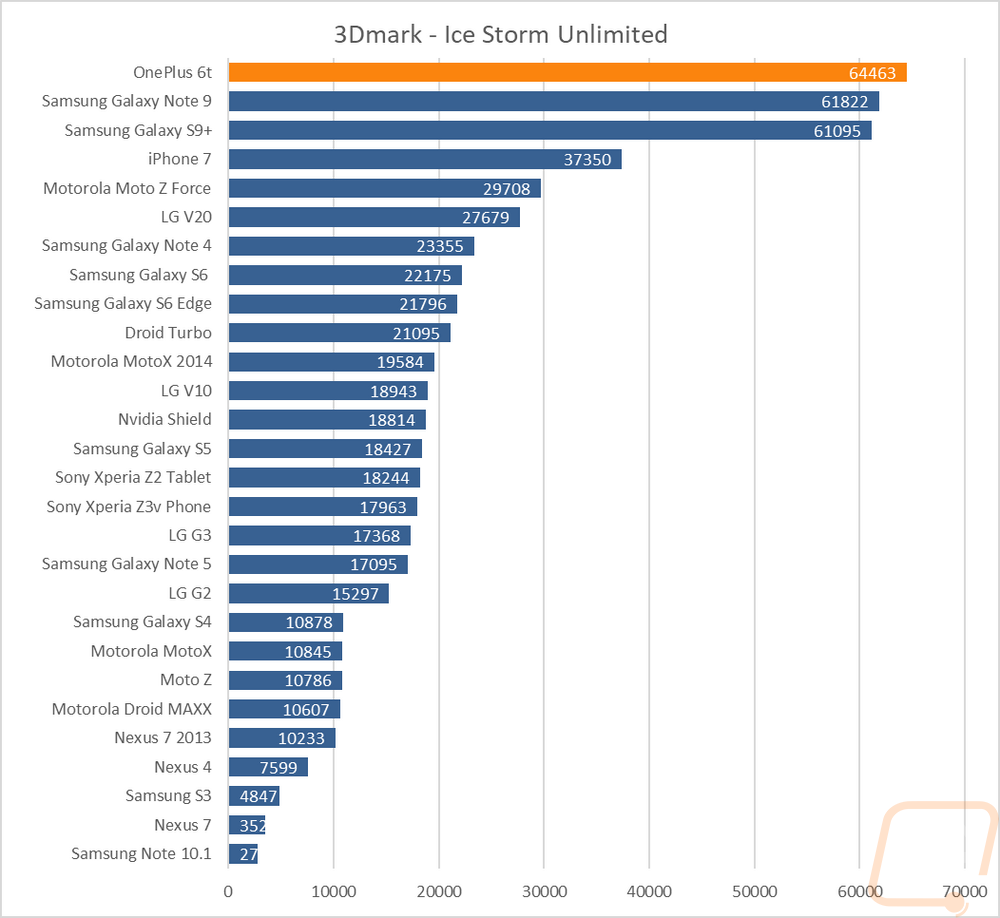
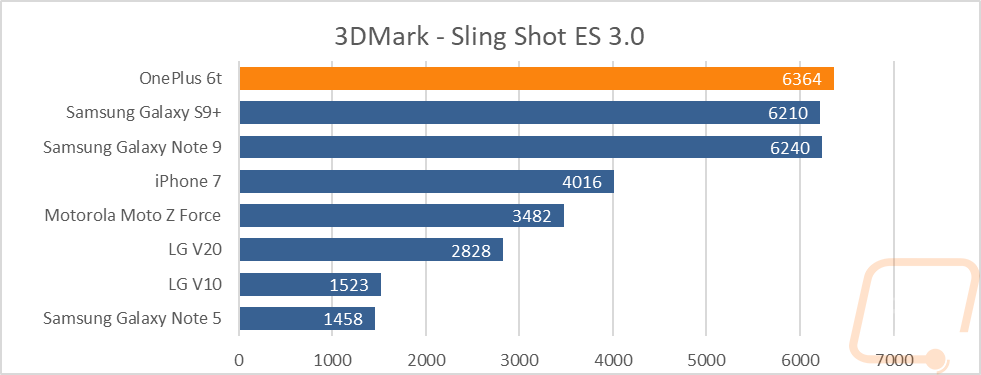
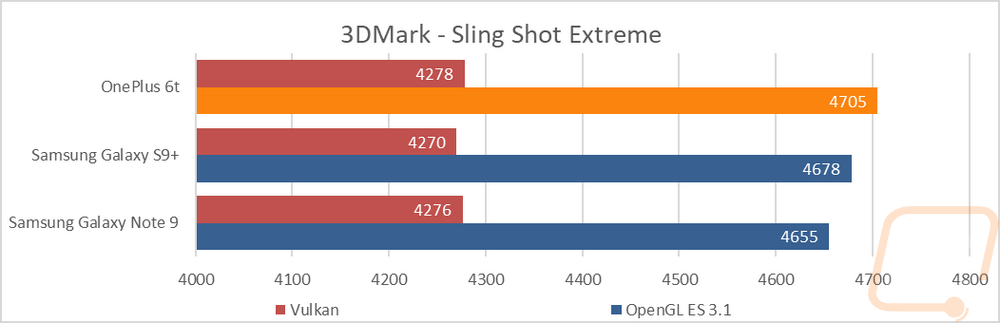
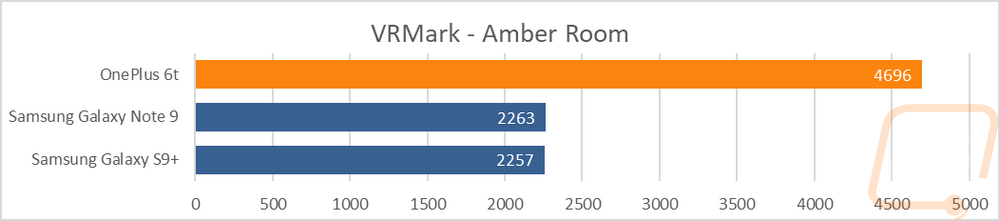
My next round of testing was for gaming performance. I like 3DMark a lot for these because some of the tests can even be compared to laptops and PCs. I did also get a VRMark test which is a good look at phone based VR performance The OnePlus 6T really excelled at the gaming tests, staying at the top in most of the tests, especially in the VR test which it was WAY ahead. You can see just how big the performance gap is between these phones which are all still last years models compared to a few of our older tests, gaming performance has improved significantly recently, the Note 9 vs the Note 4 is nearly three times as fast for example.
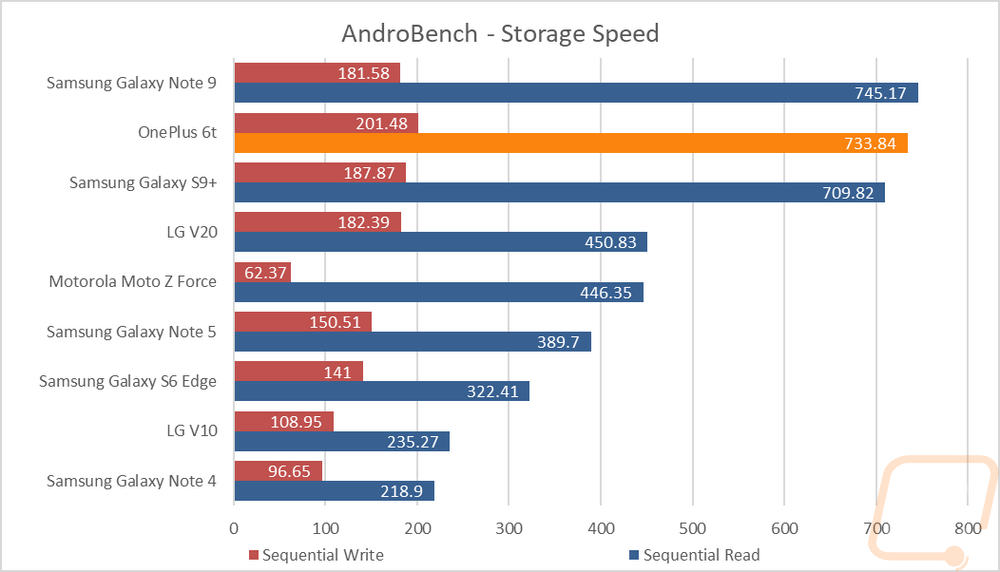
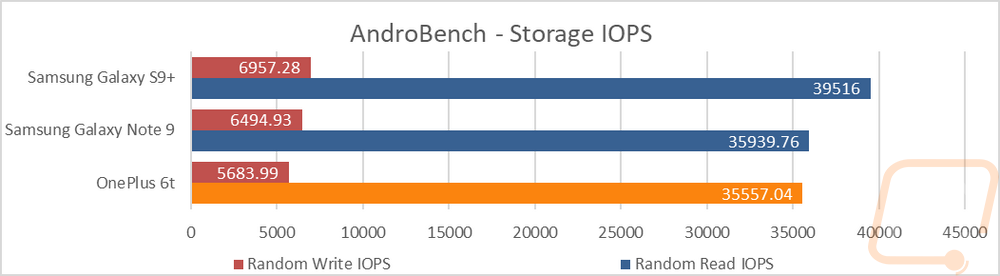
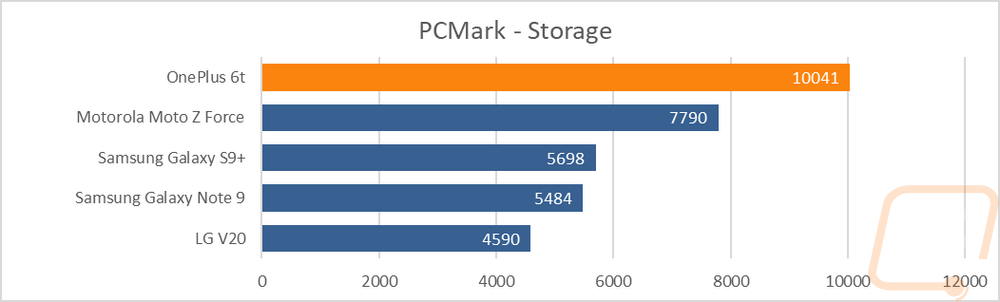
Now it might not be something you think about when shopping for a phone but storage performance plays a big role in how a device performs and feels. The worst part is when looking at specifications you can’t just look at know about how it will perform, you only know what you get for ram and data storage and that is it. I’ve run a few tests to take a look at the performance of those. In AndroBench I check out read and write speeds which has the 6T in the middle of the other two for read speeds and out ahead for write speeds. That said I’m happy to see that phones are now getting performance up in the 700 MB/s for read speed, write speeds need to significantly improve. The storage IOPs tests, on the other hand, put the 6T as the slowest of the three. Then the PCMark storage tests storage performance in the internal, external, and database to put together an overall score which as you can see the 6T really stands out in this test with the two Samsung phones not even beating the older Moto Z Force from a few years ago.
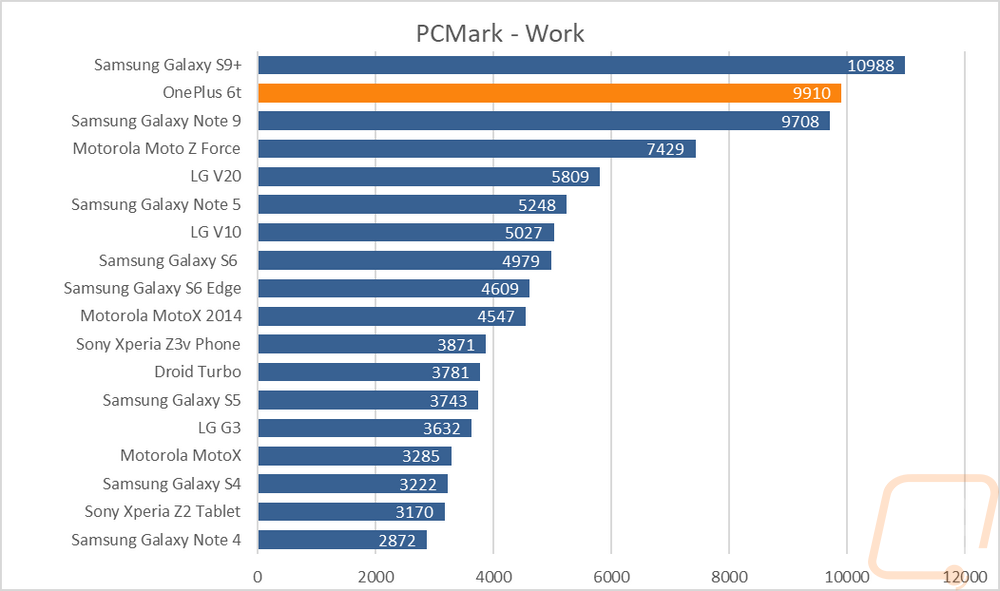
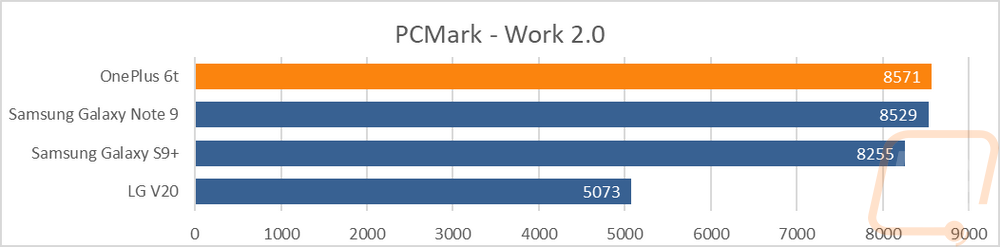
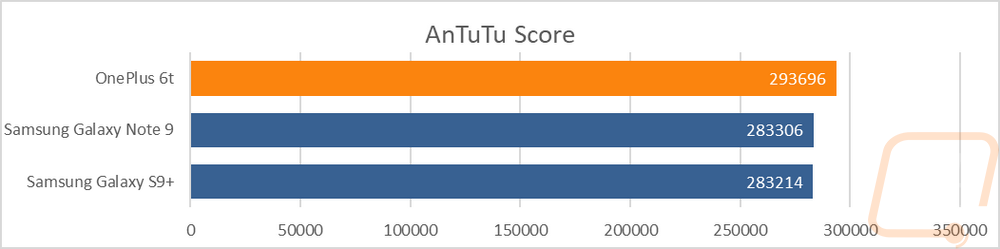
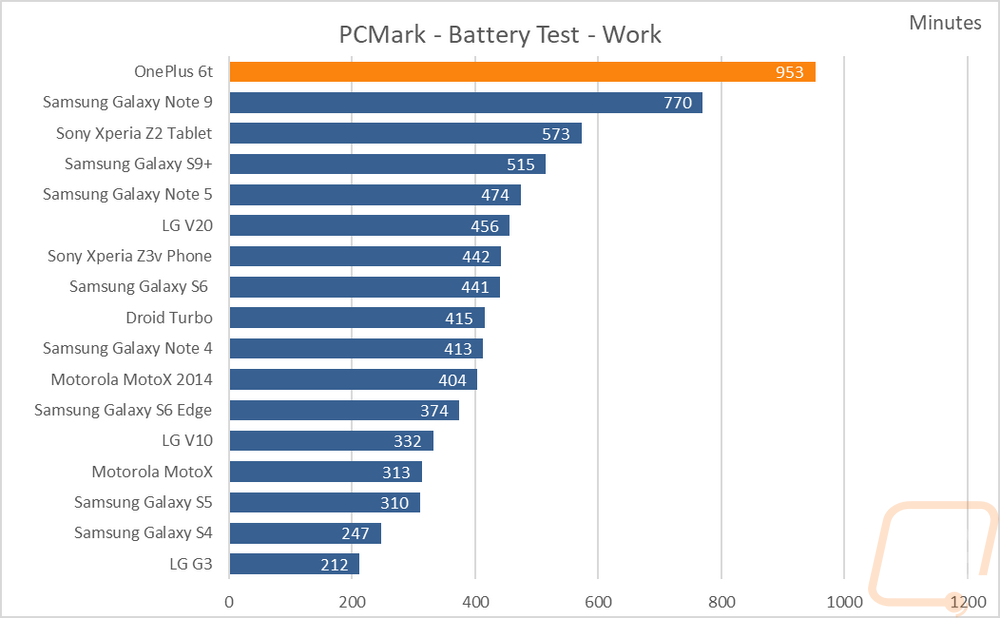
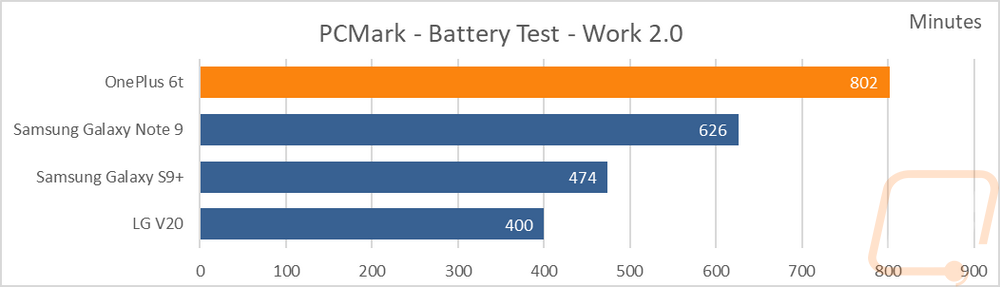
For general CPU performance, I used a few overall benchmarks like PCMark, Passmark, and AnTuTu. In PCMark, I ran the older Work workload and the new Work 2.0. The older Work test lets us look at a lot more past tested devices but like in the gaming tests you can see a big dropoff when going back to older devices. The S9+ pulled ahead on that test out of the group of three but then on Work 2.0 it was the 6T on top with the S9+ behind.
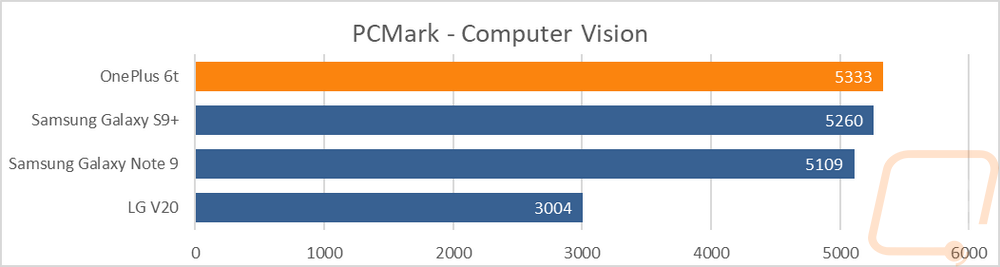
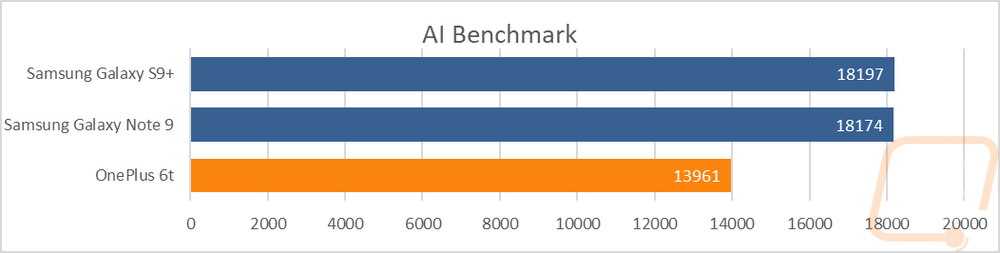
Two of the new tests added were about AI and image recognition. The first is the Computer Vision test in PCMark. This tests how quickly the phone recognizes barcode and QR codes with ZXing, optical character recognition with Tesseract, and image recognition with TensorFlow. Again all three phones were bunched up together but with the 6T out ahead and the S9+ and then Note 9 behind it. The AI Benchmark which is both the name of the benchmark and also what the test does had the 6T significantly behind which given the same hardware I’m really not sure why that happened. That test is similar to the image recognition part of the PCMark test.
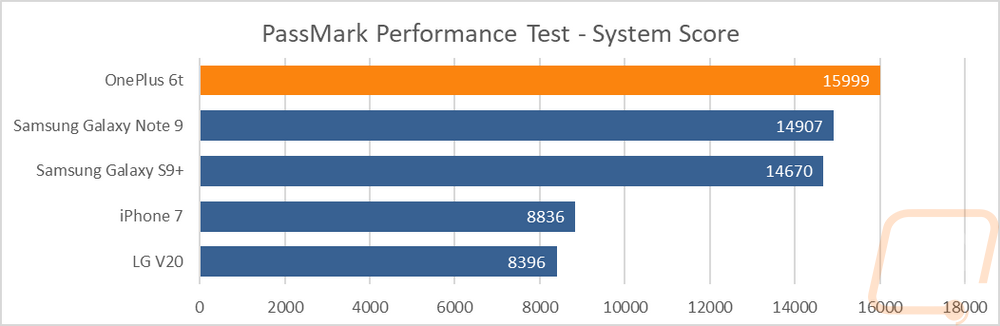
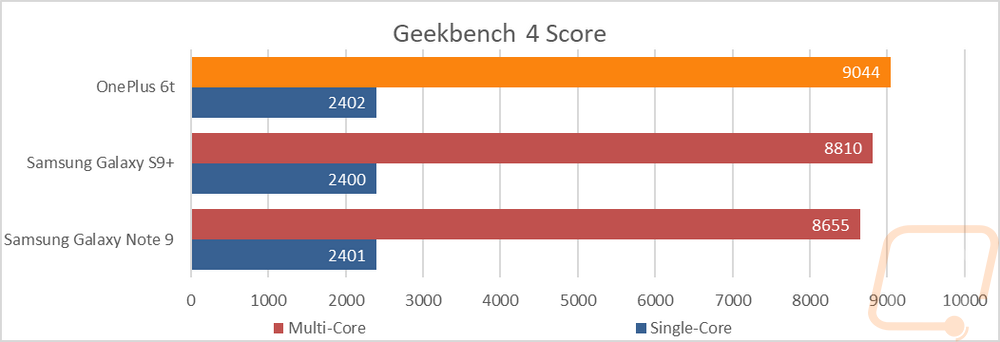
I split Geekbench apart from the other tests because I love that it allows me to take a look at single and multi-core performance. Our previous test to do this went away. Of course, all three phones are running the same Snapdragon 845 so they are close in performance. You can see though that single core results are the same but when all 8 cores are used thermals change the performance a little with the OnePlus 6T coming out ahead. Passmark had the 6T out a lot more than the other two 845 phones which really makes me look forward to the thermal throttling tests because its clear that has to be going on here given they all have the same CPU and clock speed. The same with the AnTuTu score which had all three close but the 6T out ahead.
A few years ago my biggest concern when it came to purchasing a phone was actually battery performance. Taking your phone to work and using it from time to time or even just being in a lower signal area and having it barely last your work day was a big issue. That has improved a lot as you can see in our battery performance tests but it is still nice to get the best possible battery life. OS improvements play a role in this, each phone has their own way of handling low battery power as well to help. But brute force always helps with a larger battery. In this case with all three phones being close in screen size and having the same GPU and CPU configuration I was very curious how things would work out. Screen brightness is important on all of these. For the Geekbench test which I just added I ran the shorter test and Geekbench set the brightness level. For the two PCMark tests I set the brightness to the halfway point and did the tests. All phones were on airplane mode to keep emails, messages, or updates from changing things as well. I should note though that the 50% screen brightness setting had the 6T noticeably dimmer than the two Samsung phones and the Geekbench had the 6T at least twice as bright as the other two. In the Geekbanch test, I couldn’t even see the screen on the Samsungs. I've included a picture below of what the screens looked like, something is clearly wrong on the Geekbench test.
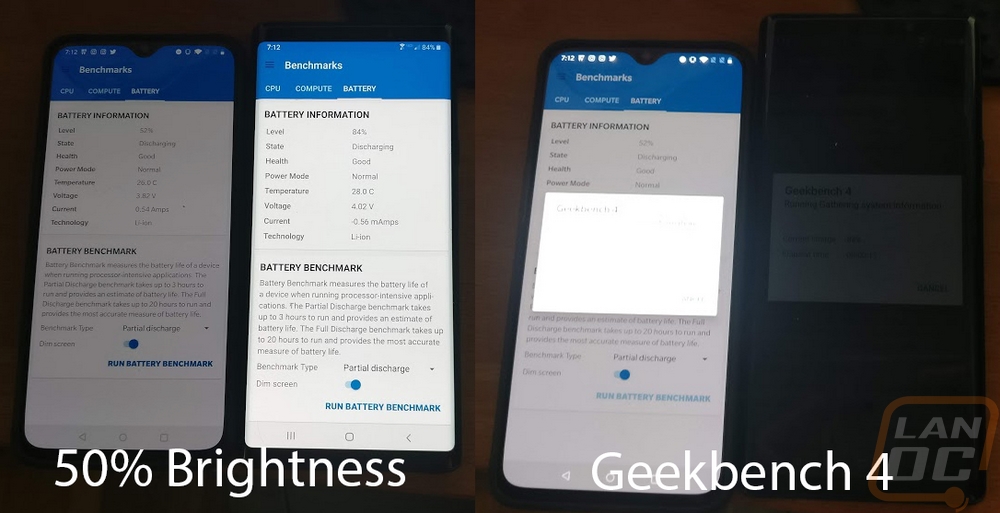
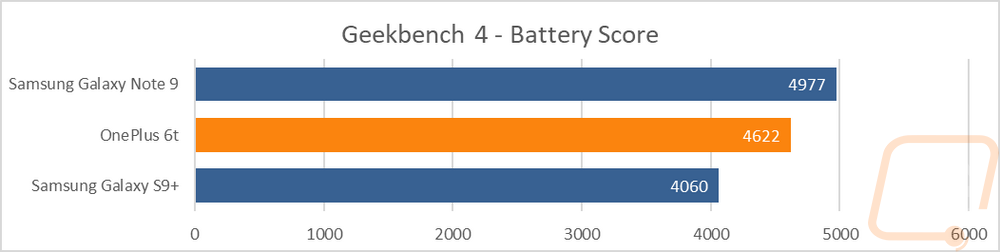
Anyhow I still have our results and in the older PCMark Work test the 6T dominated with a 953-minute long result which is over 15 hours of running the PCMark tests over and over again. The Work 2.0 workload was a little more demanding and dropped the result down to 802 minutes which is over 13 hours. The Note 9 and S9+ came in behind that. The Note 9 has a the largest battery out of the three at 4000 mAh, the 6T second at 3700 mAh, and then the S9+ at 3500 mAh. The Geekbench 4 result put the 6T in the middle of the pack which was in line with the overall battery capacity, but didn’t really match the two PCMark results and given the screen brightness in the above picture I would say something is up there. After doing the battery tests I was curious how the total charge time for the 6T. Going from 18% charge I got a full charge in 67 minutes which wasn’t bad at all with OnePlus’s fast charging though it does make me wonder how the Warp Charging would improve things.
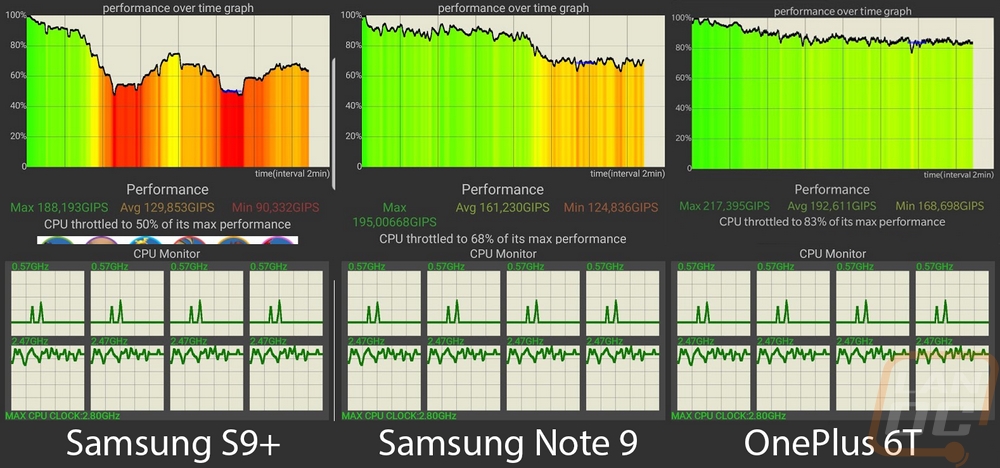
The last thing I wanted to look at was thermal throttling and I already had an idea of what I was going to see given some of the results in the other tests. The OnePlus 6T came out ahead of the Note 9 and S9+ in a lot of benchmarks even with all three running the same CPU and GPU configuration. So to take a look I used a benchmark called CPU Throttling Test that runs a 15-minute long test loading everything up and then monitoring the CPU cores to see if they drop down in clock speed. In the graphs below you can see that the S9+ really took a hit when under extended load, dropping down to half the speed at some points in the test and overall it was bad early on and through the test. The Note 9 held up for longer but dropped down in the second half throttling down to 68% at one point. Then the 6T was a little better with a slower gradual drop dropping down to 83% at its worst. The average numbers were even more in favor of the 6T. Overall this was one of the big contributors to the 6T’s performance.