CPU Performance
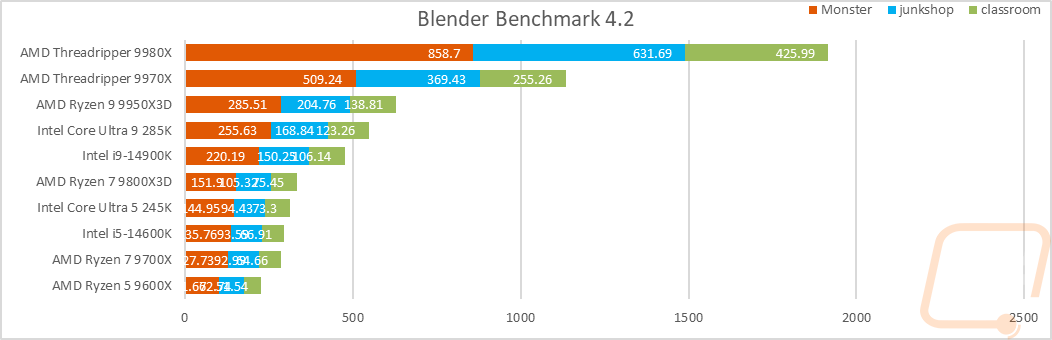
To start off our testing, I went with the rendering-focused Blender benchmark. To get a good look at the overall performance, I have all three of the results stacked together, and in this test, both the Threadripper 9980X and the 9970X completely dominate the results. The Ryzen 9950X3D topped our chart previously by a good margin, but the 9980X has the combined result covered with just the result from ONE of its tests.
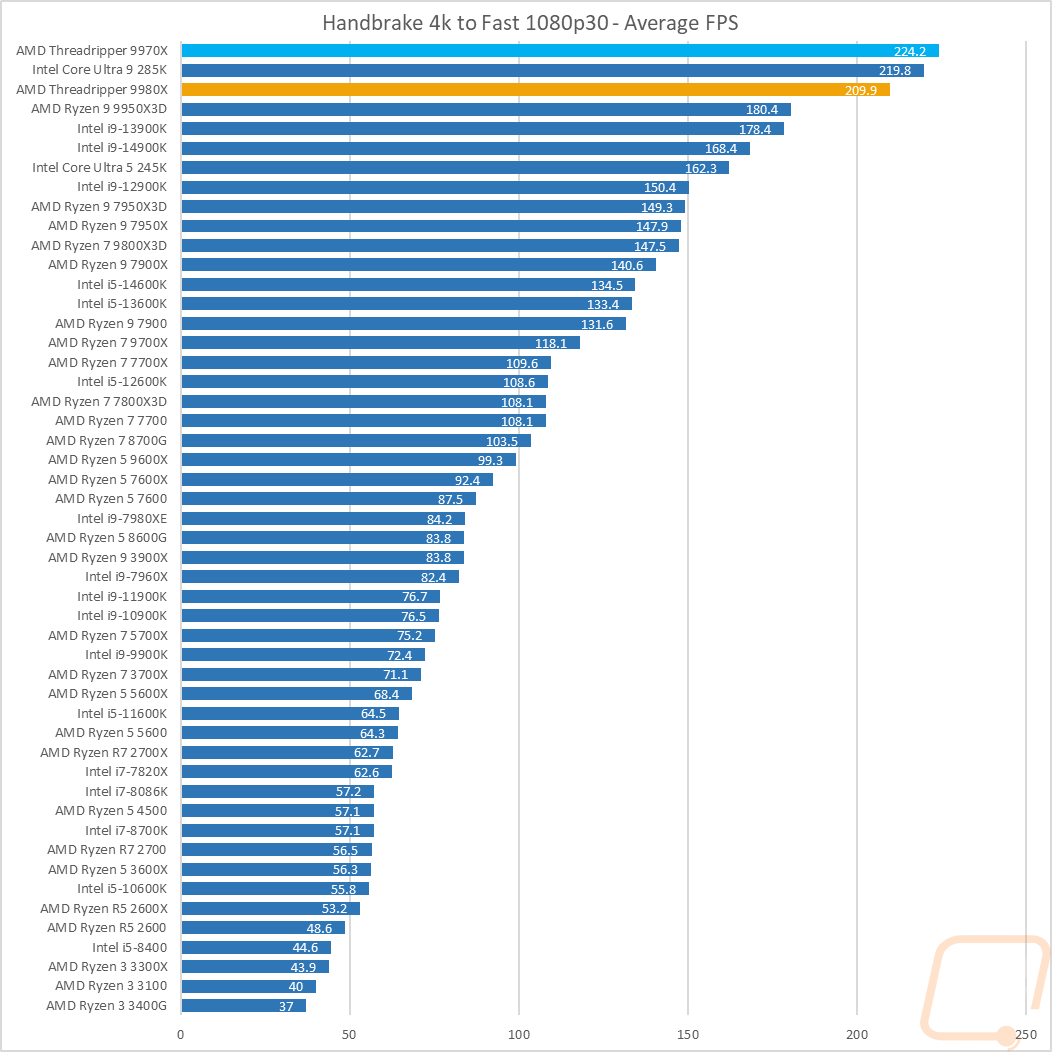
Continuing with the video encoding theme, I also have Handbrake, which is an open-source transcoder. For this test, I am taking a 4k video down to 1080p 30 FPS, and the results are the average FPS of that task. The results here are a little more interesting, but it does highlight an issue you start to see with some software. The Threadripper 9970X is the CPU at the top of the chart here, not the 9980X. Handbrake scales well up to 6 cores and then sees diminishing returns as it goes up from there. With the 9970X having a higher base clock speed, it pushes it up past the 9980X as well as the 285K.
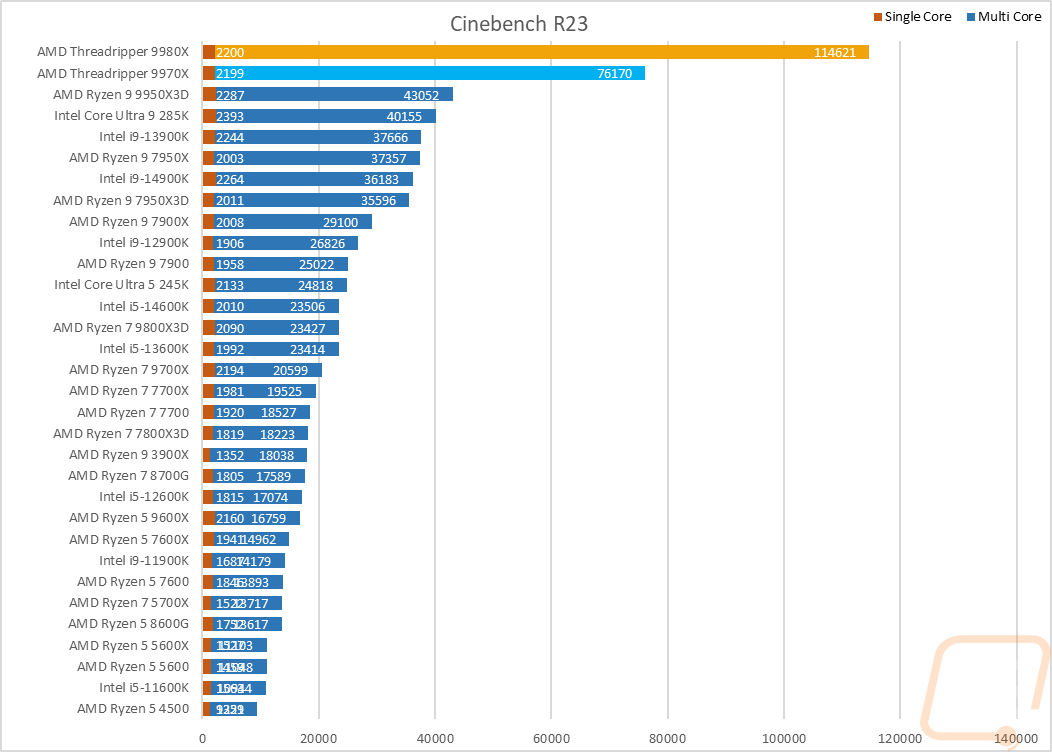
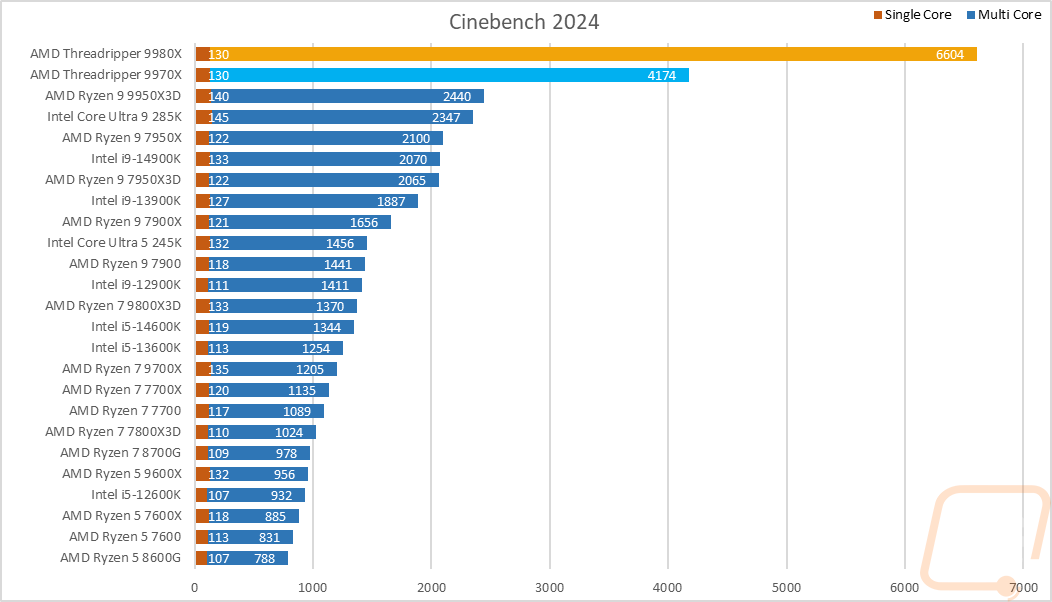
For the always popular Cinebench, I am testing with the older Cinebench R23 as well as the newer 2024 edition as well. I always like Cinebench because we have multi-core and single-core performance, which gives us a good look at the performance of the whole CPU and IPC performance. In R32, both of the Threadripper CPUs dwarf the other CPUs tested, with the 9980X way out in front with an impressive multi-threaded score of 114,621, almost three times the score of the Ryzen 9 9950X3D, which is impressive in its own right. The 9970X scored 76170, which is almost double the 9950X3D. For single-core performance, both the 9970X and 9980X are just slightly behind, however. The Cinebench 2024 results were similar as well, with a multi-threaded score of 6604 for the 9980X and 4174 for the 9970X, again making everything else tested look slow in comparison.
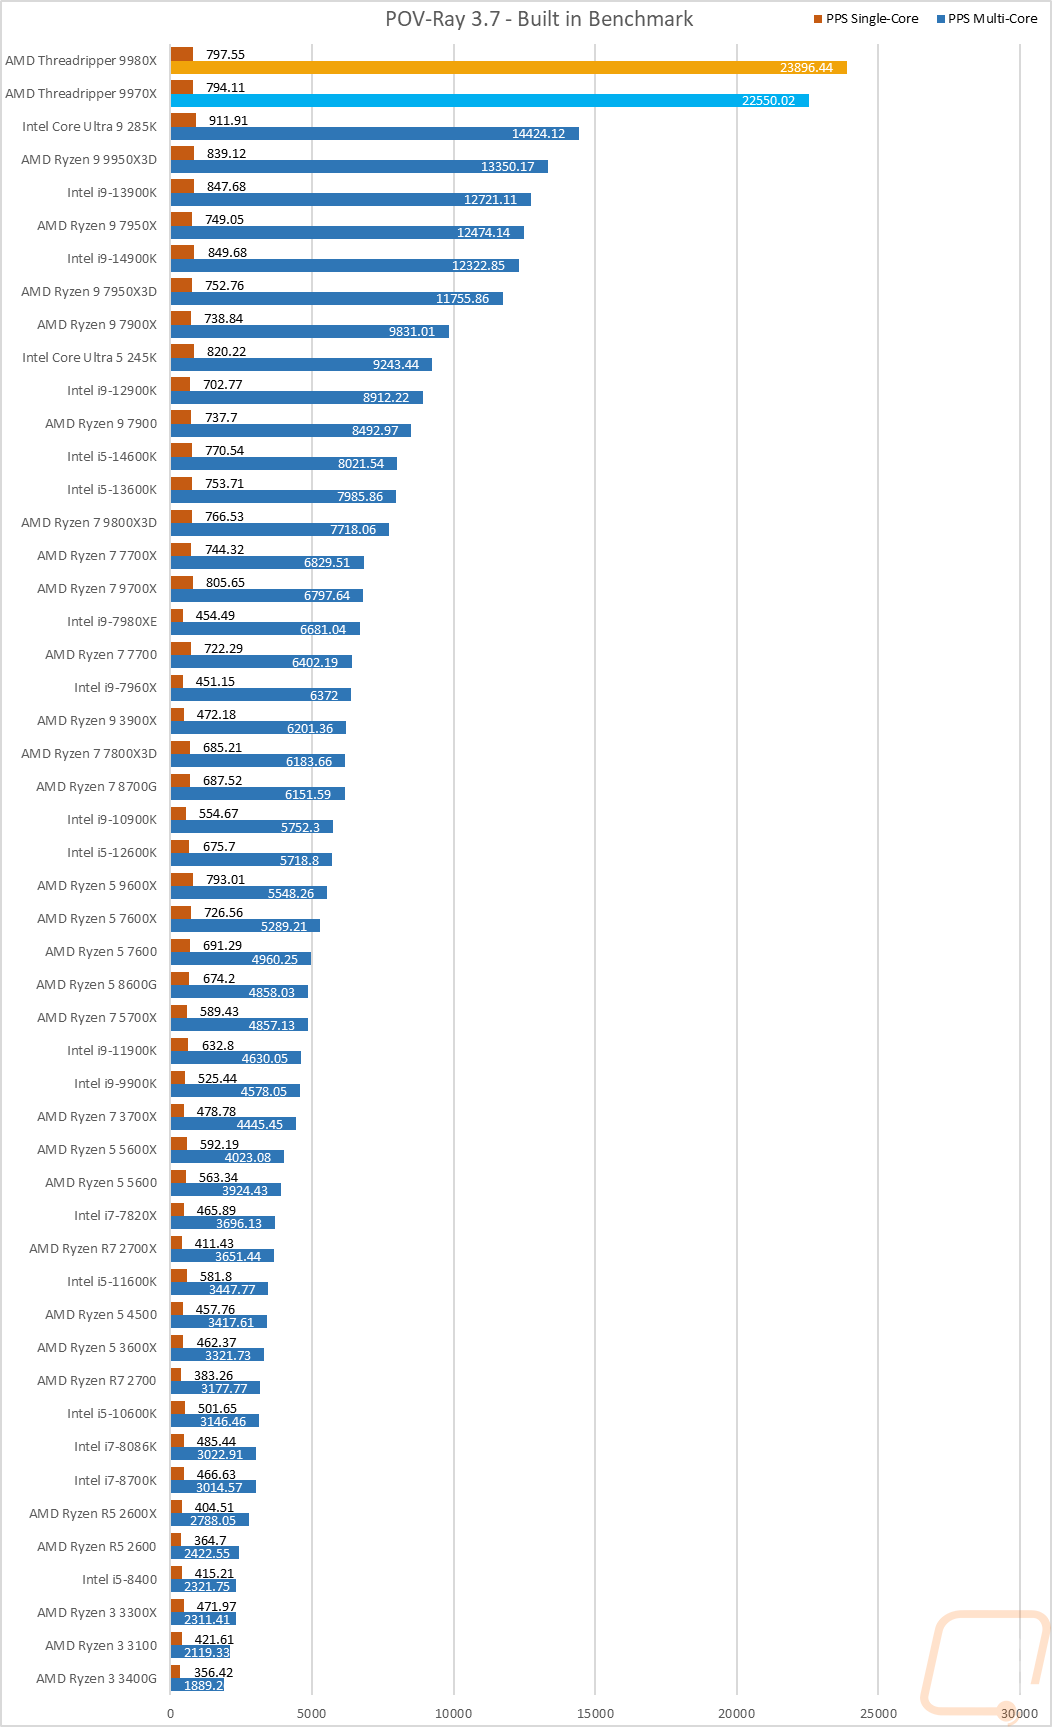
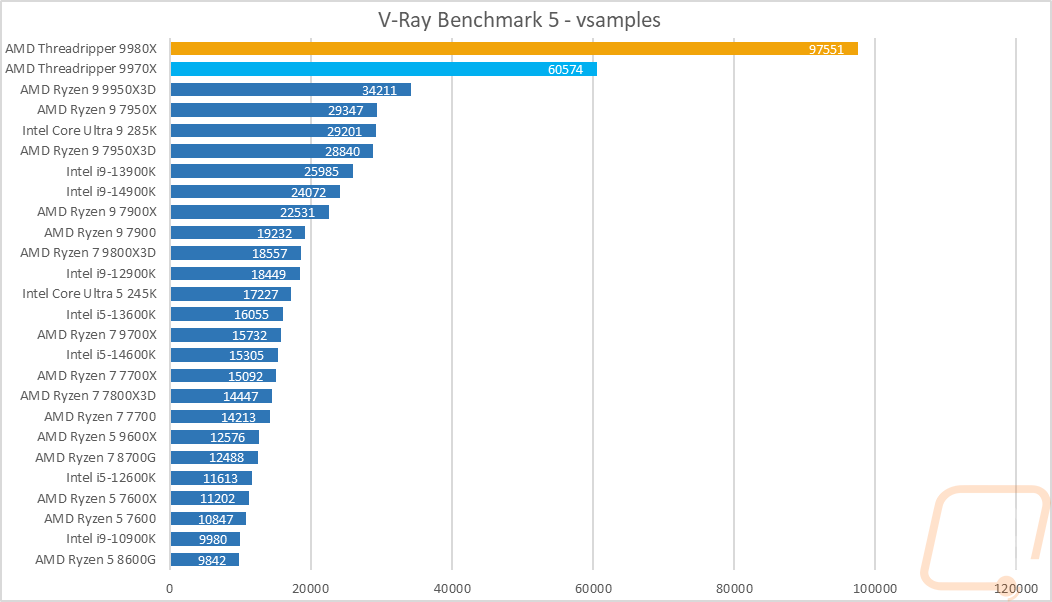
Next up, we have ray tracing-focused rendering benchmarks. Here I tested the CPUs in POV-Ray and V-Ray Benchmark 5. POV-Ray was also tested with a single core and across all of the cores. The Threadripper 9980X and 9970X both sit way out in front in POV-Ray with scores of 23896 and 22550, with the next highest score being the Intel Core Ultra 9 285K at 14424 when testing Multi-Core. Single-core results have them sitting a little lower than the mainstream line CPUs with higher clock speeds. The 9980X scored a 797.55 and the 9970X a 794.11. For V-Ray Benchmark 5, both 9000 Series CPUs take off once again, with the 9980X scoring almost 100k with its 97551 score and 60574 for the 9970X, two and three times the 34211 of the 9950X3D.
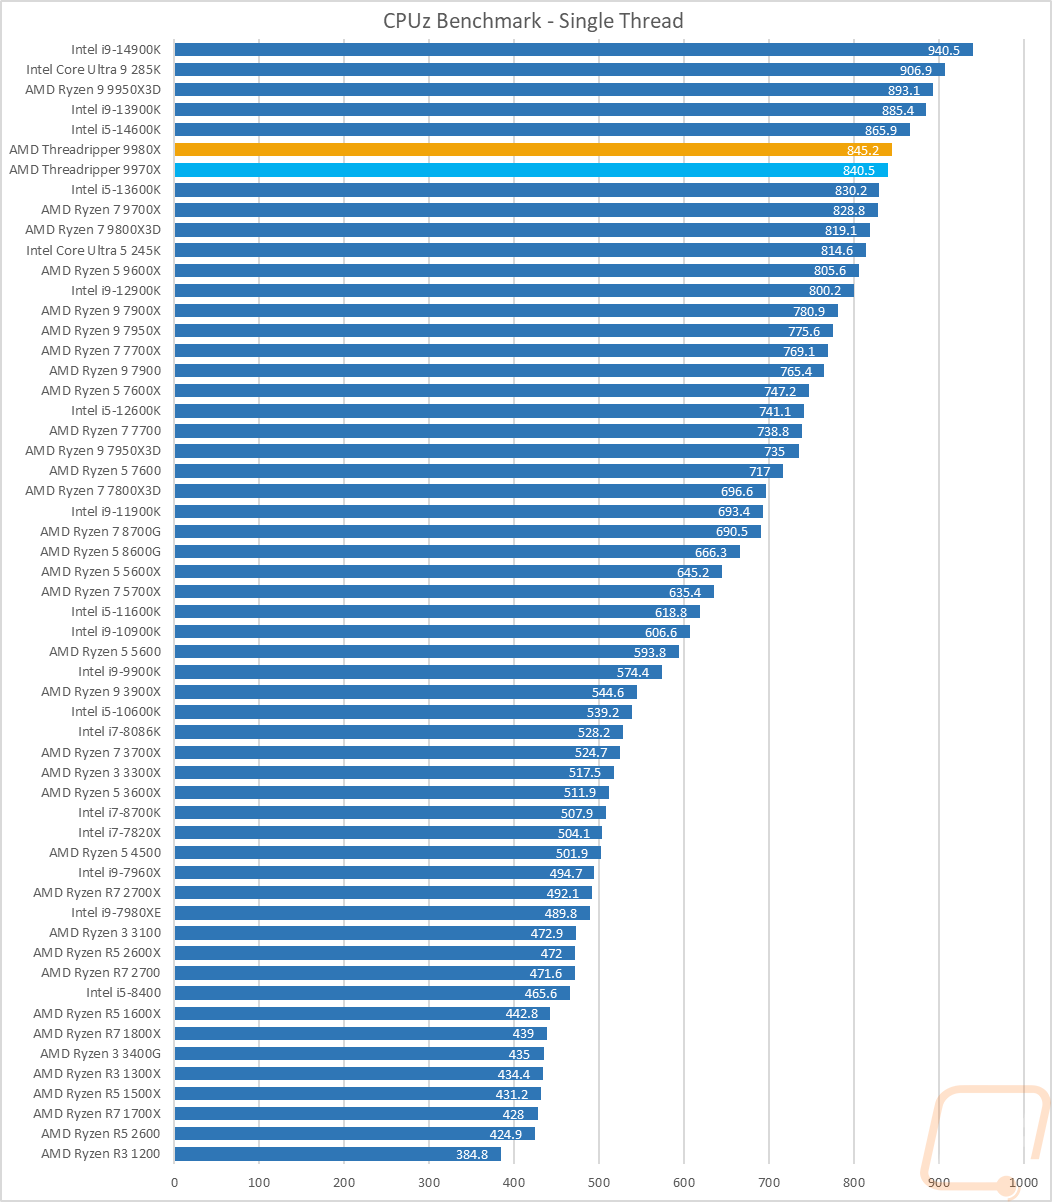
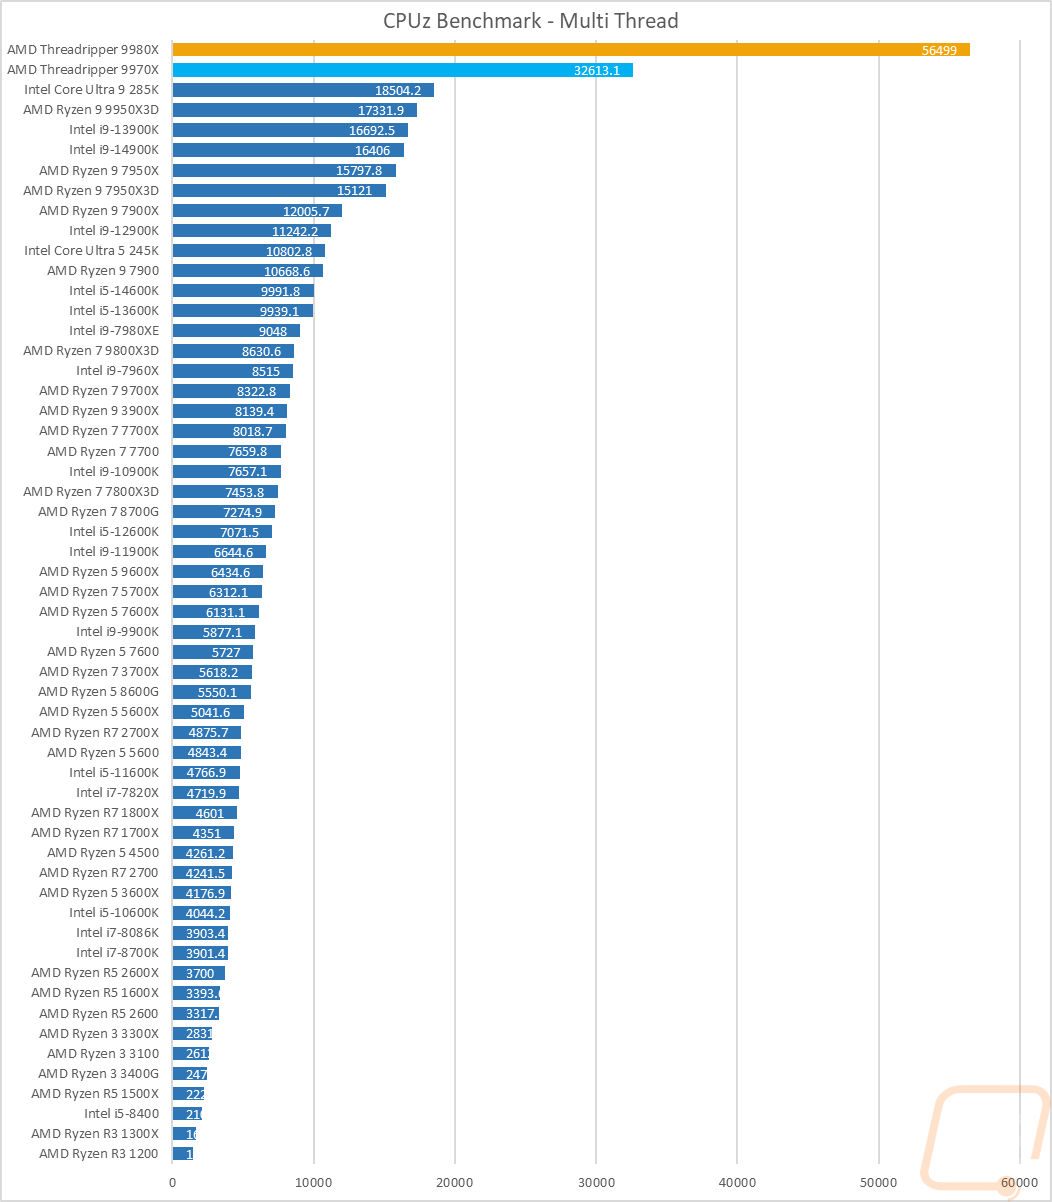
I also tested using CPUz’s built-in benchmark, which runs on a single thread and with all threads. In the single-thread test, you can see how the lower max and core clock speeds of both CPUs keep them behind the top few CPUs from Intel and AMD's mainstream lineups. With the multi-threaded test, however, they have legs. The Threadripper 9980X scored an impressive 56499, and the 9970X scored 32613, both making the 285K look slow with its 18504.
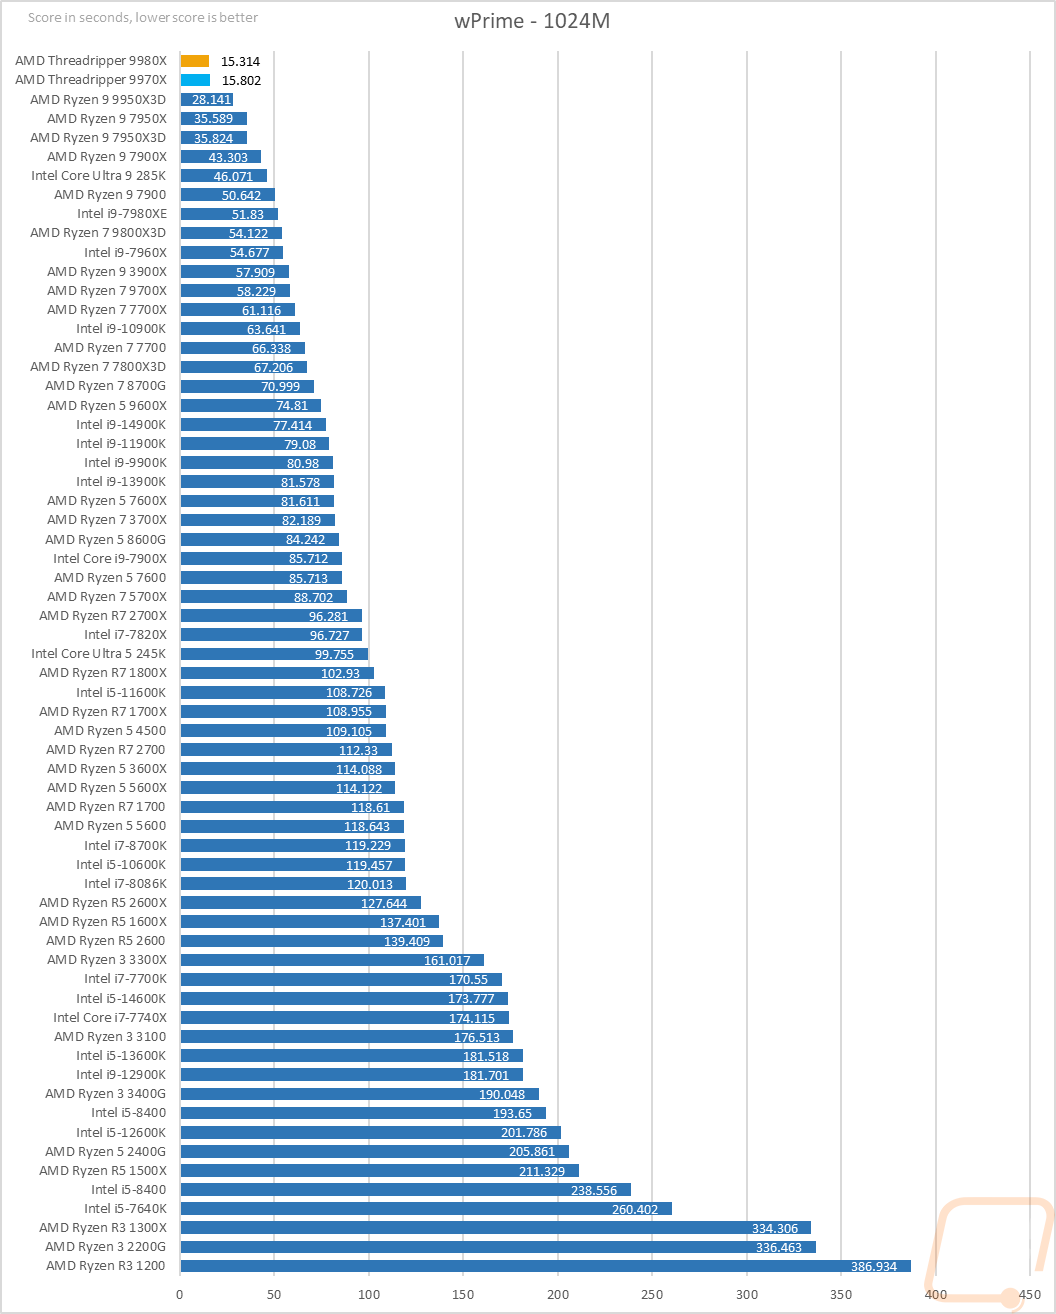
Next, we have wPrime, which is a classic overclocking benchmark that calculates pi out to 1024 million digits and is timed. This is a benchmark that favors high core count CPUs, which both the 9980X and 9970X benefit from. Both finished the test in just over 15 seconds, nearly half of what the Ryzen 9950X3D did.
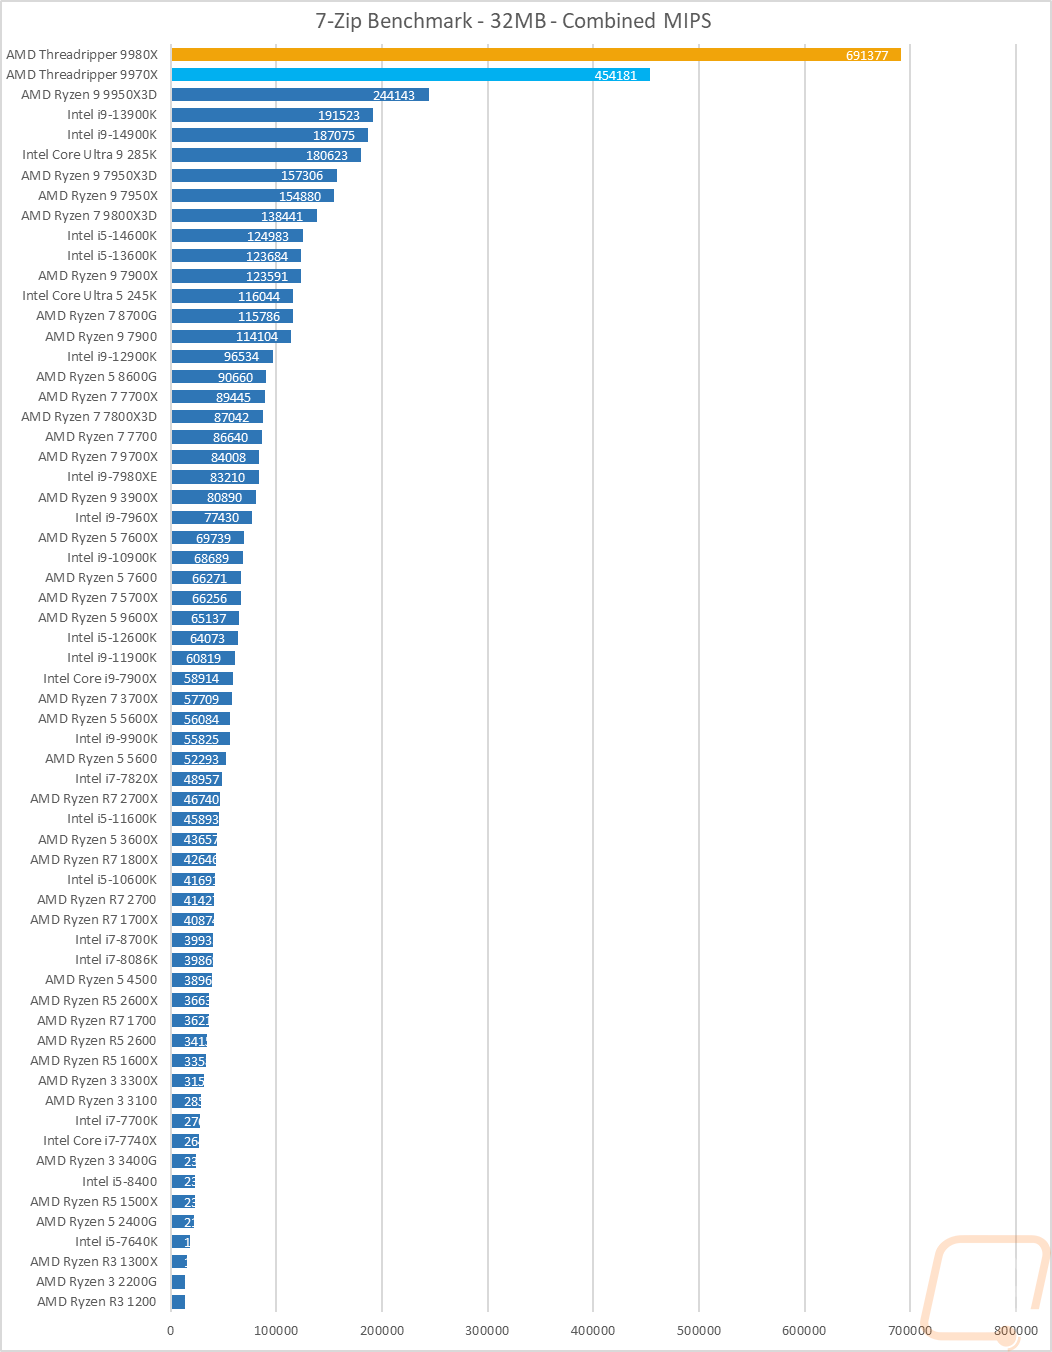
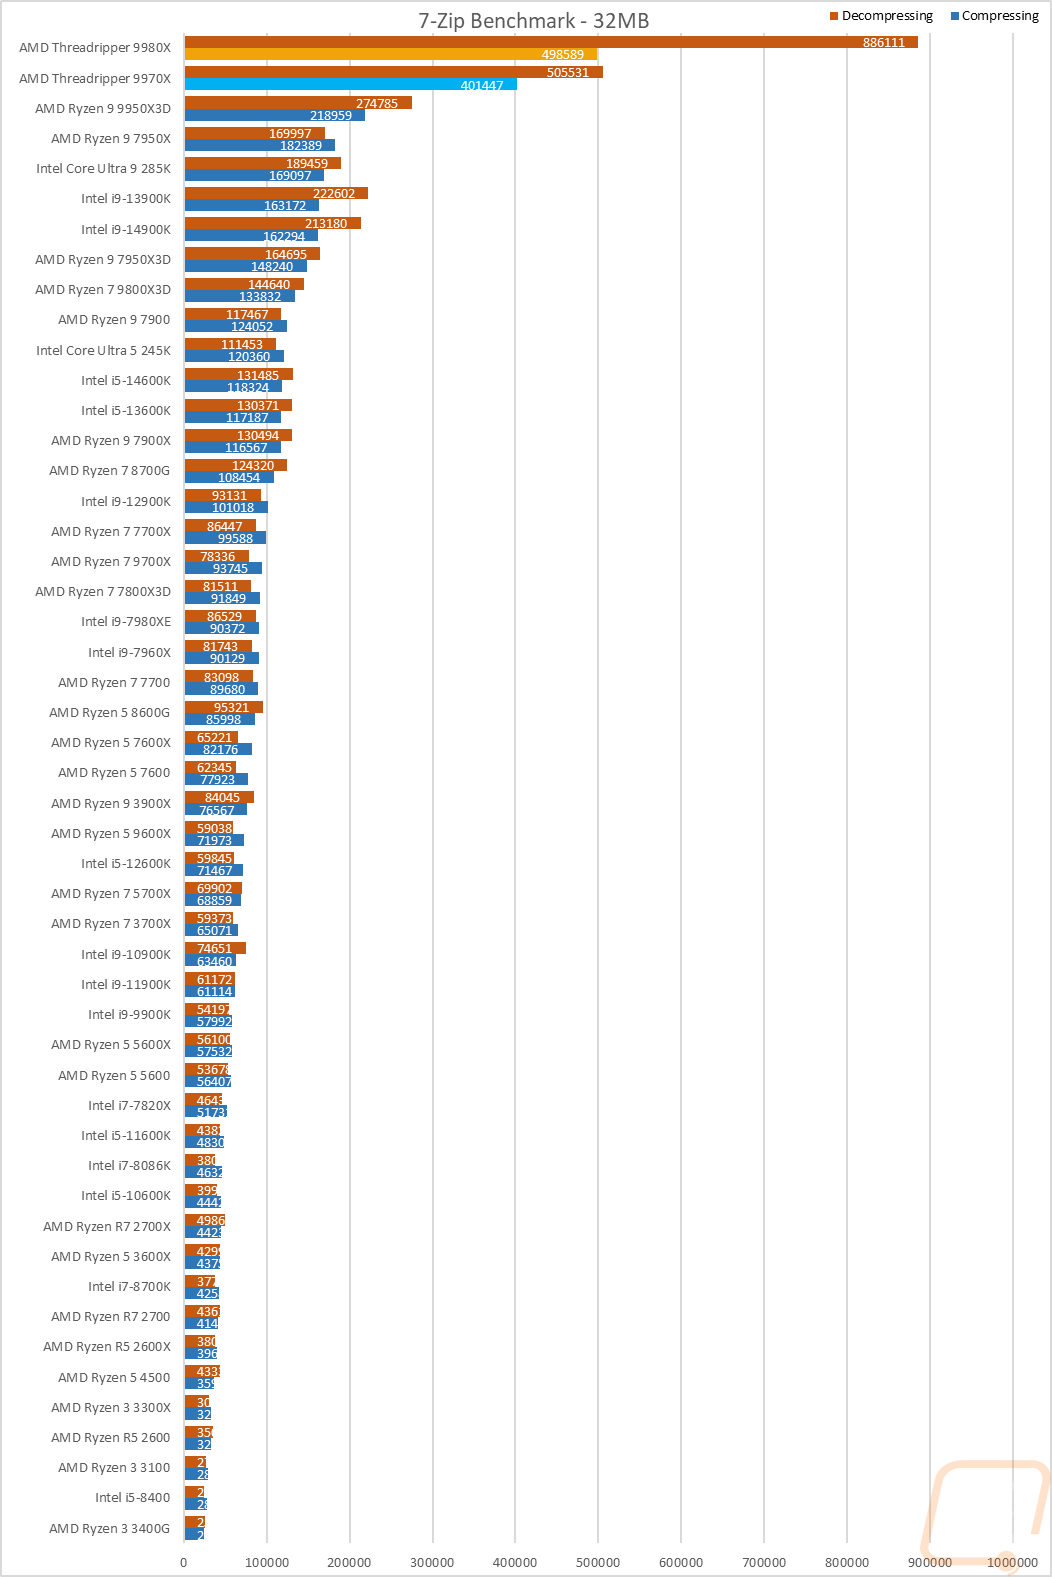
7-Zip is another open-source program, this time for compressing and decompressing all of your files. Here I have run the benchmark, and we have three results. The combined MIPS is a combination of compressing and decompressing performance. Then I have it broken down between the two. The combined results have both the 9980X and 9970X once again dwarfing everything else tested, with scores of 454181 and 691377. IK should note that I had to upgrade 7-Zip to the latest version for testing here, the previous version capped out at 64 threads, which was fine with the 9970X but limited the 9980X by half. With the new Threadripper version of 7-Zip, the 9980X is way out in front, both making everything else tested look slow. The same goes for the individual decompressing and compressing results, but the decompressing with the 9980X out in front.
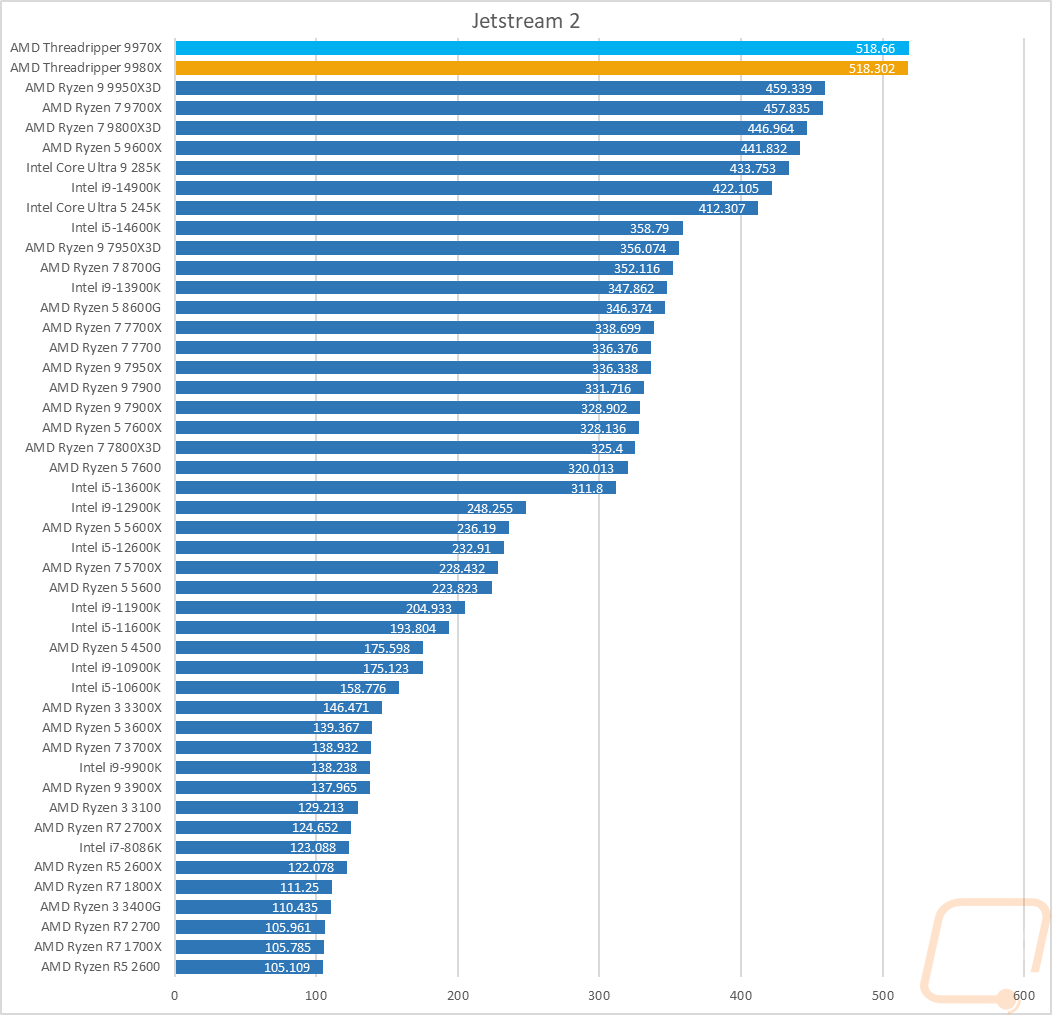
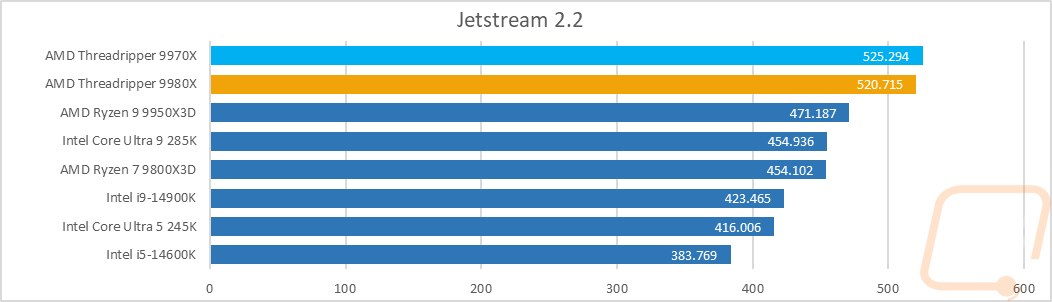
Jetstream 2.1 is a compilation benchmark that takes a long list of HTML5 and Java in-browser tests and runs them all three times, and puts together an overall score. I love this benchmark because let's be honest, most people are using their browser more than any other game or program. Jetstream gives some interesting results sometimes, though, but it tends to prefer high IPC or single-core performance, and there are some situations where it prefers lower core-count CPUs. In this case, both of the Threadripper CPUs did top the charts with both Jetstream 2.1 and 2.2, however, the higher base clock speed for the 9970X did put it out in front slightly. What is surprising, however, is that both tests still show both Threadripper CPUs with a good gap between them and the other CPUs tested.
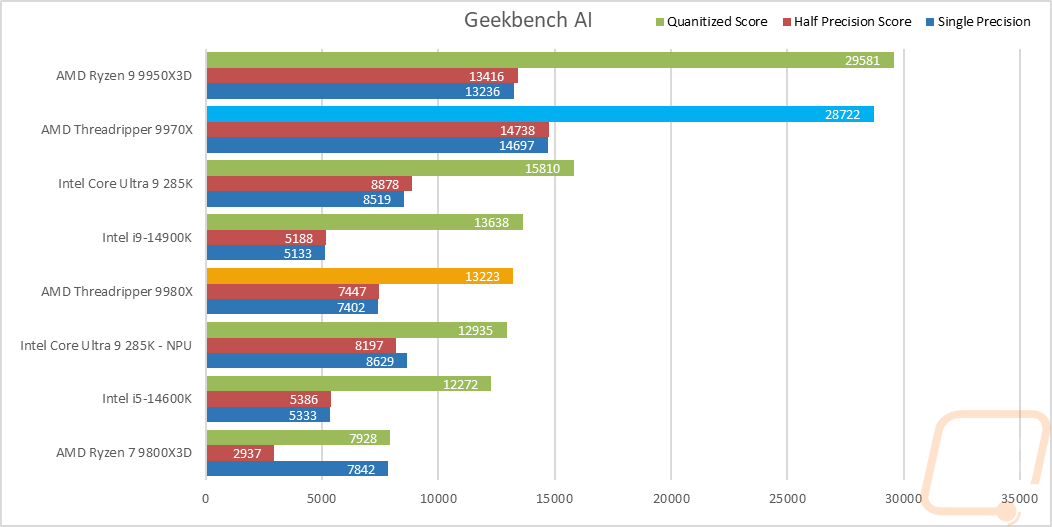
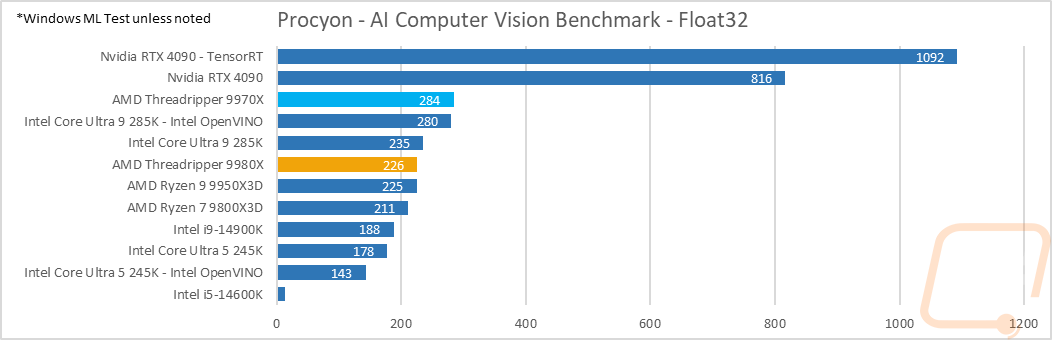
As a new addition to our testing, I have added a few AI-focused tests using Geekbench AI and Procyon’s Computer Vision Benchmark. The Geekbench AI test looks at single and half-precision performance with scores for each and a quantized score as well. They test using 10 different workloads to create their score. The Procyon AI Computer Vision Benchmark focuses on machine vision tests using neural network models like MobileNet V3, Inception V4, YOLO v3, DeepLab V3, Real-ESRGAN, and ResNet 50. I test those using the Windows ML setting, and in cases that support it, I test built-in NPUs as well. I have also included Windows ML and TensorRT results using an RTX 4090, as well as a reference point where these CPUs compare to a high-end GPU. For Geekbench AI, the Threadripper 9970X is up near the top of the chart for its quanitized score, and its single and half precision scores are at the top of the chart. The 9980X, on the other hand, struggled here for unknown reasons on all three tests. Procyon was similar in results with the 9970X at the top of the chart for the CPUs tested, and the 9980X down a little lower in with the 9950X3D and the 285K.
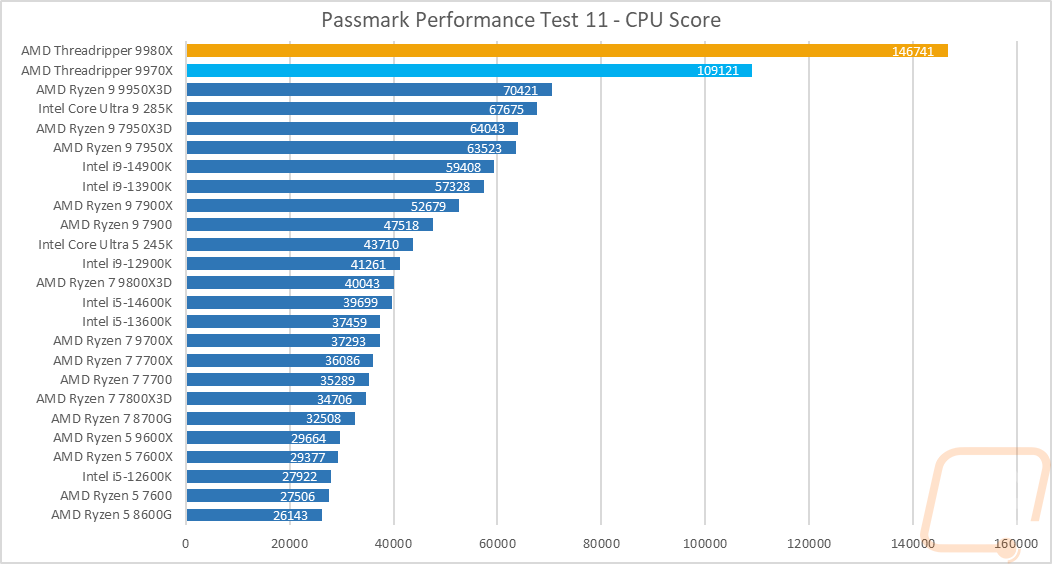
For Passmark Performance Test, I used the latest version, Performance Test 11. I only look at the overall CPU score, which takes a few different synthetic benchmarks and combines the results to put together an overall score. This is a test that favors multi-threaded performance over IPC. In Performance Test 11, both the Threadripper 9980X and 9970X did really well with scores of 146741 and 109121. The 9980X doubled the score of the 9950X3D, which is the next fastest CPU tested.
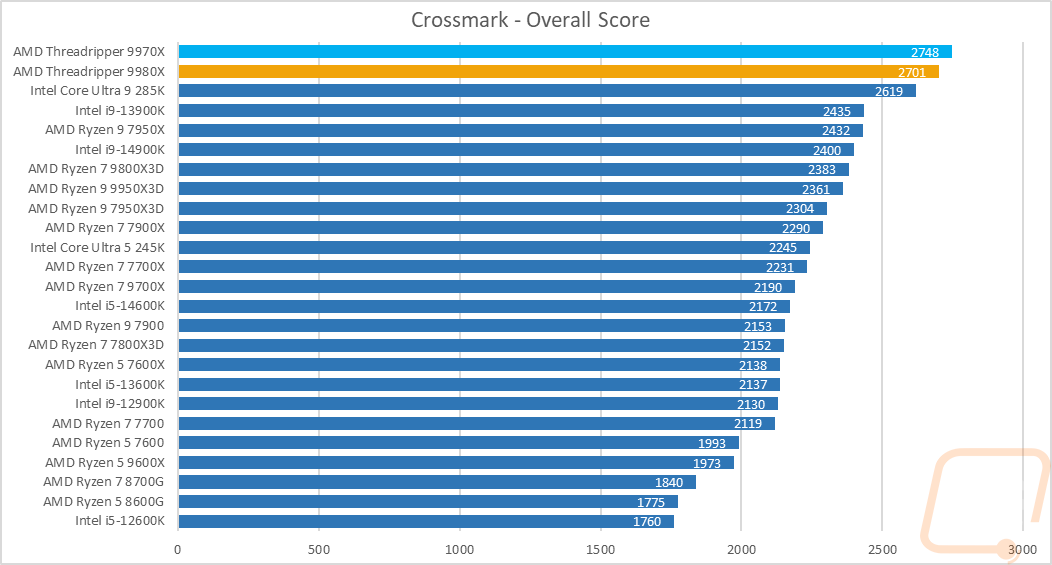
Crossmark is from BAPCo, which also makes SYSmark, and this is a cross-platform test where you can compare performance between phones and both Windows and Mac computers. This is the start of our overall PC benchmarks, and Crossmark uses a mix of real-world tests to output an overall score. The 9980X and 9970X are at the top of the chart here once again, but the 9970X is ahead of the 9980X, and both aren’t far ahead of the 285K. Both of those things let us know that this benchmark isn’t fully utilizing the high core counts.
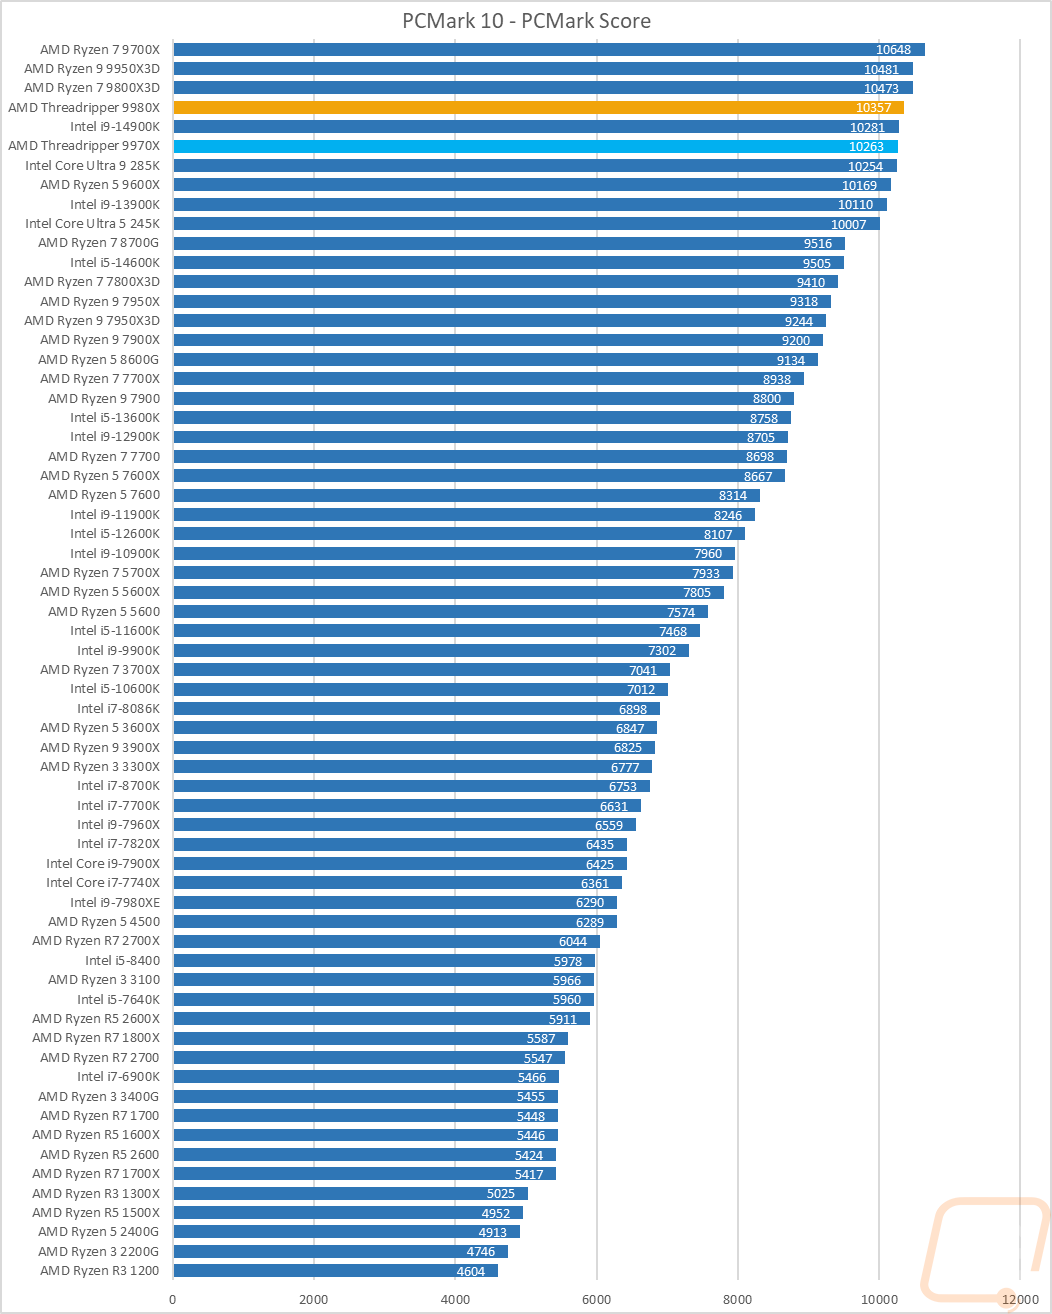
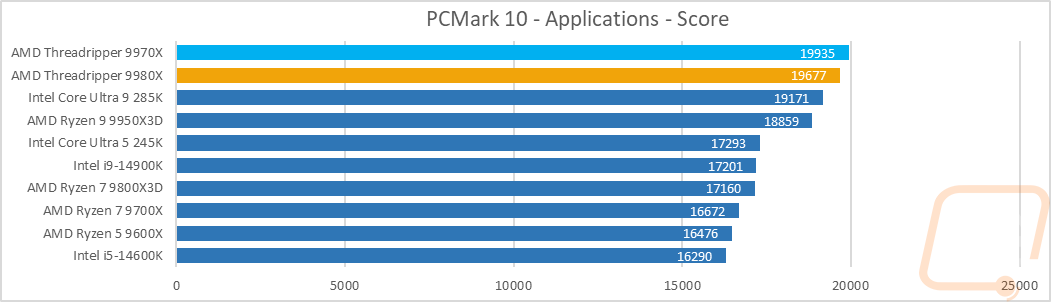
PCMark 10 is a great test because it tests things like video calls, browser performance, Excel, and Word performance to give an idea of real-world performance. It tends to like higher clock speeds, but does take raw core count into account as well, which you can see. The 9980X and 9970X aren’t at the top of this test, it favors clock speed over core count, and you can see that with CPUs like the 9950X3D sitting out in front. For the PCmark 10 applications test, both CPUs do jump back out in front, but even then, the 9970X is on top here, telling us once again that these were limited in thread count and didn’t utilize the 9980X’s twice as many cores.
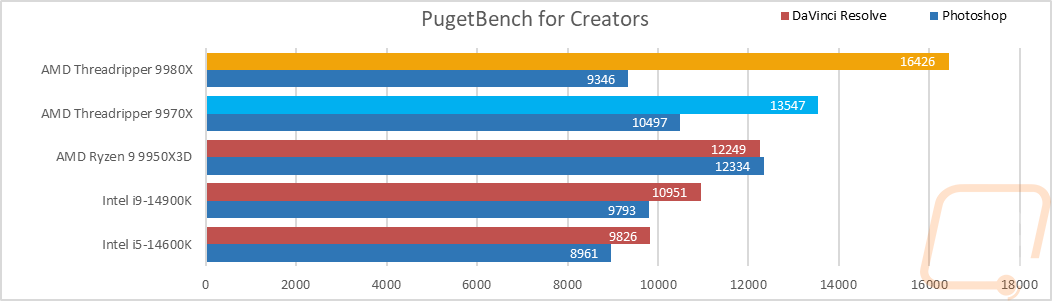
For our last real-world (non-gaming) benchmark, I ran both Photoshop and DaVinci Resolve tests using the PugetBench for Creators benchmark. This gives us a great look at real-world performance using the latest version of both popular programs, which I personally use as well for editing photos and videos. With DaVinci Resolve, the 9980X tops the chart by a good margin, and the 9970X comes in behind it. That same performance isn’t seen with Photoshop, however, with the 9980X coming in behind not just the 9970X, but also the 9950X3D and the 14900K as well. Clearly, it isn’t taking advantage of all 64 cores.
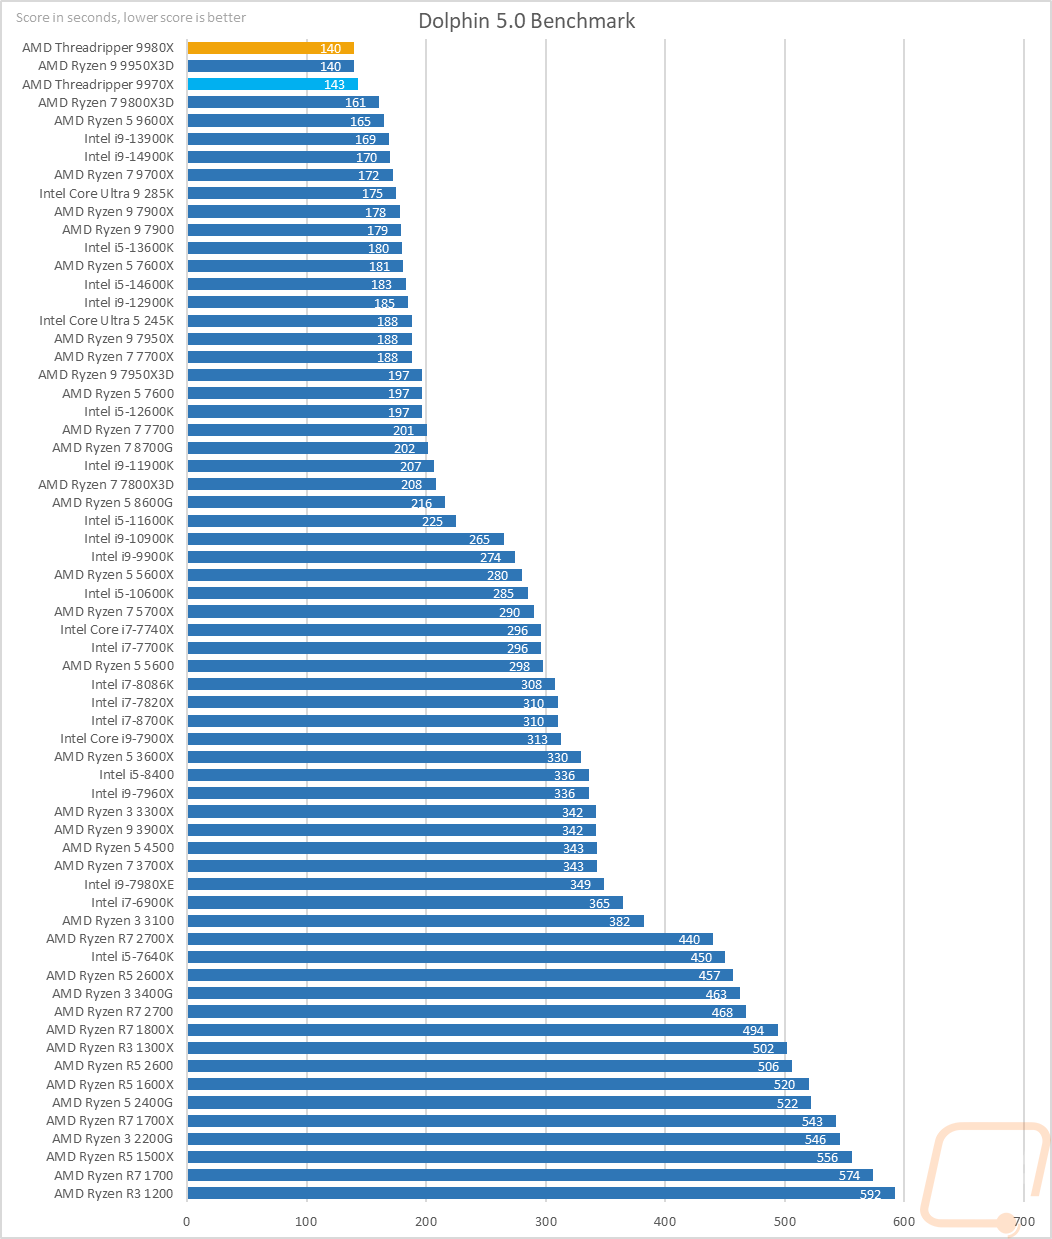
Moving the focus over towards gaming, my next test is using Dolphin 5.0 Benchmark. Dolphin 5.0 is a Wii emulator, and like most emulators, it doesn’t care about high core counts much. Clock speeds are king here most of the time, which is why all of the 5 GHz+ CPUs are at the top of the chart here. The 9980X did still manage to top this chart, utilizing its 5.4 GHz max clock speed, matching the 9950X3D with the 9970X just behind it.
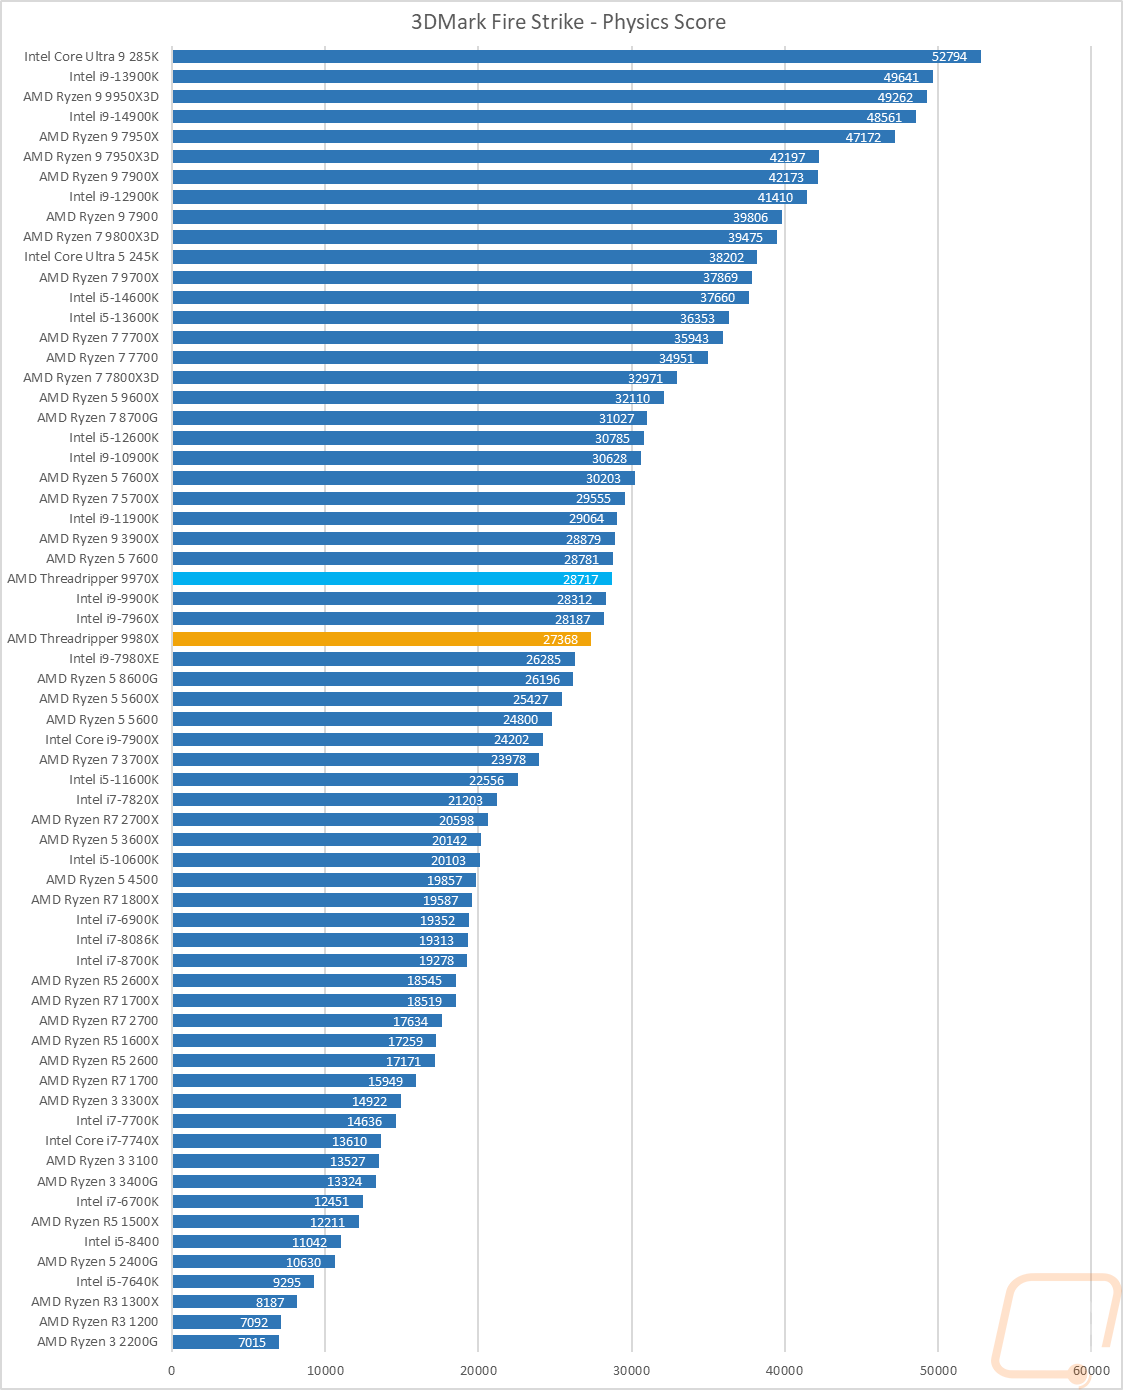
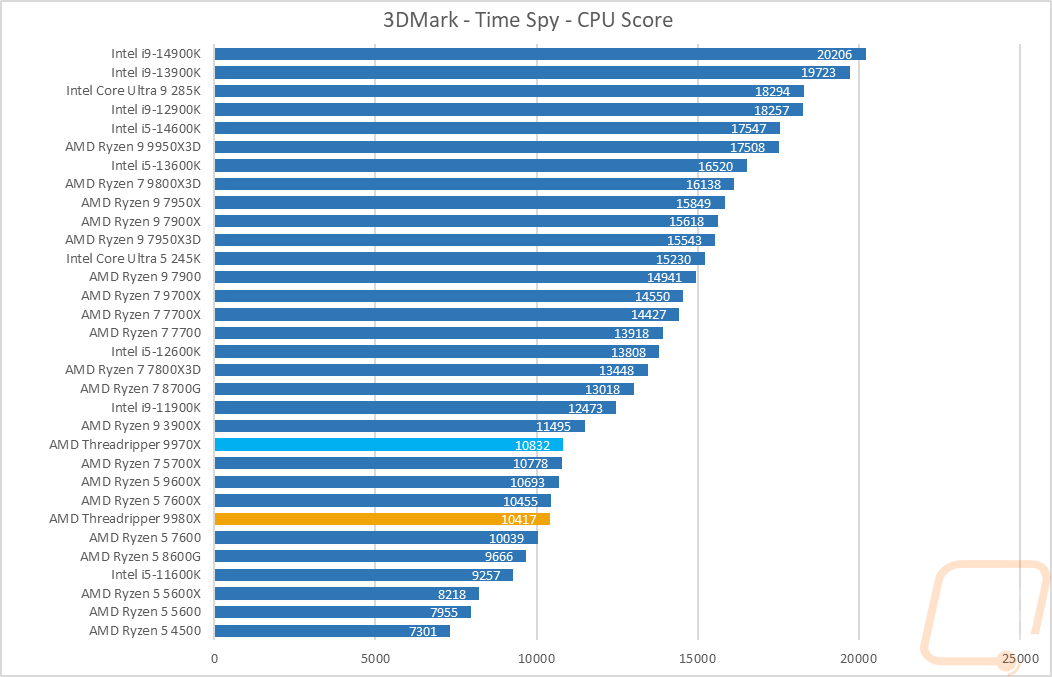
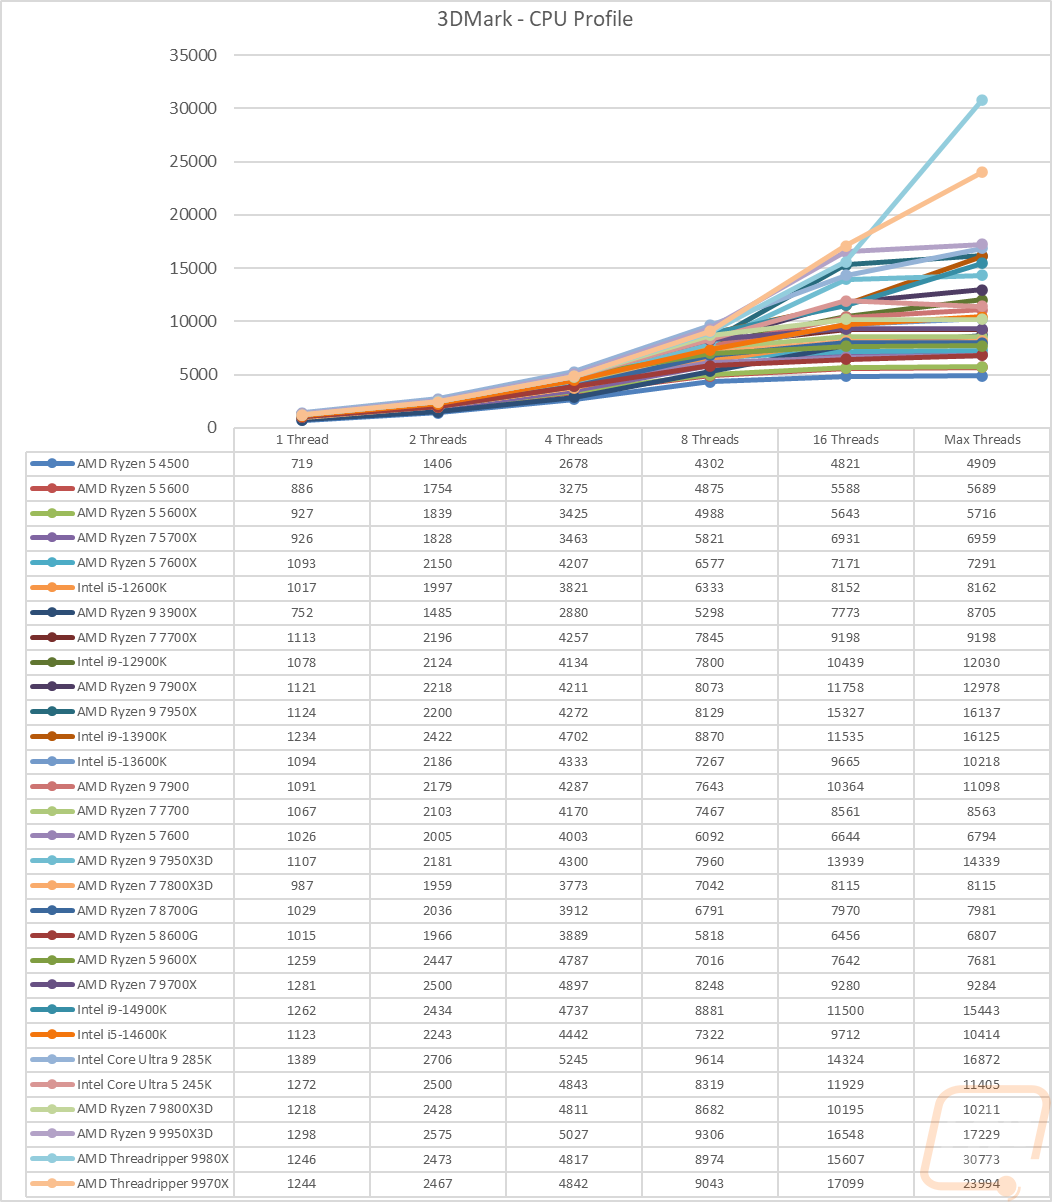
Before diving into game testing, I wanted to check out synthetic performance using 3DMark. I tested with the older DX11 Fire Strike test as well as the newer DX12 Time Spy. I also added the new 3DMark CPU Profile benchmark into the mix as well which does a good job of showing the full range of thread counts that you might see being used in games, as well as a max threads option that does everything above 16 threads. In both the Fire Strike and Time Spy tests, both the 9980X and 9970X show up in the middle of the pack. Let me be clear, these are not gaming CPUs by any measure. With the 9970X coming in ahead of the 9980X, we know 3DMark isn’t utilizing the 64 cores of the 9970X, but that isn’t any different than any other game. I’ve just included these tests as well, even though these CPUs aren’t meant for gaming, so anyone who might be interested in using their new Threadripper build for both creating and gaming. Now the 3DMark CPU profile does put all of the threads to use, and we can see that in the max threads portion of that benchmark. The 9970X was at the top of the chart when limited to 16 threads, but both jumped way up for that last result with the 9980X, of course, on top by an impressive 7000 points.
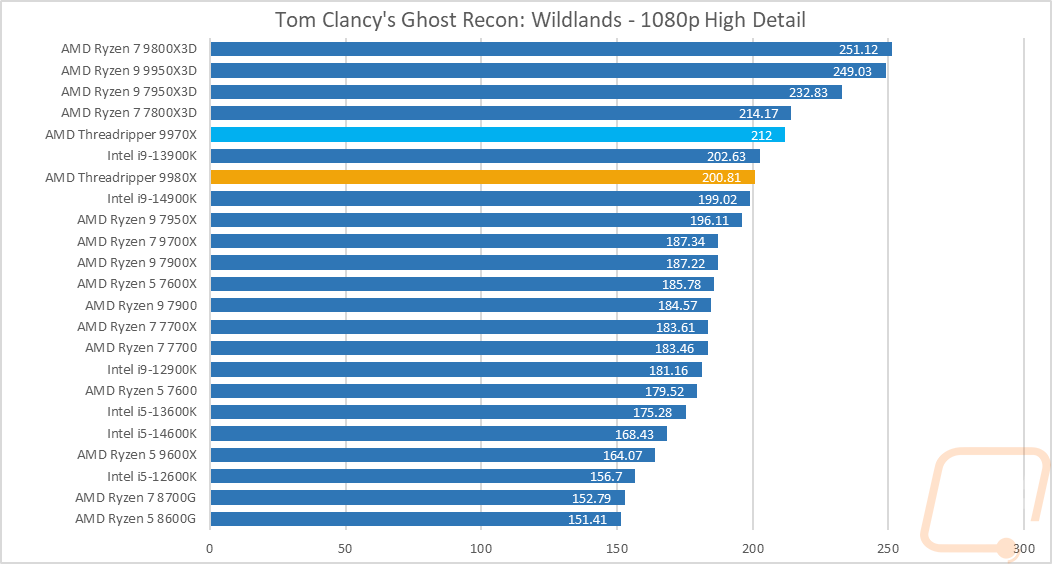
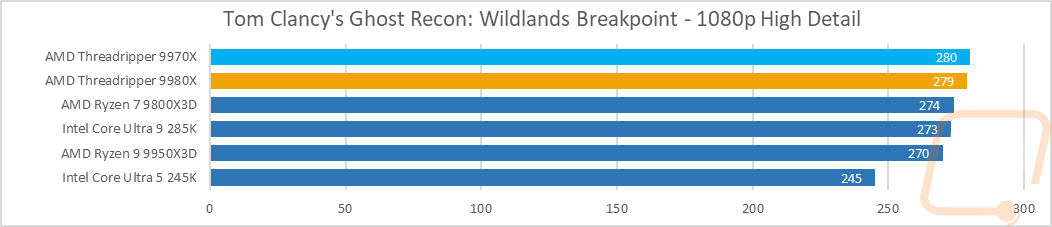
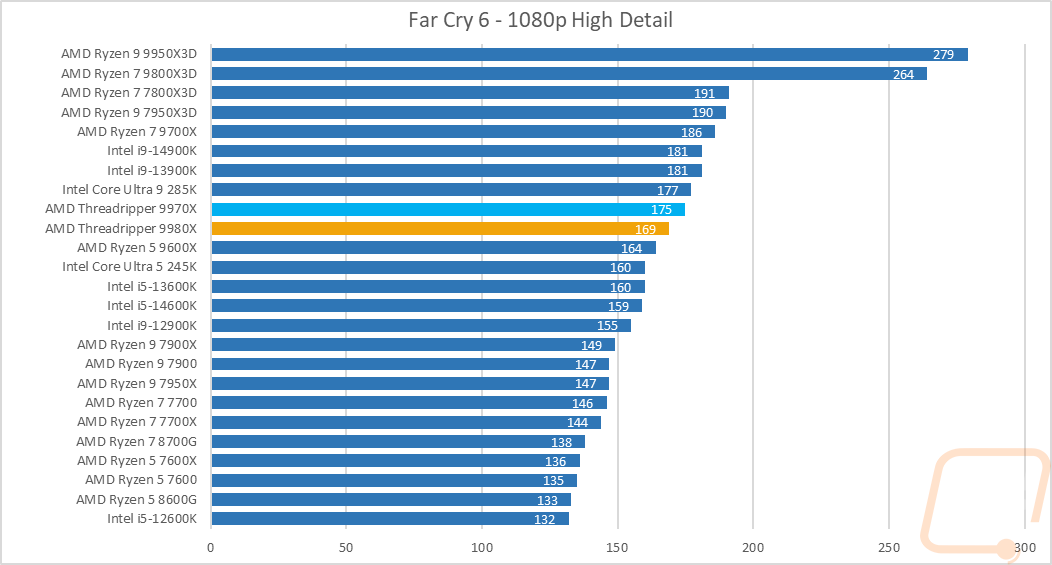
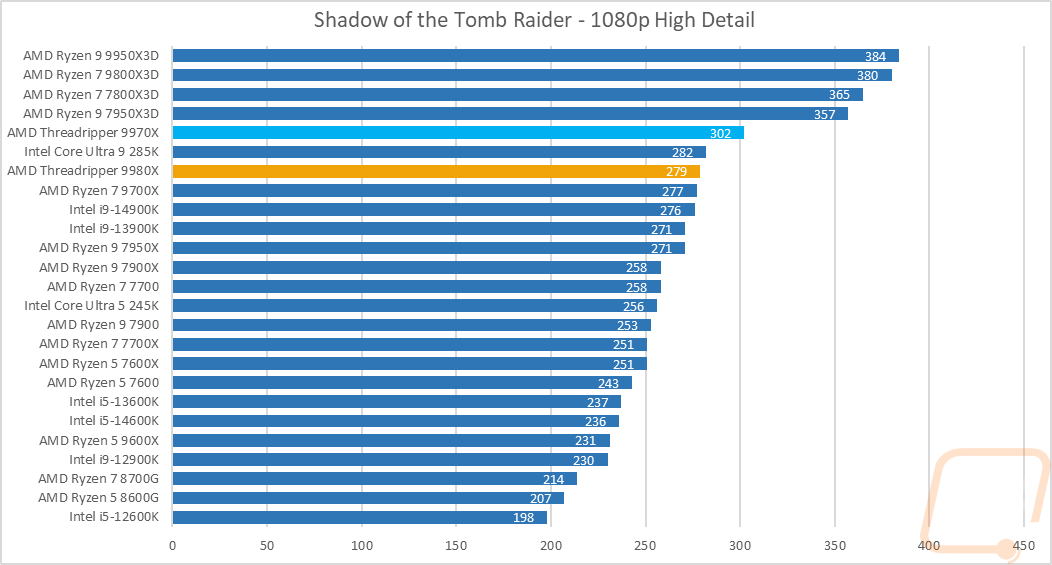
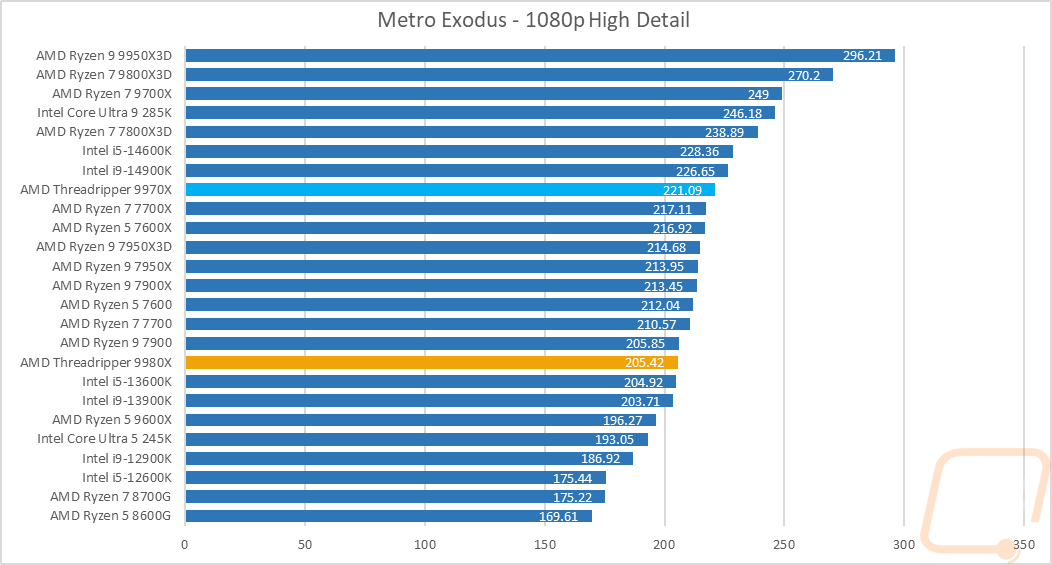
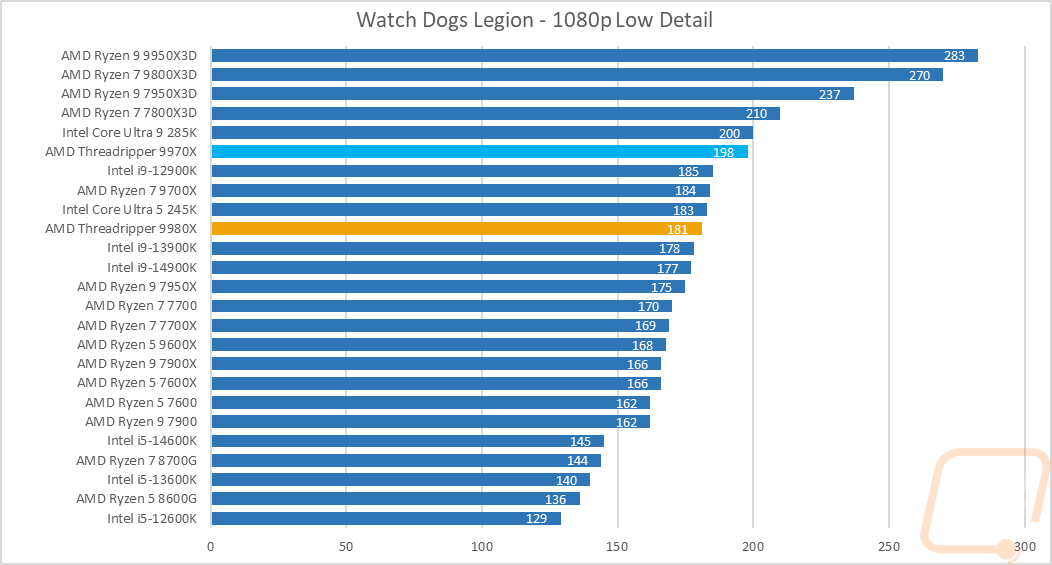
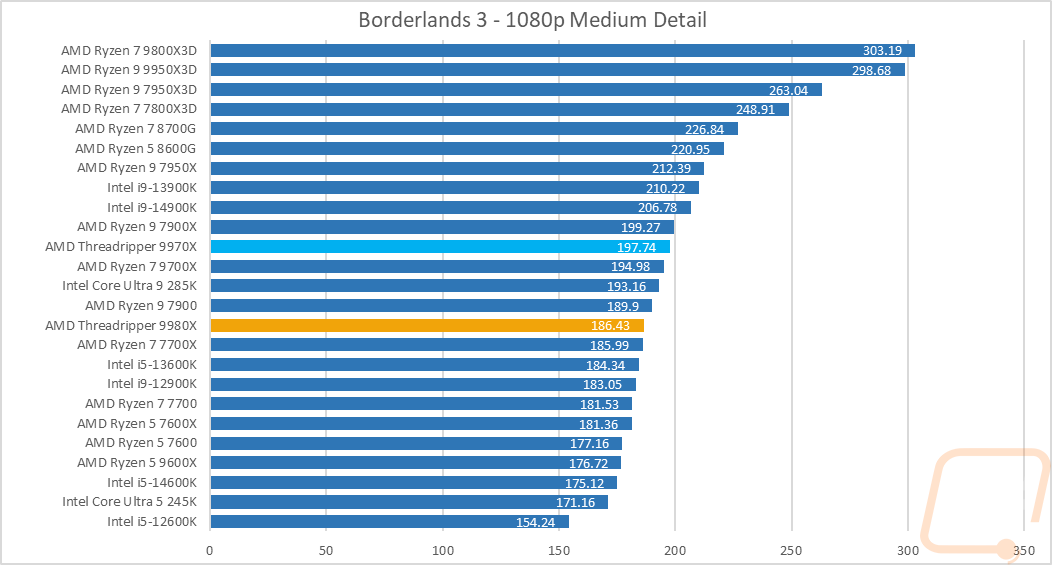
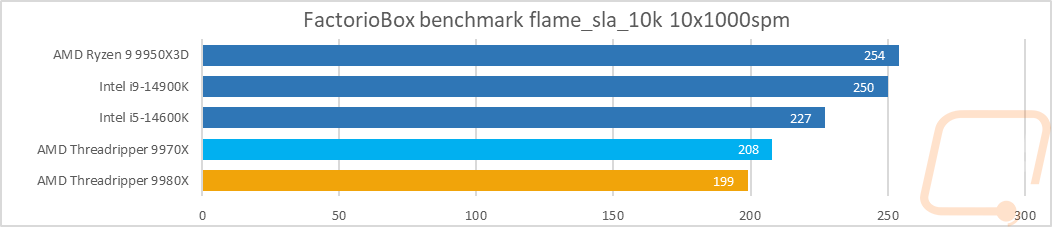
I did, of course, test the two new CPUs in games as well. I said it in the previous test, but I will say it again here. These Threadripper CPUs aren’t designed for gaming. If that is your only goal, then one of the X3D CPUs is still going to be your best option. But they did still hold their own overall. They came in behind all of the X3D CPUs in everything except the Wildlands Breakpoint. But in some of the games, they do still run with CPUs like the 14900K and 285K. There are a few games where both CPUs drop down into the middle of the charts, however. Overall, though, even middle of the pack is still great gaming performance if you are able to also get crazy performance in your work applications.
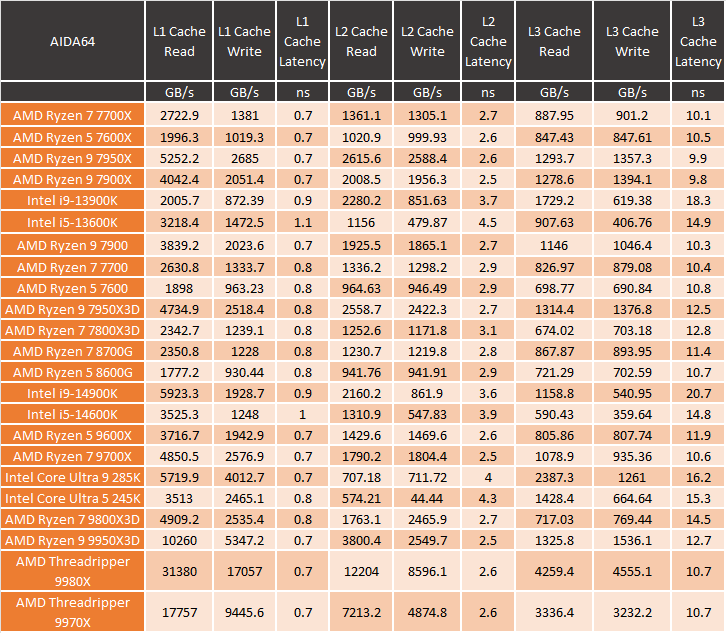
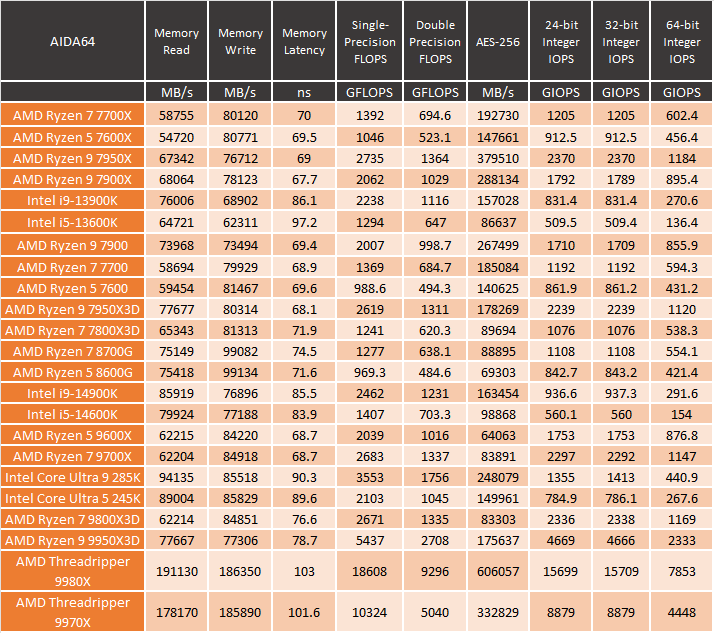
Lastly, I also run the AIDA64 benchmarks as well. These give us a great look at a few aspects, including the full range of cache performance, memory performance, and more. The numbers that stood out for me were the L1, L2, and L3 cache performance for both CPUs (especially the 9980X), with the L2 numbers dwarfing the previously impressive numbers from the 990X3D. Going to quad-channel memory, especially at 6400 MHz, was more than double the improvement on the memory read and write performance, but latency did increase there. Single and Double Precision FLOPS were more than triple that of the 9950X3D, and the same goes for the Integer IOPS numbers as well.