At CES this year AMD announced three upcoming additions to their 7000 Series of CPUs which all featured 3D V-Cache like the popular Ryzen 7 5800X3D. Then late in February, the first two models were released but the third and lowest-priced model of the three, the Ryzen 7 7800X3D wasn’t included. Well, today the embargo lifts on the new 7800X3D and we can finally dive into its performance ahead of it being available in stores tomorrow. So why waste any time, let's quickly go over what sets it apart and then get into its performance.
Product Name: AMD Ryzen 7 7800X3D
Review Sample Provided by: AMD
Written by: Wes Compton
Amazon Affiliate Link: HERE
What is the Ryzen 7 7800X3D
In our coverage of the 7950X3D, I dove into it and the 7900X3D’s unique design which has an asymmetric chiplet layout that combines a traditional CCX alongside of one paired up with AMDs 3D V-Cache. This was AMDs way of utilizing the 3D V-Cache while keeping the cost down when it comes to the 12 and 16-core models that would need twice as much 3D V-Cache. This also allowed them to still utilize the higher frequency standard cache as well. All of that required a specific driver to optimize everything to make sure you were running the optimal configuration at all times. The 7800X3D doesn’t have that configuration, like the 5800X3D before it, the Ryzen 7 7800X3D has just one CCD and doesn’t have to worry about the special optimization because it only has the 3D V-Cache paired up with its 8 cores.
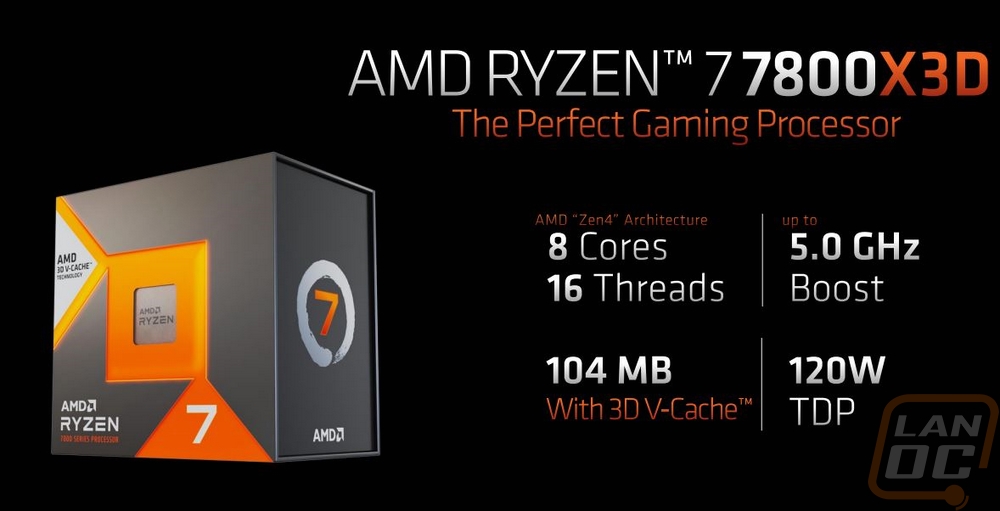
So the core count has dropped down when compared to the 7900X3D and the 7950X3D and this helps better show the focus of each of these CPUs. The 7950X3D and the 7900X3D can game but can also handle content creation. The 7800X3D that we have here today on the other hand is designed with just gaming in mind. The product naming does get interesting though because the 7900X3D and the 7950X3D both had matching non-3D models but there isn’t a 7800X, at least from the Ryzen lineup Intel did have one back in 2017. It actually matches up with the 7700X which has the same 8-core and 16-thread layout. Like with the other 3D models when compared to their counterparts the 7800X3D does have a lower max boost and base boost compared to the 7700X. It still reaches 5 GHz but isn’t up there like the others. The TDP has increased up to 120 watts and the max socket power reflects that increase as well as the EDC and TDC amps as well. Then like the other 3D V-Cache CPUs the TjMax is lower at 89c. The big change however is the l3 Cache which the 7700X has 32MB and the 7800X3D has a crazy 96MB.
|
Specifications |
Ryzen 7 7700X |
Ryzen 7 7800X3D |
Ryzen 9 7900X3D |
Ryzen 9 7950X3D |
|
Cores/Threads |
8/16 |
12/24 |
16/32 |
|
|
Max Boost |
5.4 GHz |
5 GHz |
5.6 GHz |
5.7 GHz |
|
Base Clock |
4.5 GHz |
4.2 GHz |
4.4 GHz |
4.2 GHz |
|
L2 Cache |
8 x 1 MB |
12 x 1MB |
16 x 1MB |
|
|
L3 |
32MB |
96MB |
128MB |
|
|
TDP |
105W |
120W |
||
|
Max Socket Power (PPT) |
142W |
162W |
||
|
Max Current (EDC) |
170A |
180A |
||
|
Max Current Thermally Limited (TDC) |
110A |
120A |
||
|
TjMax |
95c |
89c |
||
|
Boost Algorithm |
Precision Boost 2 |
|||
|
Max Memory Speed (Non-OC) |
DDR5-5200 (2x16GB) |
|||
|
ECC Support |
Enabled in-silicon, support varies by motherboard |
|||
|
CCD Die Size |
70mm ² |
|||
|
CCD Transistor Count |
6.5 Billion |
|||
|
IOD Die Size |
122mm ² |
|||
|
IOD Transistor Count |
3.4 billion |
|||
|
MSRP |
$299 |
$449 |
$699 |
$699 |
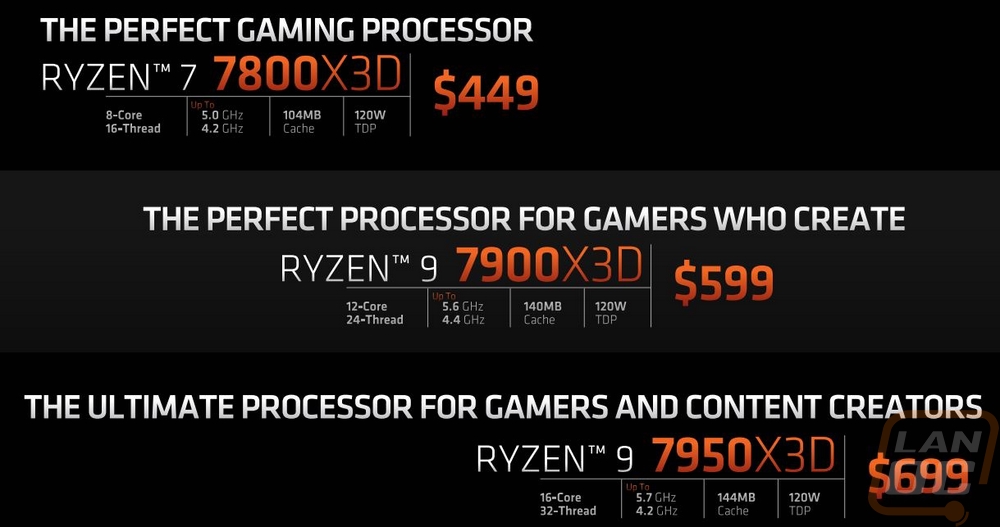
The 7800X3D has a significantly lower MSRP than the 7950X3D which is $699 and the 7900X3D is $599. It has an MSRP of $449 which is $50 higher than the 7700X. The 7900 fits in a weird spot with its lowered price being $30 less as well but anyone gaming is still going to be looking at the 7800X3D, especially with it being the lowest-priced model with 3D V-Cache.
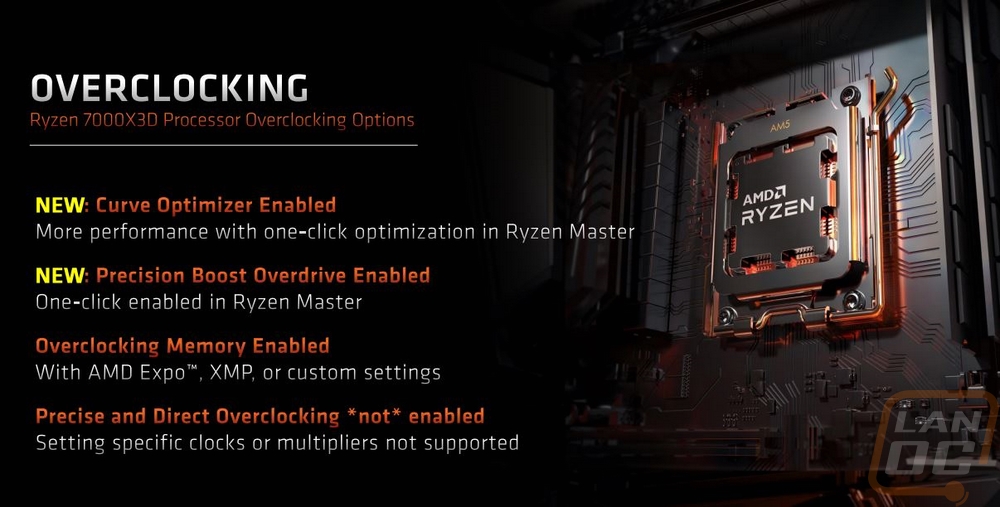
Like with the other 3D V-Cache CPUs, the 7800X3D is limited in its overclocking capabilities. You can turn on the curve optimizer and precision boost overdrive but you don’t have access to manual overclocks. Memory is fine though with Expo, XMP, or custom setting changes available.
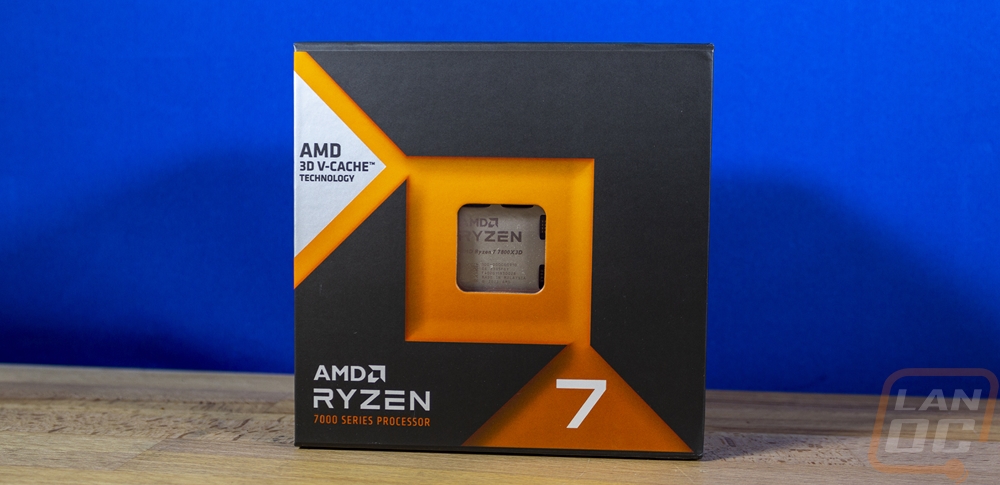
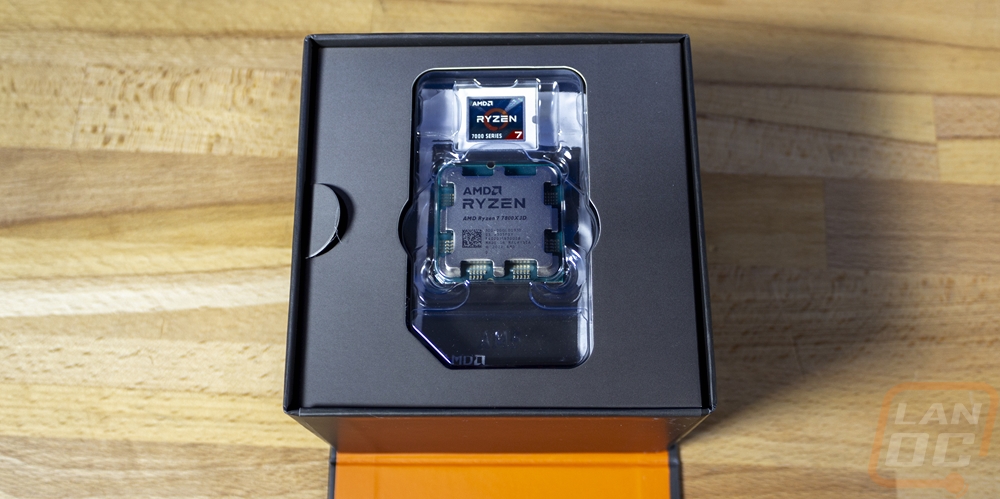
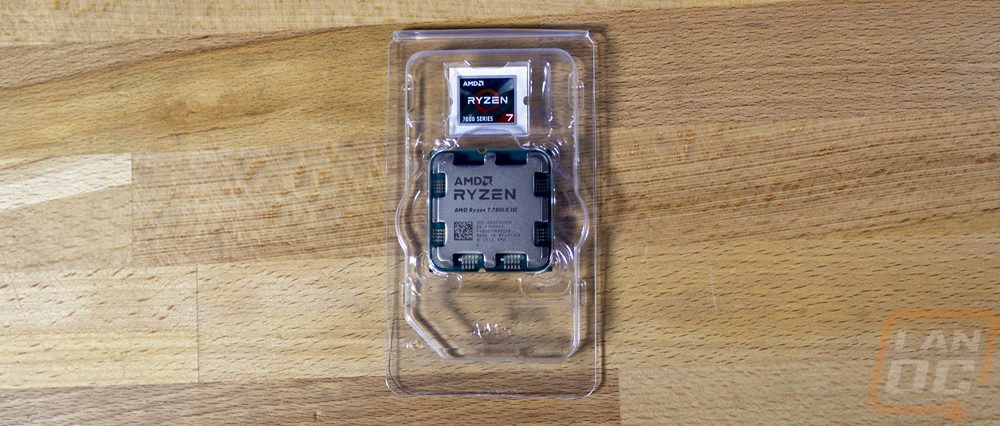
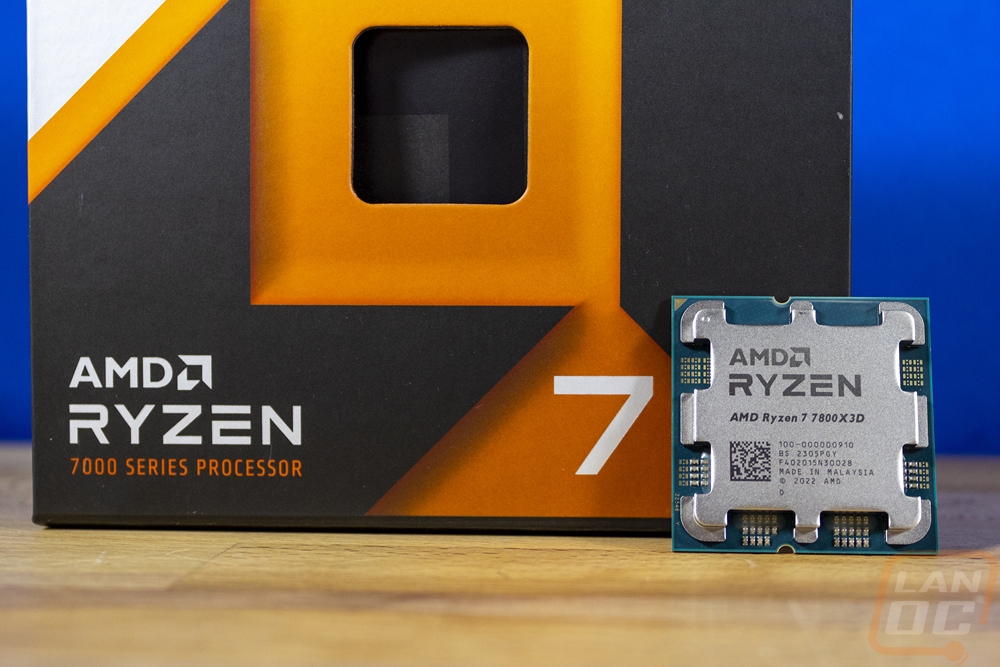
AMD did send out our sample in the retail packaging which I always dig. Especially with the orange trim on the box and they did highlight the 3D V-Cache with the silver arrow having it mentioned and pointing right to the CPU window in the center that lets you see the actual CPU. Like the other 3D models, the 7800X3D doesn’t come with a cooler so the larger box is filled mostly with foam to fill that space. Inside you get a small piece of paper with installation instructions and the warranty information and another small piece of paper with a QR code to join the AMD Red Team. The CPU comes in their standard clear plastic clamshell as well which keeps it safe but lets it be seen through the window.
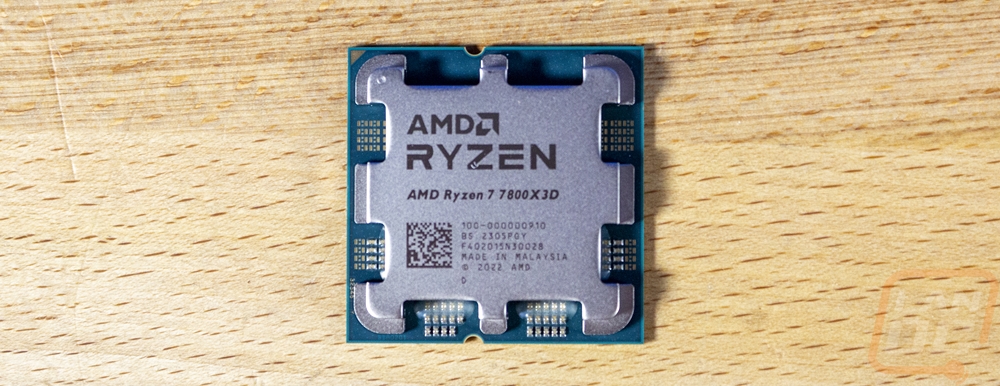
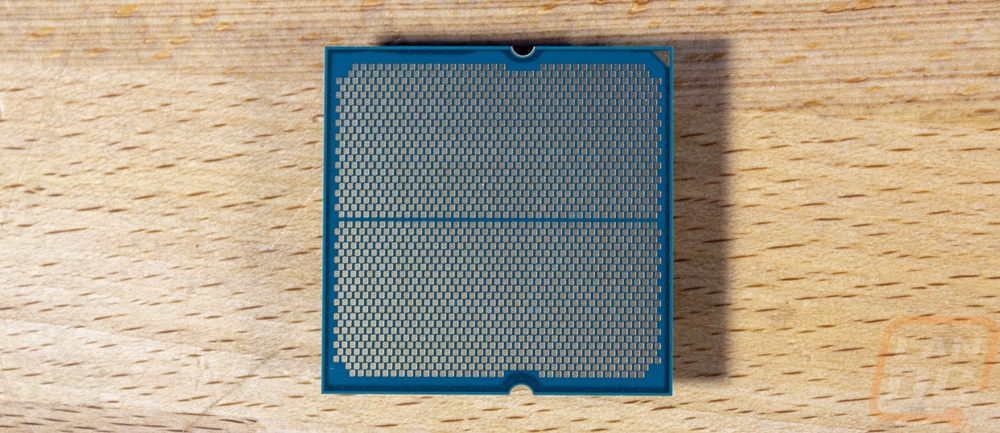
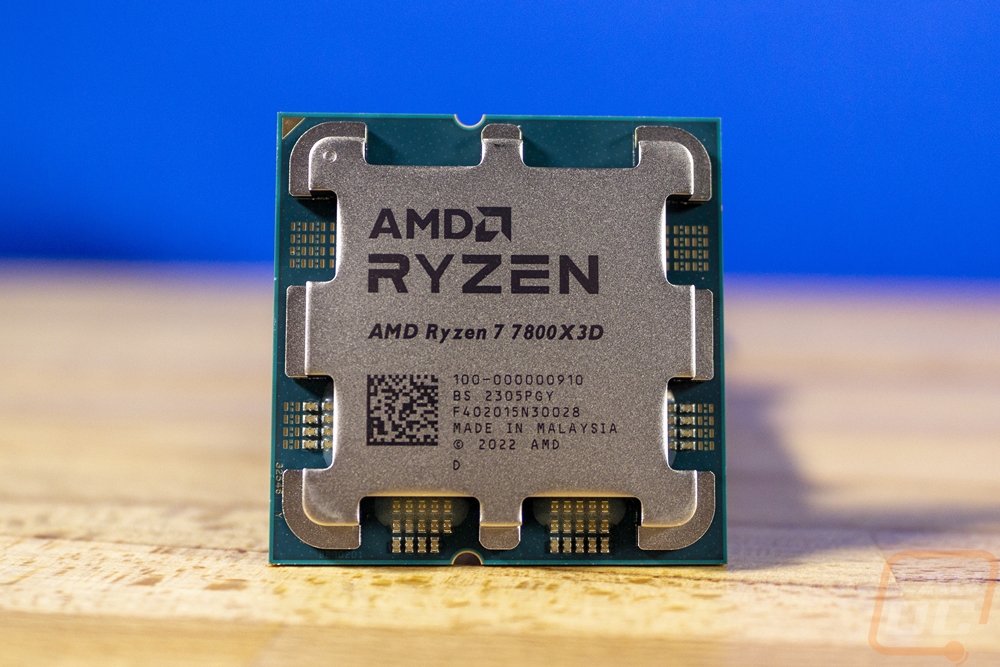
If you haven’t seen any of the new AMD AM5 CPUs there will be a few big surprises here. For starters, the clunky heat spreader of past Ryzen CPUs isn’t there. They have replaced that with the unique design that they originally showed on the 5800X3D announcement but wasn’t featured on the actual 5800X3D. Below that, though you will see that the CPU doesn’t have any pins, it now has an LGA-style socket like Intel has run for years. This does mean that the CPU is a little less likely to be damaged which is nice but that risk has been transferred to the motherboard socket, so be careful there. As always AMD has the heat spreader etched with the AMD Ryzen branding which looks great and the model name is just below that before getting the serial and build and revision info below that.
Test Rig and Procedures
Test System
Motherboard: ASUS ROG Crosshair X670E Hero - Live Pricing
Cooling: Corsair iCUE H100i ELITE LCD Liquid CPU Cooler - Live Pricing
Noctua NT-H1 Thermal Paste - Live Pricing
Memory: G.Skill Trident Z5 Neo DDR5 16GBx2 6000MHz - Live Pricing
Storage: Kingston FURY Renegade 2TB PCIe 4.0 SSD- Live Pricing
Video Card: Nvidia RTX 4090 FE - Live Pricing
Power Supply: Corsair AX1200 - Live Pricing
Case: Primochill Wetbench - Live Pricing
OS: Windows 11 Pro 64-bit - Live Pricing
|
CPU Testing Procedures |
|
|
Blender |
Using official benchmark using 3.4.0 |
|
Handbrake |
Tested using 2d 4k 60 FPS version, resized using the Fast 1080p30 preset, average FPS used. Here is the file download location http://bbb3d.renderfarming.net/download.html |
|
Cinebench R20 |
CPU and CPU (Single Core results) |
|
Cinebench R23 |
CPU and CPU (Single Core results) |
|
POV-Ray |
Using built-in benchmark. Settings are all set to the "Standard Benchmark Switches" listed on http://www.povray.org/download/benchmark.php |
|
V-Ray Benchmark 1.0.8 |
CPU Benchmark time used as the score |
|
V-Ray Benchmark 5.0.2 |
vsamples score |
|
CPUz |
CPUz's built-in benchmark on 17.01.64 version, both single and multi-core scores |
|
wPrime |
1024M Setting, core count set to the number of threads the CPU has |
|
7-Zip |
Built-in benchmark set to 32MB, which runs 10 passes. Combined MIPS, Compressing, and Decompressing scores were all used. Just the Current result, not the resulting |
|
JetStream 2 - BrowserBench |
Core from website test using Chrome https://browserbench.org/JetStream2.0/ |
|
Passmark 10 |
CPU Mark Score |
|
Crossmark |
Benchmark from BapCo using Revision 1.2 documenting the overall score |
|
PCMark 10 |
Normal test ran, not the express or extended |
|
Procyon |
Office productivity benchmark is done with the current Microsoft Office 365, Photo Editing Benchmark is done with Adobe Photoshop and Lightroom Classic. All products are running on the latest version at the time of testing |
|
Dolphin 5.0 Benchmark |
This benchmark runs automatically and at the end gives you a time result in seconds https://bit.ly/2dpa9n3 |
|
3DMark |
Fire Strike - Physics Score – Performance benchmark, Time Spy - CPU Score, and CPU Profile test |
|
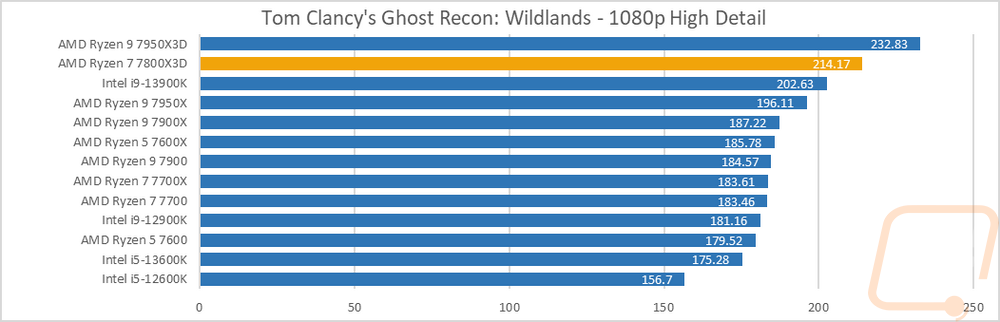
Tom Clancy's Ghost Recon: Wildlands |
Built-in Benchmark, 1080p, High detail setting |
|
Team Fortress 2 |
1080p – high, very high, high, reflect world, high, enabled, 8x msaa, x16, multicore on. https://bit.ly/2vOebin |
|
CS:GO |
This test is done using the workshop map called CS:GO Benchmark. You can find more information at this link. https://www.gamingpcbuilder.com/how-to-install-csgo-fps-benchmark-map/ I test at 1080p resolution. All auto settings are turned off and detail is set to their highest settings. shadow quality high, model texture detail high, shader detail very high, AA set to 16x, uber shaders enabled |
|
Dirt 5 |
Built-in benchmark, running at 1080p on all three resolution settings, V-Sync is turned off, dynamic resolution is turned off, and on the medium detail setting |
|
Far Cry 6 |
1080p with High Detail setting using the built-in benchmark |
|
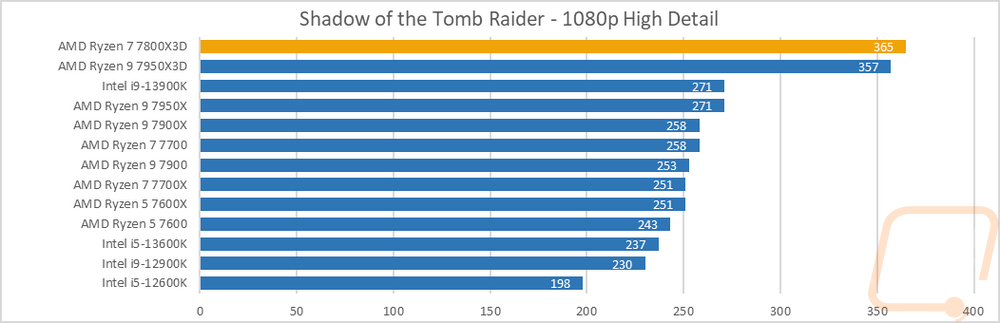
Shadow of the Tomb Raider |
Built-in benchmark, 1080p, high detail setting, RTX/DLSS Off |
|
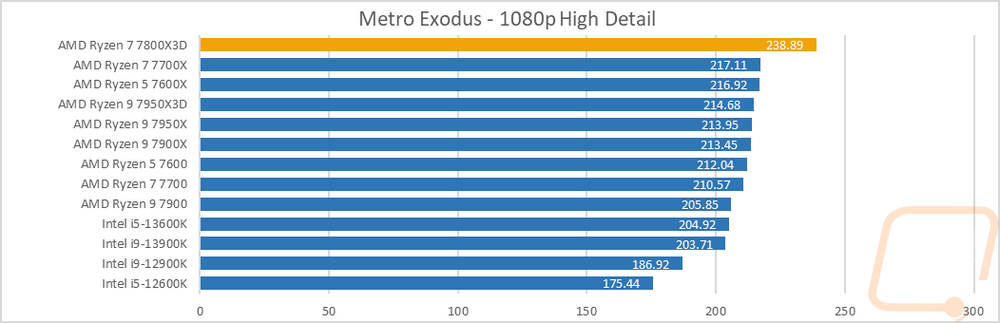
Metro Exodus |
Default benchmark with High profile which has 1080p and high detail |
|
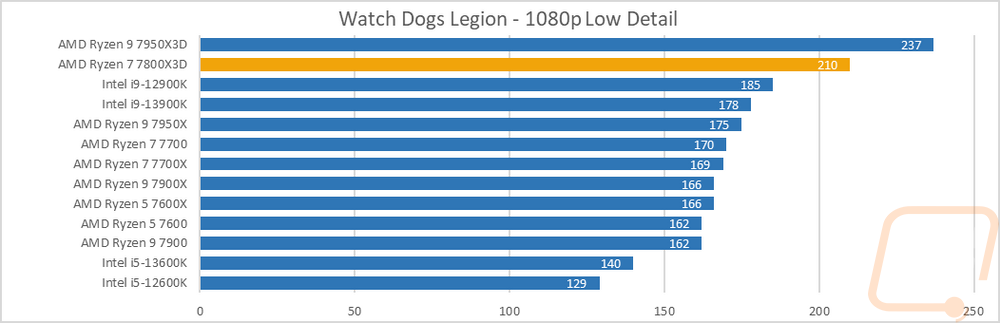
Watch Dogs Legion |
Built in benchmark, 1080p, dx12, low detail |
|
Borderlands 3 |
Built-in benchmark. fullscreen, 1080p, medium quality, dx11 |
|
Power Usage |
Idle and load testing using a Kill-A-Watt and wPrime to put the CPU under load and again with the AIDA64 FPU CPU workload |
|
Temps |
Aida64 FPU stability test to load and record temperature readings |
|
AIDA64 |
Memory, Cache, and FLOPS testing done with built-in GPGPU and Memory benchmarks |
|
Onboard Testing Procedures |
|
|
3DMark |
Fire Strike and Time Spy benchmarks GPU score not the overall score |
|
Unigine Superposition |
720p Low and 1080p Medium settings |
|
Team Fortress 2 |
1080p – high, very high, high, reflect world, high, enabled, 8x msaa, x16, multicore on. https://bit.ly/2vOebin |
|
Tom Clancy's Ghost Recon: Wildlands |
Built-in Benchmark, 1080p, Low detail setting |
|
Tomb Raider |
Adrenaline Action Benchmark Tool on the “Medium” quality setting at 1080p |
|
Hitman: Absolution |
Adrenaline Action Benchmark Tool on the “Medium” quality setting at 1080p |
|
Borderlands 3 |
In-Game benchmark, 1080p, Low detail preset |
|
Far Cry 5 |
1080p, Lowest Detail setting, In game benchmark |
|
Shadow of the Tomb Raider |
1080p, Low Detail setting, In-game benchmark, RTX/DLSS off |
CPU Performance
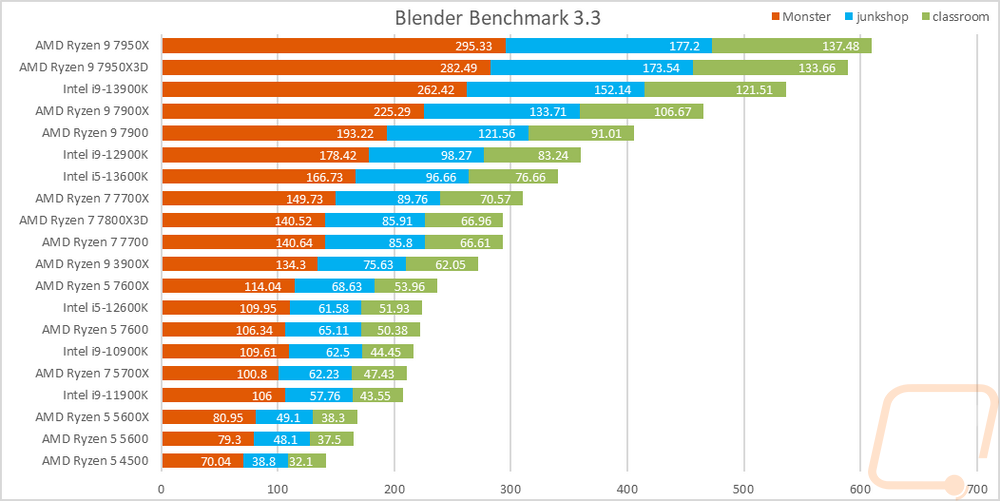
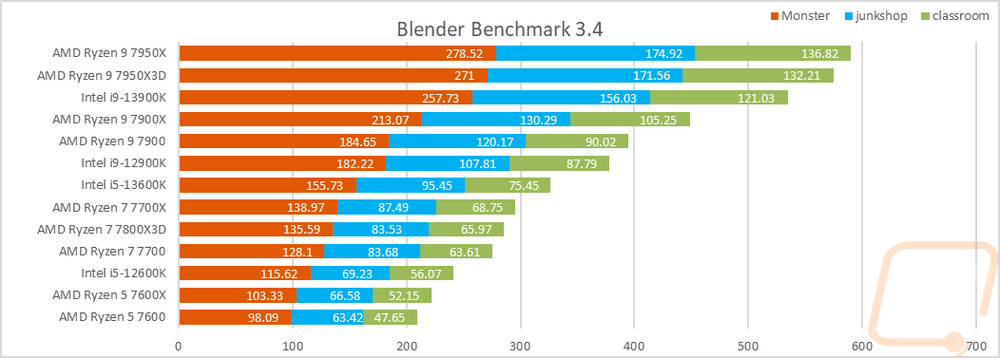
To start testing off I went with a rendering-focused benchmark with the always popular Blender. This benchmark was recently updated so our result list is smaller here. I have all three tests stacked together so we can see an overall of them altogether. Blender loves the higher core counts but clock speed does still make a difference. The 7800X3D is middle of the pack on both and the 3D V-Stacked cache doesn’t help in this situation so its performance in the older and newer Blender tests have it right with or just ahead of the 7700 and behind the 7700X which has a higher clock speed and the same core count.
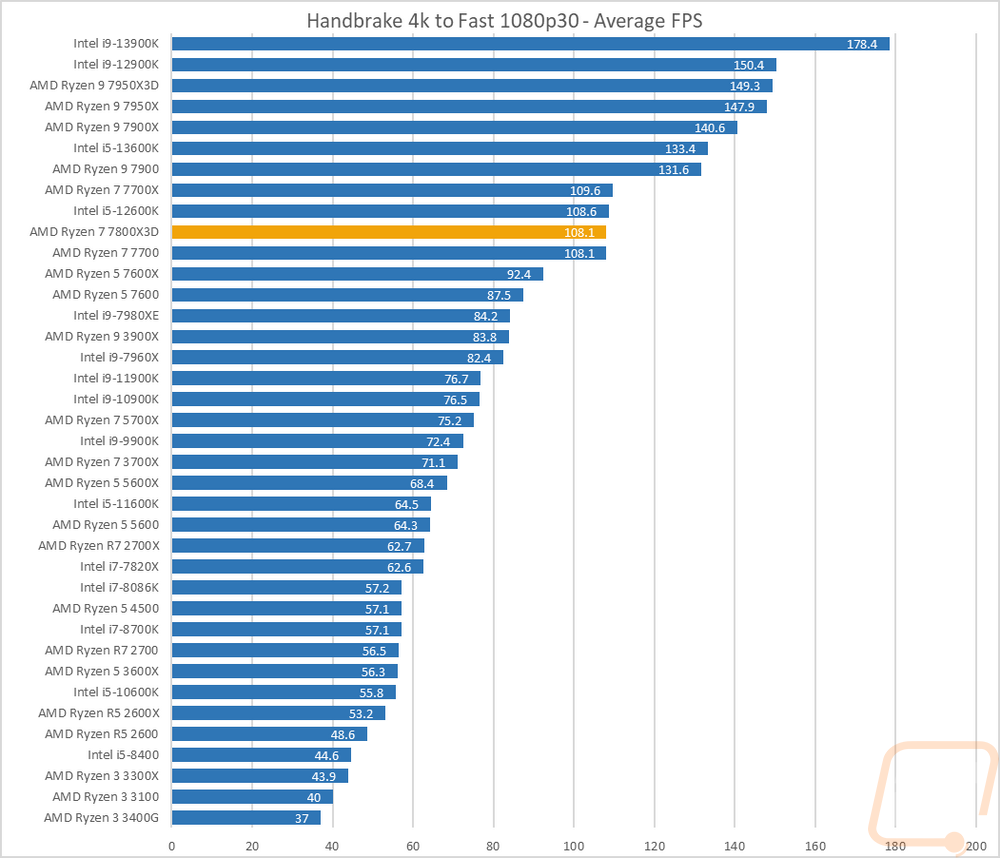
Continuing with the video encoding theme I also have Handbrake which is an open-source transcoder. For this test I am taking a 4k video down to 1080p 30 FPS, the results are the average FPS of that task. The Ryzen 7 7800X3D averaged 108.1 FPS which tied it with the Ryzen 7 7700 and it is one FPS behind the higher clocked 7700X.
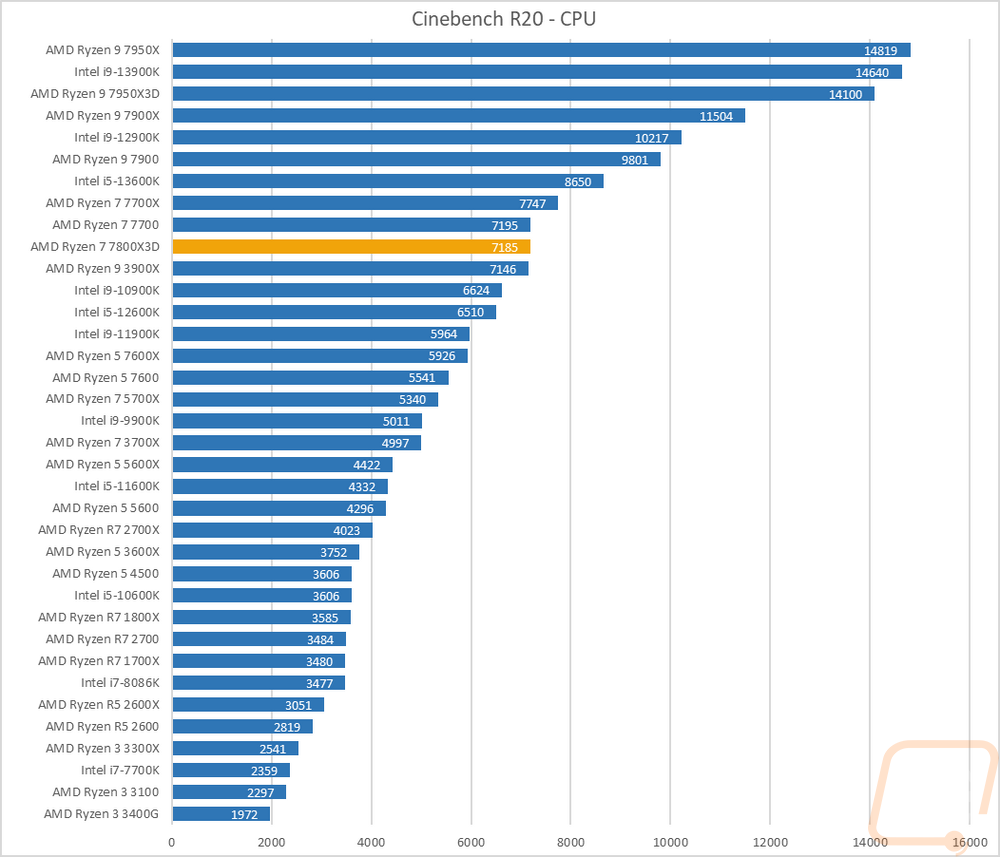
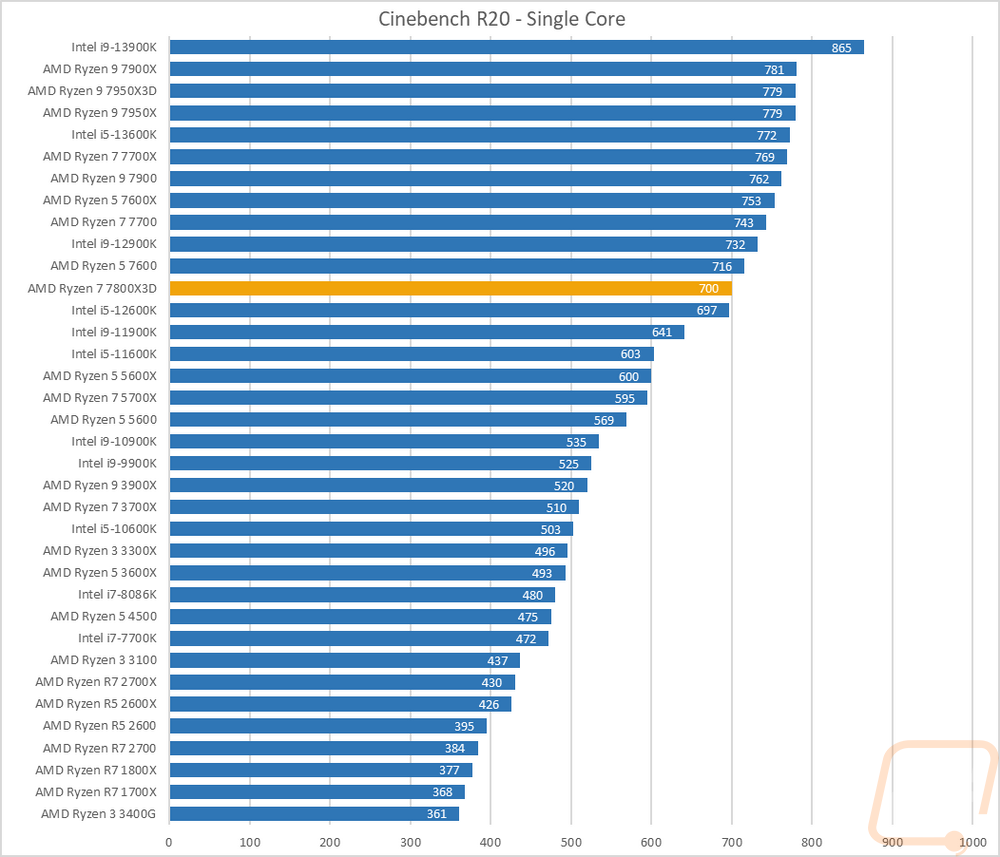
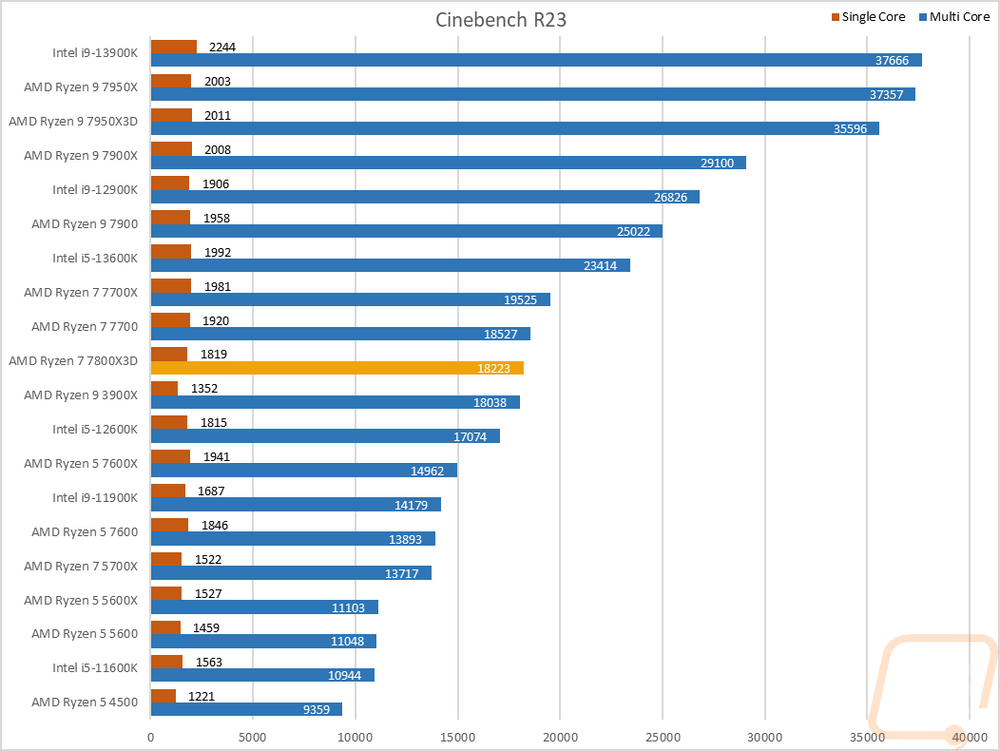
For the always popular Cinebench, I am testing with the current R23 and the slightly older Cinebench R20. I always like Cinebench because we have multi-core and single-core performance which gives us a good look at the performance of the whole CPU and IPC performance. In R20 on the multi-core test, the Ryzen 7 7800X3D is right with the 7700 in the multicore R20 test and for the R23 test, it is a hair below it. For the single core tests the 7800X3D was down lower below the 7600 on both tests. The 7600 has a boost clock of 5.1 GHz whereas the 7800X3D is 5 GHz flat so that makes sense.
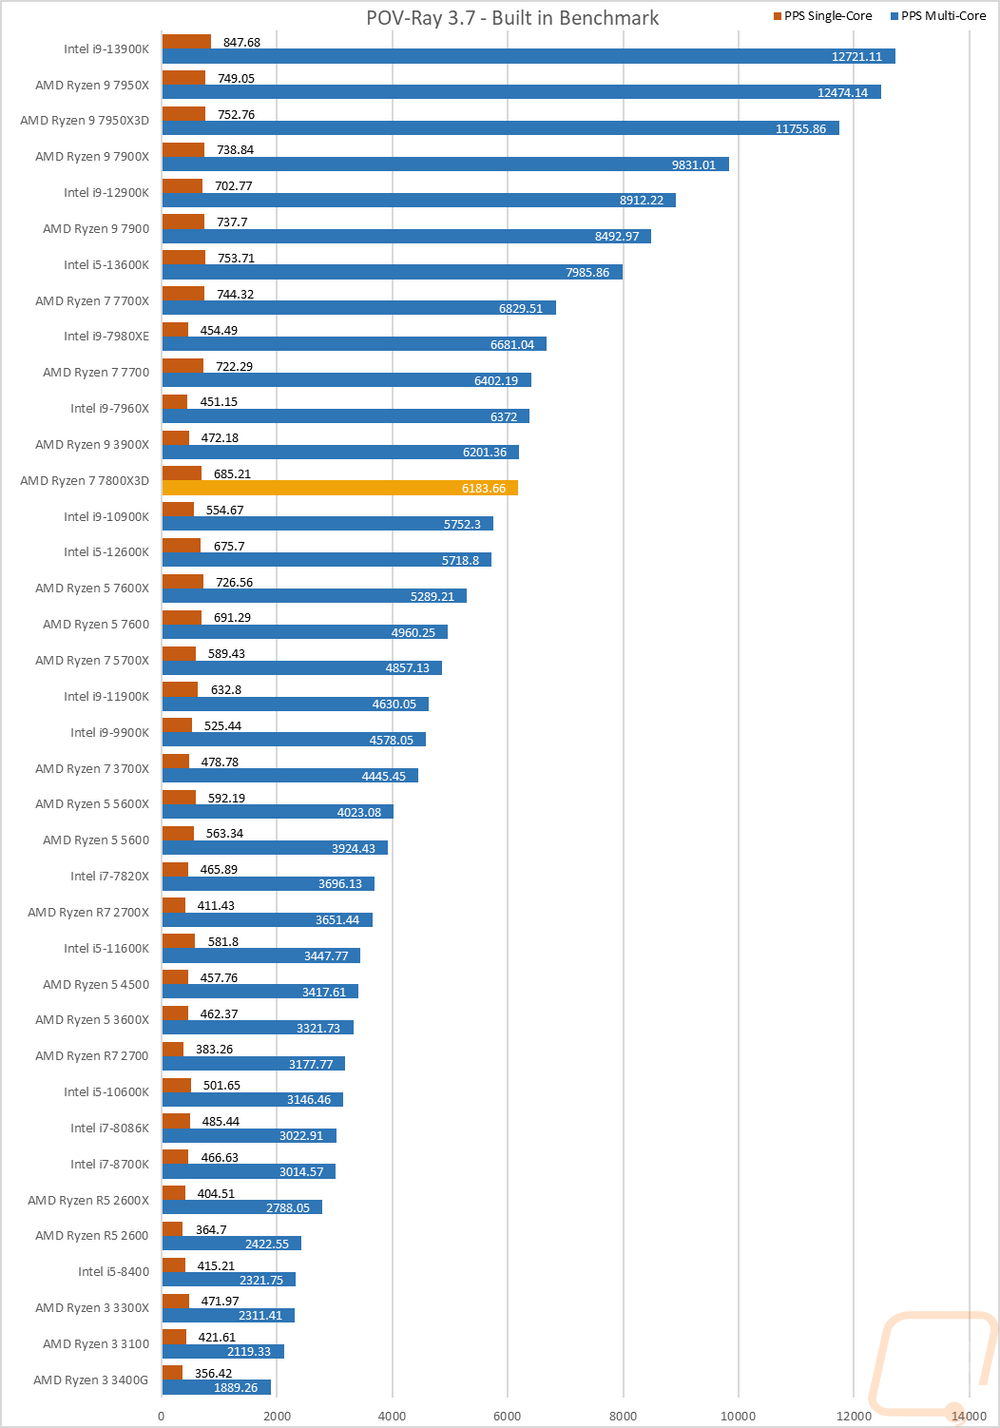
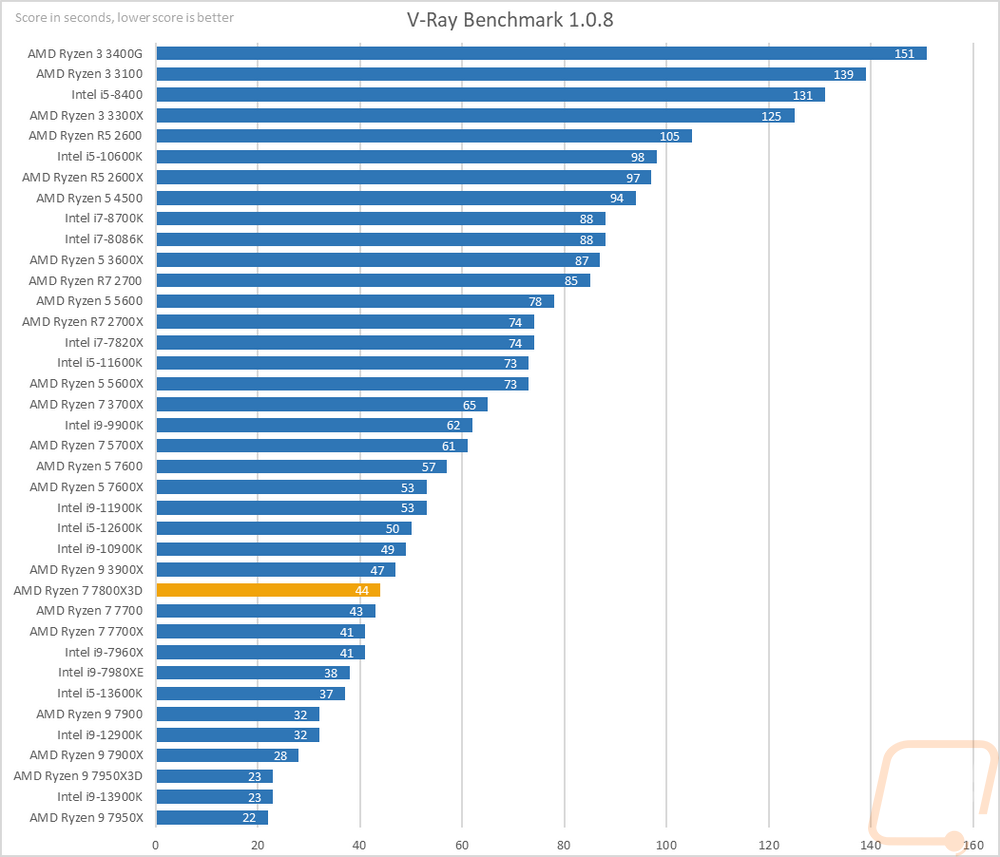
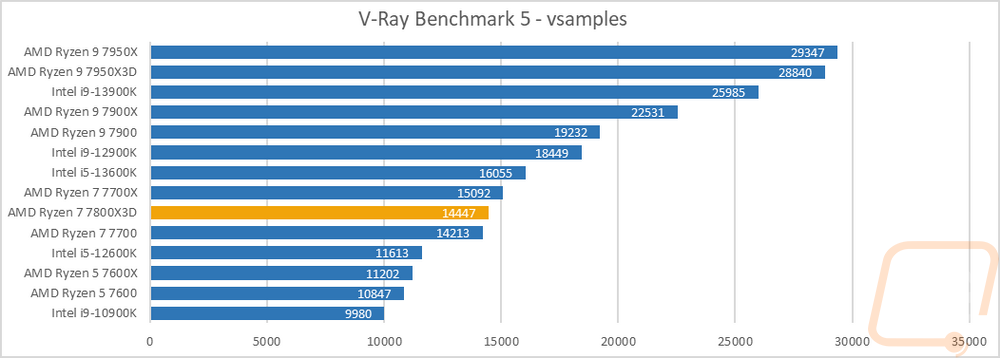
Next up we have ray tracing-focused rendering benchmarks. Here I tested the CPUs in POV-Ray and V-Ray including the newer V-Ray Benchmark 5. POV-Ray was also tested with a single core and across all of the cores. The 7800X3D is sitting between the 7700 and the 7600X in POV-Ray multi-core test and for the single core it was down below the 7600 due to the 7600 having a higher boost clock speed. The older V-Ray benchmark has the 7800X3D sitting 1 second behind the 7700 and 9 seconds faster than the 7600X. The newer V-Ray Benchmark 5 is a little different, for that test the 7800X3D does edge up in front of the 7700 but behind the 7700X.
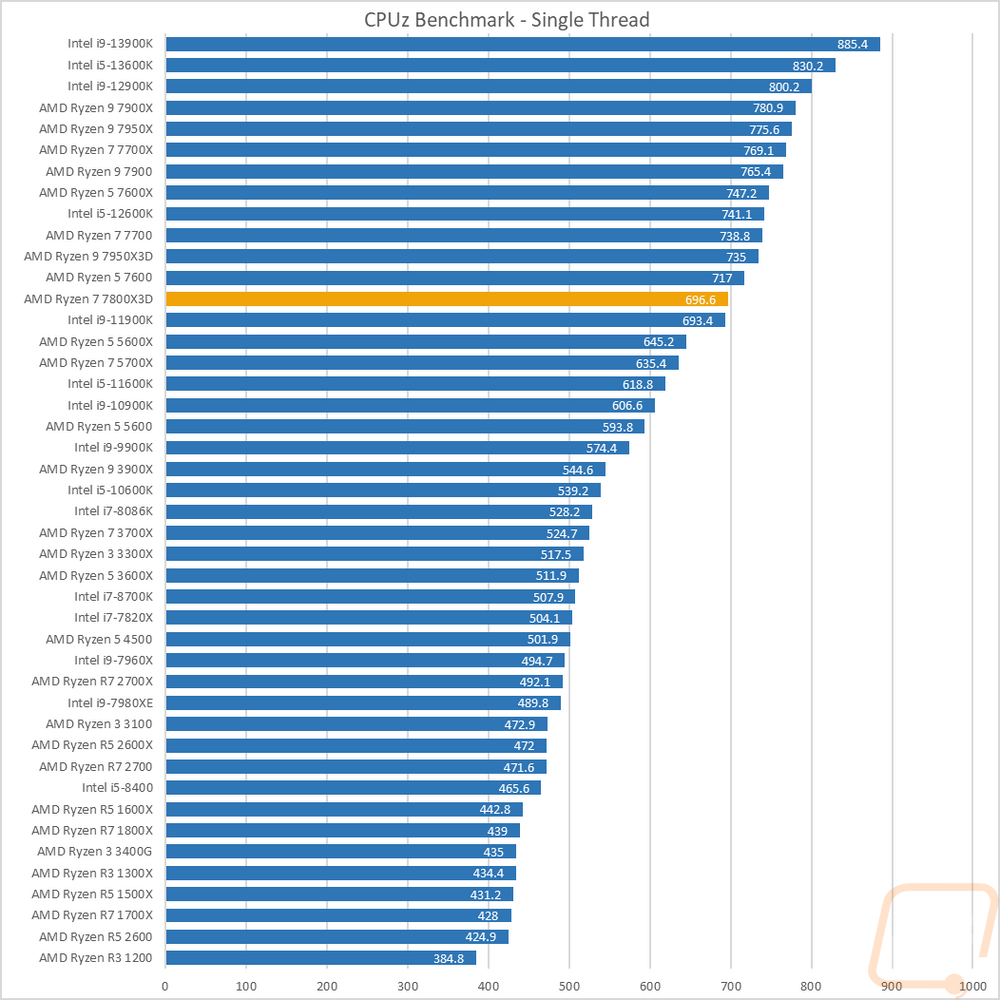
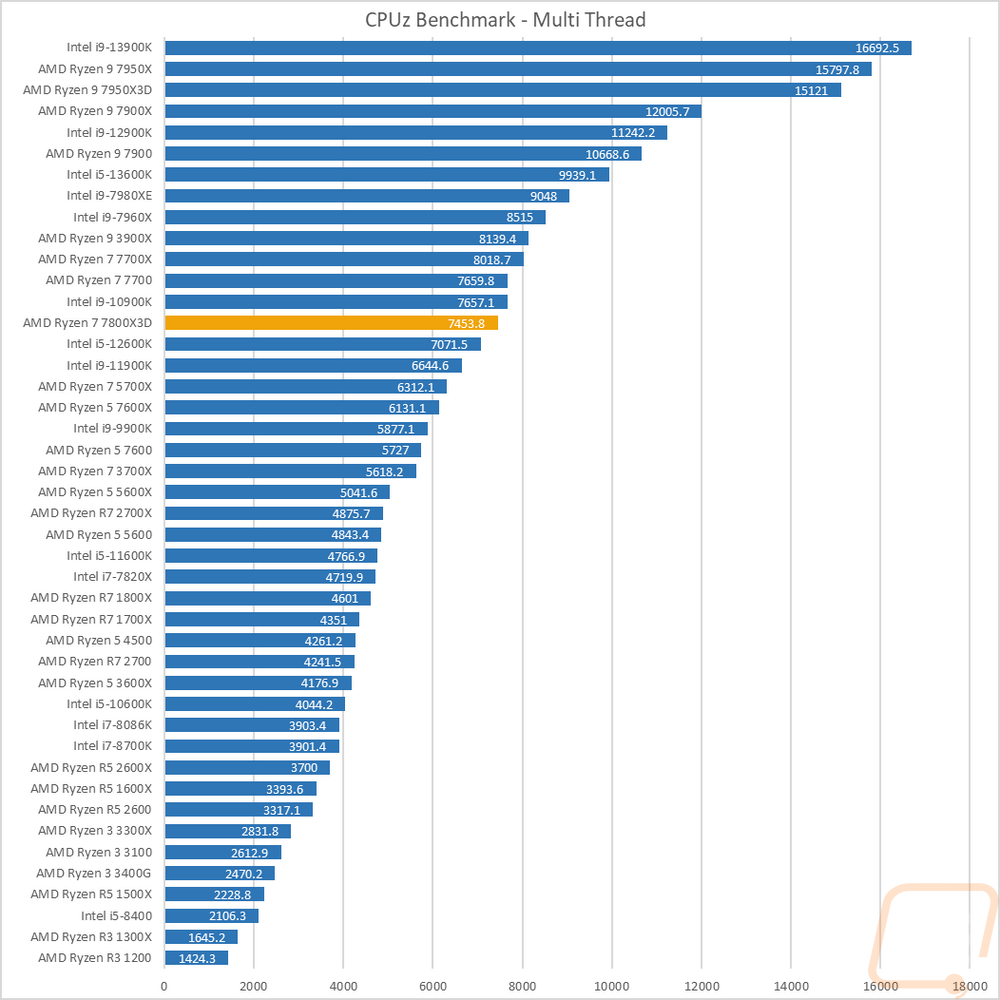
I also tested using the CPUz’s built-in benchmark which does run on a single thread and with all threads. In the multi-thread test, the 7800X3D is sitting below the older 10900K and above the 12600K. As far as compared to the current 7000 series Ryzen CPUs it is way out in front of the 7600X but slightly behind the 7700. For the single-threaded test however, the 7800X3D is behind the 7600 but out in front of all of the older Intel and AMD models with sub 5GHz boost clocks.
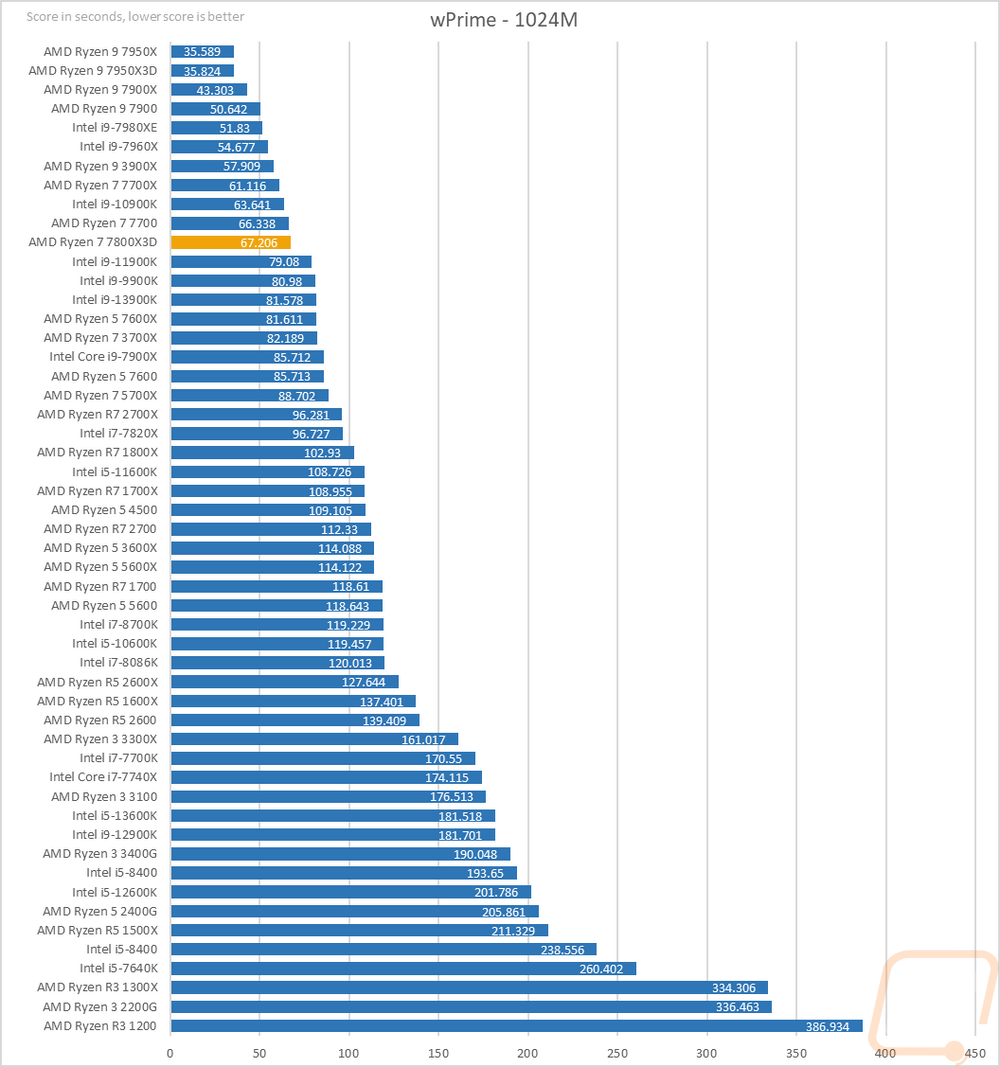
Next, we have wPrime which is a classic overclocking benchmark that calculates pi out to 1024 million digits and is timed. This is a multi-thread heavy test which has the older high core count CPUs still all over the top of the charts and you can see that with the top CPUs sitting at 8 or more cores. The 7800X3D with its 8 cores didn’t do too bad here sitting out in front of the 11900K and the newer 13900K but it is just slightly behind the Ryzen 7700.
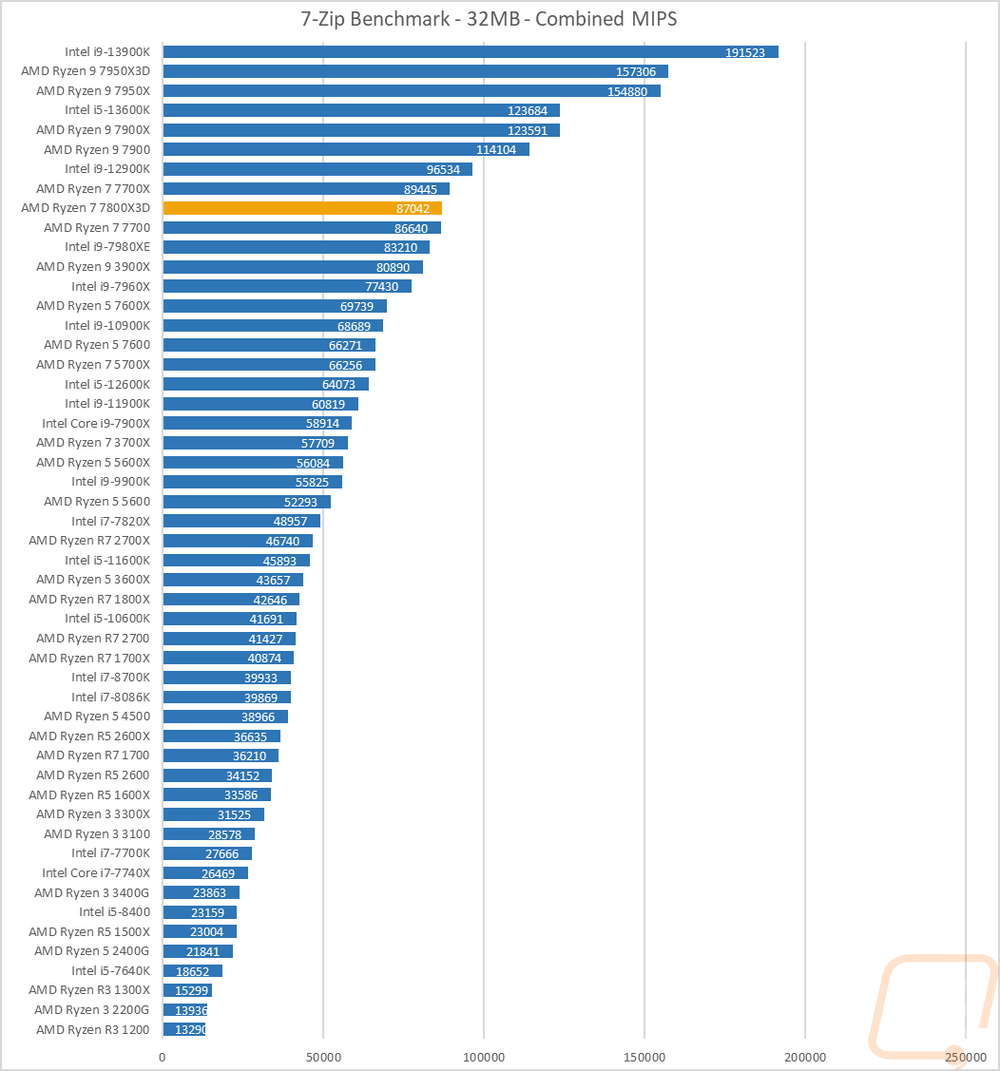
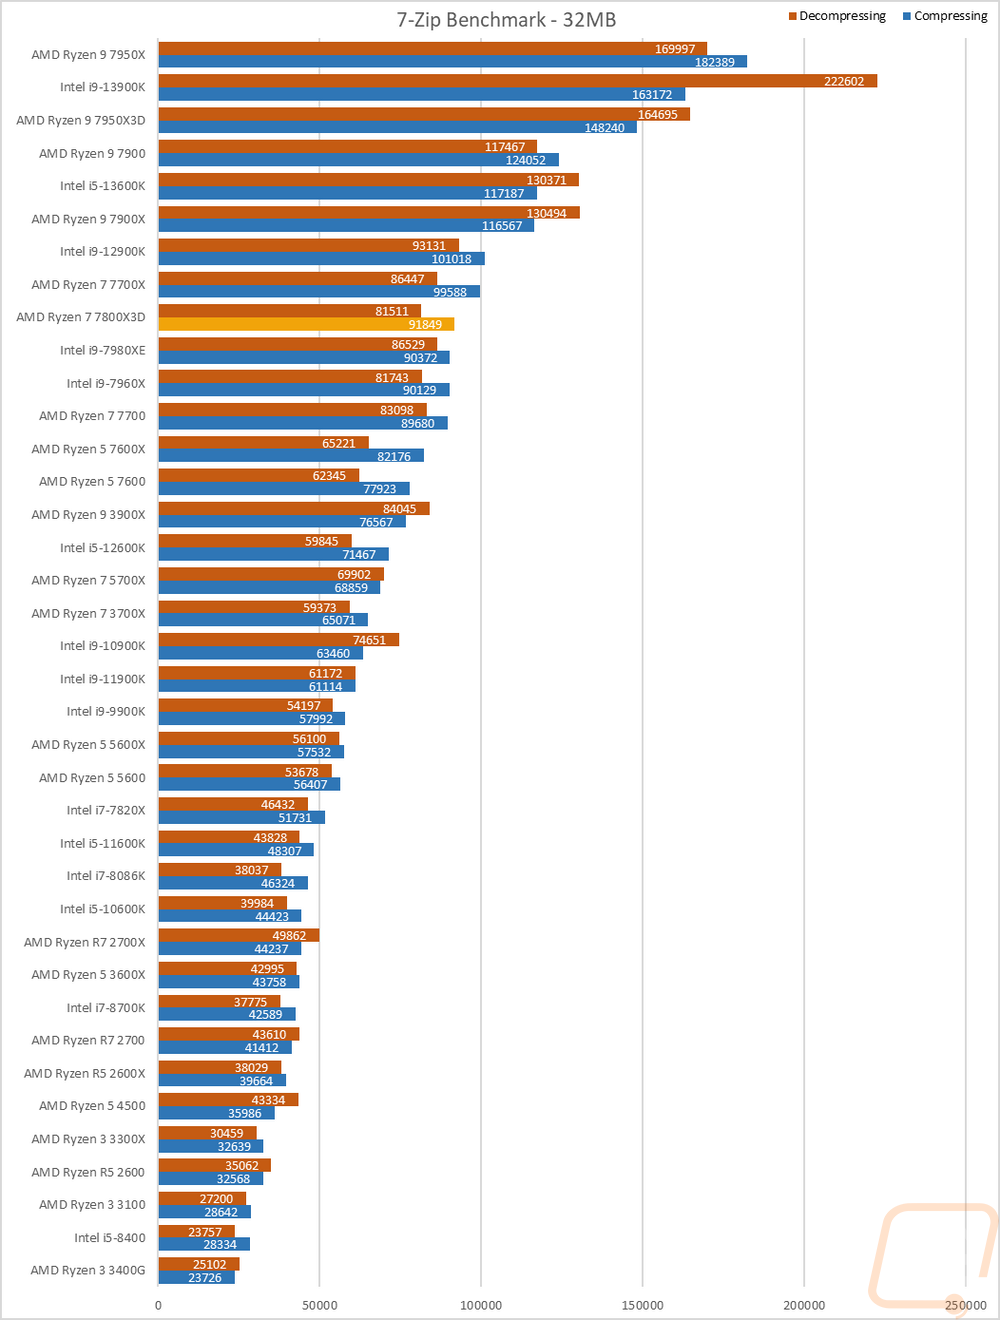
7 Zip is another open-source program, this time for compressing and decompressing all of your files. Here I have run the benchmark and we have three results. The combined MIPS is a combination of compressing and decompressing performance. Then I have it broken down between the two. The combined results have the 7800X3D sitting just ahead of the 7700 and behind the 7700X. The individual tests have the compressing result in that same spot but the decompressing result is a little lower behind the 7700 and ahead of the 7600X.
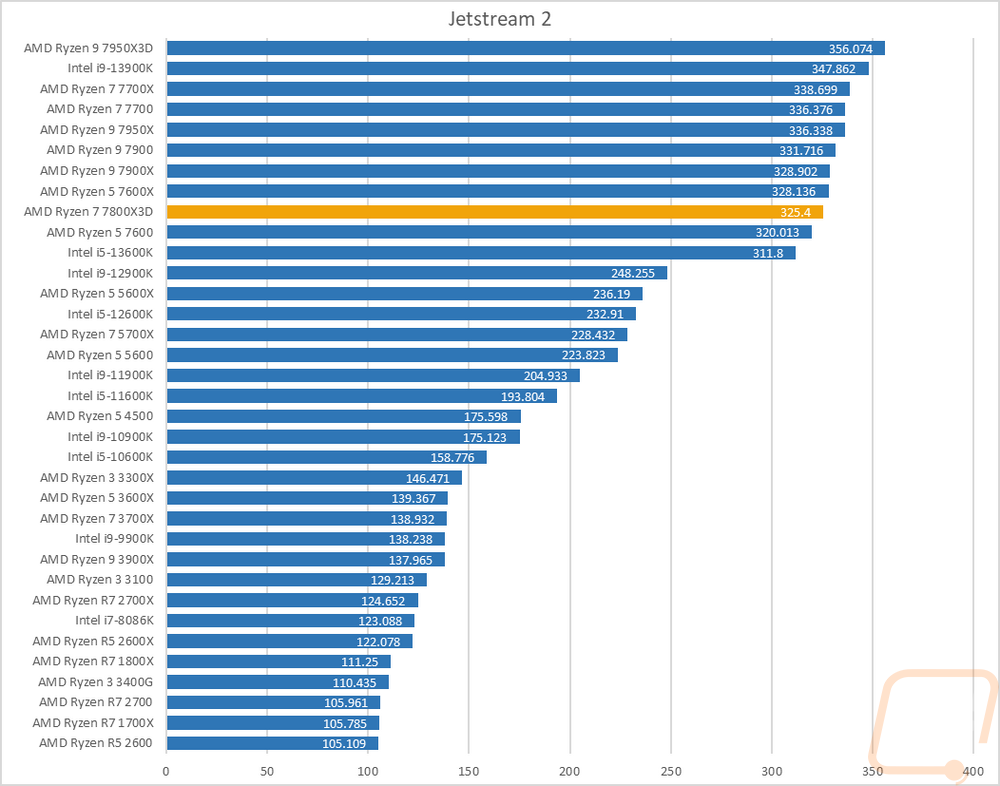
Jetstream 2 is a compilation benchmark that takes a long list of HTML5 and Java in-browser tests and runs them all three times and puts together an overall score. I love this benchmark because let's be honest, most people are using their browser more than any other game or program. Jetstream gives some interesting results sometimes though but it tends to prefer high IPC or single-core performance and there are some situations where it prefers lower core-count CPUs. This time around the 7800X3D is up in the top 1/3 of the chart sitting below the 7600X and ahead of the 7600.
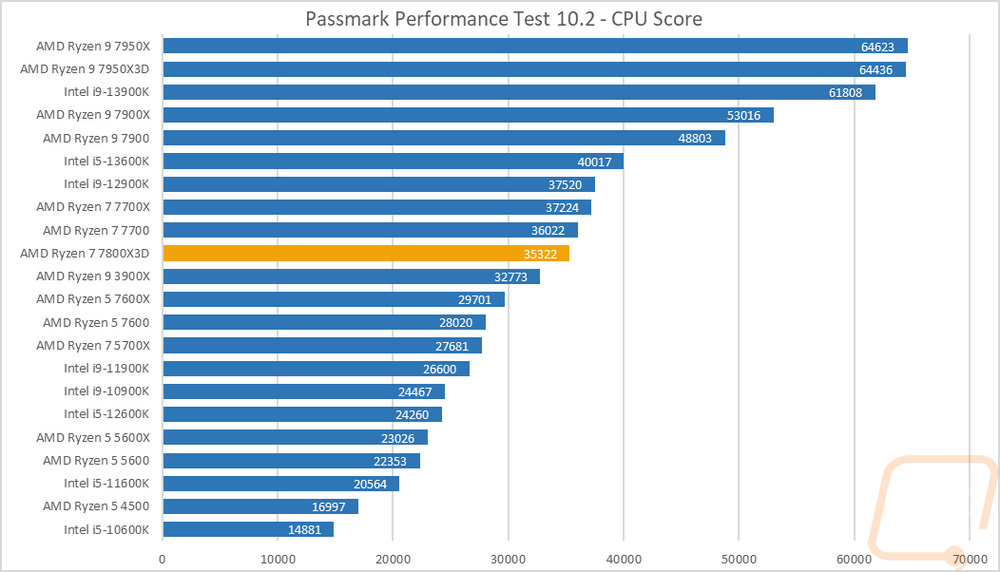
For Passmark Performance Test I used the latest version, Performance Test 10 I only look at the overall CPU score which takes a few different synthetic benchmarks and combines the results to put together an overall score. This is a test that does favor multi-threaded performance over IPC and you can see that with the highest core count CPUs being at the top but the 7800X3D with its 8 cores still ends up in the middle of the pack here behind the 7700 but way out in front of the 7600X which has the lower core count.
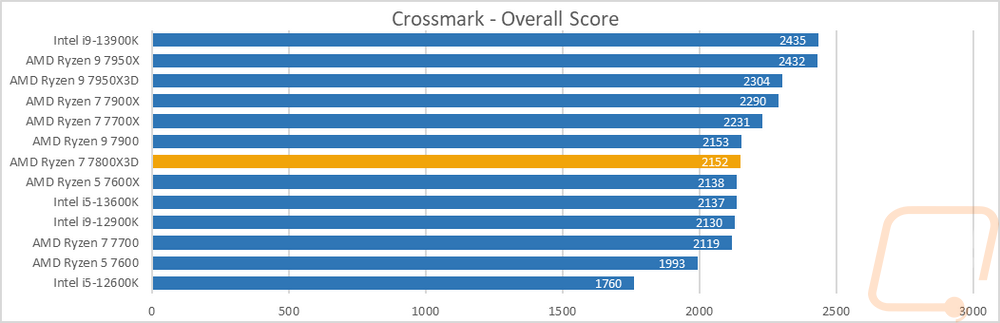
Crossmark is from BAPCo which also makes SYSmark and this is a cross-platform test where you can compare performance between phones and both windows and mac computers. This is the start of our overall PC benchmarks and Crossmark uses a mix of real-world tests to output an overall score. The Ryzen 7 7800X3D is in the middle of the chart but near the top of a clump of CPUs that all have similar scores including the 7700, 7600X, and 7600 which it is in front of all three.
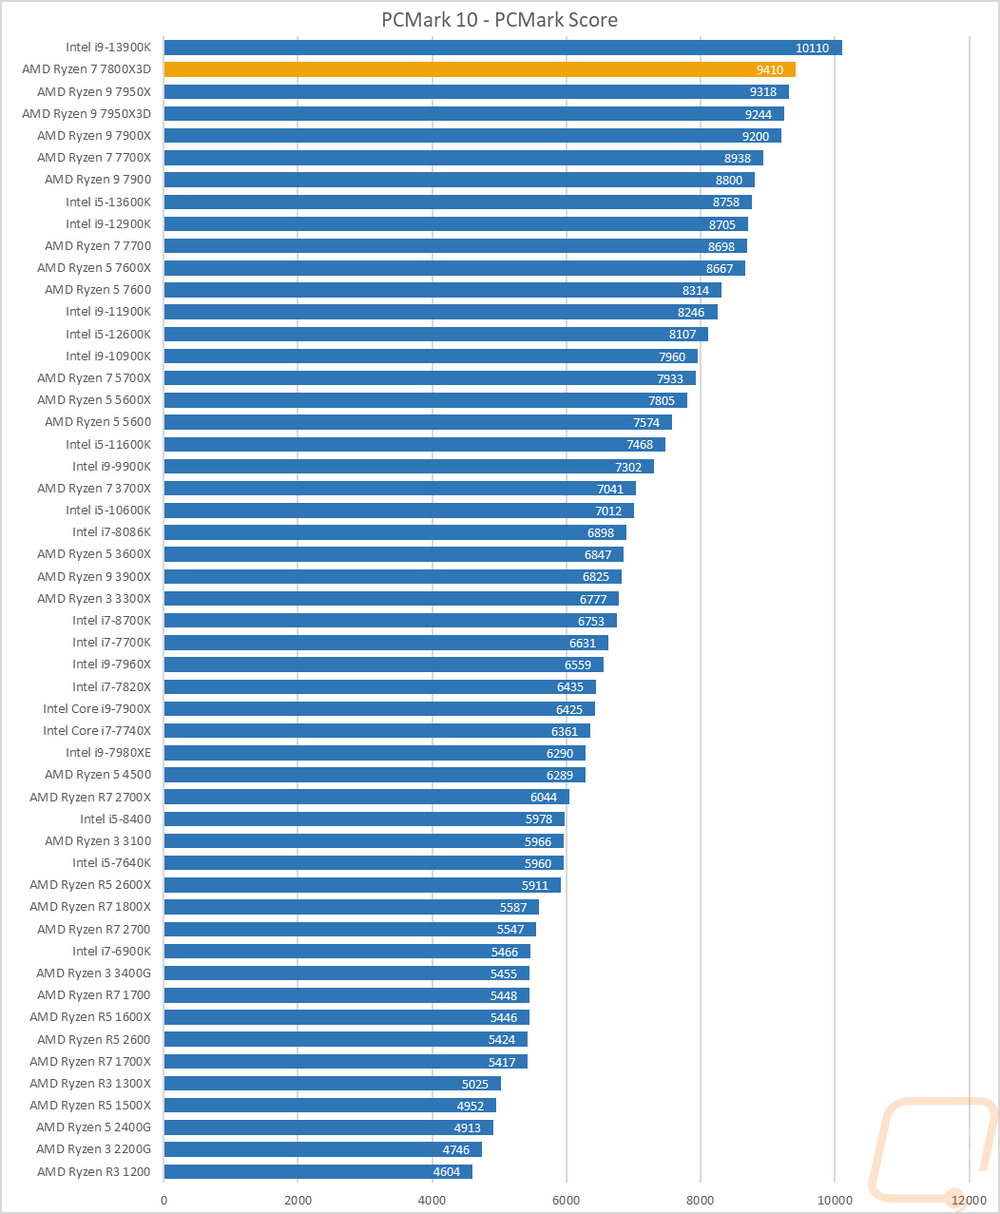
PCMark 10 is a great test because it tests things like video calls, browser performance, excel, and word performance to give an idea of real-world performance. It tends to like higher clock speeds but does take raw core count into account as well which you can see. But the big surprise here is that PC Mark benefited a lot from the 3D V-Cache and the 7800X3D did surprisingly well here sitting behind the 13900K but in front of everything else.
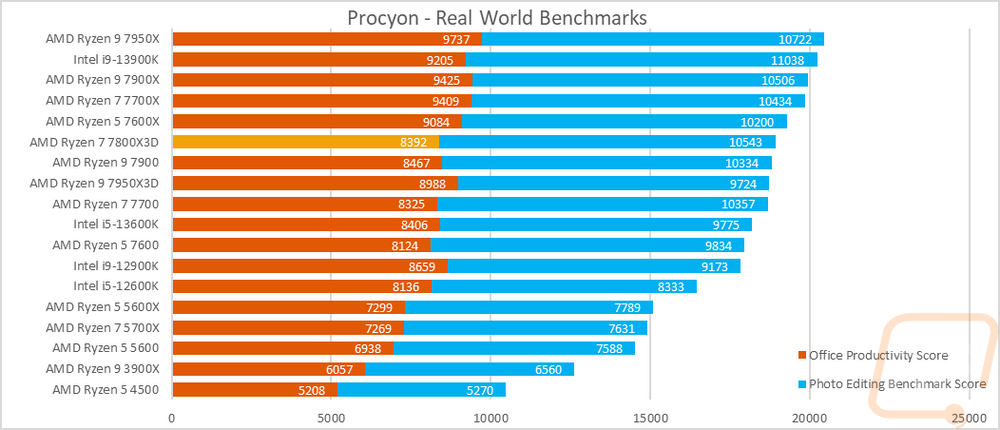
We recently added even more real-world testing with the UL Procyon Benchmarks which are as real-world as they can get using the actual programs that you would use in each test. There are two overall benchmarks, first is the Office Productivity Benchmark which uses Microsoft Office 365 to test actual performance in word, excel, PowerPoint, and outlook. The second benchmark is the Photo Editing Benchmark which is run using the latest version of Photoshop as well as Lightroom Classic to look at photo editing performance. I have both scores stacked together to get an overall look at the performance. The Ryzen 7 7800X3D landed below the 7600X in the combined results but the individual results are more interesting. It didn’t do as well with the office tests but its photo editing testing would put it ahead of the 7900X and below the 13900K which is interesting.
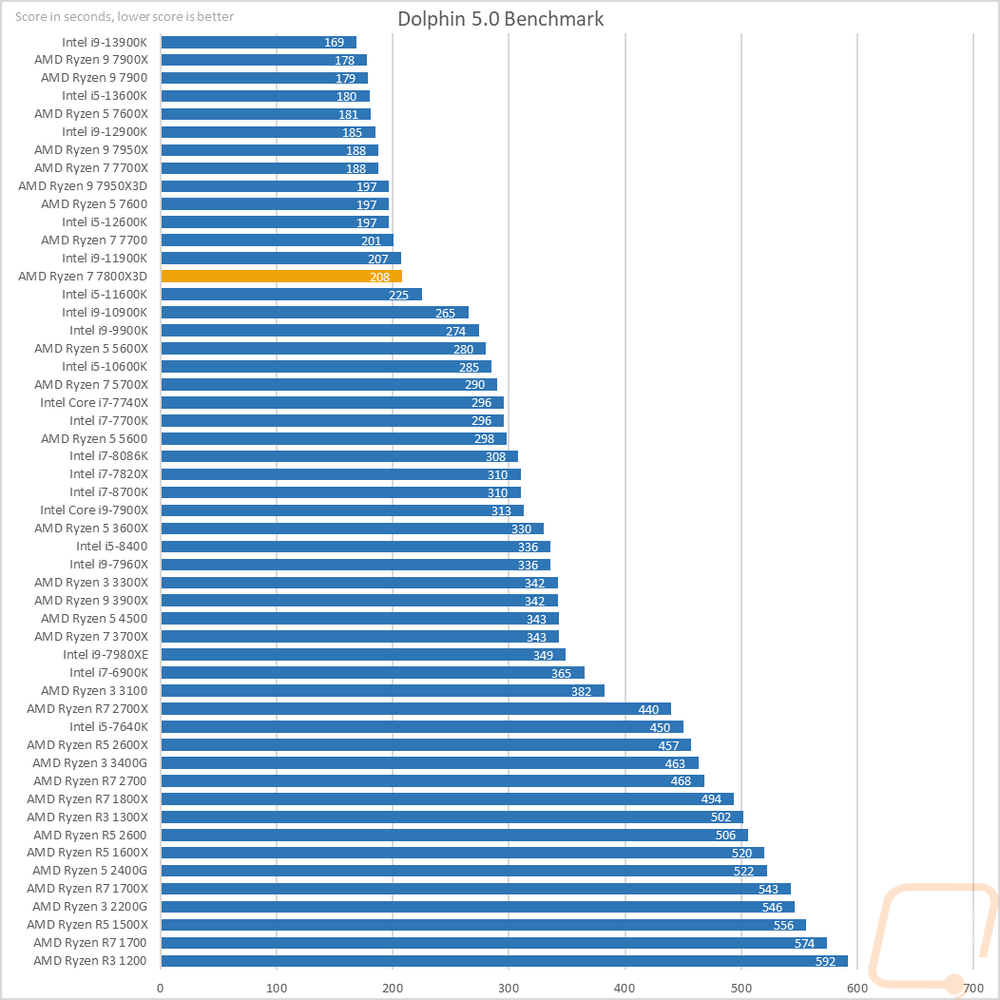
Moving the focus over towards gaming my next test is using Dolphin 5.0 Benchmark. Dolphin 5.0 is a Wii emulator and like most emulators, it doesn’t care about high core counts at all. In fact, it only runs two in total. Clock speeds are king here most of the time and because of that the 7800X3D finished the benchmark in 208 seconds putting it behind the 11900K and the 7700.
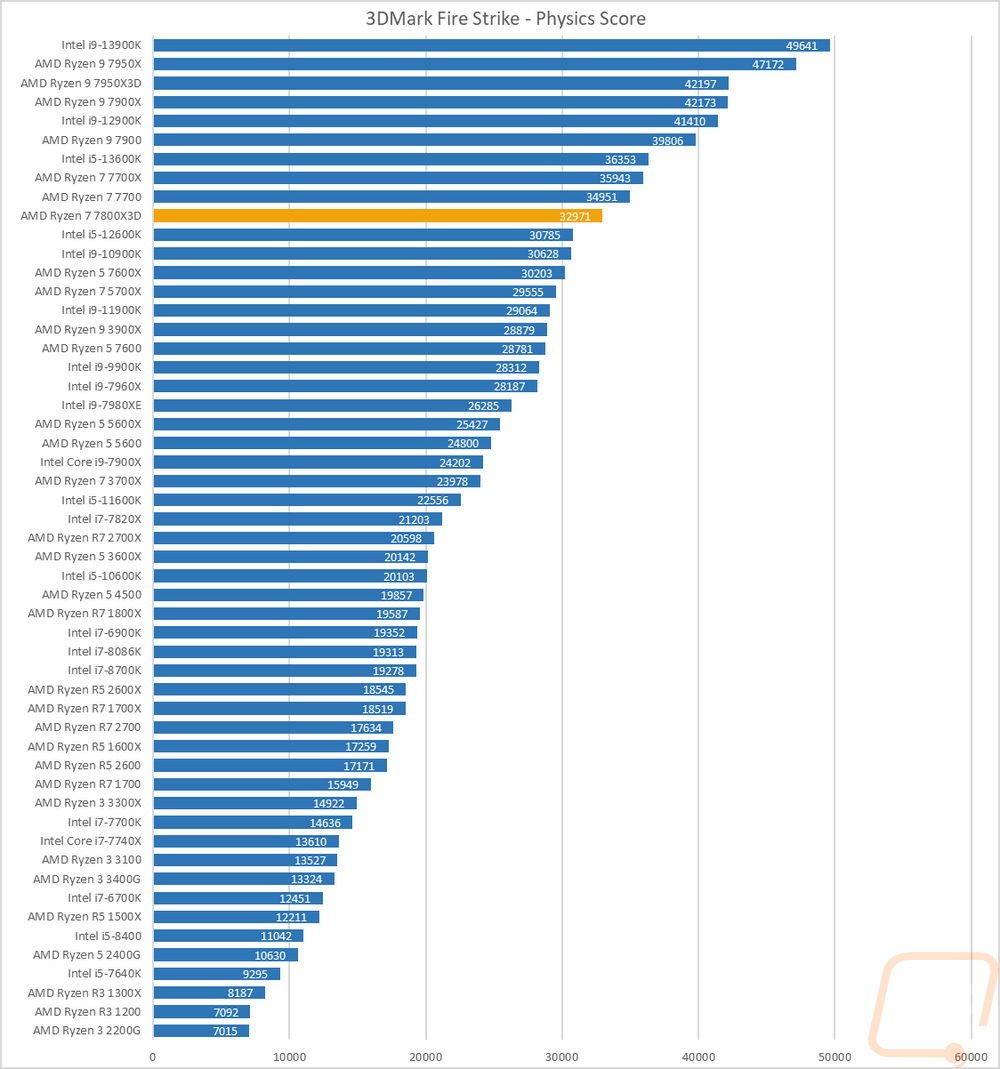
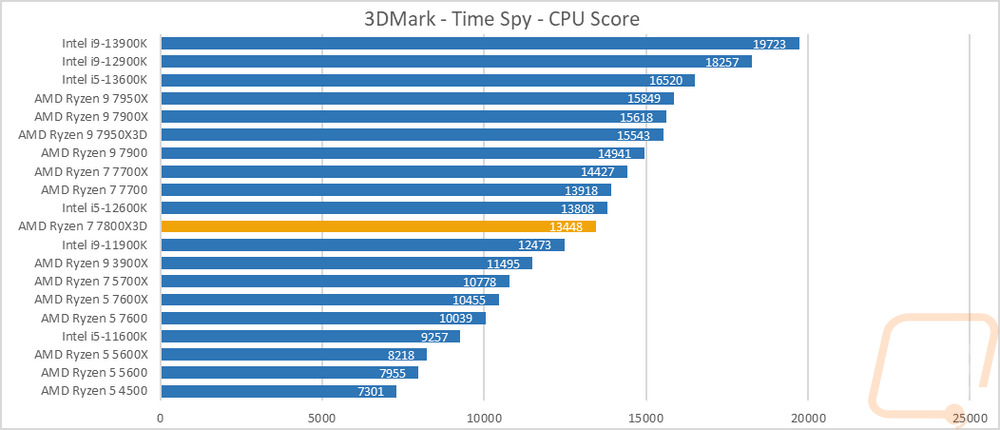
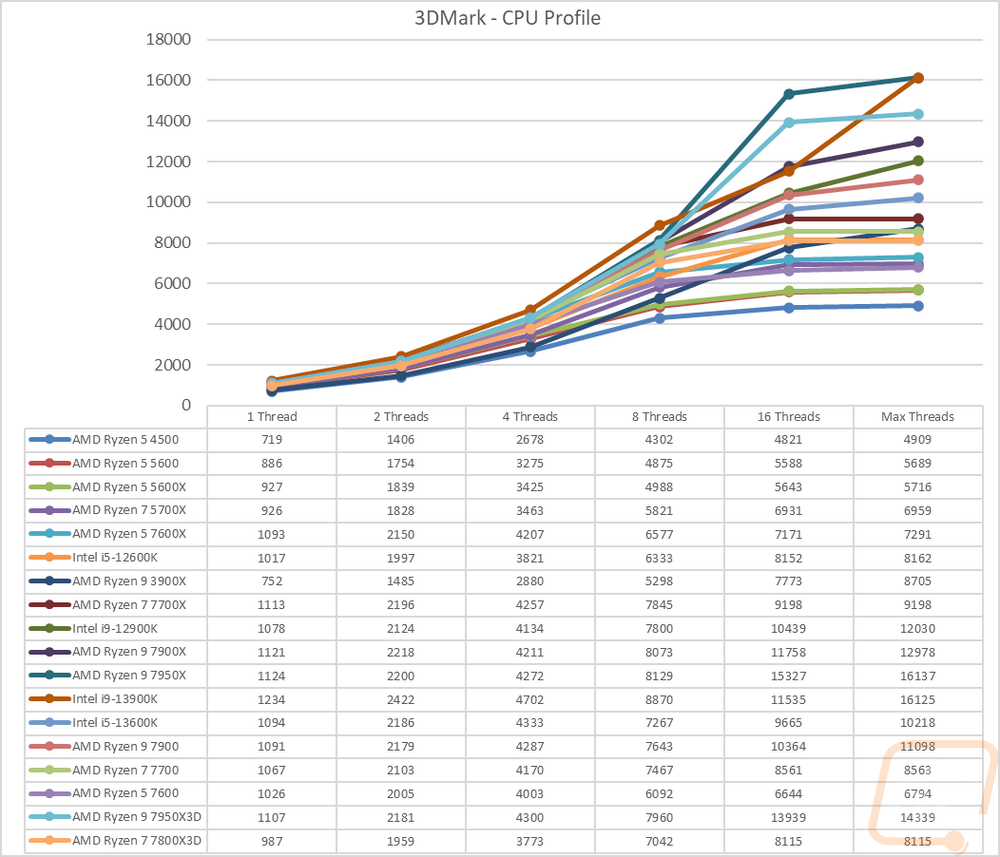
Before diving into game testing I wanted to check out synthetic performance using 3DMark. I tested with the older DX11 Fire Strike test as well as the newer DX12 Time Spy. I also added the new 3DMark CPU Profile benchmark into the mix as well which does a good job of showing the full range of thread counts that you might see being used in games as well as a max threads option that does everything above 16 threads. In the Fire Strike test, the 7800X3D is in the top 1/3 of the chart but still behind the 7700 showing that 3DMark doesn’t benefit from the 3D V-Cache. In the Time Spy test the 12600K edges out in front of the 7800X3D but the 7800X3D still isn’t too far behind the 7700. The CPU profile shows the same thing we saw in the other tests with the 7800X3D starting below the rest of the 7000 Series CPUs in the single-core test and staying there until we get to 8 threads where it can finally jump ahead of the 7600 and 7600X but it stays 400 points behind the 7700 for the last two tests.
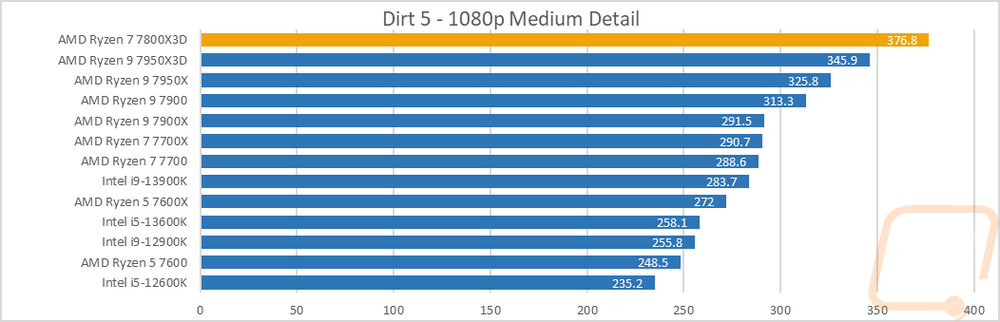
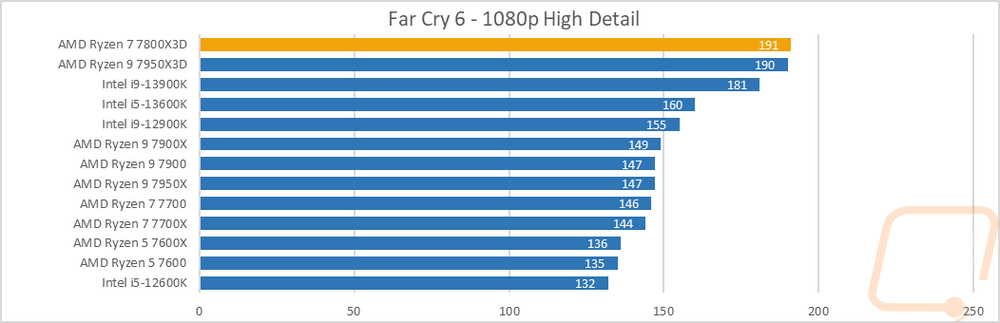
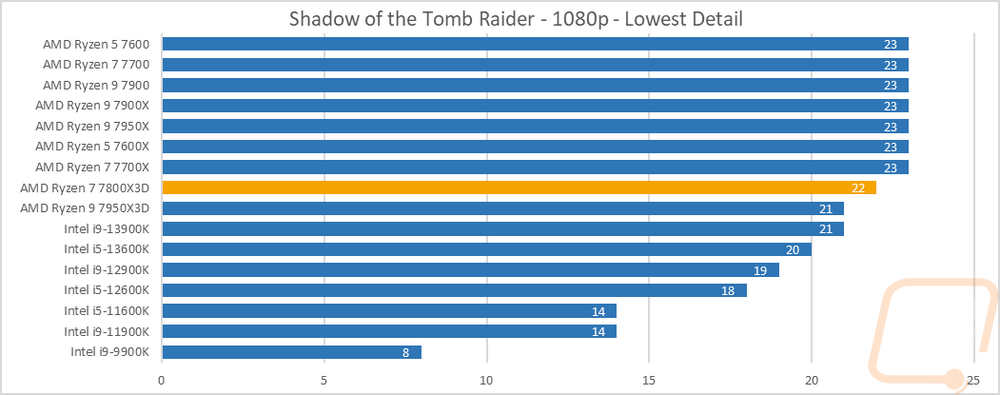
The Ryzen 7 5800X3D showed everyone that the stacked L3 cache design was a big benefit for gaming and in our testing of the 7950X3D we saw that as well. So I’m excited to see what the Ryzen 7 7800X3D is capable of, especially when we don’t have to worry about the asymmetrical design like on the 7950X3D. For our in-game testing, I have a variety of tests ranging from older games to newer games to get a mixed look at things. For today though let’s split things up by the overall performance so we can talk about them easier. The 7800X3D in nearly all of our other tests landed around the Ryzen 7 7700 and Ryzen 5 7600X and at times even near the 7600 due to it having lower boost clocks than any of the other 7000 Series CPUs. You would think that would be the opposite of what you would want in a gaming CPU, but with a boost clock of 5 GHz, the 7800X3D still isn’t slow and with having a crazy 96MB of L3 cache stacked on top its performance in a majority of our test games was impressive. In Dirt 5, Far Cry 6, Shadow of the Tomb Raider, and Metro Exodus it topped the charts. Even crazier is in two of those four the 7800X3D has a big lead on the 7950X3D.
In Ghost Recon Wildlands, Watch Dogs Legion, and Borderlands 3 the 7800X3D is ahead of almost everything tested but behind the 7950X3D. It’s still crazy to see the gap between the two 3D V-Stack CPUs compared to everything else tested in Watch Dogs Legion and Borderlands with 36 FPS in Borderlands between the 7800X3D and the 7950X for example.
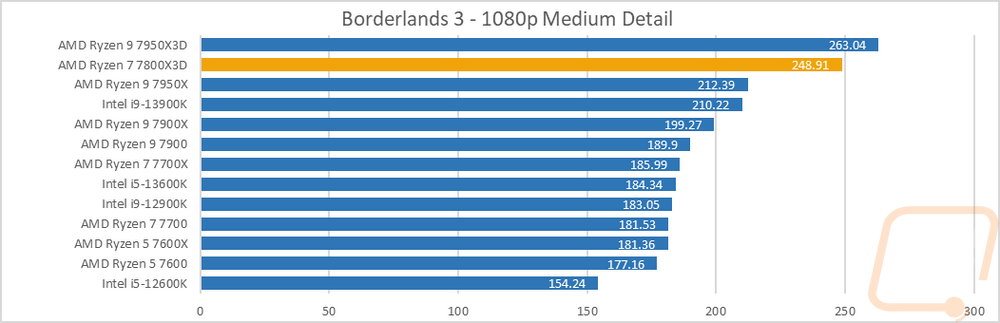
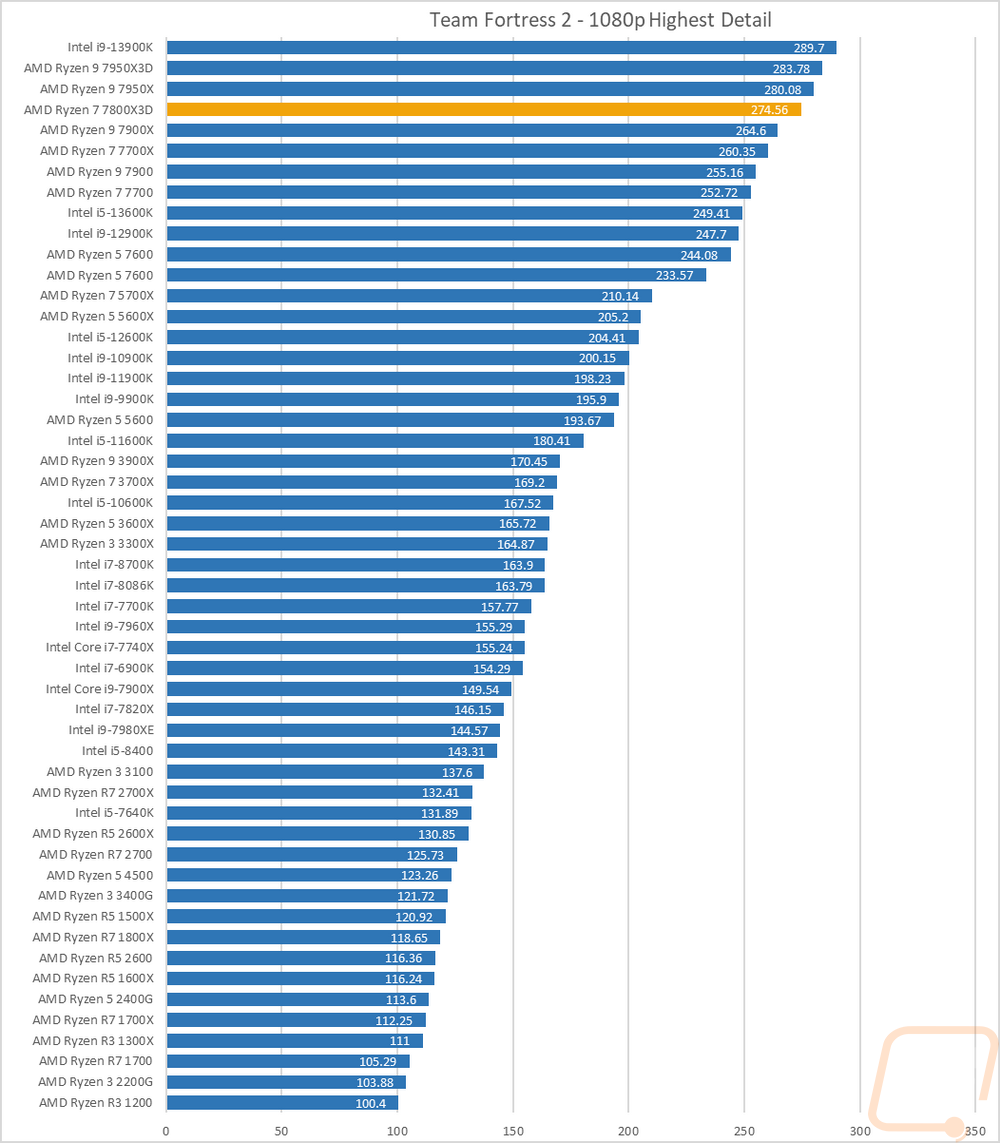
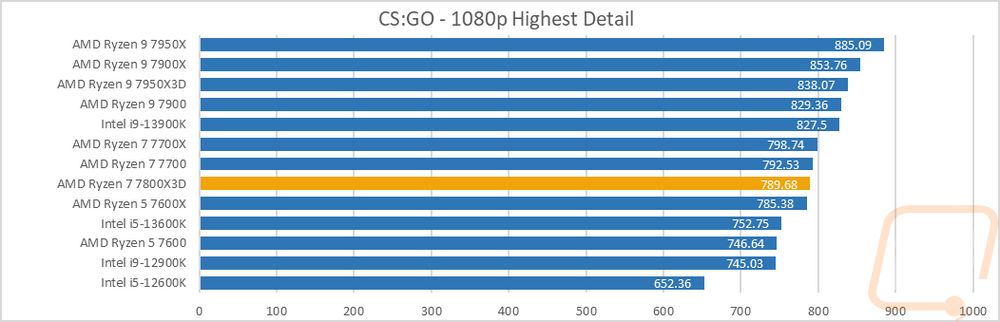
Then there were two games where the huge stacked cache didn’t help, at least as much. For the Team Fortress 2 test the 7800X3D did still sit higher than the 7700, 7700X, and even 7900X where if this were clock speed dependent only it would have been down lower in the chart. But it was still behind the 13900K, 7950X3D, and 7950X. Then for CS:GO we see what I was referring to on the clock speeds where the 7800X3D is down below the Ryzen 7 7700. But let’s be honest the CS:GO results are so far beyond the frame rates needed that one doesn’t matter much.
In AIDA64 the cache benchmarks surprisingly didn’t have the same crazy numbers that we saw with the 7950X3D. In fact, the 7800X3D runs with or below the 7700 in every test except for the memory tests which saw some improvement. But this does track with what we saw in the non-gaming tests.
|
AIDA64 |
L1 Cache Read |
L1 Cache Write |
L1 Cache Latency |
L2 Cache Read |
L2 Cache Write |
L2 Cache Latency |
L3 Cache Read |
L3 Cache Write |
L3 Cache Latency |
|
|
GB/s |
GB/s |
ns |
GB/s |
GB/s |
ns |
GB/s |
GB/s |
ns |
|
AMD Ryzen R7 2700X |
999.43 |
502.5 |
1 |
978.03 |
495.12 |
2.8 |
414.95 |
417.71 |
8.8 |
|
AMD Ryzen R5 2600X |
768.13 |
388.05 |
1 |
729.37 |
366.01 |
2.9 |
429.09 |
323.83 |
9.1 |
|
Ryzen 5 2400G |
485.01 |
238.29 |
1 |
459.8 |
232.2 |
3.1 |
222.96 |
181.6 |
9.6 |
|
Ryzen 3 2200G |
460.55 |
227.41 |
1.1 |
352.84 |
177.56 |
3.3 |
137.3 |
171.2 |
10.2 |
|
Intel i7-8700K |
1595.6 |
803.65 |
0.9 |
640.37 |
397.14 |
2.6 |
337 |
213.67 |
11 |
|
Intel i5-8400 |
1417.2 |
710.79 |
1 |
543.81 |
352.9 |
3.1 |
270.89 |
186.82 |
13 |
|
Intel Core i9-7980XE |
3758.3 |
1896.7 |
1.1 |
1671.7 |
1069.9 |
5.6 |
229.61 |
118.4 |
21 |
|
Intel Core i9-7960X |
3532.3 |
1785.2 |
1 |
1571.6 |
1003.5 |
5.1 |
220.22 |
121.04 |
19.8 |
|
Intel Core i7-7820X |
1969.9 |
995.02 |
1 |
884.63 |
574.74 |
5.6 |
114.4 |
103.57 |
19.2 |
|
Intel Core i5-7640X |
1044.8 |
31888 |
1 |
397.26 |
247 |
2.9 |
228.31 |
163.86 |
11.1 |
|
Intel Core i9-7900X |
2418.5 |
709.16 |
1 |
1037.3 |
521.94 |
5.2 |
124.16 |
106.78 |
21.2 |
|
Intel Core i7-7740X |
1102.7 |
561.25 |
0.9 |
424.55 |
304.3 |
2.7 |
287.01 |
186.67 |
21.2 |
|
Intel i7-6900K |
1963.9 |
999.59 |
1 |
710.28 |
310.34 |
4.1 |
243.96 |
195.41 |
14.6 |
|
Intel i7-7700K |
1114.6 |
560.82 |
0.9 |
415.45 |
285.97 |
2.7 |
234.5 |
188.7 |
10.4 |
|
Intel i7-5960X |
1748.5 |
874.6 |
1.2 |
623.08 |
272.77 |
3.5 |
260.72 |
184.92 |
15.3 |
|
AMD Ryzen R7 1800X |
917.46 |
460.16 |
1.1 |
831.95 |
446.37 |
4.7 |
388.18 |
386.01 |
12.4 |
|
AMD Ryzen R7 1700X |
867.89 |
435.33 |
1.2 |
809.29 |
419.38 |
5 |
369.75 |
350.31 |
12.9 |
|
AMD Ryzen R7 1700 |
793.9 |
398.12 |
1.3 |
742.92 |
389.73 |
5.4 |
334.36 |
332.12 |
14.2 |
|
AMD Ryzen R5 1600X |
689.47 |
345.95 |
1.1 |
630.99 |
334.93 |
4.7 |
386.48 |
326.86 |
12.3 |
|
AMD Ryzen R5 1500X |
446.84 |
224.01 |
1.1 |
306.82 |
211.58 |
11.8 |
306.82 |
211.58 |
11.8 |
|
AMD Ryzen R5 2600 |
685.38 |
344.05 |
1 |
669.28 |
333.5 |
3.1 |
381.16 |
320.56 |
9.8 |
|
AMD Ryzen R7 2700X |
849.91 |
426.09 |
1 |
837.76 |
418.75 |
3 |
357.51 |
356.71 |
9.4 |
|
Intel i7-8086K |
1596.4 |
803.56 |
0.9 |
623.36 |
423.53 |
2.6 |
380.04 |
243.73 |
10.9 |
|
Intel i9-9900K |
2375.6 |
1195.4 |
0.8 |
907.65 |
626.34 |
2.4 |
302.01 |
221.1 |
11 |
|
AMD Ryzen 9 3900X |
3098.6 |
1551.4 |
0.9 |
1545.3 |
1416.8 |
2.8 |
1014.4 |
836.39 |
11.5 |
|
AMD Ryzen 7 3700X |
2133.2 |
1072.9 |
0.9 |
1069.1 |
993.49 |
2.8 |
611.53 |
573.21 |
10.2 |
|
AMD Ryzen 5 3600X |
1547.4 |
779.24 |
1 |
777.62 |
745.3 |
2.8 |
584.93 |
538.45 |
10.4 |
|
AMD Ryzen 3 3400G |
508.97 |
253.87 |
1 |
490.26 |
247.04 |
3 |
233.57 |
193.62 |
9.3 |
|
AMD Ryzen 3 3300X |
1080.5 |
541.5 |
0.9 |
541.84 |
530.5 |
2.7 |
322.13 |
321.33 |
11.1 |
|
AMD Ryzen 3 3100 |
965.85 |
484.67 |
1 |
485.55 |
460.71 |
3.1 |
374.11 |
343.53 |
11.8 |
|
Intel i5-10600K |
1676.6 |
840.87 |
0.8 |
662.98 |
452.67 |
2.5 |
361.35 |
238.47 |
10.5 |
|
Intel i9-10900K |
3162.1 |
1586.7 |
0.8 |
1201.8 |
759.97 |
2.4 |
407.66 |
245.94 |
11.4 |
|
AMD Ryzen 5 5600X |
1721.4 |
869.69 |
0.9 |
851.89 |
831.97 |
2.6 |
276.24 |
298.84 |
11 |
|
Intel i9-11900K |
4542.8 |
2299.3 |
1 |
1413.2 |
691.62 |
2.5 |
330.32 |
213.28 |
11.4 |
|
Intel i5-11600K |
3412.3 |
1724.9 |
1 |
960.91 |
526.76 |
2.7 |
319.1 |
198.57 |
11.4 |
|
Intel i9-12900K |
2310 |
1438.7 |
1 |
1233.5 |
562.72 |
2.9 |
678.84 |
418.11 |
19.8 |
|
Intel i5-12600K |
1461.1 |
971.78 |
1.1 |
846.4 |
360.51 |
3.2 |
598.86 |
292.09 |
21.4 |
|
AMD Ryzen 5 4500 |
1561.9 |
784.1 |
1 |
785.34 |
751.61 |
2.9 |
350.05 |
571.19 |
10.5 |
|
AMD Ryzen 5 5600 |
1646.6 |
831.24 |
0.9 |
832.43 |
767.22 |
2.7 |
445.8 |
437.73 |
11.9 |
|
AMD Ryzen 7 5700X |
2267.8 |
1157.8 |
0.9 |
1147.6 |
1026.1 |
2.6 |
501.53 |
526.11 |
11.5 |
|
AMD Ryzen 7 7700X |
2722.9 |
1381 |
0.7 |
1361.1 |
1305.1 |
2.7 |
887.95 |
901.2 |
10.1 |
|
AMD Ryzen 5 7600X |
1996.3 |
1019.3 |
0.7 |
1020.9 |
999.93 |
2.6 |
847.43 |
847.61 |
10.5 |
|
AMD Ryzen 9 7950X |
5252.2 |
2685 |
0.7 |
2615.6 |
2588.4 |
2.6 |
1293.7 |
1357.3 |
9.9 |
|
AMD Ryzen 9 7900X |
4042.4 |
2051.4 |
0.7 |
2008.5 |
1956.3 |
2.5 |
1278.6 |
1394.1 |
9.8 |
|
Intel i9-13900K |
2005.7 |
872.39 |
0.9 |
2280.2 |
851.63 |
3.7 |
1729.2 |
619.38 |
18.3 |
|
Intel i5-13600K |
3218.4 |
1472.5 |
1.1 |
1156 |
479.87 |
4.5 |
907.63 |
406.76 |
14.9 |
|
AMD Ryzen 9 7900 |
3839.2 |
2023.6 |
0.7 |
1925.5 |
1865.1 |
2.7 |
1146 |
1046.4 |
10.3 |
|
AMD Ryzen 7 7700 |
2630.8 |
1333.7 |
0.8 |
1336.2 |
1298.2 |
2.9 |
826.97 |
879.08 |
10.4 |
|
AMD Ryzen 5 7600 |
1898 |
963.23 |
0.8 |
964.63 |
946.49 |
2.9 |
698.77 |
690.84 |
10.8 |
|
AMD Ryzen 9 7950X3D |
4734.9 |
2518.4 |
0.8 |
2558.7 |
2422.3 |
2.7 |
1314.4 |
1376.8 |
12.5 |
|
AMD Ryzen 7 7800X3D |
2342.7 |
1239.1 |
0.8 |
1252.6 |
1171.8 |
3.1 |
674.02 |
703.18 |
12.8 |
|
AIDA64 |
Memory Read |
Memory Write |
Memory Latency |
Single-Precision FLOPS |
Double Precision FLOPS |
AES-256 |
24-bit Integer IOPS |
32-bit Integer IOPS |
64-bit Integer IOPS |
|
|
MB/s |
MB/s |
ns |
GFLOPS |
GFLOPS |
MB/s |
GIOPS |
GIOPS |
GIOPS |
|
AMD Ryzen R7 2700X |
50214 |
48578 |
65 |
507.9 |
253.9 |
70514 |
127.7 |
127.7 |
64.22 |
|
AMD Ryzen R5 2600X |
50273 |
48346 |
65.5 |
383.2 |
191.4 |
51932 |
95.82 |
95.82 |
48.15 |
|
Ryzen 5 2400G |
45967 |
47850 |
66.6 |
235.9 |
117.8 |
32388 |
58.94 |
58.98 |
29.67 |
|
Ryzen 3 2200G |
35567 |
36240 |
118.4 |
225.8 |
112.6 |
27603 |
56.32 |
56.32 |
28.3 |
|
Intel i7-8700K |
38421 |
40175 |
57.9 |
825 |
412.5 |
29406 |
370 |
370 |
51.55 |
|
Intel i5-8400 |
38096 |
40549 |
59.8 |
728.8 |
364.5 |
25192 |
323.5 |
323.5 |
45.55 |
|
Intel Core i9-7980XE |
77004 |
68888 |
73.4 |
1831 |
915.5 |
69377 |
821.2 |
821.3 |
121.6 |
|
Intel Core i9-7960X |
79416 |
71554 |
74.9 |
1681 |
840.6 |
65409 |
754 |
753.9 |
114.7 |
|
Intel Core i7-7820X |
76049 |
73759 |
71.6 |
944.9 |
472.5 |
36420 |
423.7 |
423.7 |
63.85 |
|
Intel Core i5-7640X |
30786 |
31888 |
68.5 |
536.5 |
268.2 |
18547 |
238.1 |
138.1 |
33.53 |
|
Intel Core i9-7900X |
76856 |
72856 |
72.8 |
1148 |
574.5 |
45506 |
515.1 |
515 |
79.76 |
|
Intel Core i7-7740X |
38455 |
40596 |
53.2 |
575.4 |
287.8 |
20503 |
258.1 |
258 |
35.97 |
|
Intel i7-6900K |
66786 |
68130 |
61.9 |
1023 |
511.7 |
36340 |
255.9 |
255.9 |
63.96 |
|
Intel i7-7700K |
38498 |
40448 |
52.7 |
575.7 |
287.9 |
20519 |
258 |
258 |
35.98 |
|
Intel i7-5960X |
66108 |
49545 |
62.8 |
895.5 |
447.7 |
31783 |
223.9 |
223.9 |
55.97 |
|
AMD Ryzen R7 1800X |
44031 |
43425 |
81.8 |
472.4 |
236.2 |
64016 |
118.1 |
118.1 |
59.03 |
|
AMD Ryzen R7 1700X |
44493 |
43749 |
78.3 |
446.8 |
223.4 |
61730 |
111.7 |
111.7 |
55.84 |
|
AMD Ryzen R7 1700 |
45343 |
43777 |
82.6 |
408.5 |
204.3 |
56811 |
102.1 |
102.1 |
51.05 |
|
AMD Ryzen R5 1600X |
44452 |
43918 |
83.7 |
354.9 |
177.5 |
49340 |
88.74 |
88.73 |
44.34 |
|
AMD Ryzen R5 1500X |
44289 |
43746 |
83.1 |
229.8 |
114.8 |
31983 |
57.43 |
57.45 |
28.72 |
|
AMD Ryzen R5 2600 |
50385 |
48499 |
66.5 |
351 |
175.4 |
48939 |
88.03 |
88.02 |
44.01 |
|
AMD Ryzen R7 2700 |
50088 |
48343 |
65.9 |
434.3 |
217.2 |
60336 |
108.6 |
108.6 |
54.68 |
|
Intel i7-8086K |
39069 |
40675 |
56.2 |
824.9 |
412.5 |
29397 |
369.9 |
369.9 |
51.55 |
|
Intel i9-9900K |
39682 |
41015 |
51.1 |
1226 |
613 |
45542 |
550 |
549.8 |
79.79 |
|
AMD Ryzen 9 3900X |
53981 |
52271 |
70.7 |
1546 |
772.1 |
106943 |
385.7 |
385.7 |
96.57 |
|
AMD Ryzen 7 3700X |
51498 |
28739 |
67.3 |
1078 |
537.8 |
74474 |
271 |
271.2 |
67.77 |
|
AMD Ryzen 5 3600X |
50769 |
28736 |
68.9 |
799.5 |
400 |
55456 |
198.6 |
198.6 |
49.64 |
|
AMD Ryzen 3 3400G |
49936 |
53502 |
67.1 |
257.2 |
128.5 |
35736 |
64.16 |
64.16 |
32.25 |
|
AMD Ryzen 3 3300X |
51435 |
28743 |
66.4 |
551.6 |
276.1 |
38176 |
138.7 |
138.7 |
34.65 |
|
AMD Ryzen 3 3100 |
50246 |
28734 |
71.1 |
497.6 |
248.7 |
34946 |
124.4 |
124.4 |
31.09 |
|
Intel i5-10600K |
43340 |
43430 |
48.2 |
863.8 |
431.9 |
30782 |
387.2 |
386.9 |
53.99 |
|
Intel i9-10900K |
44972 |
43808 |
50.5 |
1632 |
815.7 |
58163 |
731.3 |
731.2 |
102 |
|
AMD Ryzen 5 5600X |
50972 |
28772 |
59.2 |
891.9 |
445.8 |
61623 |
709.6 |
709.7 |
55.72 |
|
Intel i9-11900K |
44919 |
43343 |
51.8 |
1068 |
534.2 |
164966 |
547 |
547 |
182.7 |
|
Intel i5-11600K |
43953 |
43468 |
55.6 |
838.7 |
419.4 |
123767 |
429.3 |
429.3 |
143.4 |
|
Intel i9-12900K |
71418 |
72395 |
82 |
695.7 |
247.9 |
140499 |
400.6 |
400.6 |
166.2 |
|
Intel i5-12600K |
65416 |
71336 |
87.8 |
432.5 |
216.2 |
86470 |
252.7 |
252.7 |
96.22 |
|
AMD Ryzen 5 4500 |
52683 |
53191 |
82.8 |
806 |
402.6 |
56578 |
201.5 |
201.3 |
50.35 |
|
AMD Ryzen 5 5600 |
48444 |
28753 |
70.9 |
853.2 |
426.2 |
107839 |
675.8 |
679.6 |
53.38 |
|
AMD Ryzen 7 5700X |
47858 |
28760 |
68.2 |
1158 |
577.9 |
137459 |
919.1 |
912.9 |
74.38 |
|
AMD Ryzen 7 7700X |
58755 |
80120 |
70 |
1392 |
694.6 |
192730 |
1205 |
1205 |
602.4 |
|
AMD Ryzen 5 7600X |
54720 |
80771 |
69.5 |
1046 |
523.1 |
147661 |
912.5 |
912.5 |
456.4 |
|
AMD Ryzen 9 7950X |
67342 |
76712 |
69 |
2735 |
1364 |
379510 |
2370 |
2370 |
1184 |
|
AMD Ryzen 9 7900X |
68064 |
78123 |
67.7 |
2062 |
1029 |
288134 |
1792 |
1789 |
895.4 |
|
Intel i9-13900K |
76006 |
68902 |
86.1 |
2238 |
1116 |
157028 |
831.4 |
831.4 |
270.6 |
|
Intel i5-13600K |
64721 |
62311 |
97.2 |
1294 |
647 |
86637 |
509.5 |
509.4 |
136.4 |
|
AMD Ryzen 9 7900 |
73968 |
73494 |
69.4 |
2007 |
998.7 |
267499 |
1710 |
1709 |
855.9 |
|
AMD Ryzen 7 7700 |
58694 |
79929 |
68.9 |
1369 |
684.7 |
185084 |
1192 |
1192 |
594.3 |
|
AMD Ryzen 5 7600 |
59454 |
81467 |
69.6 |
988.6 |
494.3 |
140625 |
861.9 |
861.2 |
431.2 |
|
AMD Ryzen 9 7950X3D |
77677 |
80314 |
68.1 |
2619 |
1311 |
178269 |
2239 |
2239 |
1120 |
|
AMD Ryzen 7 7800X3D |
65343 |
81313 |
71.9 |
1241 |
620.3 |
89694 |
1076 |
1076 |
538.3 |
Onboard Video Performance
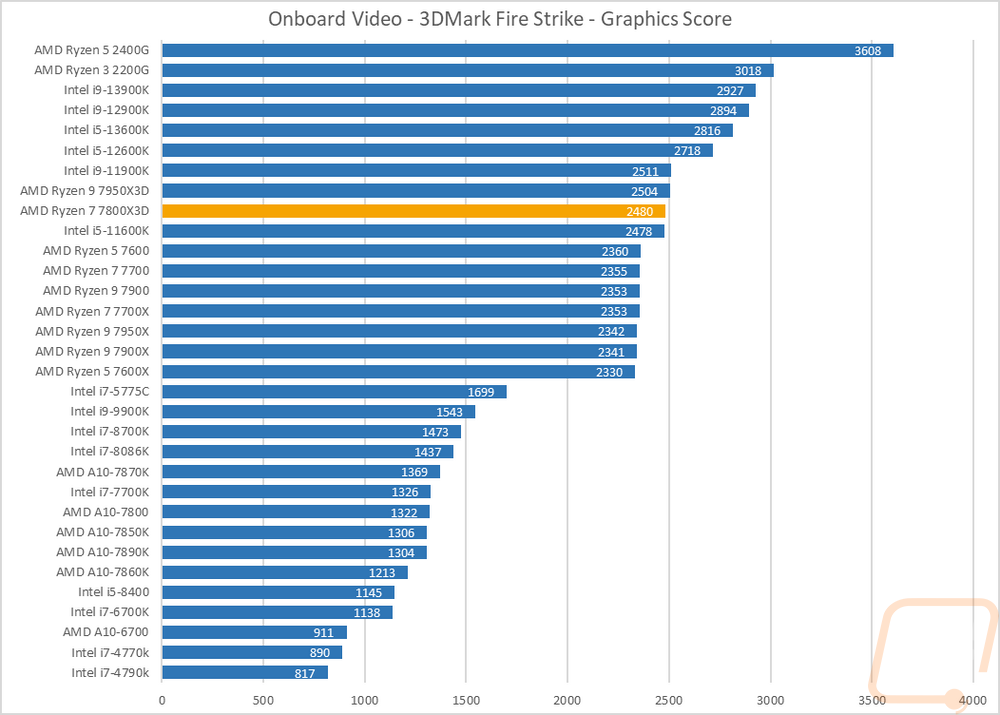
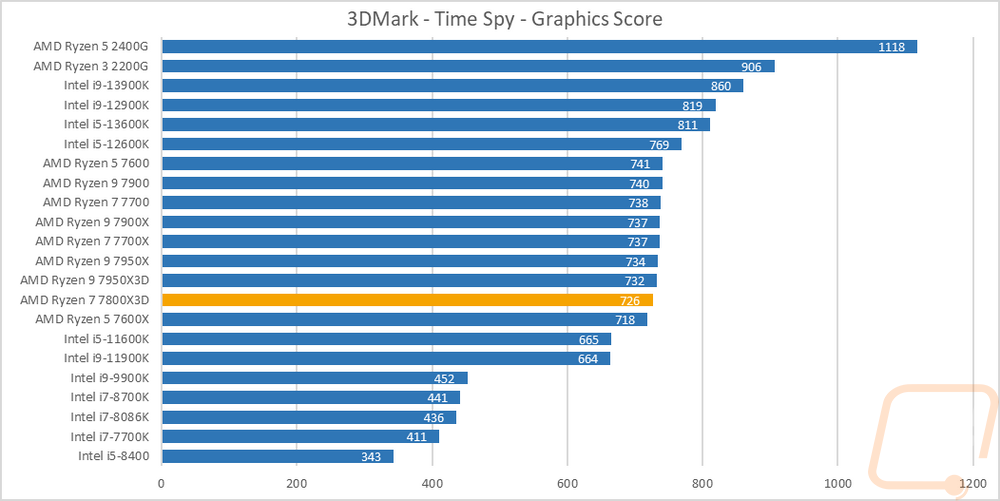
Onboard performance isn’t something that you think about when it comes to high-end CPUs because I think the expectation is that you will be adding a dedicated GPU but there are situations where a dedicated GPU isn’t needed or you may need to run the integrated graphics while waiting on your video card to come in or be replaced. So I do still want to check out the performance of all three of the non-X CPUs when it comes to integrated GPU performance. For that, I have run a few basic tests with a mix of older and newer games and benchmarks. Integrated GPUs aren’t anywhere near the performance of even the lowest-end GPUs but it is still interesting to see what they can do. To start that I went with the always consistent 3DMark with both the older Fire Strike benchmark and the newer Time Spy which is DX12. I only used the graphics score, not the total score to take the CPU performance out of the equation as much as possible. In both tests, we saw interesting results with the 7800X3D performing similarly to what I saw with the 7950X3D. For the Fire Strike test, it was out in front of the other 7000 Series CPUs which all have similar results. But then for Time Spy, it is the other way around with the 7900X3D near the bottom of the 7000 Series Ryzen CPUs.
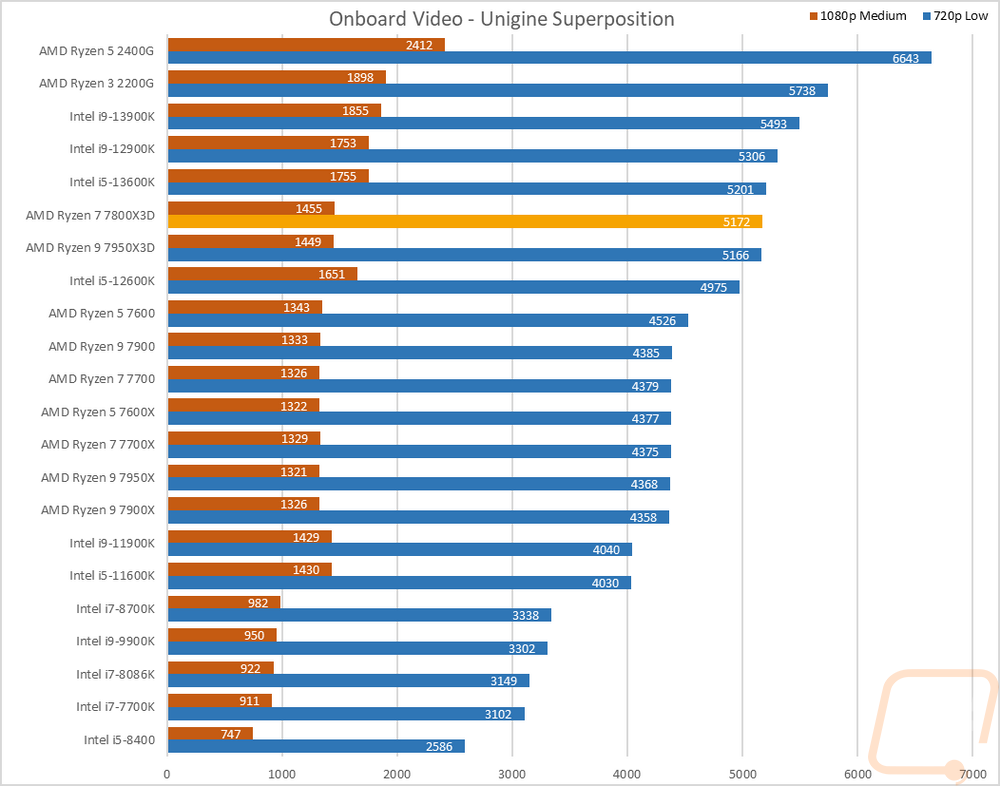
In Unigine Superposition I ran the 1080p medium detail and 720p low detail tests and the results here weren’t much different than the previous tests. The 7800X3D did well in the 720p test running well ahead of the other 7000 series CPUs and matching the performance of the 7950X3D. Its 1080p performance, on the other hand, is behind compared to the 12600K and 13600K it sits between but that is still faster than the other new AMD CPUs just like the 7950X3D which it edged out just slightly.
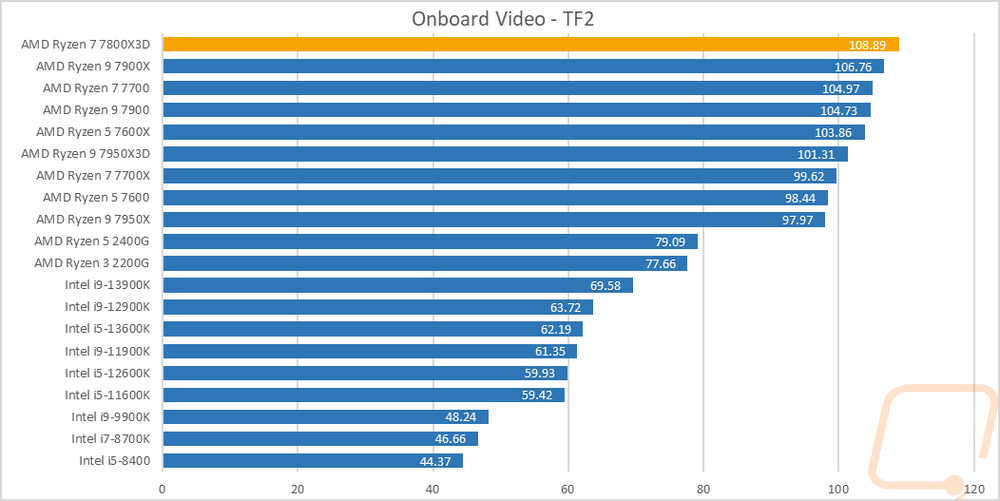
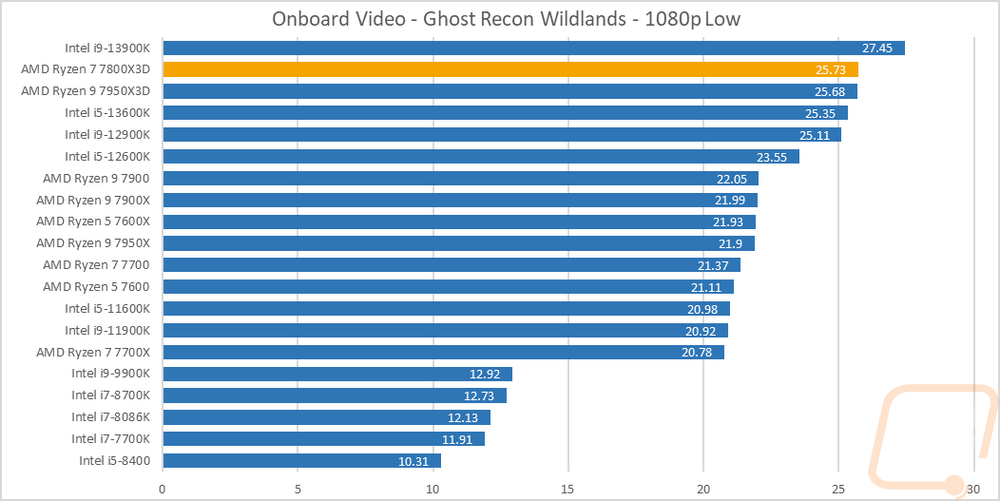
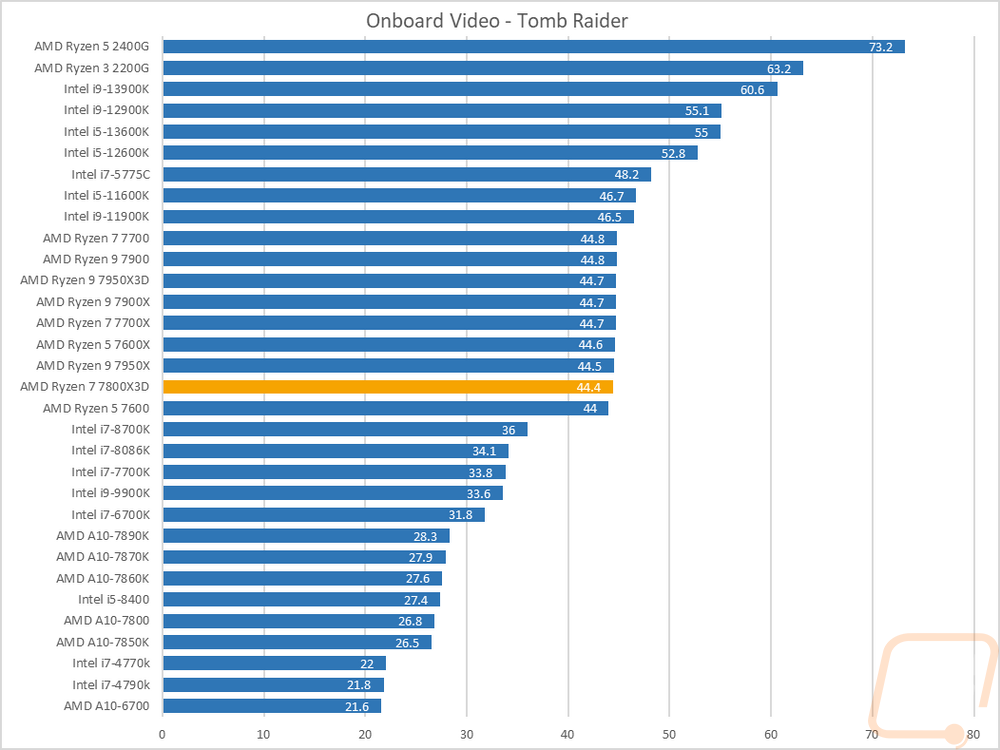
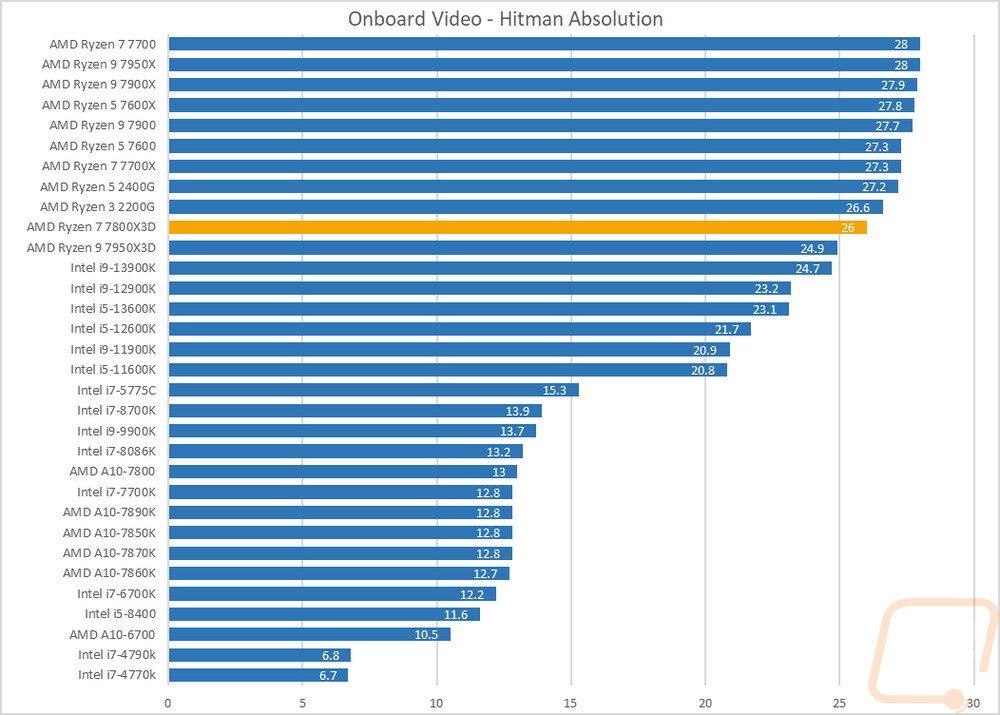
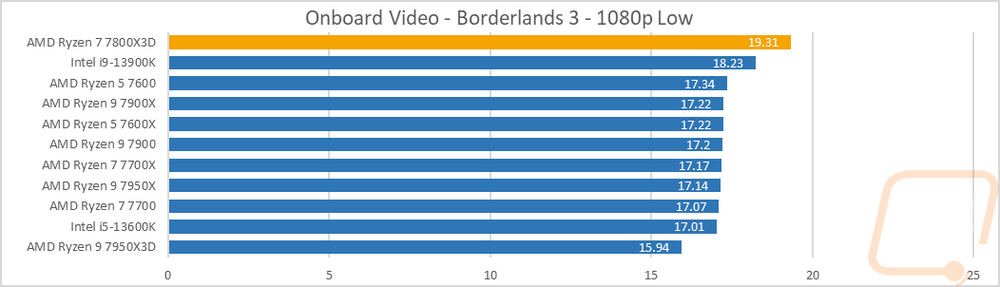
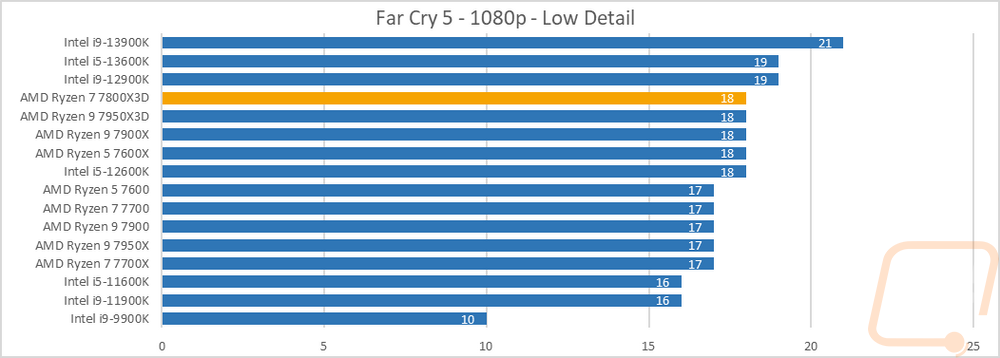
Then from there on, I jumped into game tests. Some of our tests are older games but I did also add in a few newer games as well to get an idea of newer games when tested at 1080p and low or medium settings. In Team Fortress 2 and Borderlands 3 the 7800X3D topped the charts which was a big change on both compared to the 7950X3D which struggled on both. In Ghost Recon Wildlands the 7800X3D matched the performance of the 7950X3D which both are up 4 or more FPS over the other 7000 Series Ryzen CPUs. In Far Cry 5 the 7800X3D is right with the 7950X3D and the other top 7000 Series CPUs but below Intel’s current-gen CPUs. Then in Tomb Raider, Shadow of the Tomb Raider, and Hitman Absolution the 7800X3D was slightly below the 7000 Series CPUs except for the 7950X3D which it is slightly faster. Overall though our onboard testing shows that while you can game on current onboard graphics, you are going to be limited to the lowest detail settings and often older games. Not that I see anyone using the onboard on the Ryzen 7 7800X3D more than as a temporary situation in between video cards.
Power Usage and Temperatures
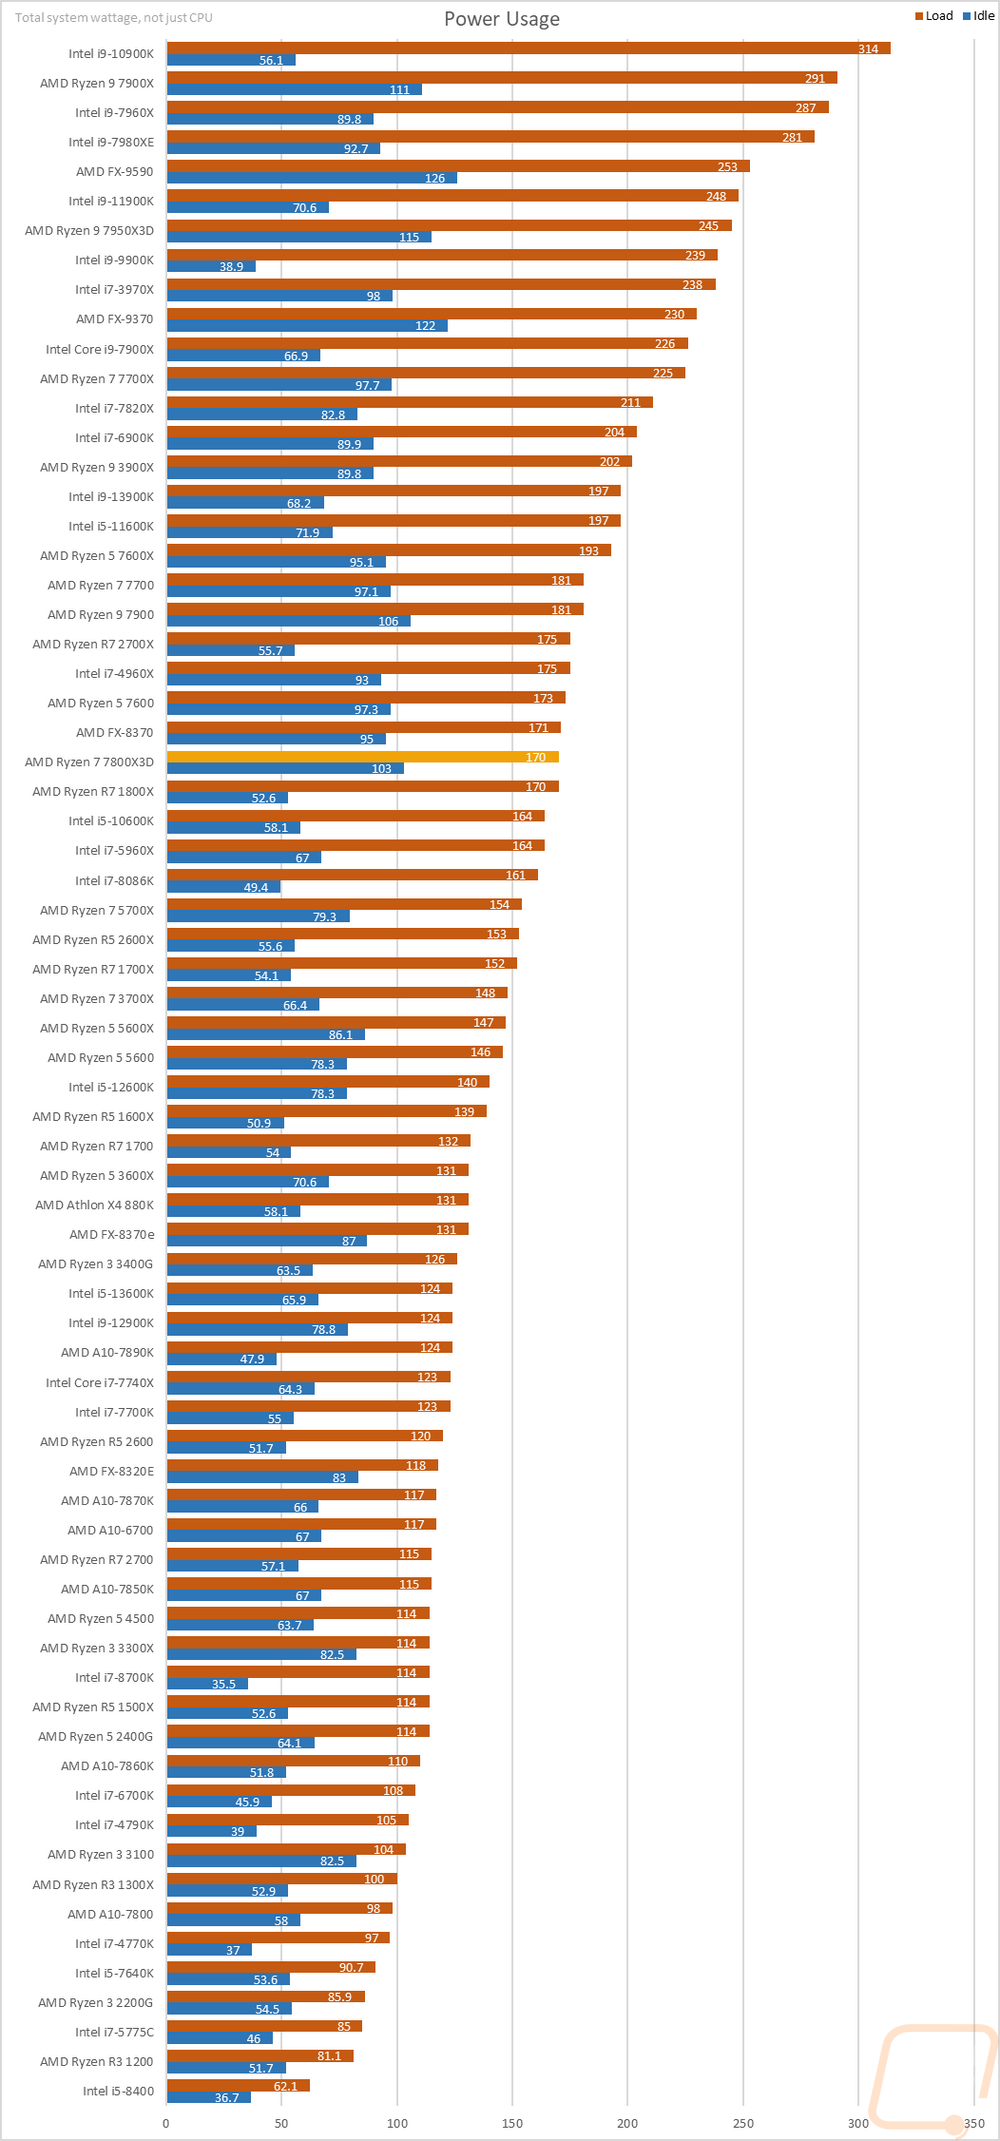
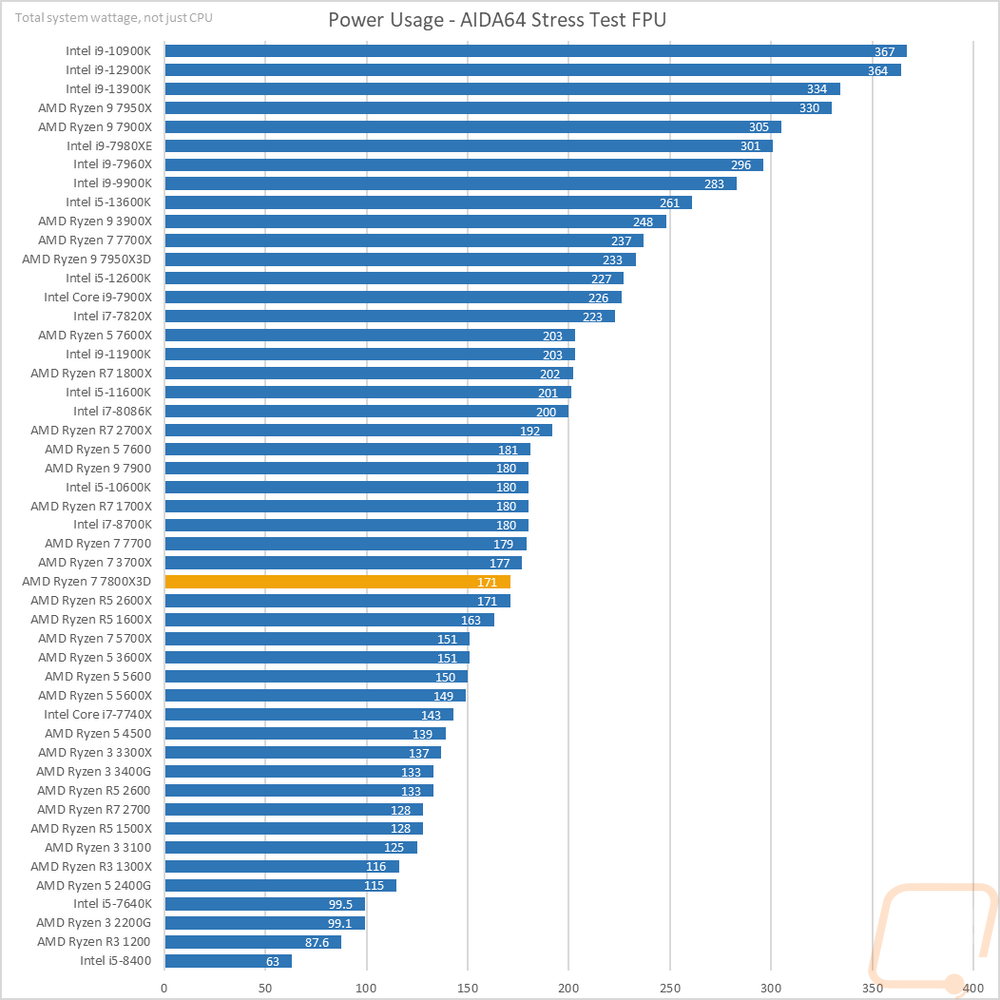
For some people, performance is the only thing important, but for others, power usage and temperatures also play a role so we do take a look at both of those as well. This is especially important in SFF or even just smaller mid-sized builds and it affects the components you need to get for your system as well as your PSU and cooler. To take a look at power usage I ran three different tests. I noted the idle power draw of our entire system then I took a look at the load wattage of the system using two different workloads. One was wPrime and the second was AIDA64 using their FPU workload which is extremely demanding. At idle the testbench with the 7800X3D pulled 103 watts which is down from the 115 of the 7950X3D but still high like the other Ryzen 7000 series CPUs. The 7800X3D has the same 120-watt TDP as the other 3D CPUs which is up from the 7700X. When put under load with wPrime the 7800X3D and test bench pulled 170 watts and the AIDA64 FPU workload had a similar wattage at 171 watts. This was surprising given the 120-watt TDP, putting the 7800X3D down around where the 65 Watt 7000 Series CPUs were running.
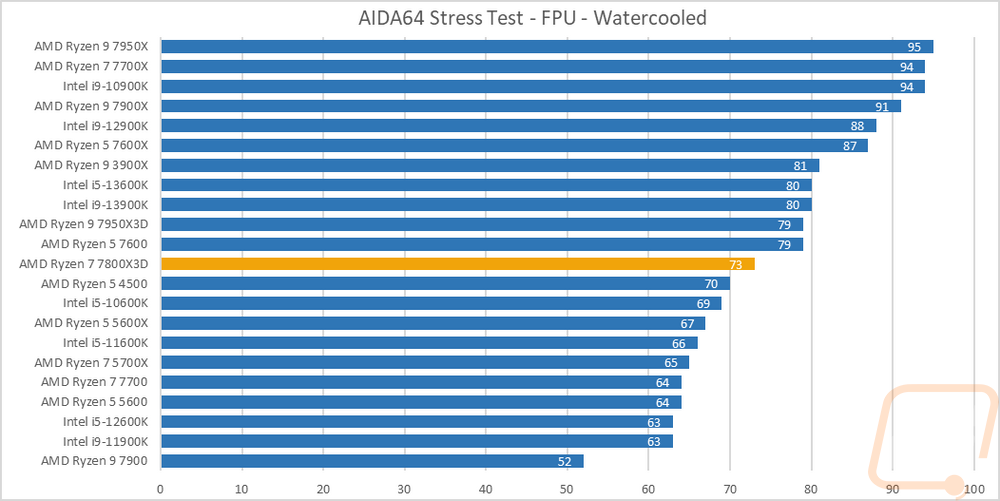
For temperature testing on the Ryzen 7 7800X3D while using the AIDA64 FPU workload I monitored temps until they leveled off. For cooling, we have our standard 240mm Corsair AIO cooler and the 7800X3D leveled off at 73c. This was 6 degrees lower than the 7950X3D did and is much more reasonable than the original higher TDP 7000 Series Ryzen CPUs which are up near the top of the charts.
Overall and Final Verdict
The initial 7950X3D and 7900X3D launch was exciting but there were a lot of people, myself included, that had the launch date for the Ryzen 7 7800X3D marked down. It’s not that the crazy high-end flagships aren’t exciting, but if gaming is your only focus it is not only a waste of money but sometimes it can even mean less performance for gaming. The Ryzen 7 7800X3D on the other hand is the successor to the 5800X3D which has been extremely popular for gamers whereas the two other CPUs with their higher core counts and their asymmetric chiplet design have more of a focus on content creation and raw processing power and the asymmetric chiplet design complicates things as well. So how did the 7800X3D end up performing? Well if you are a gamer and your focus is on gaming performance, its performance is impressive. Like with the other 3D V-Stacked Cache CPUs there are games where it doesn’t benefit but when it does it matches and sometimes beats the performance of the 7950X3D. The flip side of that though is because the 7800X3D has a lower boost clock speed and fewer cores than the 7950X3D and 7900X3D in clock speed dependent applications it runs near the bottom of the 7000 Series product stack. In most of those tests, it sits between the 7600X and the 7700. In other words, if you will need top-level performance in applications beyond gaming the higher-end 3D CPUs might be the better option, or even cheaper CPUs like the 7700X. So there is a big tradeoff in performance that you will have to consider.
Beyond that, I was surprised that the Ryzen 7 7800X3D ended up running cooler than expected and its power draw in our power tests was an improvement as well. Most likely from its lower boost clock. Like the other 7000 Series Ryzen CPUs, its idle power usage was still higher than past generations and Intel’s offerings. Also if you are going in thinking that the boost clock can just be fixed with an overclock, you do have a few auto overclock options but full manual overclocking is locked down just like the 7950X3D, 7900X3D, and the 5800X3D.
For pricing, the Ryzen 7 7800X3D has an MSRP of $449 which is exactly what the last generation 5800X3D was priced at and up until now has been the go-to gaming CPU. This is $250 less than the 7950X3D and $150 less than the 7900X3D. But when it comes to standard non-gaming performance it does run in between the $299 7600X and $329 7700 so the gaming performance premium is $120+ and given just how well it performs in those situations I would say the extra money is worth it. I would still love to see something in between the 7800X3D and the 7900X3D with the same single chiplet design but with the higher boost clock that the 7950X3D and 7900X3D have, but as it sits this is still a monster gaming CPU.

Live Pricing: HERE


