CPU Performance
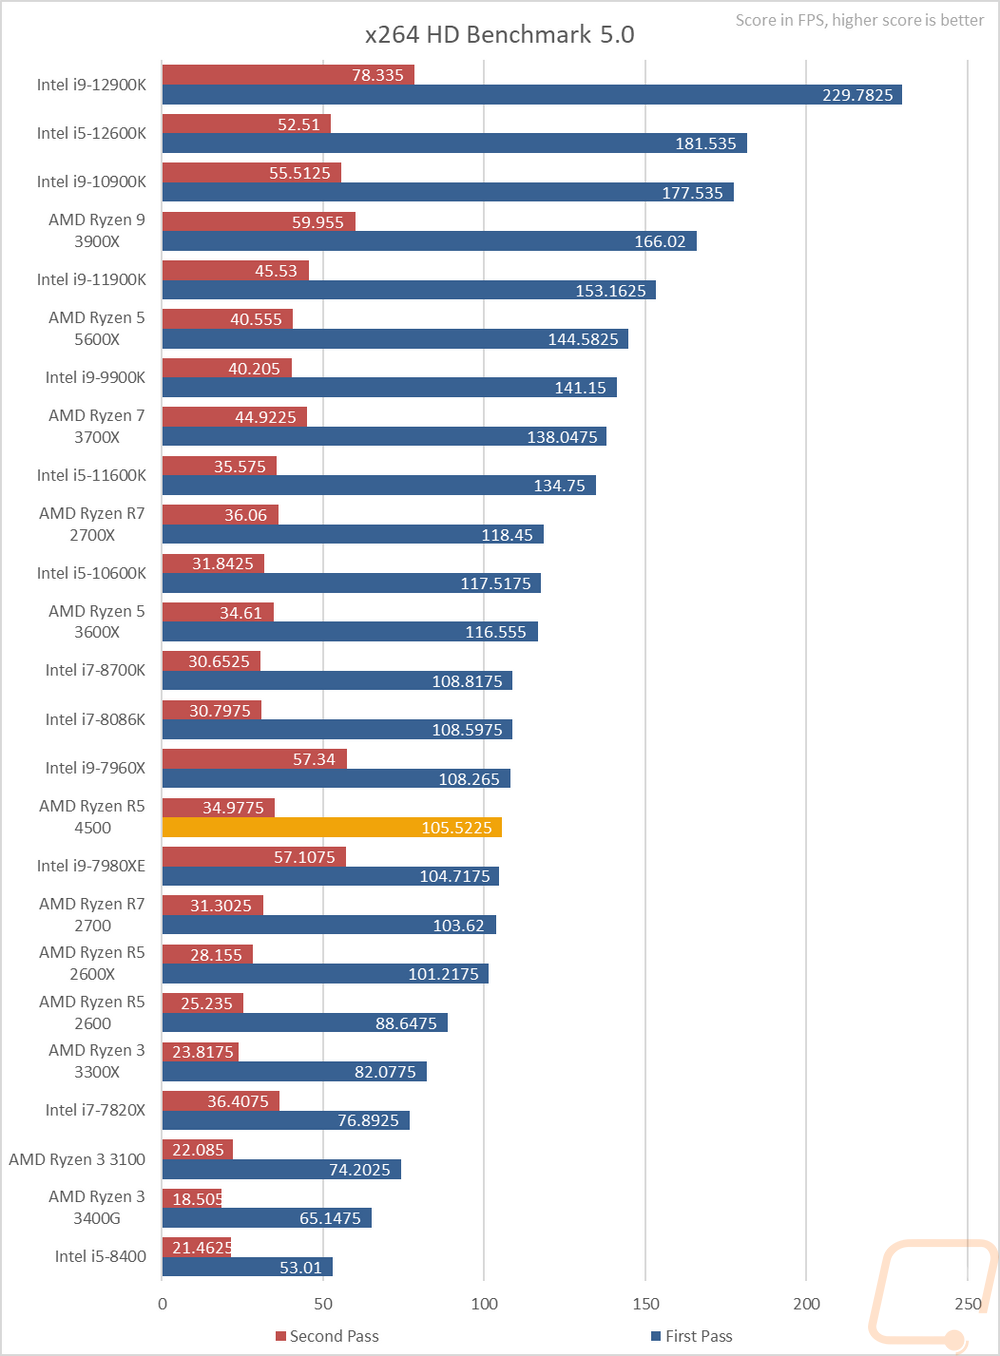
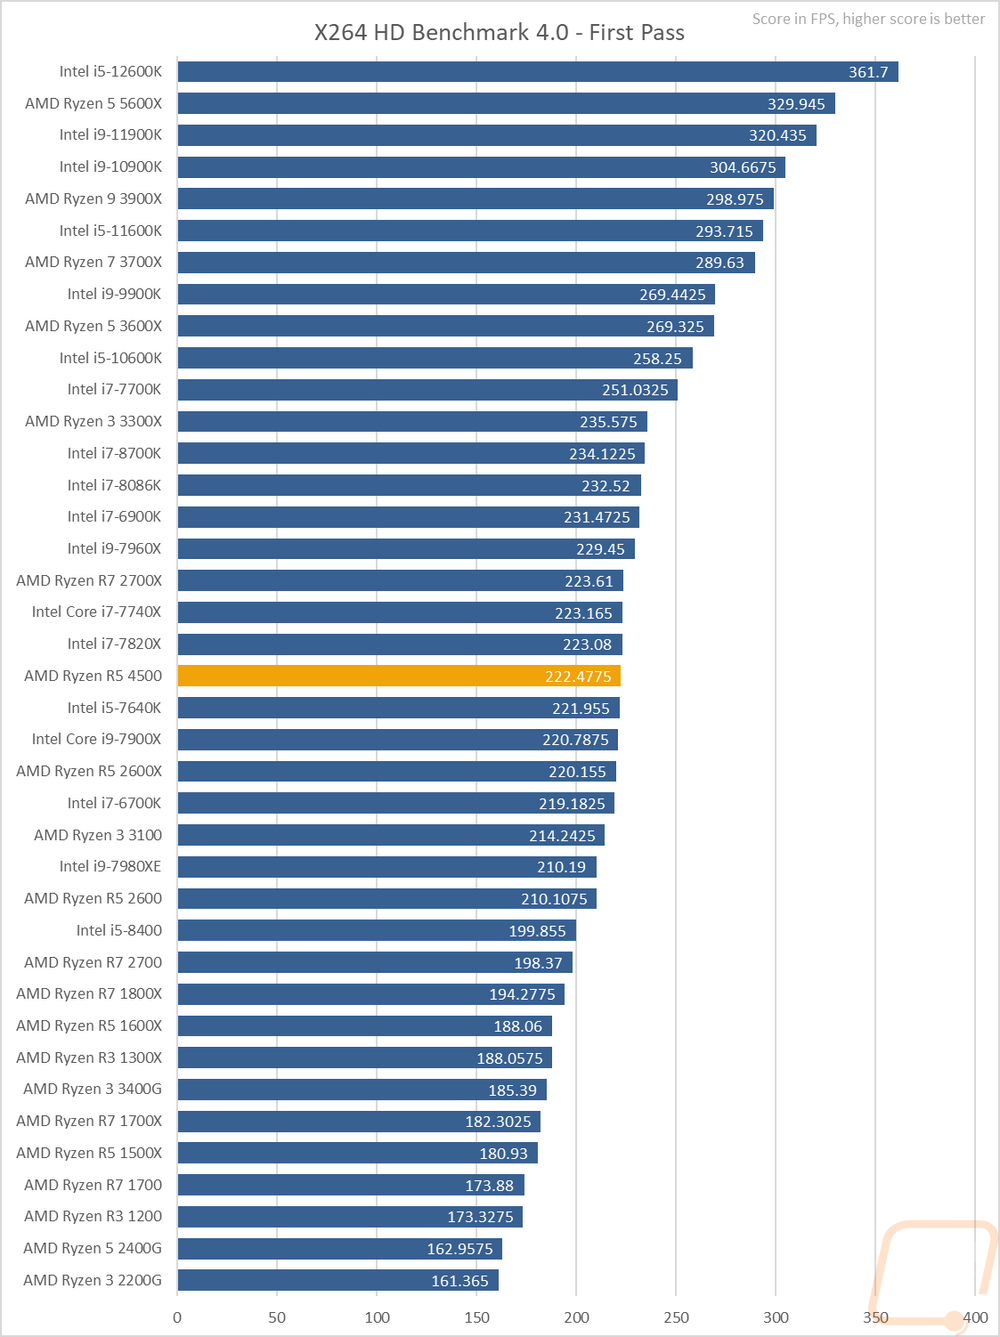
Before getting into testing I did update the BIOS on our Crosshair VIII Hero WiFi to support the latest CPUs then jumped into testing the Ryzen 5 4500. This starts with the two X264 HD benchmarks, the older 4.0 and the “newer” 5.0 tests. These take a look at encoding performance, averaging out the FPS when encoding different videos for the scores. The Ryzen 5 4500 which by most accounts would be a budget CPU did a lot better than I expected, putting its 6 cores and 12 threads to use. In 5.0 it came in 3 FPS below the i7-8700K for the first pass and ahead of it in the second pass which was close to the 3600X which has the same 6/12 core/thread configuration but a higher clock speed. In the older X264 HD 4.0, the Ryzen 5 4500 is right in the middle of the pack.
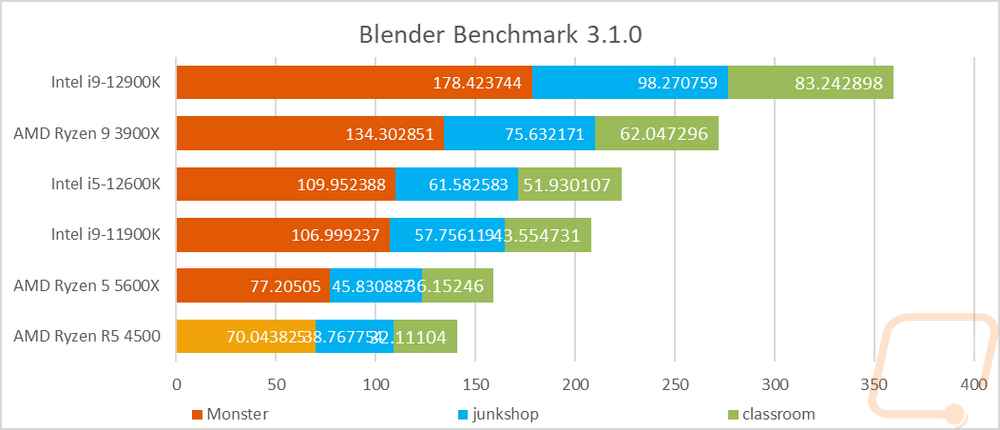
For our next test, I wanted to compare the Ryzen 5 4500 in Blender but the Blender Benchmark has been recently updated to support the new Blender 3.0 but this dropped support for our older 2.9 tests entirely and I didn’t have the test window to get back through some of our older CPUs for testing. I was able to get the 5600X and 3900X from AMD and a few of Intel’s latest CPUs tested. The new test gives an overall score for each of the three tests ran. I have stacked all three results together to give an overall picture. I was surprised that the 4500 and the newer 5600X weren’t as far apart as expected. Blender defaulted to core count which you can see the older 3900X which has 12 cores was still up in the running.
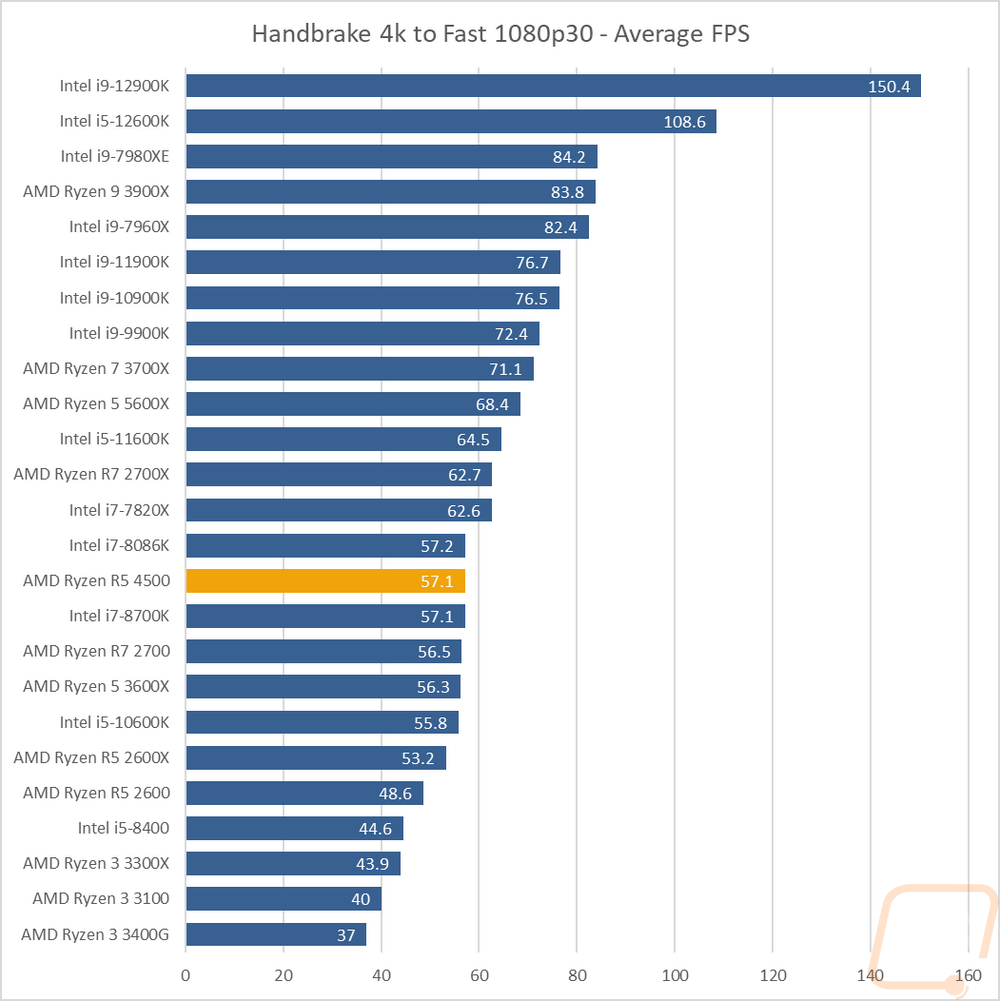
Continuing with the video encoding theme I also have handbrake which is an open-source transcoder. For this test I am taking a 4k video down to 1080p 30 FPS, the results are the average FPS of that task. Once again the Ryzen 5 4500 was sitting in a group right in the middle of the pack. It’s impressive that it ran right with the 10600K and the 8700K with their higher clock speeds.
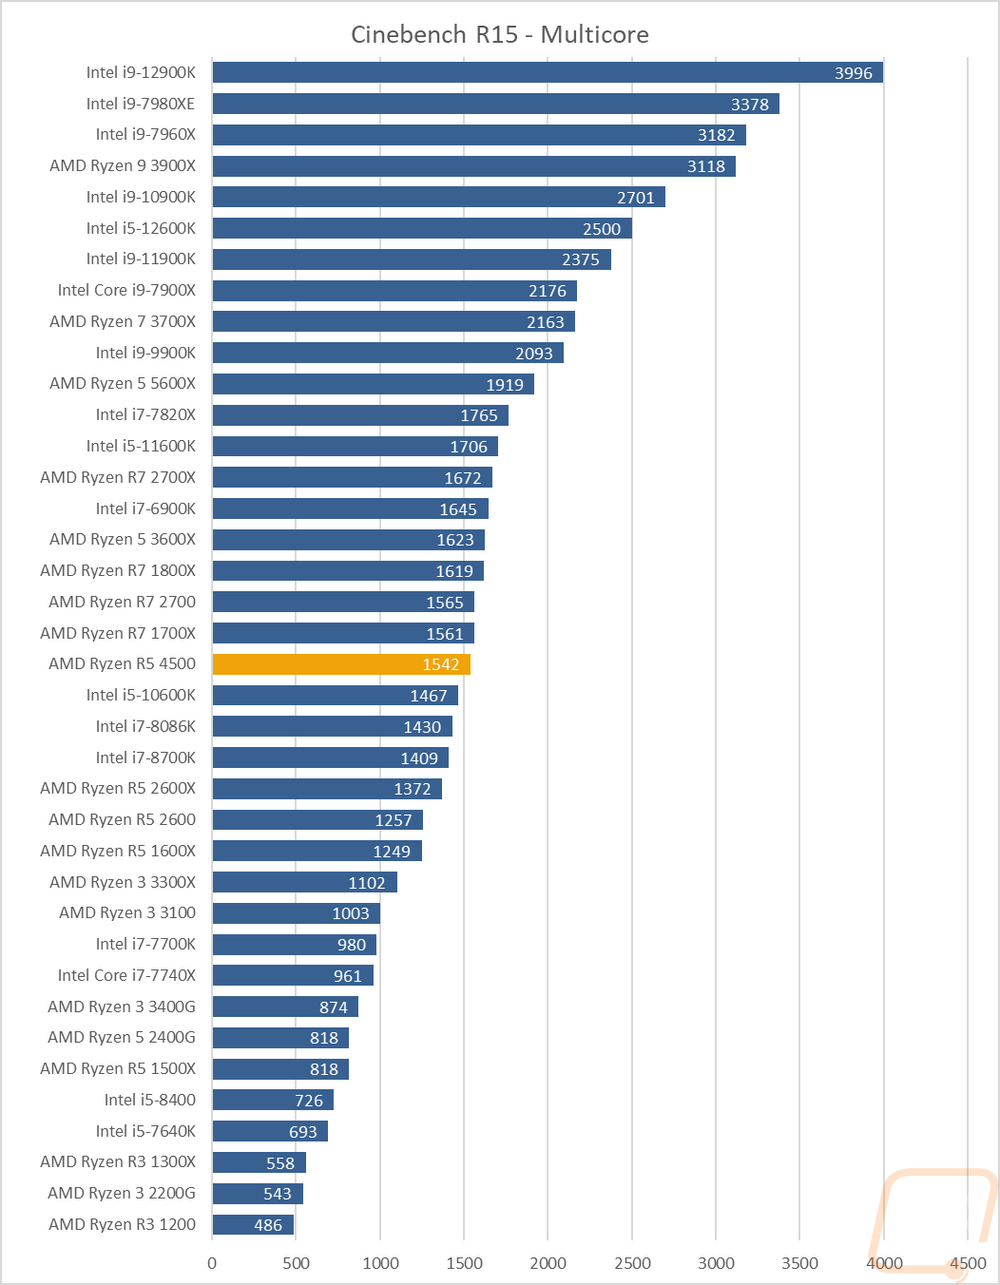
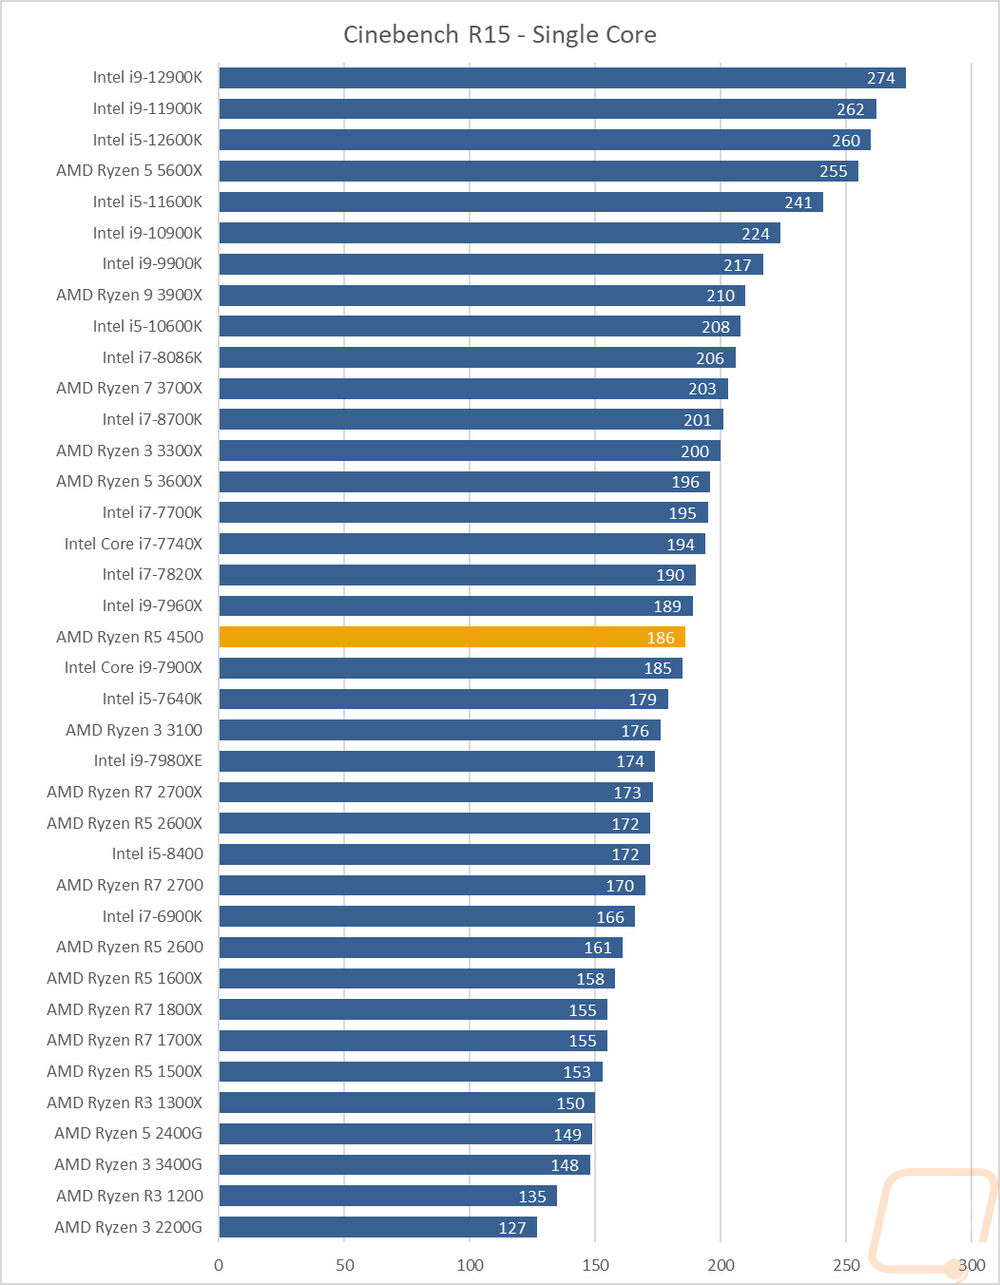
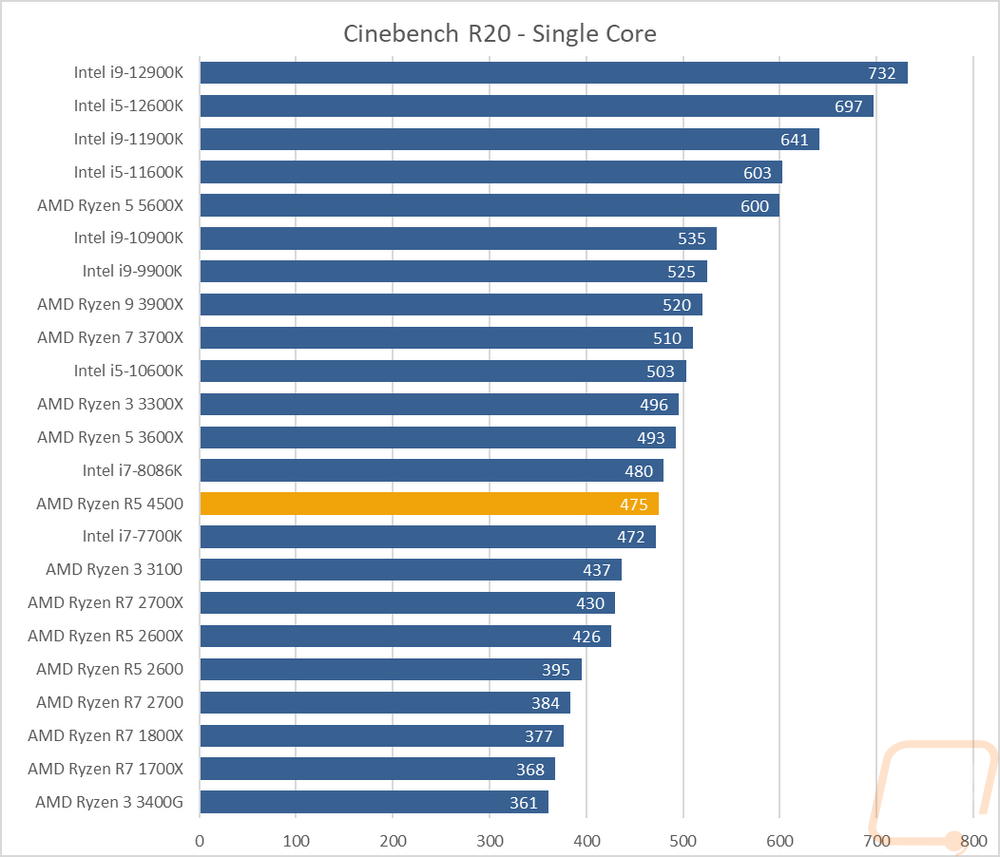
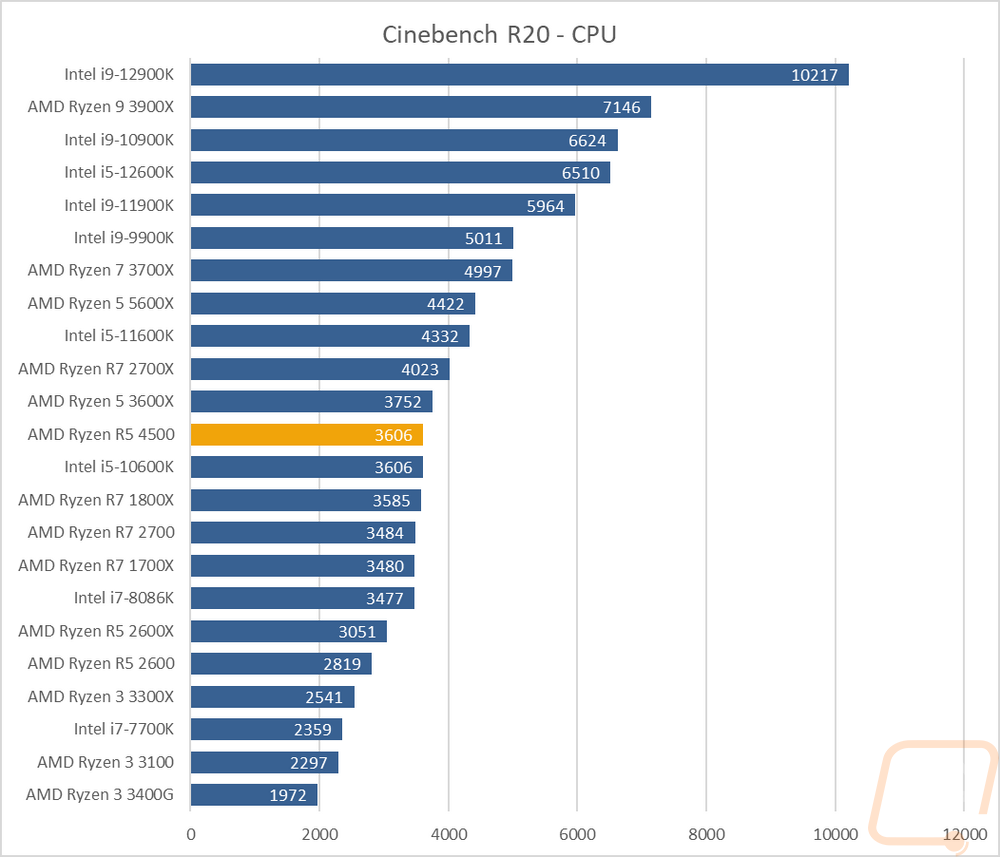
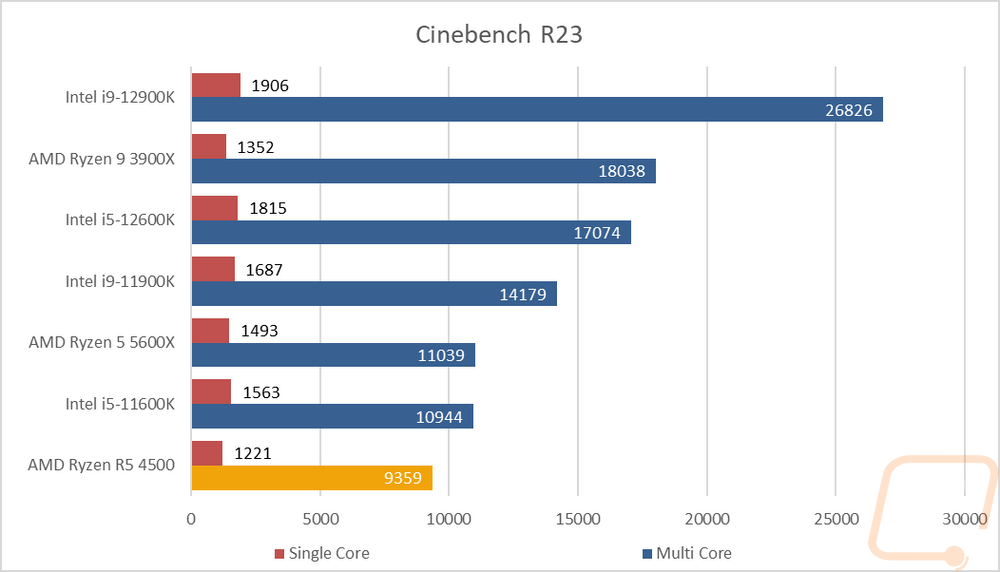
For the always popular Cinebench, I ran the three most recent versions. The older R15 and the R20 both better fit the older architecture of the 4500 and we have more results going back on those as well for a better comparison. The 4500 came in ahead of the 10600K in R15 multicore and the R20 test helped by having the two extra cores. The single-core tests are interesting though, the 4500 isn’t too far behind the higher clocked 3600X but I’m impressed that even with a 4.1 GHz boost clock it isn’t doing too bad against the 7700K which while dated is still a competent CPU when it comes to single-core speeds. In R23 the 4500 is of course behind the latest and greatest.
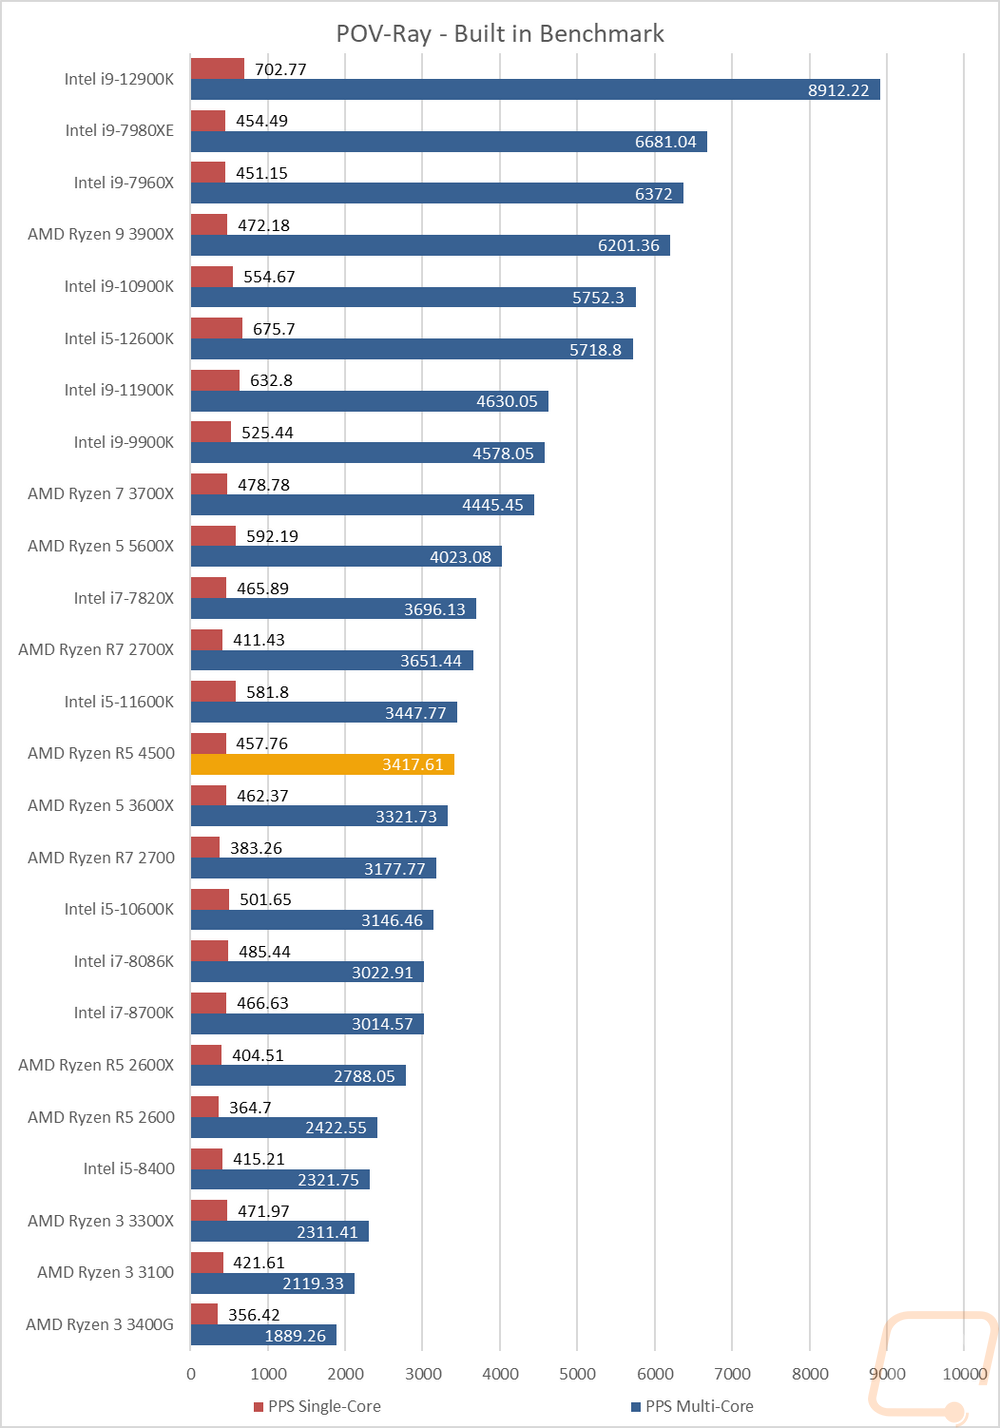
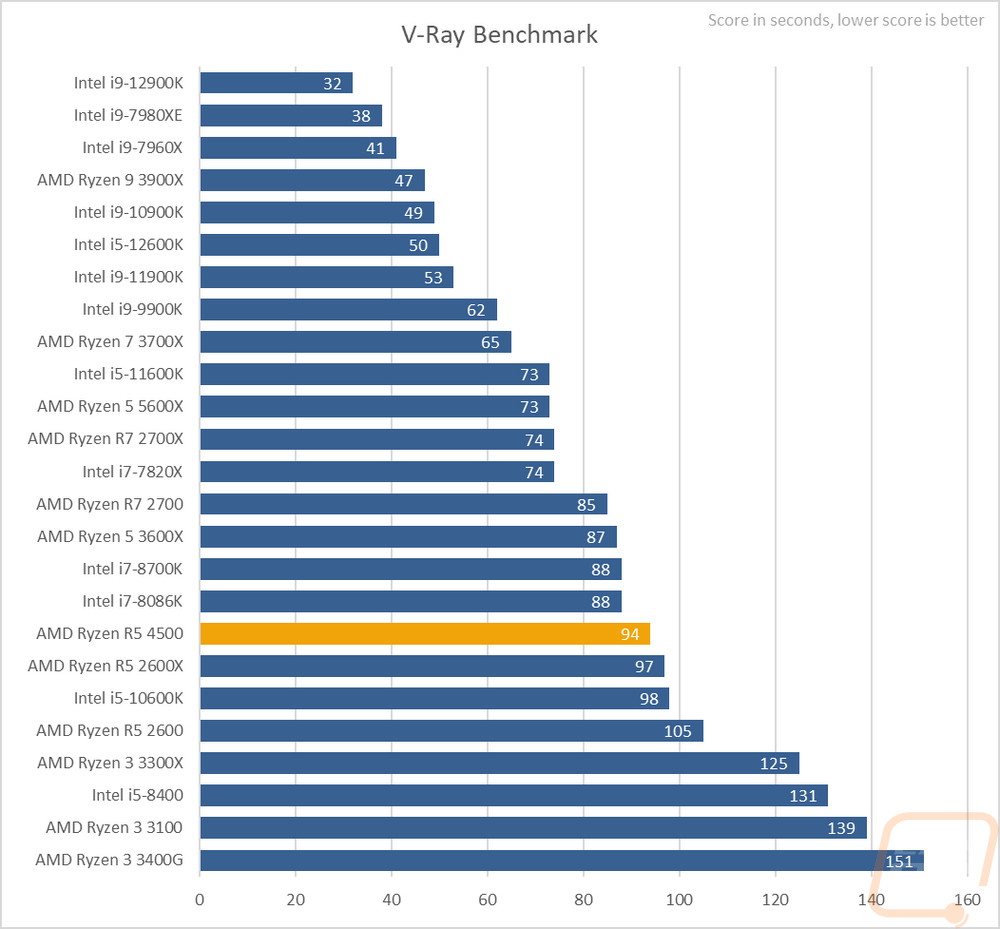
Next up were ray tracing focused rendering benchmarks. Here I tested the 4500 in POV-Ray and V-Ray. POV-Ray was also tested with a single core and across all of the cores. The 4500 is once again sitting in the middle of the pack on the multi-core test in POV-Ray sitting just behind the 11600K which is impressive in itself. In V-Ray, it did a little worth being in the 1/3 range but was faster than the i5-10600K.
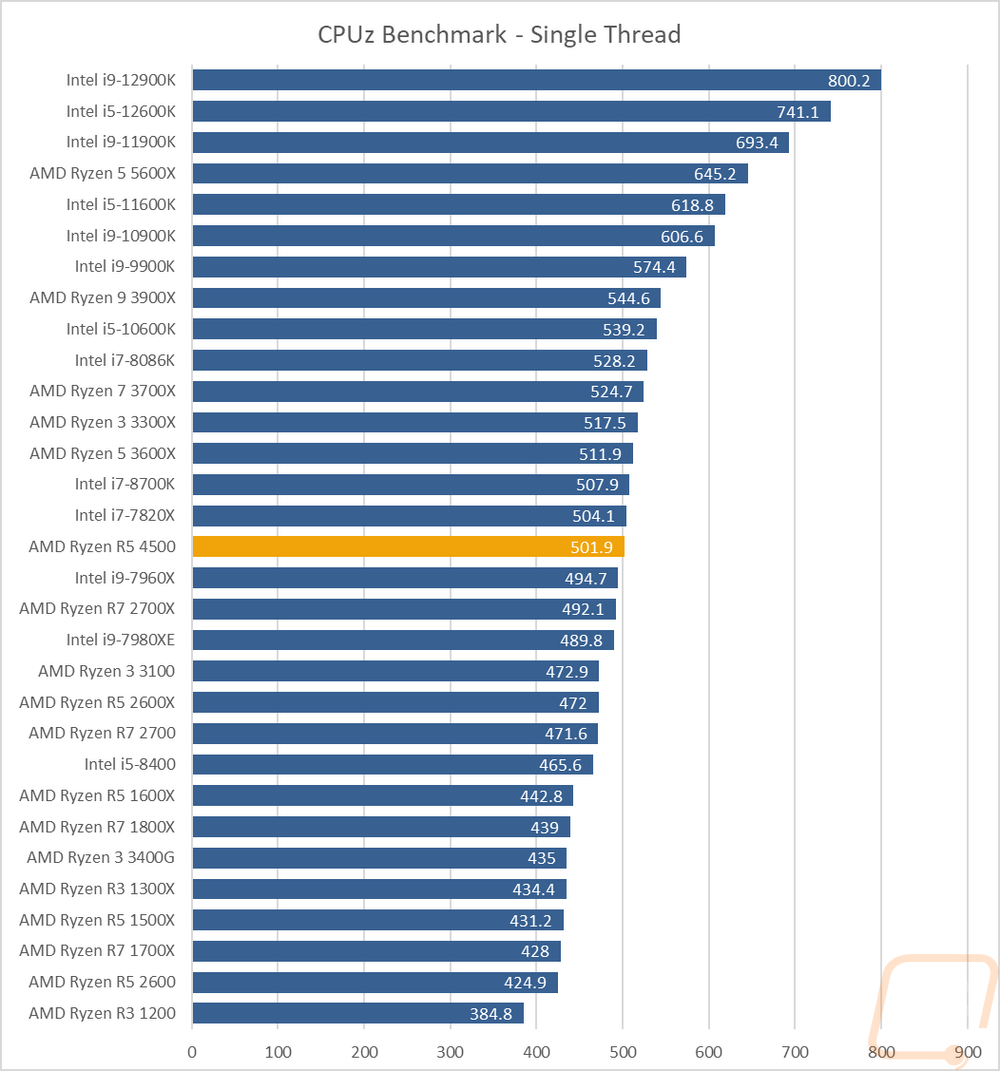
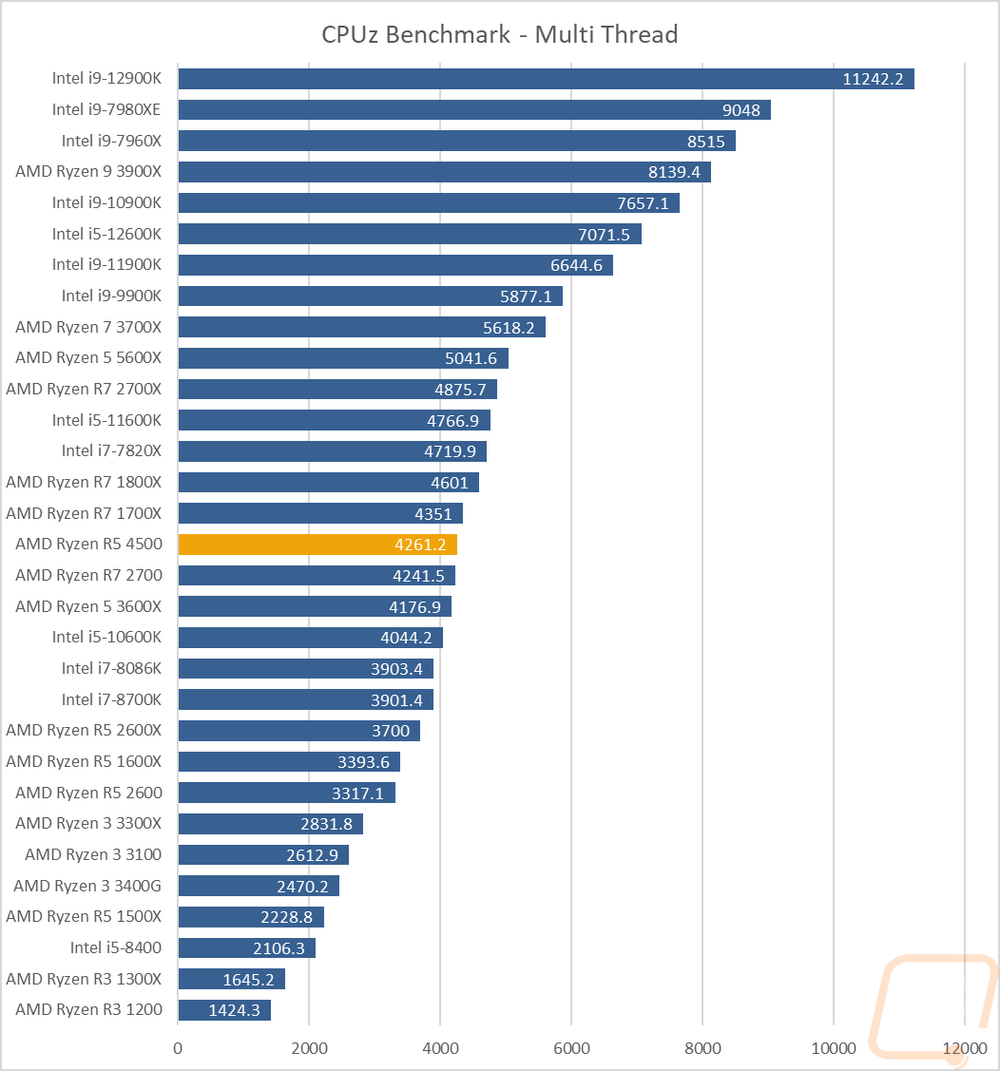
I also tested using the CPUz’s built-in benchmark which does run on a single thread and with all threads. In both tests, the Ryzen 5 4500 sits in the middle of the pack. For the single-core, it is sitting a few points behind the 8700K. The multi-core test has some of the older first-gen Ryzen CPUs in the mix due to their higher core counts but it is impressive to see that today's budget CPU is running right with the Ryzen 1700X from the Ryzen launch and out ahead of the i5-10600K.
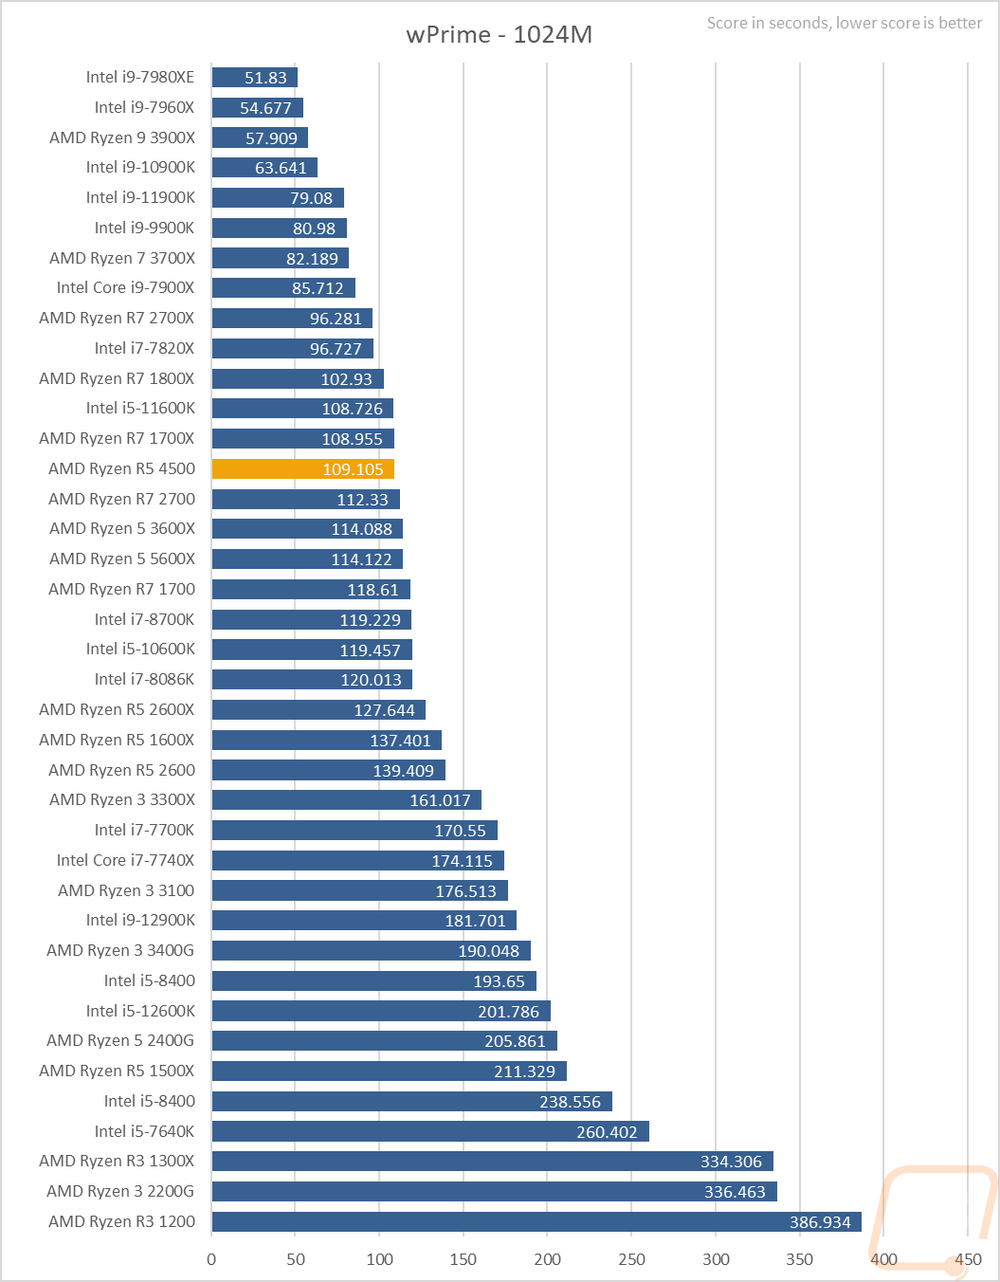
Next, we have wPrime which is a classic overclocking benchmark that calculates pi out to 1024 million digits and is timed. This is a multi-thread heavy test and the Ryzen 5 4500 with its 6 cores didn’t do too bad here running with the 8 core 1700X and not far off from the i5-11600K.
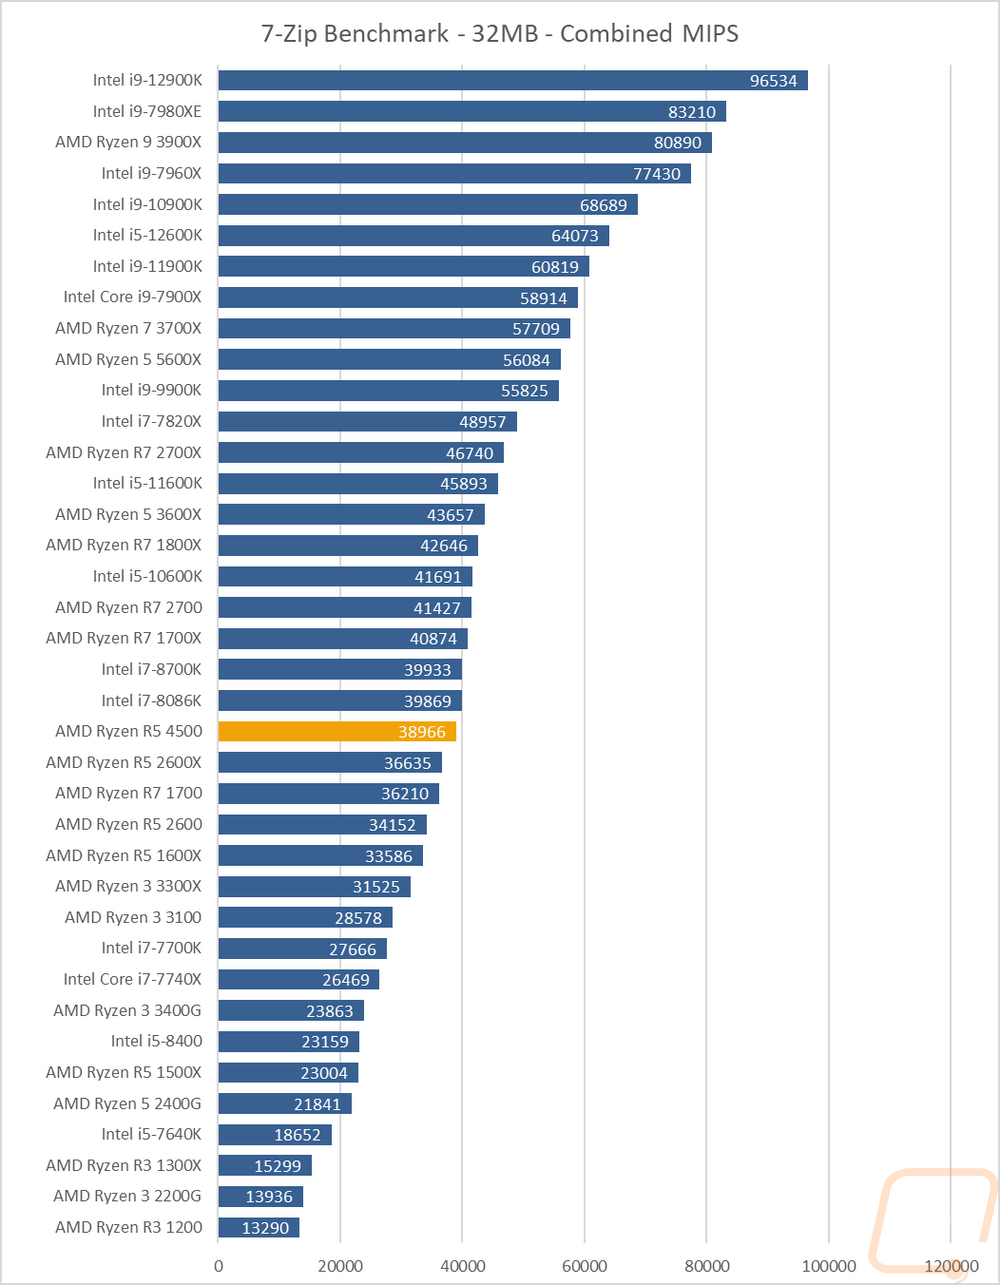
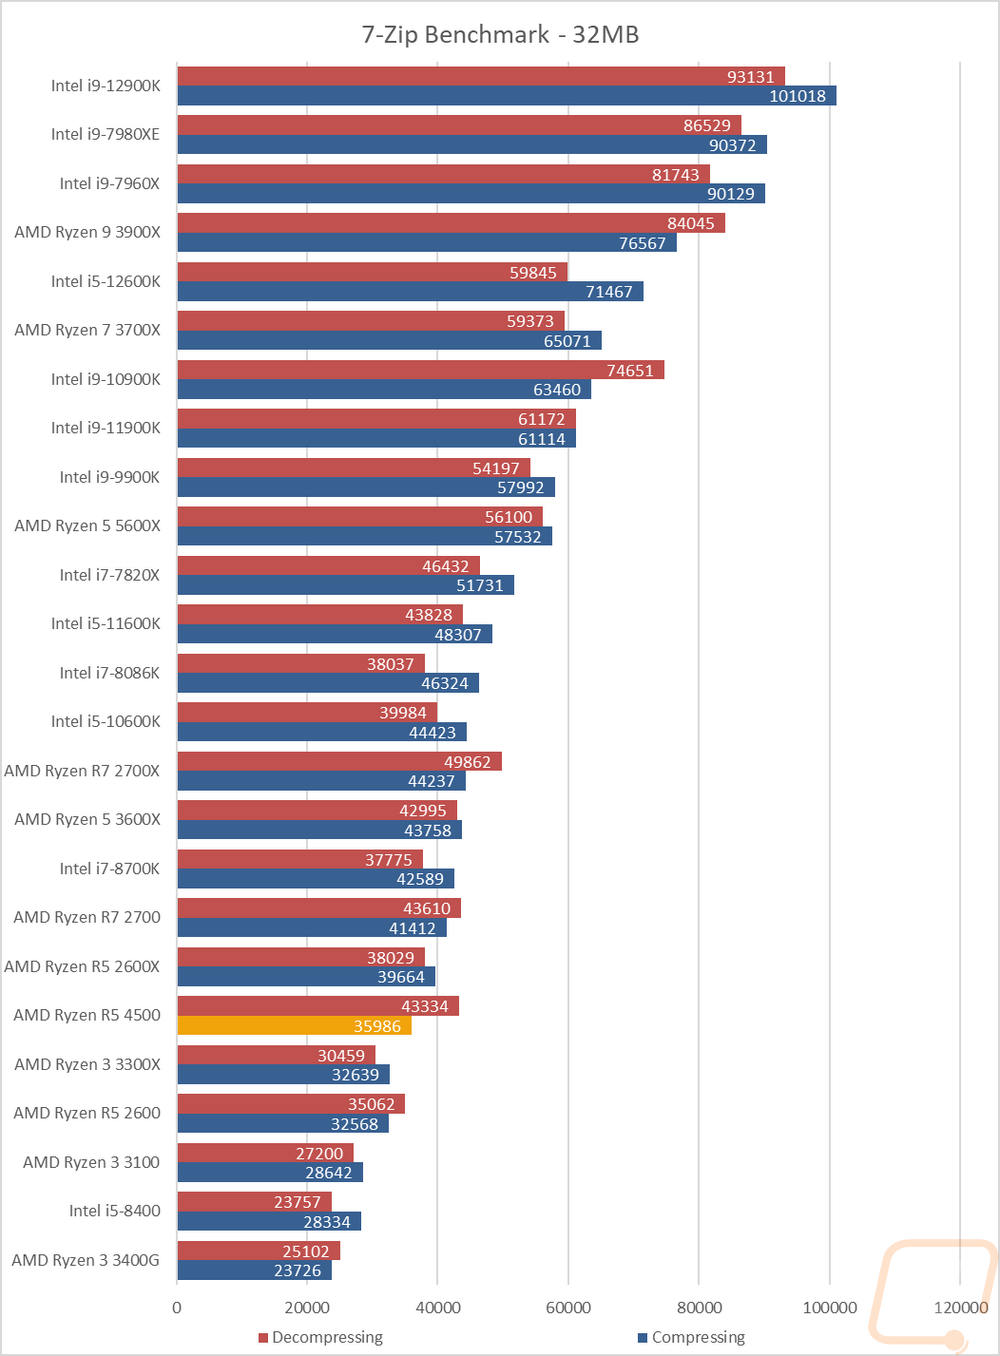
7 Zip is another open-source program, this time for compressing and decompressing all of your files. Here I have run the benchmark and we have three results. The combined MIPS is a combination of compressing and decompressing performance. Then I have it broken down between the two. This workload likes extra cores which can be seen with the CPUs that are up at the top being some of the older high core count CPUs that I have tested in the past. The Ryzen 5 4500 is in the middle for the combined result running just behind the i7-8086K and ahead of the 2600X. The second graph is sorted by the compressing results which the 4500 didn’t do as well on putting it down lower. Its decompressing results however are great which is how the combined result was so much higher up.
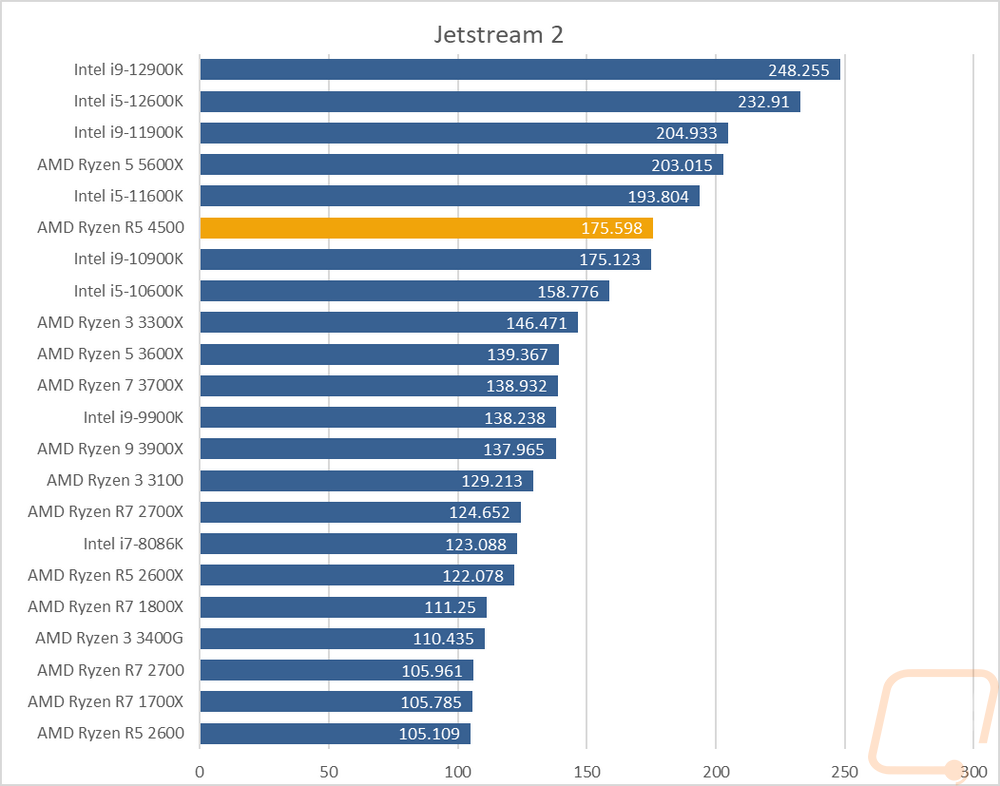
Jetstream 2 is a compilation benchmark that takes a long list of HTML5 and Java in-browser tests and runs them all three times and puts together an overall score. I love this benchmark because lets be honest, most people are using their browser more than any other game or program. Jetstream gives some interesting results sometimes though but it tends to prefer high IPC or single-core performance and there are some situations where it prefers lower core count CPUs. For the 4500 it did well coming in in the top 1/3 of the chart and running right with the i9-10900K.
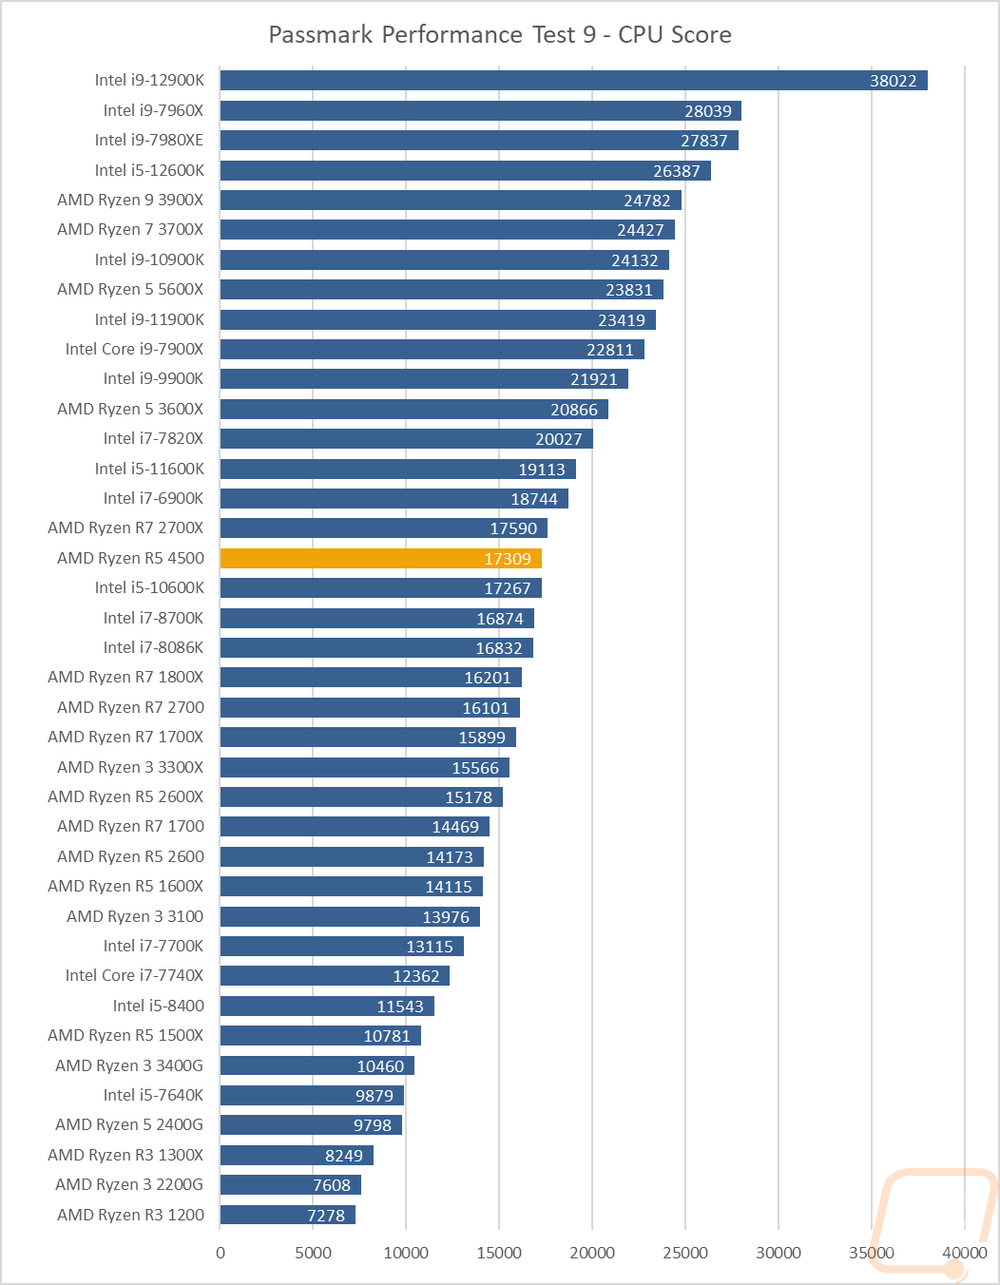
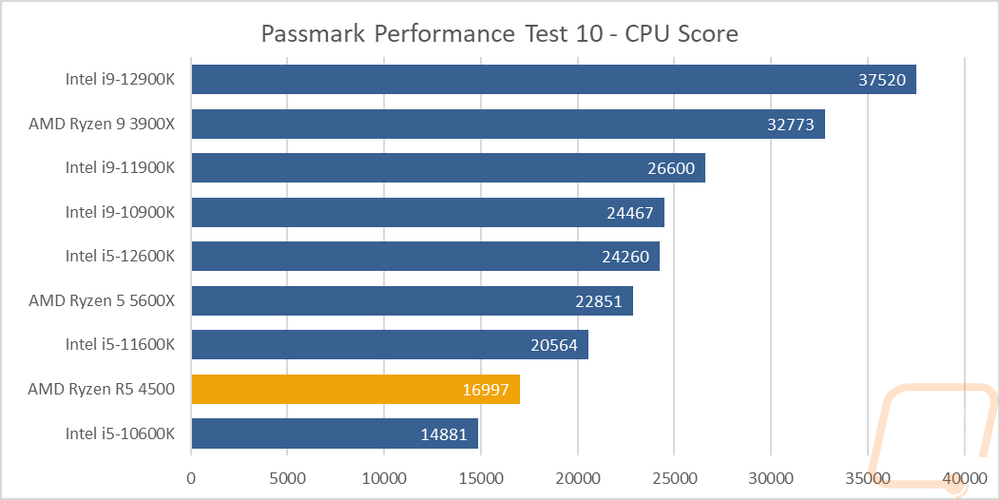
For Passmark Performance Test I took a look at both the older version 9 and the newer version 10. On both, I only look at the overall CPU score which takes a few different synthetic benchmarks and combines the results to put together an overall score. In version 9 we have more of the older CPUs in our results and the 4500 is sitting in the middle of the graph above the 10600K but below the 2700X which has a higher core count. In 10 the result is similar, but with fewer points of compassion. But the i5-10600K is in there and farther back behind the 4500 here which given that it is also a 6 core 12 thread CPU is impressive that a budget CPU is running with Intel’s higher end mid range from just a few years ago.
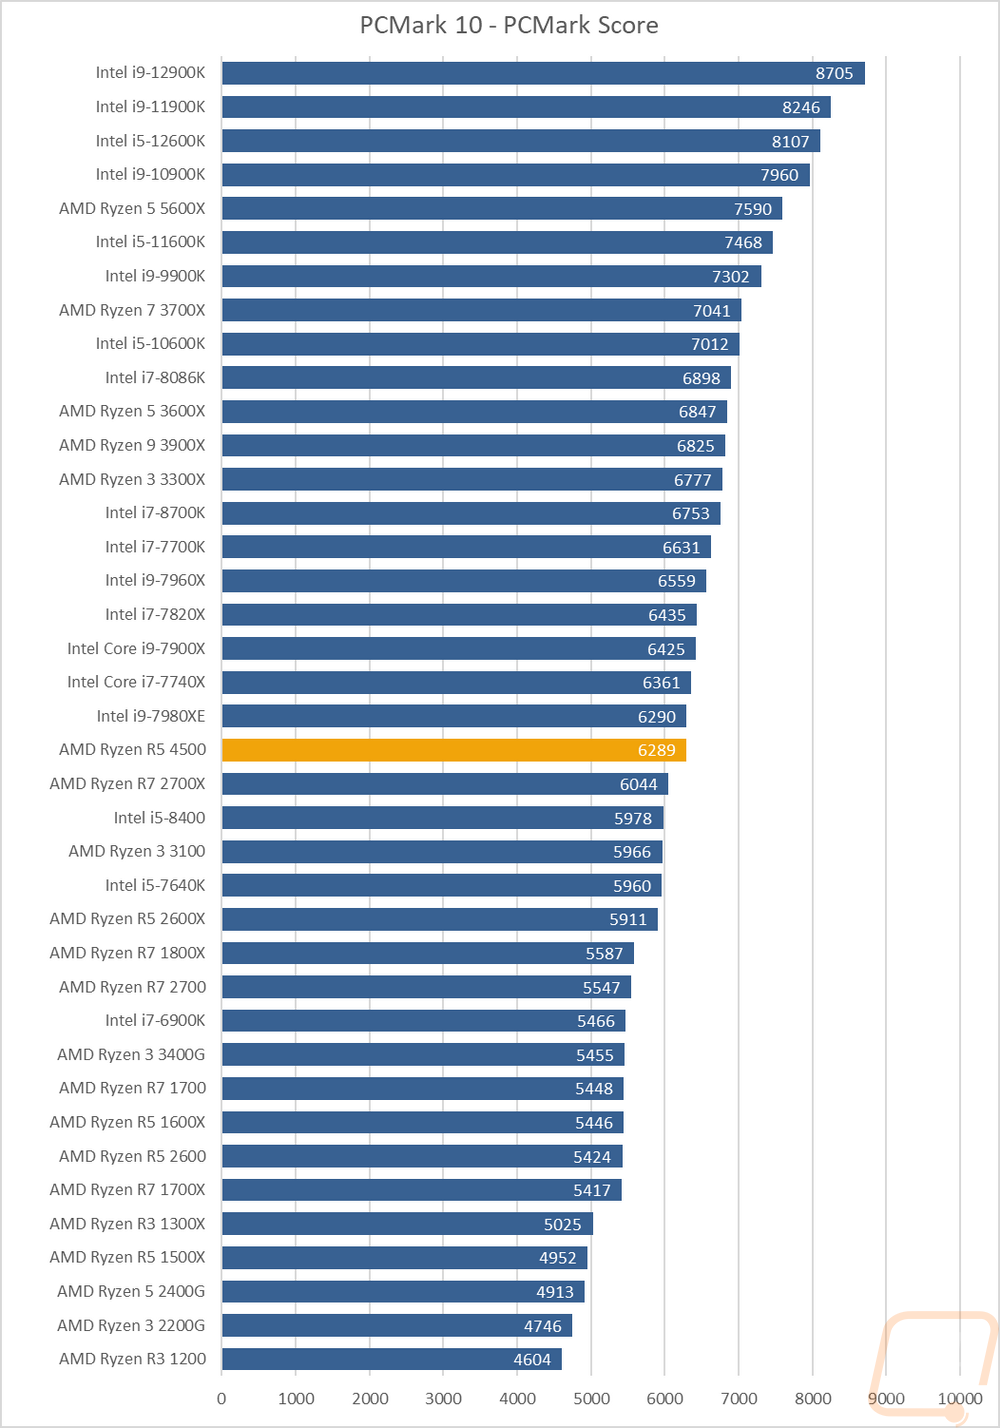
PCMark 10 is a great test because it tests things like video calls, browser performance, excel, and word performance to give an idea of real-world performance. It tends to like higher clock speeds which you can see all of the 5 GHz CPUs up at the top. The Ryzen 5 4500 is sitting in the middle here running ahead of the 2700X but with some of Intel’s older higher clock speed CPUs ahead of it like the 8700K and 7700K.
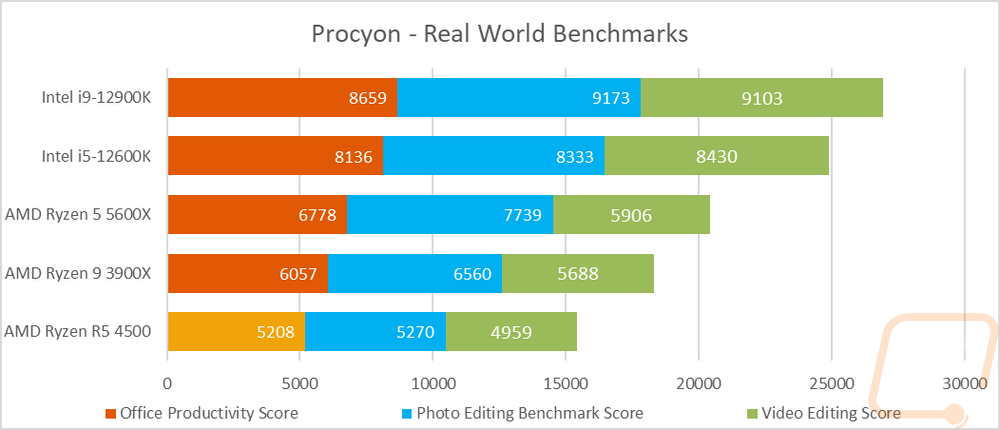
This time around I have added in true real-world testing with the UL Procyon benchmarks. There are three overall benchmarks, first is the Office Productivity Benchmark which uses Microsoft Office 365 to test actual performance in word, excel, PowerPoint, and outlook. The second benchmark is the Photo Editing Benchmark which is run using the latest version of Photoshop as well as Lightroom Classic to look at photo editing performance. Then the last test is the Video Editing Benchmark which uses the latest version of Adobe Premiere Pro to test video editing performance. I have all three scores stacked together to get an overall look at the performance. The Ryzen 5 4500 is down at the bottom of the CPUs tested so far but it did hold its own in all three tests.
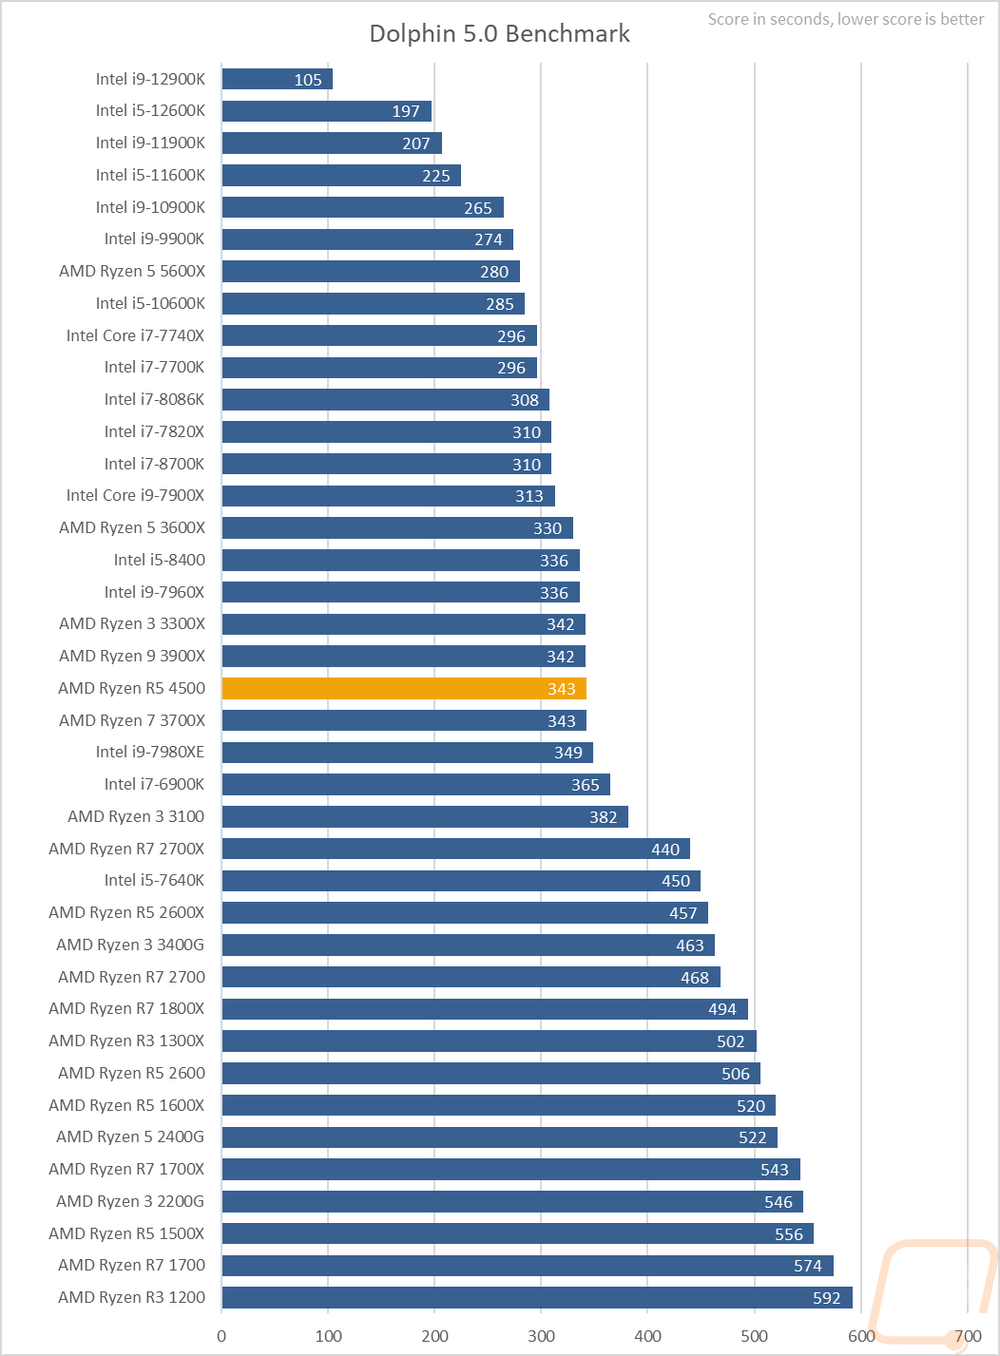
Moving the focus over towards gaming my next test is using Dolphin 5.0 Benchmark. Dolphin 5.0 is a Wii emulator and like most emulators, it doesn’t care about high core counts at all. In fact, it only runs two in total. Clock speeds are king here, in addition to Dolphin favoring Intel in general. AMD has improved a lot here with the Zen 3 CPUs but with the 4500 being Zen 2 it is still back in the middle of the pack and right with the 3900X as well.
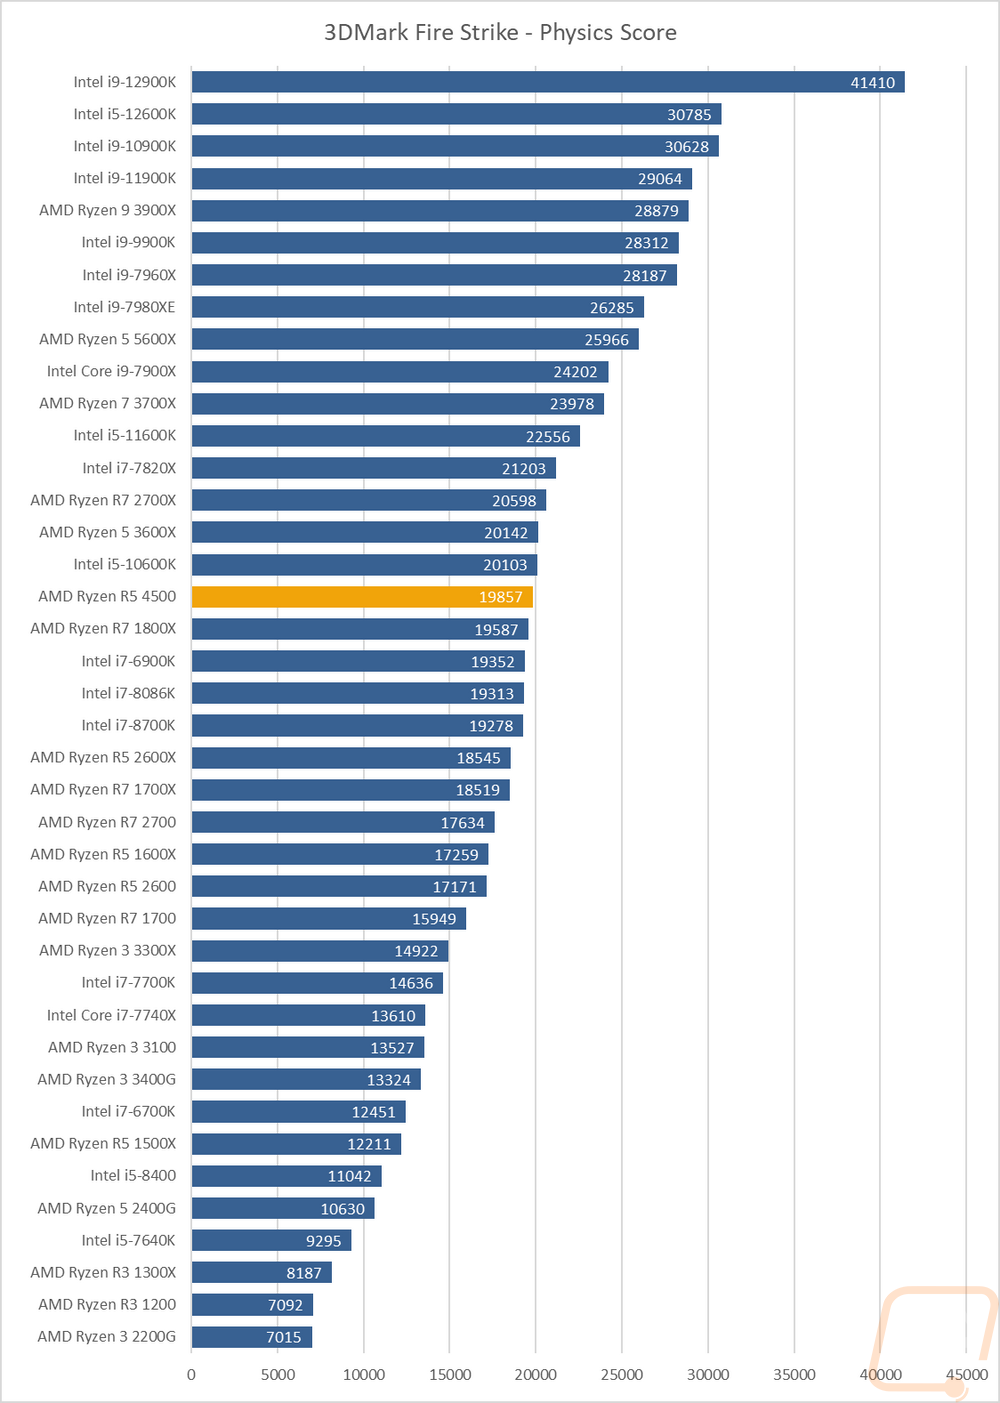
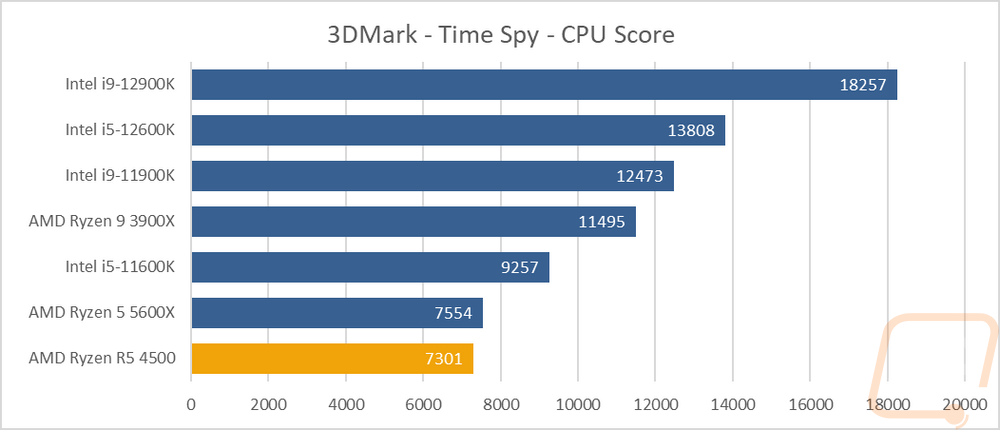
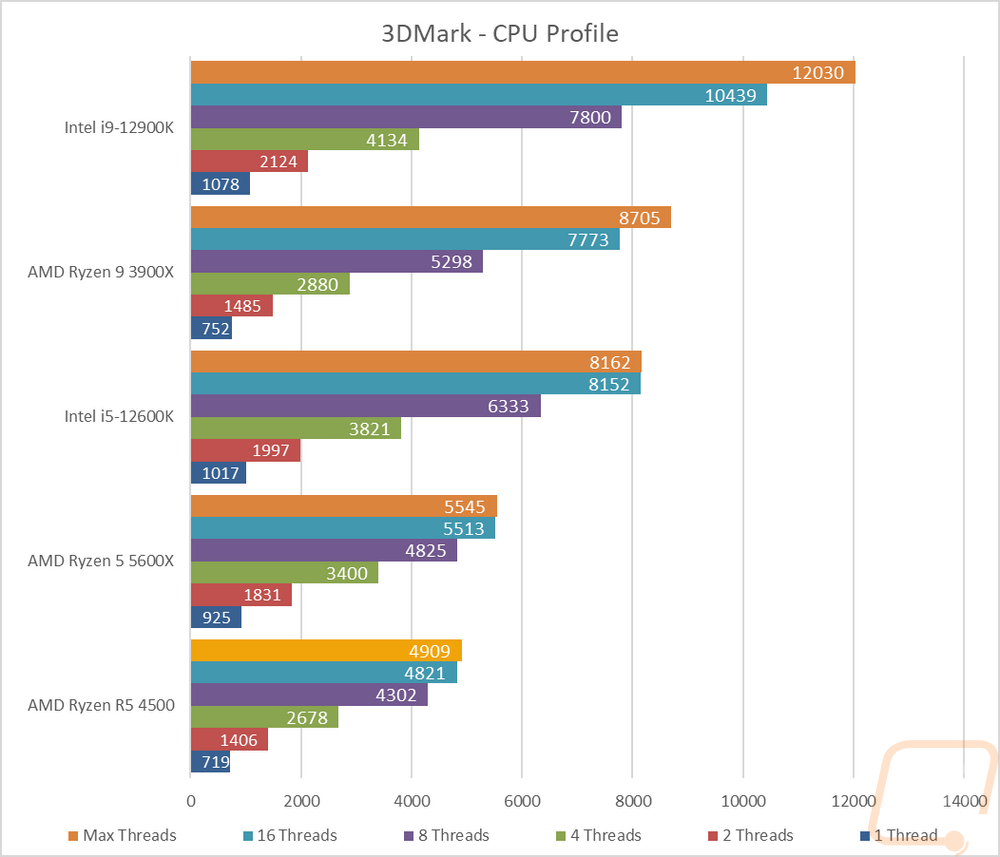
Before diving into game testing I wanted to check out synthetic performance using 3DMark. I tested with the older DX11 Fire Strike test as well as the newer DX12 Time Spy. I also added the new 3DMark CPU Profile benchmark into the mix as well that does a good job of showing the full range of thread counts that you might see being used in games as well as a max threads option that does everything above 16 threads. The 4500 having 12 threads does level off in the 16 and max thread tests and sadly I don’t have a lot of the most recent CPUs for comparison here so it puts it down at the bottom of that test. The same goes for the Time Spy test but there the gap between the 5600X and the 4500 was minimal. For the older Fire Strike benchmark, the 4500 is in the middle of the graph running just behind the 10600K and ahead of the top end first-generation Ryzen 1800X as well as older high-end CPUs from Intel like the 8086K and 8700K.
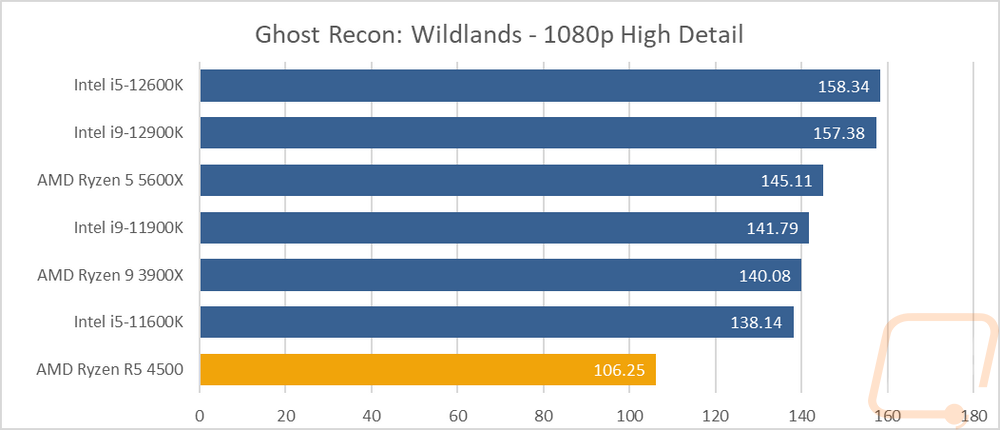
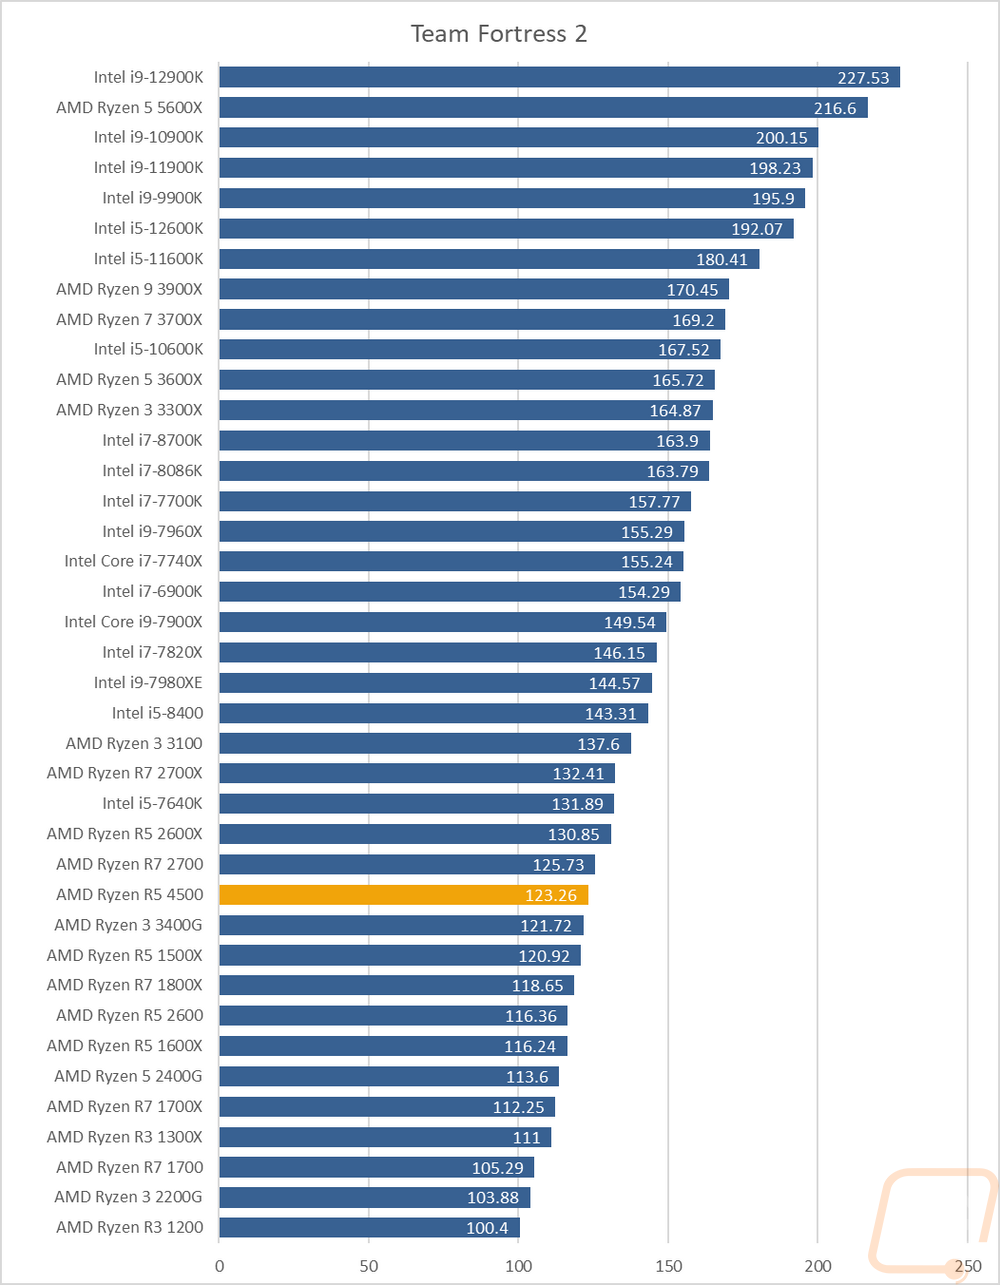
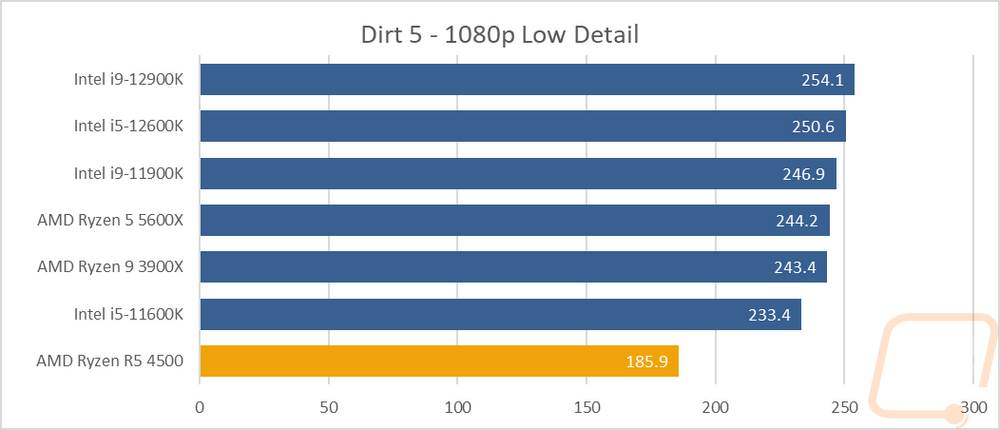
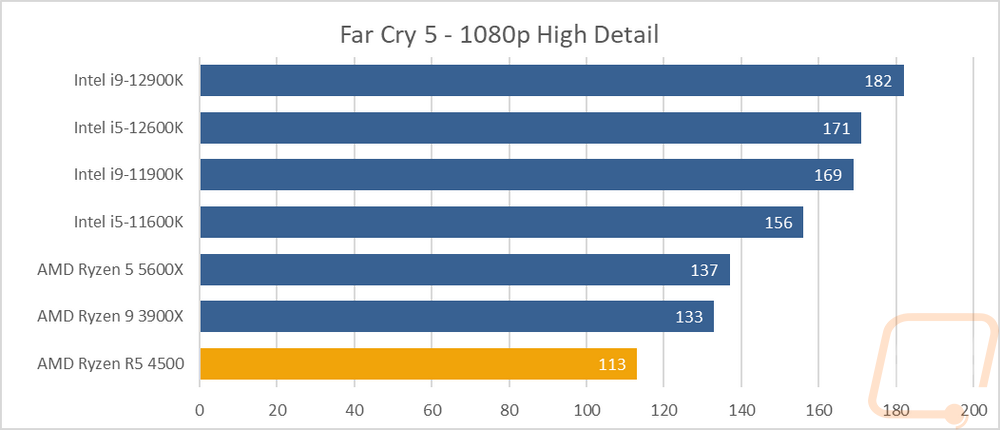
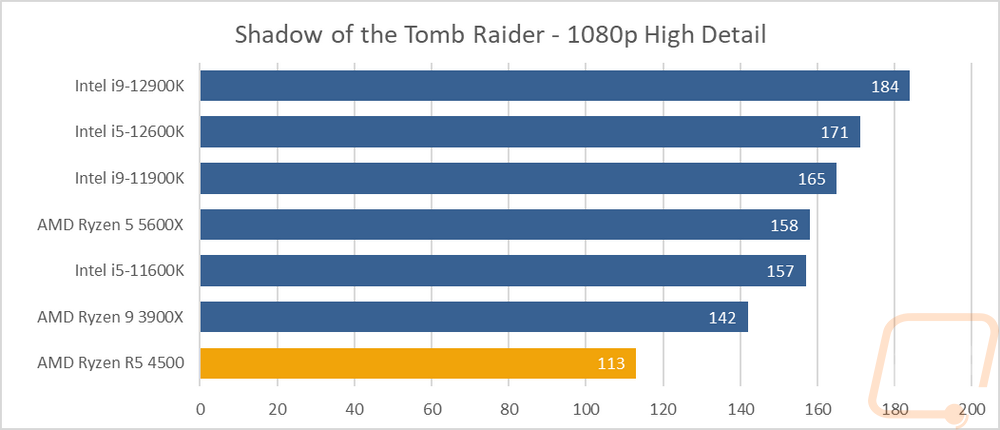
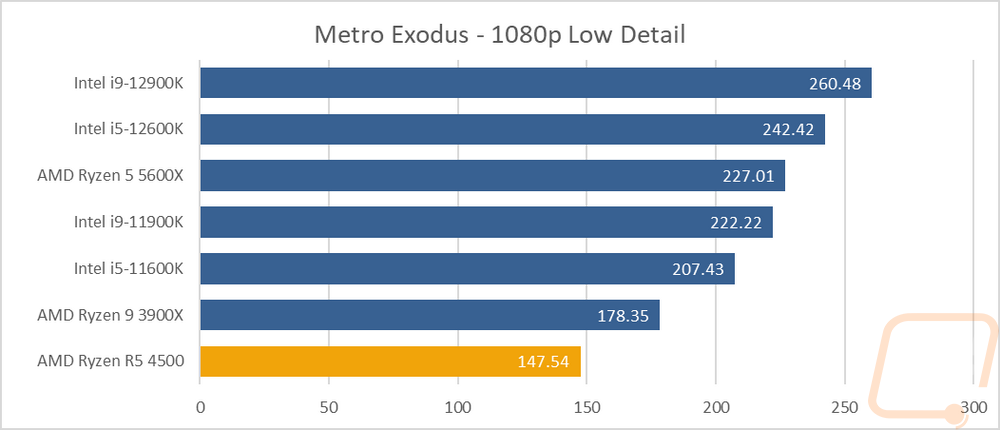
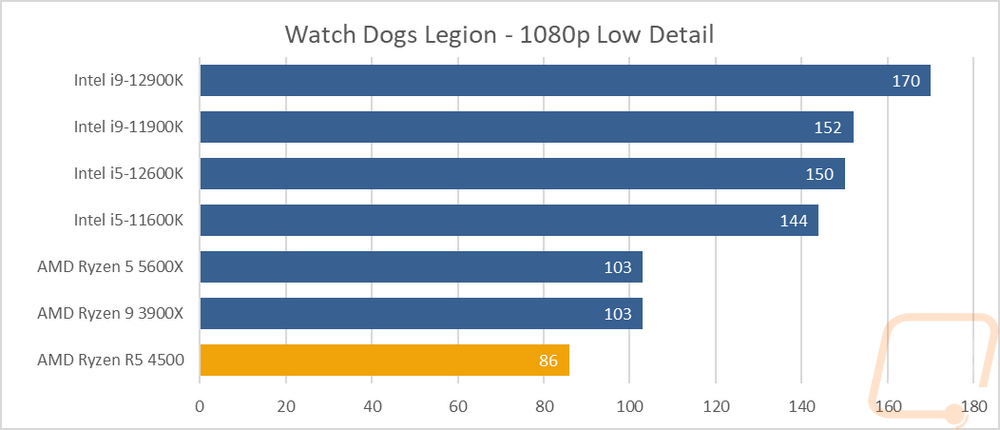
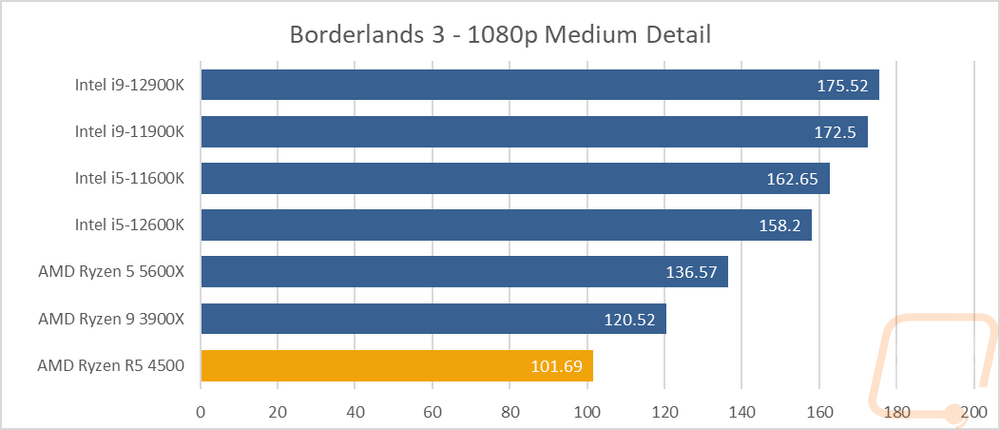
For in-game performance testing, I ran them through a variety of new and old games. TF2 for example is a very old game at this point but is also extremely CPU dependent which makes it a good option to check out for older source-based games. The Ryzen 5 4500 came in at 123 FPS putting it right in with some of the older Ryzen CPUs before the Zen 3 improvements in gaming performance. For the rest of the games tested I had a mix of a few year old games and newer games at a few different detail levels. The 4500 does struggle when compared to the high-end CPUs it is shown against. Overall it is a good representation of the improvement in performance from Zen 2 to Zen 3. You will be able to game on it perfectly fine, but there will be a notable improvement if you upgrade later on from the 4500.
I did also run both CPUs through a few tests using AIDA64, specifically, I wanted to check out cache performance, memory performance, and how the CPUs handle single and double precision and different integers. The 4500 did well, especially with its cache performance but looking at the memory latency when compared to the 5600X is a great example of the Zen 2 to Zen 3 improvements that helped a lot with that gaming performance.
|
AIDA64 |
L1 Cache Read |
L1 Cache Write |
L1 Cache Latency |
L2 Cache Read |
L2 Cache Write |
L2 Cache Latency |
|
AMD Ryzen R7 2700X |
999.43 GB/s |
502.50 GB/s |
1.0 ns |
978.03 GB/s |
495.12 GB/s |
2.8 ns |
|
AMD Ryzen R5 2600X |
768.13 GB/s |
388.05 GB/s |
1.0 ns |
729.37 GB/s |
366.01 GB/s |
2.9 ns |
|
Ryzen 5 2400G |
485.01 GB/s |
238.29 GB/s |
1.0 ns |
459.80 GB/s |
232.20 GB/s |
3.1 ns |
|
Ryzen 3 2200G |
460.55 GB/s |
227.41 GB/s |
1.1 ns |
352.84 GB/s |
177.56 GB/s |
3.3 ns |
|
Intel i7-8700K |
1595.6 GB/s |
803.65 GB/s |
0.9 ns |
640.37 GB/s |
397.14 GB/s |
2.6 ns |
|
Intel i5-8400 |
1417.2 GB/s |
710.79 GB/s |
1.0 ns |
543.81 GB/s |
352.90 GB/s |
3.1 ns |
|
Intel Core i9-7980XE |
3758.3 GB/s |
1896.7 GB/s |
1.1 ns |
1671.7 GB/s |
1069.9 GB/s |
5.6 ns |
|
Intel Core i9-7960X |
3532.3 GB/s |
1785.2 GB/s |
1.0 ns |
1571.6 GB/s |
1003.5 GB/s |
5.1 ns |
|
Intel Core i7-7820X |
1969.9 GB/s |
995.02 GB/s |
1.0 ns |
884.63 GB/s |
574.74 GB/s |
5.6 ns |
|
Intel Core i5-7640X |
1044.8 GB/s |
31888 GB/s |
1.0 ns |
397.26 GB/s |
247.00 GB/s |
2.9 ns |
|
Intel Core i9-7900X |
2418.5 GB/s |
709.16 GB/s |
1.0 ns |
1037.3 GB/s |
521.94 GB/s |
5.2 ns |
|
Intel Core i7-7740X |
1102.7 GB/s |
561.25 GB/s |
0.9 ns |
424.55 GB/s |
304.30 GB/s |
2.7 ns |
|
Intel i7-6900K |
1963.9 GB/s |
999.59 GB/s |
1.0 ns |
710.28 GB/s |
310.34 GB/s |
4.1 ns |
|
Intel i7-7700K |
1114.6 GB/s |
560.82 GB/s |
0.9 ns |
415.45 GB/s |
285.97 GB/s |
2.7 ns |
|
Intel i7-5960X |
1748.5 GB/s |
874.60 GB/s |
1.2 ns |
623.08 GB/s |
272.77 GB/s |
3.5 ns |
|
AMD Ryzen R7 1800X |
917.46 GB/s |
460.16 GB/s |
1.1 ns |
831.95 GB/s |
446.37 GB/s |
4.7 ns |
|
AMD Ryzen R7 1700X |
867.89 GB/s |
435.33 GB/s |
1.2 ns |
809.29 GB/s |
419.38 GB/s |
5.0 ns |
|
AMD Ryzen R7 1700 |
793.90 GB/s |
398.12 GB/s |
1.3 ns |
742.92 GB/s |
389.73 GB/s |
5.4 ns |
|
AMD Ryzen R5 1600X |
689.47 GB/s |
345.95 GB/s |
1.1 ns |
630.99 GB/s |
334.93 GB/s |
4.7 ns |
|
AMD Ryzen R5 1500X |
446.84 GB/s |
224.01 GB/s |
1.1 ns |
306.82 GB/s |
211.58 GB/s |
11.8 ns |
|
AMD Ryzen R5 2600 |
685.38 GB/s |
344.05 GB/s |
1 ns |
669.28 GB/s |
333.5 GB/s |
3.1 ns |
|
AMD Ryzen R7 2700X |
849.91 GB/s |
426.09 GB/s |
1 ns |
837.76 GB/s |
418.75 GB/s |
3.0 ns |
|
Intel i7-8086K |
1596.4 GB/s |
803.56 GB/s |
0.9 ns |
623.36 GB/s |
423.53 GB/s |
2.6 ns |
|
Intel i9-9900K |
2375.6 GB/s |
1195.4 GB/s |
0.8 ns |
907.65 GB/s |
626.34 GB/s |
2.4 ns |
|
AMD Ryzen 9 3900X |
3098.6 GB/s |
1551.4 GB/s |
0.9 ns |
1545.3 GB/s |
1416.8 GB/s |
2.8 ns |
|
AMD Ryzen 7 3700X |
2133.2 GB/s |
1072.9 GB/s |
0.9 ns |
1069.1 GB/s |
993.49 GB/s |
2.8 ns |
|
AMD Ryzen 5 3600X |
1547.4 GB/s |
779.24 GB/s |
1.0 ns |
777.62 GB/s |
745.30 GB/s |
2.8 ns |
|
AMD Ryzen 3 3400G |
508.97 GB/s |
253.87 GB/s |
1.0 ns |
490.26 GB/s |
247.04 GB/s |
3.0 ns |
|
AMD Ryzen 3 3300X |
1080.5 GB/s |
541.50 GB/s |
0.9 ns |
541.84 GB/s |
530.50 GB/s |
2.7 ns |
|
AMD Ryzen 3 3100 |
965.85 GB/s |
484.67 GB/s |
1.0 ns |
485.55 GB/s |
460.71 GB/s |
3.1 ns |
|
Intel i5-10600K |
1676.6 GB/s |
840.87 GB/s |
0.8 ns |
662.98 GB/s |
452.67 GB/s |
2.5 ns |
|
Intel i9-10900K |
3162.1 GB/s |
1586.7 GB/s |
0.8 ns |
1201.8 GB/s |
759.97 GB/s |
2.4 ns |
|
AMD Ryzen 5 5600X |
1721.4 GB/s |
869.69 GB/s |
0.9 ns |
851.89 GB/s |
831.97 GB/s |
2.6 ns |
|
Intel i9-11900K |
4542.8 GB/s |
2299.3 GB/s |
1.0 ns |
1413.2 GB/s |
691.62 GB/s |
2.5 ns |
|
Intel i5-11600K |
3412.3 GB/s |
1724.9 GB/s |
1.0 ns |
960.91 GB/s |
526.76 GB/s |
2.7 ns |
|
Intel i9-12900K |
2310.0 GB/s |
1438.7 GB/s |
1.0 ns |
1233.5 GB/s |
562.72 GB/s |
2.9 ns |
|
Intel i5-12600K |
1461.1 GB/s |
971.78 GB/s |
1.1 ns |
846.4 GB/s |
360.51 GB/s |
3.2 ns |
|
AMD Ryzen R5 4500 |
1561.9 GB/s |
784.1 GB/s |
1.0 ns |
785.34 GB/s |
751.61 GB/s |
2.9 ns |
|
AIDA64 |
L3 Cache Read |
L3 Cache Write |
L3 Cache Latency |
Memory Read |
Memory Write |
Memory Latency |
|
AMD Ryzen R7 2700X |
414.95 GB/s |
417.71 GB/s |
8.8 ns |
50214 MB/s |
48578 MB/s |
65.0 ns |
|
AMD Ryzen R5 2600X |
429.09 GB/s |
323.83 GB/s |
9.1 ns |
50273 MB/s |
48346 MB/s |
65.5 ns |
|
Ryzen 5 2400G |
222.96 GB/s |
181.60 GB/s |
9.6 ns |
45967 MB/s |
47850 MB/s |
66.6 ns |
|
Ryzen 3 2200G |
137.30 GB/s |
171.20 GB/s |
10.2 ns |
35567 MB/s |
36240 MB/s |
118.4 ns |
|
Intel i7-8700K |
337.00 GB/s |
213.67 GB/s |
11.0 ns |
38421 MB/s |
40175 MB/s |
57.9 ns |
|
Intel i5-8400 |
270.89 GB/s |
186.82 GB/s |
13.0 ns |
38096 MB/s |
40549 MB/s |
59.8 ns |
|
Intel Core i9-7980XE |
229.61 GB/s |
118.40 GB/s |
21.0 ns |
77004 MB/s |
68888 MB/s |
73.4 ns |
|
Intel Core i9-7960X |
220.22 GB/s |
121.04 GB/s |
19.8 ns |
79416 MB/s |
71554 MB/s |
74.9 ns |
|
Intel Core i7-7820X |
114.40 GB/s |
103.57 GB/s |
19.2 ns |
76049 MB/s |
73759 MB/s |
71.6 ns |
|
Intel Core i5-7640X |
228.31 GB/s |
163.86 GB/s |
11.1 ns |
30786 MB/s |
31888 MB/s |
68.5 ns |
|
Intel Core i9-7900X |
124.16 GB/s |
106.78 GB/s |
21.2 ns |
76856 MB/s |
72856 MB/s |
72.8 ns |
|
Intel Core i7-7740X |
287.01 GB/s |
186.67 GB/s |
21.2 ns |
38455 MB/s |
40596 MB/s |
53.2 ns |
|
Intel i7-6900K |
243.96 GB/s |
195.41 GB/s |
14.6 ns |
66786 MB/s |
68130 MB/s |
61.9 ns |
|
Intel i7-7700K |
234.50 GB/s |
188.70 GB/s |
10.4 ns |
38498 MB/s |
40448 MB/s |
52.7 ns |
|
Intel i7-5960X |
260.72 GB/s |
184.92 GB/s |
15.3 ns |
66108 MB/s |
49545 MB/s |
62.8 ns |
|
AMD Ryzen R7 1800X |
388.18 GB/s |
386.01 GB/s |
12.4 ns |
44031 MB/s |
43425 MB/s |
81.8 ns |
|
AMD Ryzen R7 1700X |
369.75 GB/s |
350.31 GB/s |
12.9 ns |
44493 MB/s |
43749 MB/s |
78.3 ns |
|
AMD Ryzen R7 1700 |
334.36 GB/s |
332.12 GB/s |
14.2 ns |
45343 MB/s |
43777 MB/s |
82.6 ns |
|
AMD Ryzen R5 1600X |
386.48 GB/s |
326.86 GB/s |
12.3 ns |
44452 MB/s |
43918 MB/s |
83.7 ns |
|
AMD Ryzen R5 1500X |
306.82 GB/s |
211.58 GB/s |
11.8 ns |
44289 MB/s |
43746 MB/s |
83.1 ns |
|
AMD Ryzen R5 2600 |
381.16 GB/s |
320.56 GB/s |
9.8 ns |
50385 MB/s |
48499 MB/s |
66.5 ns |
|
AMD Ryzen R7 2700 |
357.51 GB/s |
356.71 GB/s |
9.4 ns |
50088 MB/s |
48343 MB/s |
65.9 ns |
|
Intel i7-8086K |
380.04 GB/s |
243.73 GB/s |
10.9 ns |
39069 MB/s |
40675 MB/s |
56.2 ns |
|
Intel i9-9900K |
302.01 GB/s |
221.1 GB/s |
11.0 ns |
39682 MB/s |
41015 MB/s |
51.1 ns |
|
AMD Ryzen 9 3900X |
1014.4 GB/s |
836.39 GB/s |
11.5 ns |
53981 MB/s |
52271 MB/s |
70.7 ns |
|
AMD Ryzen 7 3700X |
611.53 GB/s |
573.21 GB/s |
10.2 ns |
51498 MB/s |
28739 MB/s |
67.3 ns |
|
AMD Ryzen 5 3600X |
584.93 GB/s |
538.45 GB/s |
10.4 ns |
50769 MB/s |
28736 MB/s |
68.9 ns |
|
AMD Ryzen 3 3400G |
233.57 GB/s |
193.62 GB/s |
9.3 ns |
49936 MB/s |
53502 MB/s |
67.1 ns |
|
AMD Ryzen 3 3300X |
322.13 GB/s |
321.33 GB/s |
11.1 ns |
51435 MB/s |
28743 MB/s |
66.4 ns |
|
AMD Ryzen 3 3100 |
374.11 GB/s |
343.53 GB/s |
11.8 ns |
50246 MB/s |
28734 MB/s |
71.1 ns |
|
Intel i5-10600K |
361.35 GB/s |
238.47 GB/s |
10.5 ns |
43340 MB/s |
43430 MB/s |
48.2 ns |
|
Intel i9-10900K |
407.66 GB/s |
245.94 GB/s |
11.4 ns |
44972 MB/s |
43808 MB/s |
50.5 ns |
|
AMD Ryzen 5 5600X |
276.24 GB/s |
298.84 GB/s |
11.0 ns |
50972 MB/s |
28772 MB/s |
59.2 ns |
|
Intel i9-11900K |
330.32 GB/s |
213.28 GB/s |
11.4 ns |
44919 MB/s |
43343 MB/s |
51.8 ns |
|
Intel i5-11600K |
319.10 GB/s |
198.57 GB/s |
11.4 ns |
43953 MB/s |
43468 MB/s |
55.6 ns |
|
Intel i9-12900K |
678.84 GB/s |
418.11 GB/s |
19.8 ns |
71418 MB/s |
72395 MB/s |
82.0 ns |
|
Intel i5-12600K |
598.86 GB/s |
292.09 GB/s |
21.4 ns |
65416 MB/s |
71336 MB/s |
87.8 ns |
|
AMD Ryzen R5 4500 |
350.05 GB/s |
571.19 GB/s |
10.5 ns |
52683 MB/s |
53191 MB/s |
82.8 ns |
|
AIDA64 |
Single-Precision FLOPS |
Double Precision FLOPS |
AES-256 |
24-bit Integer IOPS |
32-bit Integer IOPS |
64-bit Integer IOPS |
|
AMD Ryzen R7 2700X |
507.9 GFLOPS |
253.9 GFLOPS |
70514 MB/s |
127.7 GIOPS |
127.7 GIOPS |
64.22 GIOPS |
|
AMD Ryzen R5 2600X |
383.2 GFLOPS |
191.4 GFLOPS |
51932 MB/s |
95.82 GIOPS |
95.82 GIOPS |
48.15 GIOPS |
|
Ryzen 5 2400G |
235.9 GFLOPS |
117.8 GFLOPS |
32388 MB/s |
58.94 GIOPS |
58.98 GIOPS |
29.67 GIOPS |
|
Ryzen 3 2200G |
225.8 GFLOPS |
112.6 GFLOPS |
27603 MB/s |
56.32 GIOPS |
56.32 GIOPS |
28.30 GIOPS |
|
Intel i7-8700K |
825.0 GFLOPS |
412.5 GFLOPS |
29406 MB/s |
370.0 GIOPS |
370.0 GIOPS |
51.55 GIOPS |
|
Intel i5-8400 |
728.8 GFLOPS |
364.5 GFLOPS |
25192 MB/s |
323.5 GIOPS |
323.5 GIOPS |
45.55 GIOPS |
|
Intel Core i9-7980XE |
1831 GFLOPS |
915.5 GFLOPS |
69377 MB/s |
821.2 GIOPS |
821.3 GIOPS |
121.6 GIOPS |
|
Intel Core i9-7960X |
1681 GFLOPS |
840.6 GFLOPS |
65409 MB/s |
754.0 GIOPS |
753.9 GIOPS |
114.7 GIOPS |
|
Intel Core i7-7820X |
944.9 GFLOPS |
472.5 GFLOPS |
36420 MB/s |
423.7 GIOPS |
423.7 GIOPS |
63.85 GIOPS |
|
Intel Core i5-7640X |
536.5 GFLOPS |
268.2 GFLOPS |
18547 MB/s |
238.1 GIOPS |
138.1 GIOPS |
33.53 GIOPS |
|
Intel Core i9-7900X |
1148 GFLOPS |
574.5 GFLOPS |
45506 MB/s |
515.1 GIOPS |
515.0 GIOPS |
79.76 GIOPS |
|
Intel Core i7-7740X |
575.4 GFLOPS |
287.8 GFLOPS |
20503 MB/s |
258.1 GIOPS |
258.0 GIOPS |
35.97 GIOPS |
|
Intel i7-6900K |
1023 GFLOPS |
511.7 GFLOPS |
36340 MB/s |
255.9 GIOPS |
255.9 GIOPS |
63.96 GIOPS |
|
Intel i7-7700K |
575.7 GFLOPS |
287.9 GFLOPS |
20519 MB/s |
258.0 GIOPS |
258.0 GIOPS |
35.98 GIOPS |
|
Intel i7-5960X |
895.5 GFLOPS |
447.7 GFLOPS |
31783 MB/s |
223.9 GIOPS |
223.9 GIOPS |
55.97 GIOPS |
|
AMD Ryzen R7 1800X |
472.4 GFLOPS |
236.2 GFLOPS |
64016 MB/s |
118.1 GIOPS |
118.1 GIOPS |
59.03 GIOPS |
|
AMD Ryzen R7 1700X |
446.8 GFLOPS |
223.4 GFLOPS |
61730 MB/s |
111.7 GIOPS |
111.7 GIOPS |
55.84 GIOPS |
|
AMD Ryzen R7 1700 |
408.5 GFLOPS |
204.3 GFLOPS |
56811 MB/s |
102.1 GIOPS |
102.1 GIOPS |
51.05 GIOPS |
|
AMD Ryzen R5 1600X |
354.9 GFLOPS |
177.5 GFLOPS |
49340 MB/s |
88.74 GIOPS |
88.73 GIOPS |
44.34 GIOPS |
|
AMD Ryzen R5 1500X |
229.8 GFLOPS |
114.8 GFLOPS |
31983 MB/s |
57.43 GIOPS |
57.45 GIOPS |
28.72 GIOPS |
|
AMD Ryzen R5 2600 |
351 GFLOPS |
175.4 GFLOPS |
48939 MB/s |
88.03 GIOPS |
88.02 GIOPS |
44.01 GIOPS |
|
AMD Ryzen R7 2700 |
434.3 GFLOPS |
217.2 GFLOPS |
60336 MB/s |
108.6 GIOPS |
108.6 GIOPS |
54.68 GIOPS |
|
Intel i7-8086K |
824.9 GFLOPS |
412.5 GFLOPS |
29397 MB/s |
369.9 GIOPS |
369.9 GIOPS |
51.55 GIOPS |
|
Intel i9-9900K |
1226 GFLOPS |
613.0 GFLOPS |
45542 MB/s |
550.0 GIOPS |
549.8 GIOPS |
79.79 GIOPS |
|
AMD Ryzen 9 3900X |
1546 GFLOPS |
772.1 GFLOPS |
106943 MB/s |
385.7 GIOPS |
385.7 GIOPS |
96.57 GIOPS |
|
AMD Ryzen 7 3700X |
1078 GFLOPS |
537.8 GFLOPS |
74474 MB/s |
271.0 GIOPS |
271.2 GIOPS |
67.77 GIOPS |
|
AMD Ryzen 5 3600X |
799.5 GFLOPS |
400.0 GFLOPS |
55456 MB/s |
198.6 GIOPS |
198.6 GIOPS |
49.64 GIOPS |
|
AMD Ryzen 3 3400G |
257.2 GFLOPS |
128.5 GFLOPS |
35736 MB/s |
64.16 GIOPS |
64.16 GIOPS |
32.25 GIOPS |
|
AMD Ryzen 3 3300X |
551.6 GFLOPS |
276.1 GFLOPS |
38176 MB/s |
138.7 GIOPS |
138.7 GIOPS |
34.65 GIOPS |
|
AMD Ryzen 3 3100 |
497.6 GFLOPS |
248.7 GFLOPS |
34946 MB/s |
124.4 GIOPS |
124.4 GIOPS |
31.09 GIOPS |
|
Intel i5-10600K |
863.8 GFLOPS |
431.9 GFLOPS |
30782 MB/s |
387.2 GIOPS |
386.9 GIOPS |
53.99 GIOPS |
|
Intel i9-10900K |
1632 GFLOPS |
815.7 GFLOPS |
58163 MB/s |
731.3 GIOPS |
731.2 GIOPS |
102.0 GIOPS |
|
AMD Ryzen 5 5600X |
891.9 GFLOPS |
445.8 GFLOPS |
61623 MB/s |
709.6 GIOPS |
709.7 GIOPS |
55.72 GIOPS |
|
Intel i9-11900K |
1068 GFLOPS |
534.2 GFLOPS |
164966 MB/s |
547.0 GIOPS |
547.0 GIOPS |
182.7 GIOPS |
|
Intel i5-11600K |
838.7 GFLOPS |
419.4 GFLOPS |
123767 MB/s |
429.3 GIOPS |
429.3 GIOPS |
143.4 GIOPS |
|
Intel i9-12900K |
695.7 GFLOPS |
247.9 GFLOPS |
140499 MB/s |
400.6 GIOPS |
400.6 GIOPS |
166.2 GIOPS |
|
Intel i5-12600K |
432.5 GFLOPS |
216.2 GFLOPS |
86470 MB/s |
252.7 GIOPS |
252.7 GIOPS |
96.22 GIOPS |
|
AMD Ryzen R5 4500 |
806 GFLOPS |
402.6 GFLOPS |
56578 MB/s |
201.5 GIOPS |
201.3 GIOPS |
50.35 GIOPS |
