Performance
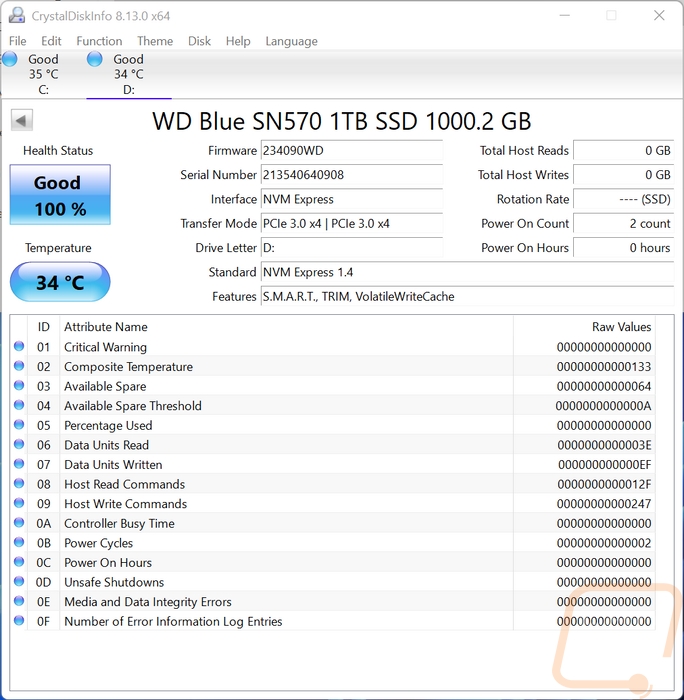
Before getting into performance testing I did run the WB Blue SN570 in CrystalDiskInfo. I do this to double check that I am connected at the correct speeds which in this case is PCIe Gen 3 x4. I also like to document the firmware version of our drive when testing in case it is needed in the future. Beyond that, it is using the standard NVMe driver and everything was good to go.
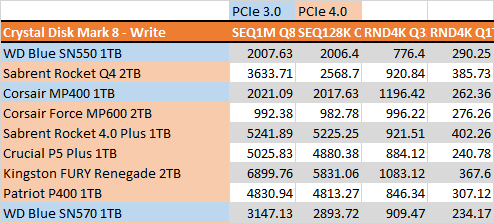
So to start off testing I jumped right in with CrystalDiskMark to check out the sequential performance. These are the numbers that most people worry about when it comes to the top speeds of the drive and what they use for advertising. WD specifications have the SN570 listed with a read speed of 3500 MB/s unless it is the 250GB drive which is 3300 MB/s. Then for write speed, it scales up more with the 2TB drive at 3500 MB/s the 1TB (which I am testing) at 3000 MB/s, the 500GB at 2300 MB/s, and the 250 at just 1200 MB/s. So we are targeting 3500 MB/s read and 3000 MB/s write speeds for this drive. The SN570 outperformed the specifications at 3569 for its sequential read speeds and was even higher than the spec on the write speed at 3147. I also have these numbers color sorted by the interface with blue for PCIe 3.0 drives and orange for PCIe 4.0 drives. The SN570 did much better than its predecessor jumping over 1000 MB/s on both read and writes
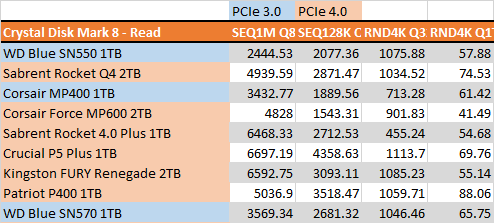
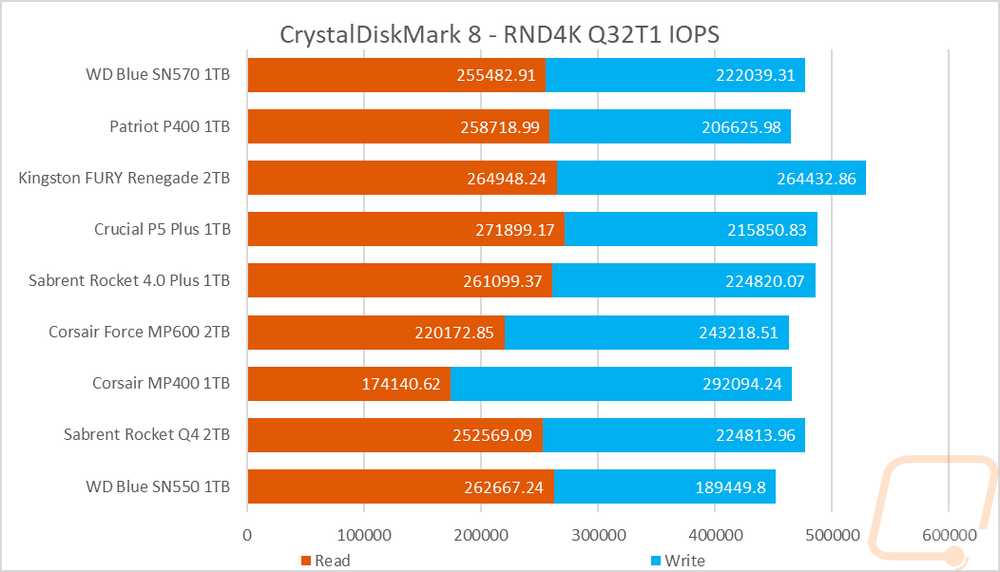
While doing CrystalDiskMark I did also note the IOPS on the random 4K with a queue depth of 32 and 1 thread. For these I stacked the results together we can get an overall look at drive performance. Remember how many of the drives tested were PCIe 4.0 drives? Well, there isn’t as big of a difference between those and the SN570 it was faster than some of those drives. The SN570 was a little lower than the SN550 on the read IOPS but higher by a good amount on the write IOPS which made up the difference.
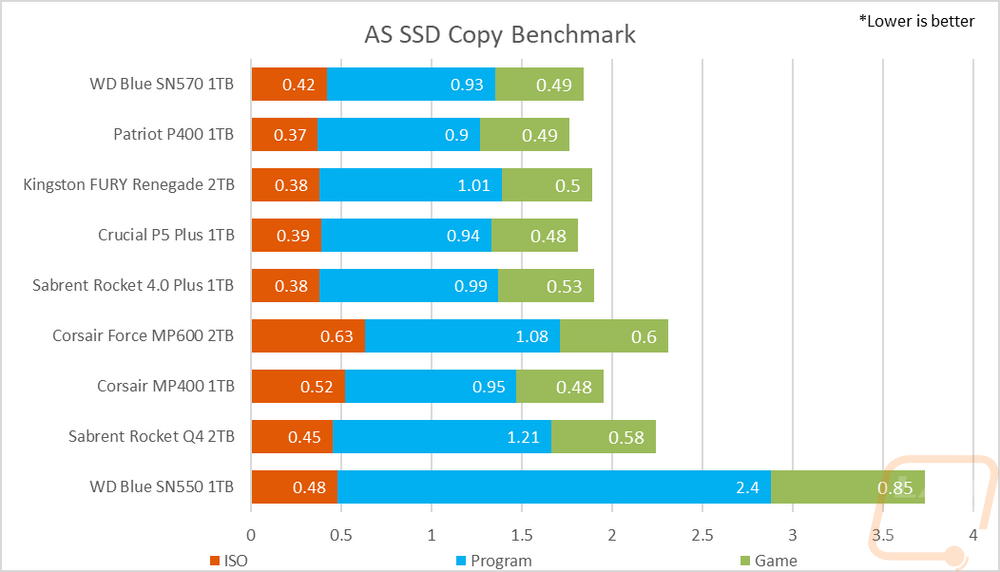
Next up I took a look at file copy performance using AS SSD. This test times the transfers of three different file types so lower is better here. The SN570 was significantly better than the older SN550 here, especially with the program files. It even outperformed the FURY Renegade PCIe 4.0 drive.
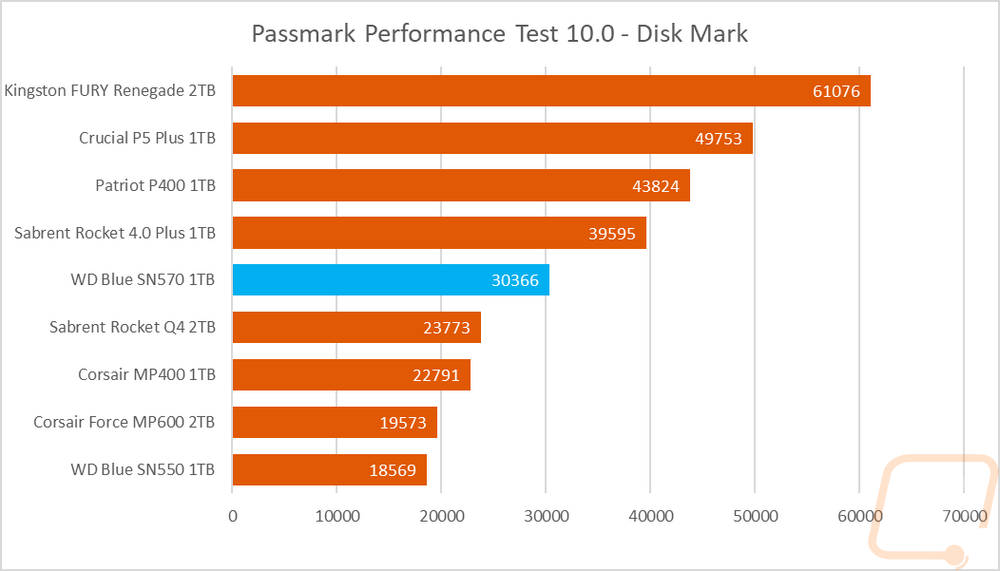
Next up with PassMark Performance Test 10 I ran their combined synthetic benchmark to get a look at their DiskMark rating. The SN570 came in the middle of the pack which is a lot better than I expected any PCIe 3.0 drive to do considering the competition. This was 12000 points higher than the older SN550!
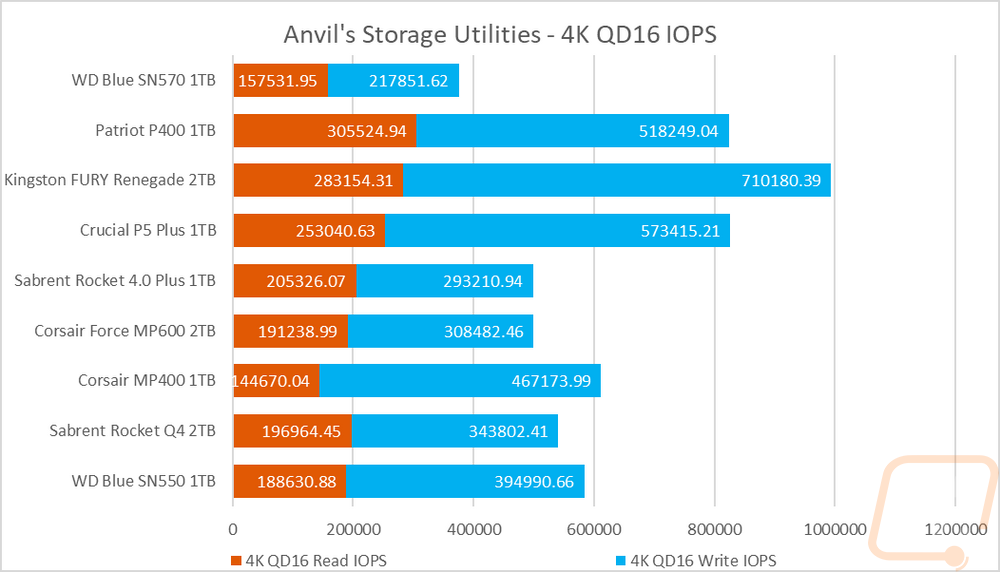
Next up I have another look at IOPS, this time though it is when testing with Anvil’s Storage Utilities. This time at 4k with a lower queue depth of 16. Here the SN570 struggled on both read and writes and came in well below even the SN550.
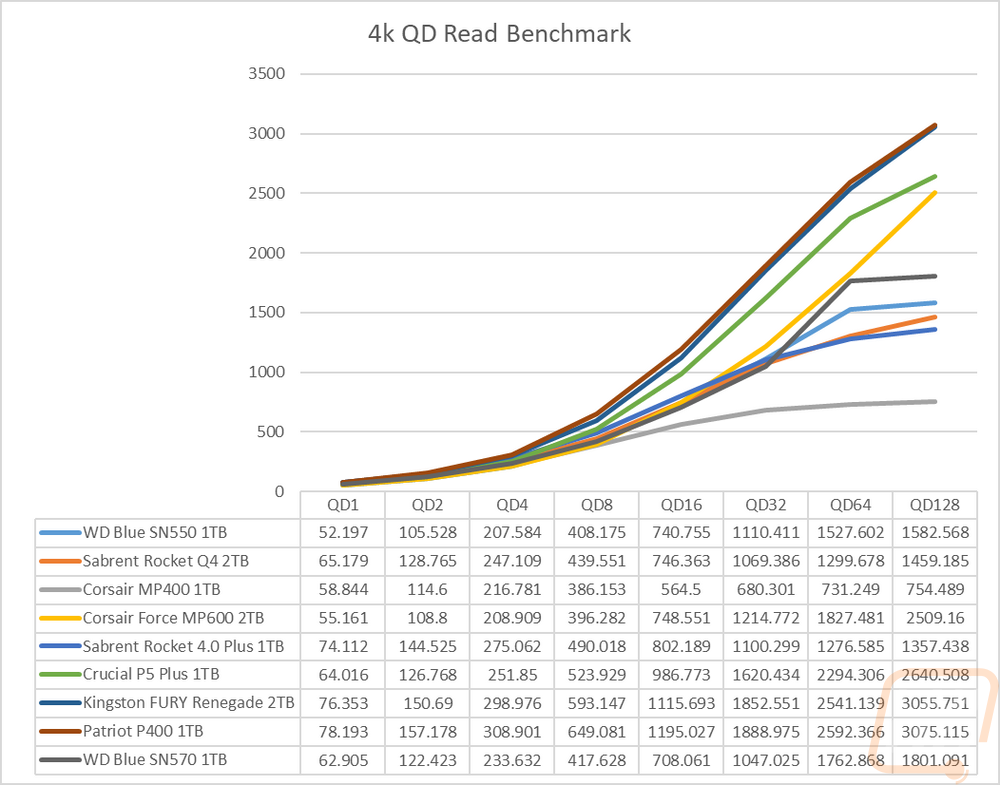
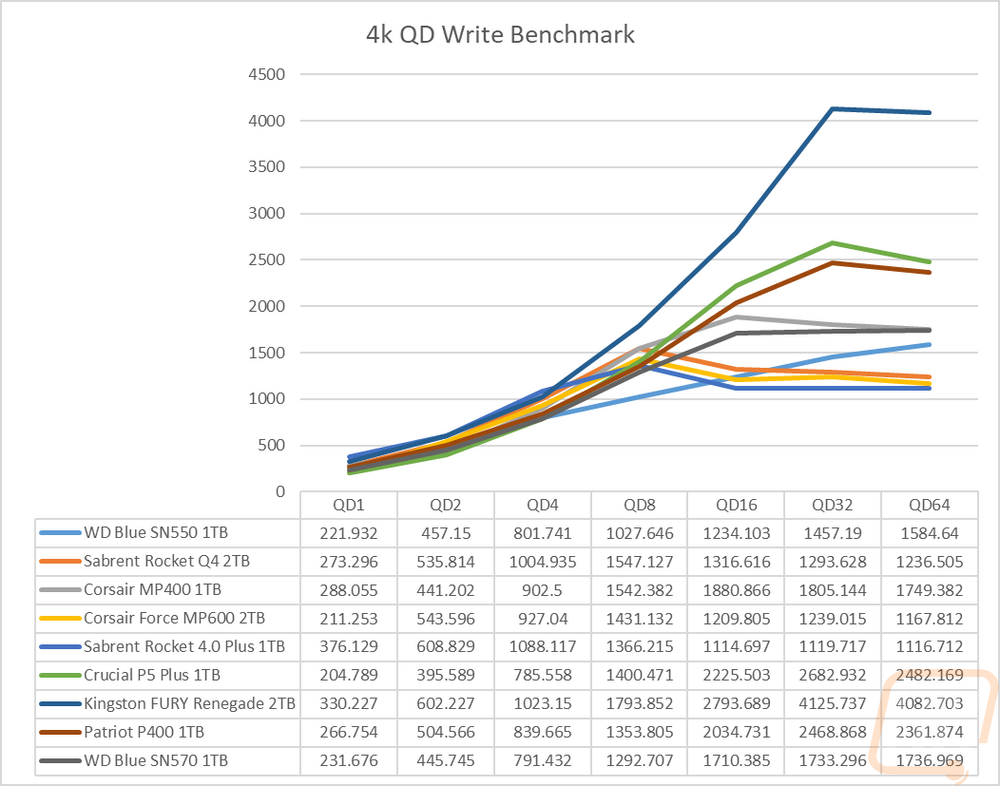
Sticking with Anvil’s Storage Utilities I did a few more tests. Here I wanted to check out how the drive would react to different queue depths so with the file size set to 4K I ran tests ramping up double each time starting at 1 and up to 128 for reads and 64 for writes. This lets us see if the controller gets overloaded. For the read queue depth tests the SN570 ran right with the medium range PCIe 4.0 drives all the way up until a queue depth of 64 where it was right with the MP600 but at that point, it leveled off and only had a small improvement for the last 128 queue depth test. This was still up over the SN550, Rocket Q4, Rocker 4.0 Plus, and the MP400. For the write test, the WD Blue SN570 was faster than the other 30. Drives down low as well as the P5 Plus, but it did fall behind a little in the 2-4 queue depth range, then catching up to all but the top drives at a queue depth of 16 then it levels off. The top PCIe 4.0 drives like the FURY are at over twice the speed on those high queue depth situations but the SN570 was out ahead of the other PCIe 3.0 drives as well as the Rocket Q4.
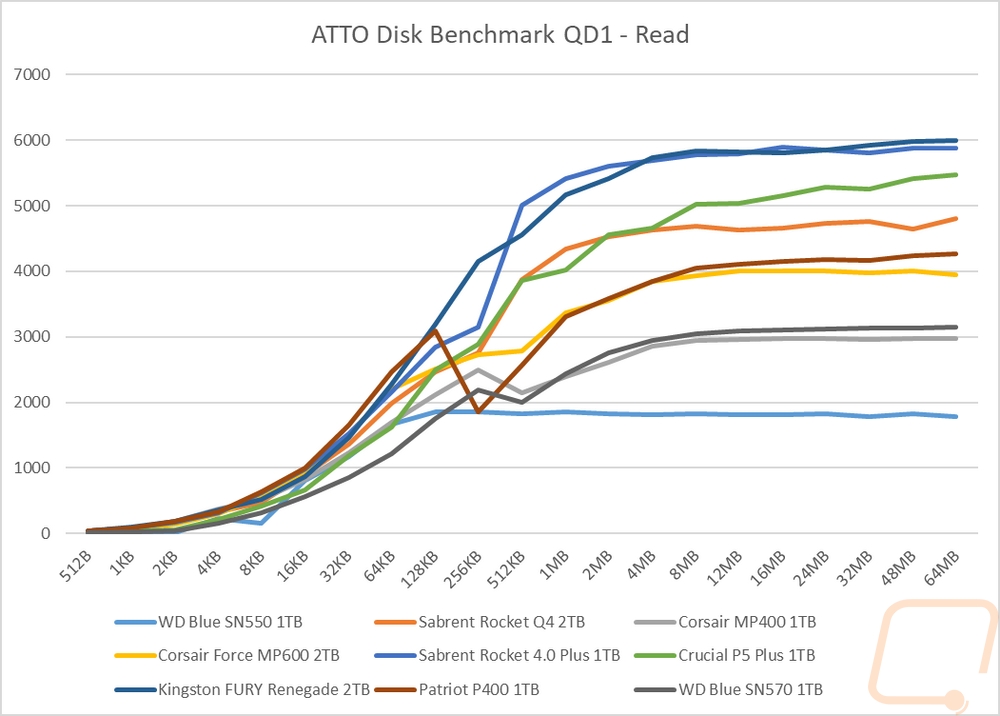
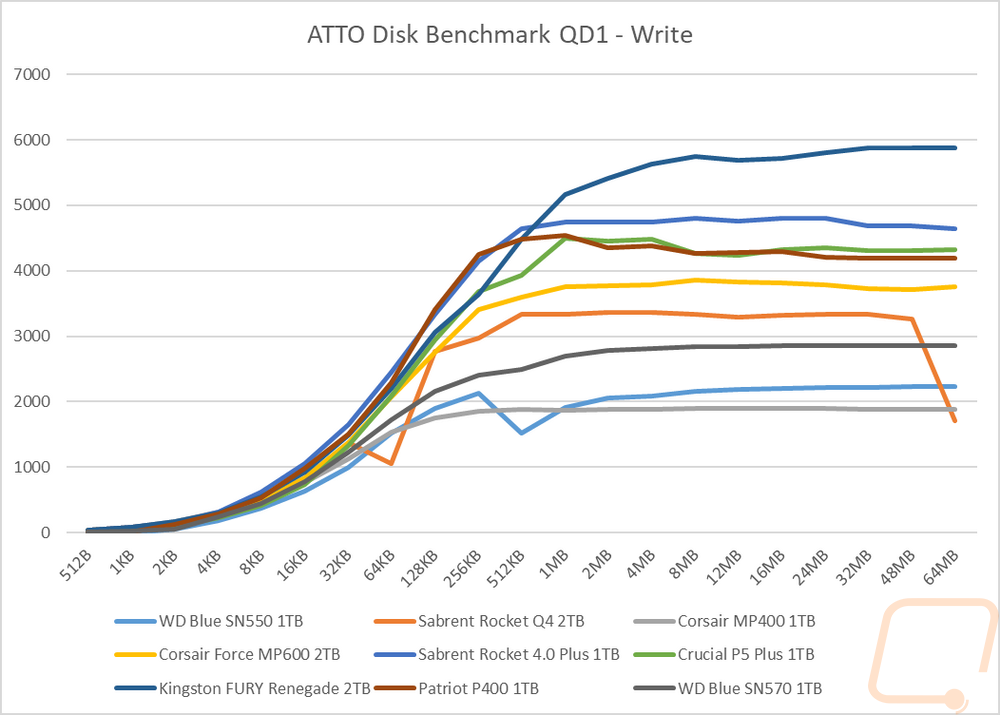
I used ATTO Benchmark set to a queue depth of just 1 but ramped up the file size slowly to see how it would affect performance. For the read test in ATTO, the SN570 struggled and was the slowest of the drives to ramp up as the file size went up. It did pass the SN550 at 128KB but then the SN570 dropped off for the 512KB test and then ramped back up and leveled off at 8MB and higher. The MP400 had a similar drop off at that same spot and performed similarly after that. For the write test, the SN570 performed better, ramping up faster than the other 3.0 drives and leveling off up close to the 3000 MB/s range from 4MB on where the older SN550 and the MP400 were both closer to the 2000 MB/s range.
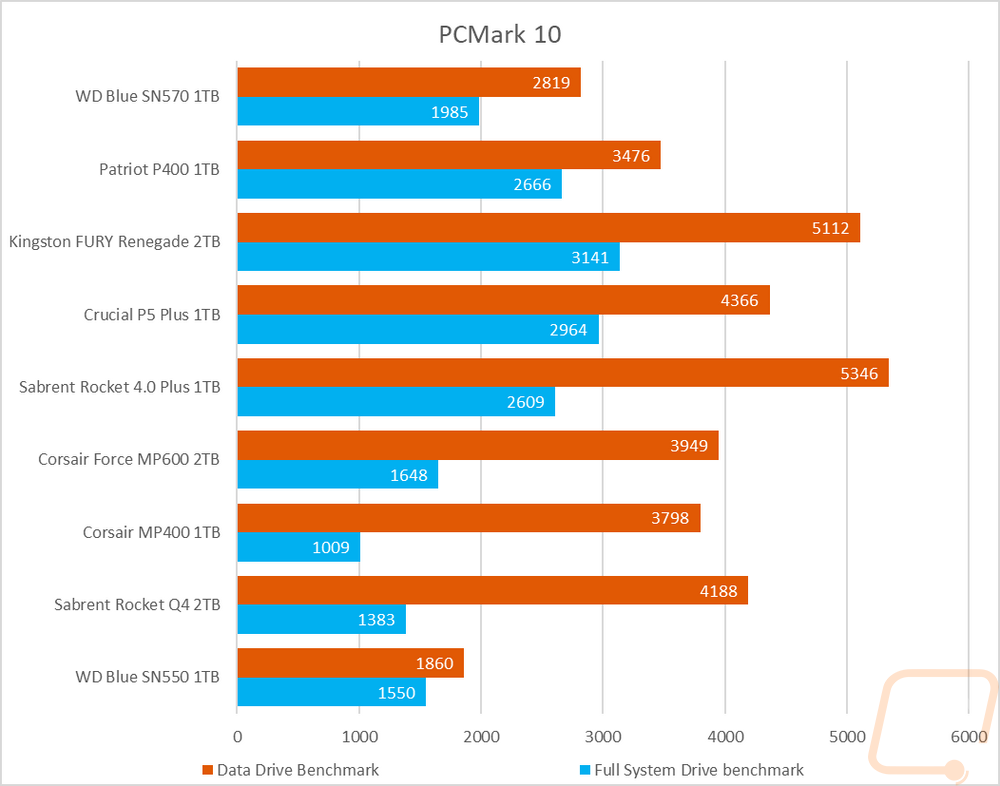
Next up I wanted to look at more real-world performance and for this, I started with PCMark 10 which has an overall full system benchmark for storage and then one focused on data storage drives. In the full system drive benchmark, the SN570 was in the middle of the pack outperforming the MP400, MP600, Rocket Q4, and the SN550 but is still well behind the high-end PCIe 4.0 drives as you would expect. The Data Drive Benchmark was similar as well with the same drives ahead and behind the SN570.
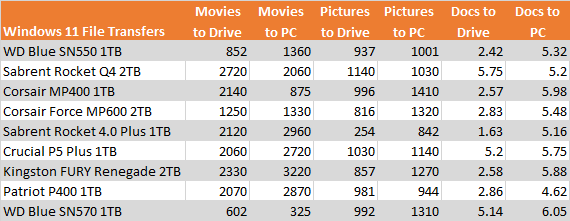
My favorite benchmark is always getting a look at real-world file transfers. These are done with Windows 11 and I focus on three file types to get a variety of sizes. I test with a folder filled with movies, another with a mix of RAW and JPG pictures, and a folder of word documents. The larger movie file sizes are closer to the sequential tests earlier in our testing and the documents are small files that take a lot longer. Then the photos sit in between. I was surprised that with the movies the SN570 struggled, the SN550 did as well but not as much. This is partially due to being a DRAMless drive, but even beyond that, the SN550 which is also DRAMless didn’t have as much trouble. For the picture file transfers, performance was better and faster than some of the PCIe 4.0 drives, especially when transferring them back to our PC. Same for the documents, the SN570 handled those well and was faster than the other drives tested.
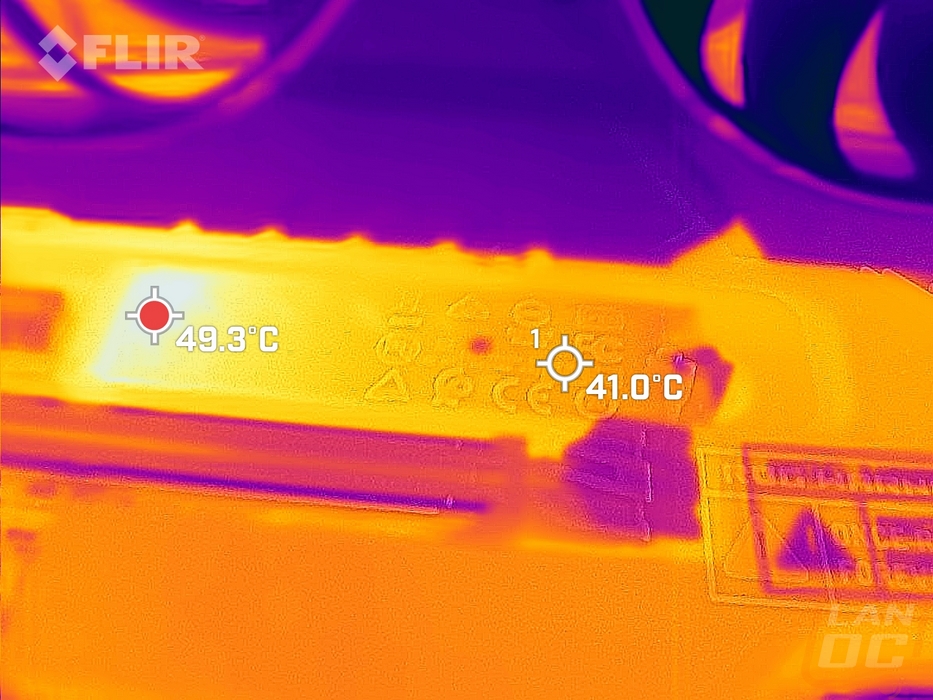
When I was finished up with testing I did also open up AIDA64 and use their linear read test for a half hour to heat the SN570 up and check out how it handled the thermals. Our new test bench runs the drive upside down so the thermal image is of the back of the drive. But we can see that having the NAND on the far end of the drive keeps that nice and cool. The controller is where all of the heat comes from is down at the other end but even that was only 9 degrees higher than the rest of the drive.